A Study of Temporal Variability of Atmospheric Total Gaseous Mercury Concentrations in Windsor,...
25
Xiaohong (Iris) Xu, Umme Akhtar, Kyle Clark, Xiaobin Wang University of Windsor, Windsor, Ontario Canada July 2014
-
Upload
susanna-watson -
Category
Documents
-
view
216 -
download
2
Transcript of A Study of Temporal Variability of Atmospheric Total Gaseous Mercury Concentrations in Windsor,...

Xiaohong (Iris) Xu, Umme Akhtar, Kyle Clark, Xiaobin Wang
University of Windsor, Windsor, Ontario Canada
July 2014

Outline
• Background
• Objectives
• Method
• Results
• Summary & future work
2

Air Quality in Windsor, Ontario, Canada
• Industrial sources:– Automotive capital of US & Canada – Other sectors: power generation
and chemical facilities
• Mobile sources: – Ambassador Bridge: busiest international
crossing in North America– 25% of goods by trade values – 10,000 heavy duty trucks/day– 4,000 cars/day
3

Objectives
• To investigate – temporal variability: diurnal, day-of-week,
seasonal, and inter-annual
– relationship between TGM and other pollutants
– relationship between TGM and weather conditions
– effect of variability in TGM and other parameters
– effect of “outliers”
4

Monitor Site & Instrumentation
• TGM University of Windsor
campus Near the entrance/exit of
the Ambassador Bridge Tekran 2537A
• Weather data: Windsor Airport (10 km)
• Other air pollutants: Windsor Downtown Air Quality Station (2 km)
• Study period: 2007-2011
Windsor
ONTARIONTARIOO
N
ON
U of W
5

Annual TGM
6
Three-year mean: 1.8 ng/m3
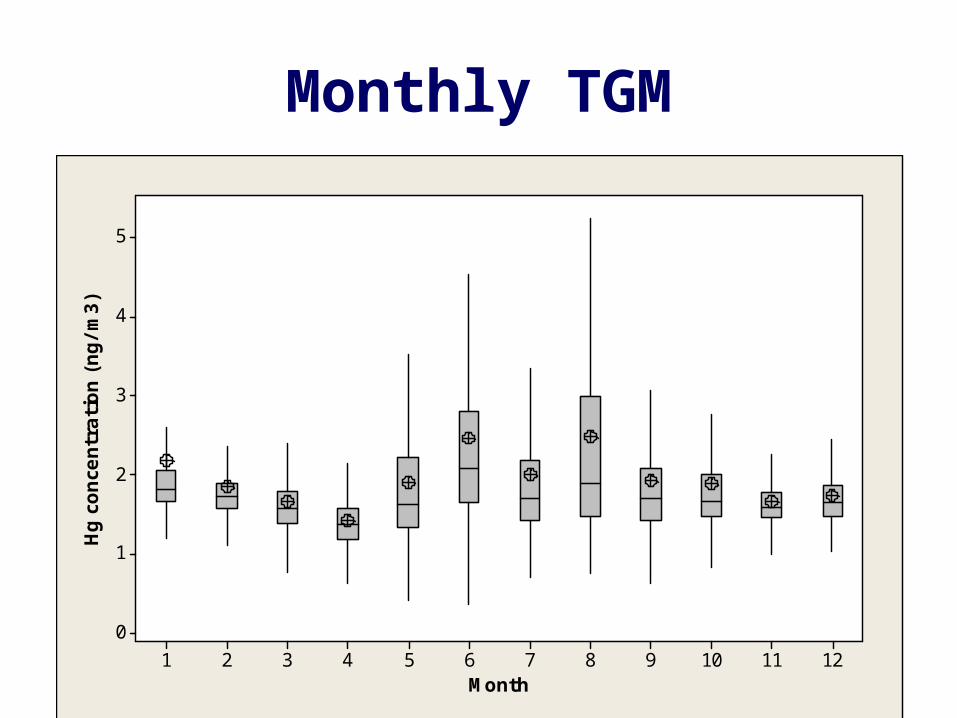
Monthly TGM
7121110987654321
5
4
3
2
1
0
Month
Hg c
once
ntr
ation (
ng/m
3)

Seasonal TGM
8fallsummerspringwinter
5
4
3
2
1
0
Hg c
once
ntr
ati
on (
ng/m
3)

Day-of-week TGM
9weekdaySundaySaturday
3.0
2.5
2.0
1.5
1.0
0.5
Hg c
once
ntr
ation (
ng/m
3)

Diurnal TGM
1023222120191817161514131211109876543210
2.3
2.2
2.1
2.0
1.9
1.8
1.7
1.6
Hg c
once
ntr
ati
on (
ng/m
3)
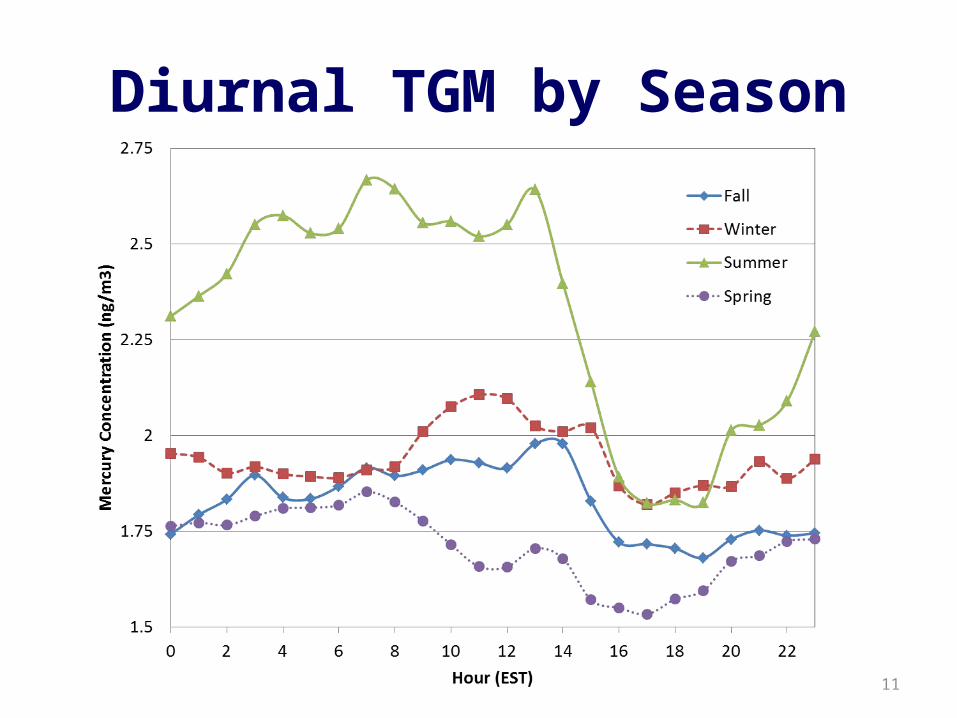
Diurnal TGM by Season
11

Temporal Variability – ANOVA
12
Parameter R2 (%)Season 2.65Year 0.96Hour-of-day 0.89Day-of-week 0.60All of above 5.4
GLM: 2007-2009 data & TGM as dependent variable

Relationship with Other Parameters
13
Parameter R2 (adj)NOx 2.1+temperature 3.0+O3 3.4
+pressure 3.7
Stepwise regression: TGM as dependent variable

Correlation with Other Parameters
14
Pearson: all significant at p < 0.05 except shaded cells
• +tv with NO, NO2, NOx, CO and PM2.5: common sources• −tv with O3: photo-chemistry• −tv with wind speed and pressure: dispersion and mixing• A lack of strong correlations: all data and by season• Similar results with Spearman

TGM and NOx
15
• Not all by out of phase in hour-of-day
• Large variability in both compounds
• Low TGM when NOx high
1
1.5
2
2.5
3
0 2 4 6 8 10 12 14 16 18 20 22
TGM
Con
cent
ratio
n (p
pb)
Winter Spring Summer Fall

TGM & NOx in Fall
16
• Similar trends
• Afternoon low NOx but relatively high TGM with grater variability

TGM & NOx in Fall
17
• Get hour-of-day concentrations: TGM and NOx in fall
• Add noise to recreate hourly concentrations
• Noise: log-normal distribution with zero mean: based on hour-of-day SD
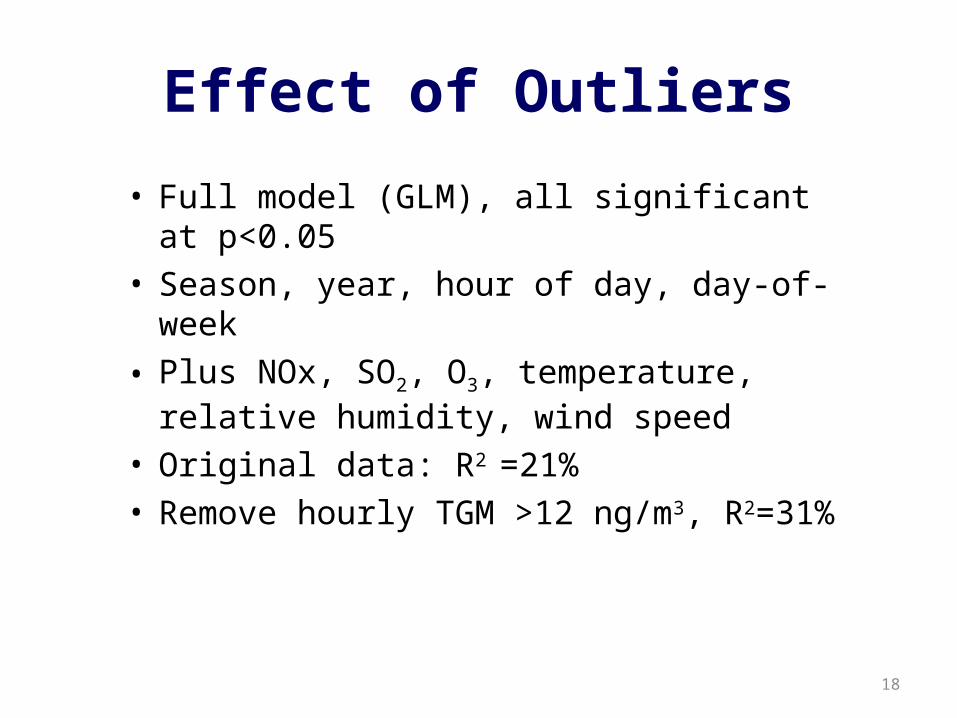
Effect of Outliers
18
• Full model (GLM), all significant at p<0.05
• Season, year, hour of day, day-of-week
• Plus NOx, SO2, O3, temperature, relative humidity, wind speed
• Original data: R2 =21%
• Remove hourly TGM >12 ng/m3, R2=31%

Summary
• Annualgradual decrease from 2007 – 2009
• Seasonalhigher in summer and winter compared to fall and
spring variability high in summer and low in wintersimilar to some urban sites with industrial impact
• Day-of-week10% higher on weekdays than weekends
19
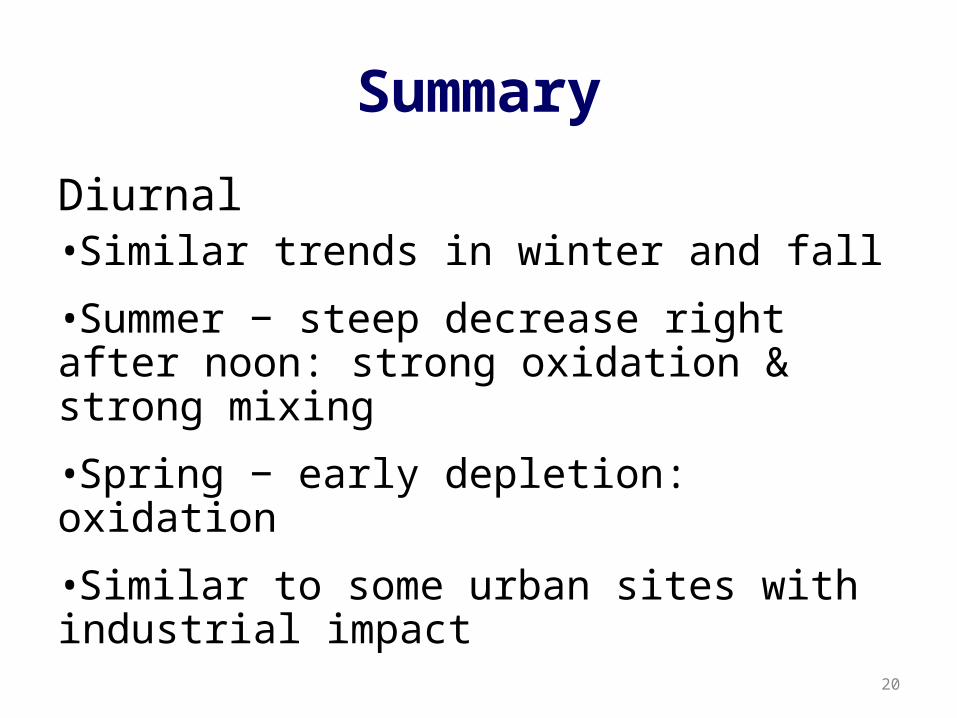
Summary
Diurnal •Similar trends in winter and fall
•Summer − steep decrease right after noon: strong oxidation & strong mixing
•Spring − early depletion: oxidation
•Similar to some urban sites with industrial impact
20
Summary
• Temporal factors: season, year, hour of day, day-of-week
• A lack of strong correlation with other pollutants and meteorological data
• High TGM when other pollutants were low
• Clear trend with meteorological parameters but great scattering especially in summer and winter
• Overall low % variance explained by temporal factors and environmental conditions– Large variability in TGM and other factors
– Strong influence by a few high TGM events
21
Future Work
• Expend recreation of hourly data using hour-of-day mean and SD to other pollutants /meteorological data in other seasons
• Further investigate the effect of outliers: especially SO2 (right skewed)
22
Acknowledgements
• Technical assistance
Harshal Patel, Mark Zhang, Elizabeth Tuscano
• Equipment: Natural Science and Engineering Research Council of Canada (NSERC) & Tekran
• Operation: NSERC
• Travel assistance: University of Windsor
• Editors and reviewers of an article in press: Xu X., Akhtar U., Clark K., Wang X., Temporal Variability of Atmospheric Total Gaseous Mercury in Windsor, ON, Canada, Atmosphere, 2014.
23
Conclusions
• TGM concentrations close to other urban sites in the region
• Higher concentrations in summer and winter• Seasonal and diurnal variability influenced by
environmental conditions, such as atmospheric mixing, photochemistry (oxidation), surface emissions
• Pollution rose suggests areas of potential regional sources in east to southwest of Windsor, with seasonal shift
24

Windsor West
Monitoring Site