A Study of Resiliency in New Orleans Neighborhoods Ten ...
58
Louisiana State University LSU Digital Commons LSU Master's eses Graduate School 2015 A Study of Resiliency in New Orleans Neighborhoods Ten Years Aſter Hurricane Katrina Paul Ramnauth Algu Louisiana State University and Agricultural and Mechanical College, [email protected] Follow this and additional works at: hps://digitalcommons.lsu.edu/gradschool_theses Part of the Environmental Sciences Commons is esis is brought to you for free and open access by the Graduate School at LSU Digital Commons. It has been accepted for inclusion in LSU Master's eses by an authorized graduate school editor of LSU Digital Commons. For more information, please contact [email protected]. Recommended Citation Algu, Paul Ramnauth, "A Study of Resiliency in New Orleans Neighborhoods Ten Years Aſter Hurricane Katrina" (2015). LSU Master's eses. 3069. hps://digitalcommons.lsu.edu/gradschool_theses/3069
Transcript of A Study of Resiliency in New Orleans Neighborhoods Ten ...

Louisiana State UniversityLSU Digital Commons
LSU Master's Theses Graduate School
2015
A Study of Resiliency in New OrleansNeighborhoods Ten Years After Hurricane KatrinaPaul Ramnauth AlguLouisiana State University and Agricultural and Mechanical College, [email protected]
Follow this and additional works at: https://digitalcommons.lsu.edu/gradschool_theses
Part of the Environmental Sciences Commons
This Thesis is brought to you for free and open access by the Graduate School at LSU Digital Commons. It has been accepted for inclusion in LSUMaster's Theses by an authorized graduate school editor of LSU Digital Commons. For more information, please contact [email protected].
Recommended CitationAlgu, Paul Ramnauth, "A Study of Resiliency in New Orleans Neighborhoods Ten Years After Hurricane Katrina" (2015). LSU Master'sTheses. 3069.https://digitalcommons.lsu.edu/gradschool_theses/3069
A STUDY OF RESILIENCY IN ORLEANS PARISH COMMUNITIES TEN YEARS
AFTER HURRICANE KATRINA
A Thesis
Submitted to the Graduate Faculty of the
Louisiana State University and
Agricultural and Mechanical College
in partial fulfillment of the
requirements for the degree of
Master of Science
in
The Department of Environmental Sciences
by
Paul R. Algu
B.S., Louisiana State University, 2011
December 2015
ii
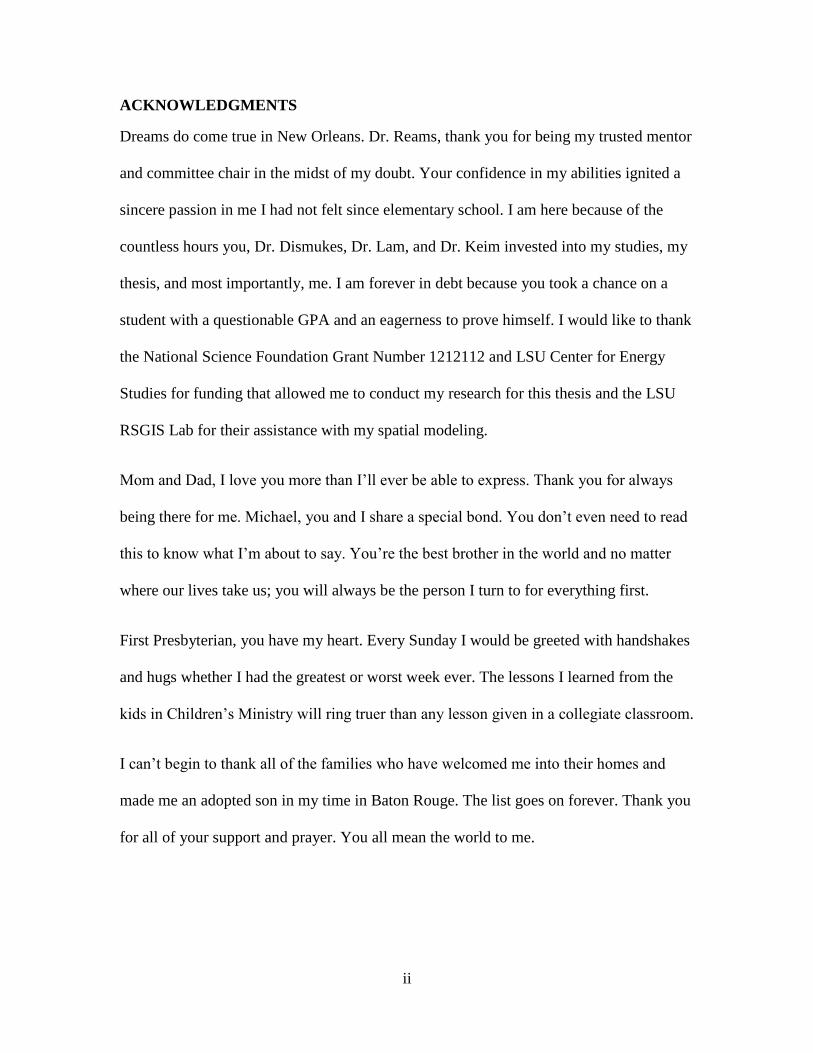
ACKNOWLEDGMENTS
Dreams do come true in New Orleans. Dr. Reams, thank you for being my trusted mentor
and committee chair in the midst of my doubt. Your confidence in my abilities ignited a
sincere passion in me I had not felt since elementary school. I am here because of the
countless hours you, Dr. Dismukes, Dr. Lam, and Dr. Keim invested into my studies, my
thesis, and most importantly, me. I am forever in debt because you took a chance on a
student with a questionable GPA and an eagerness to prove himself. I would like to thank
the National Science Foundation Grant Number 1212112 and LSU Center for Energy
Studies for funding that allowed me to conduct my research for this thesis and the LSU
RSGIS Lab for their assistance with my spatial modeling.
Mom and Dad, I love you more than I’ll ever be able to express. Thank you for always
being there for me. Michael, you and I share a special bond. You don’t even need to read
this to know what I’m about to say. You’re the best brother in the world and no matter
where our lives take us; you will always be the person I turn to for everything first.
First Presbyterian, you have my heart. Every Sunday I would be greeted with handshakes
and hugs whether I had the greatest or worst week ever. The lessons I learned from the
kids in Children’s Ministry will ring truer than any lesson given in a collegiate classroom.
I can’t begin to thank all of the families who have welcomed me into their homes and
made me an adopted son in my time in Baton Rouge. The list goes on forever. Thank you
for all of your support and prayer. You all mean the world to me.

iii
TABLE OF CONTENTS
ACKNOWLEDGMENTS .....................................................................................................ii
LIST OF TABLES .................................................................................................................iv
LIST OF FIGURES ...............................................................................................................v
ABSTRACT ...........................................................................................................................vi
CHAPTER
1. INTRODUCTION .....................................................................................................1
a. History of New Orleans .................................................................................1
b. Recent Hurricanes ..........................................................................................6
c. Recovery Following Hurricane Katrina .........................................................9
2. RELATED RESEARCH ...........................................................................................11
3. DATA SELECTION ..................................................................................................16
4. CASE STUDIES ........................................................................................................21
a. Central Business District................................................................................22
b. Marigny ..........................................................................................................25
c. Mid-City .........................................................................................................28
d. Village de L’Est .............................................................................................30
e. Lakeview ........................................................................................................32
f. Lower Ninth Ward .........................................................................................33
5. DISCUSSION AND CONCLUSIONS .....................................................................36
a. Suggestions for Future Research ...................................................................38
b. Summary of Findings .....................................................................................40
REFERENCES ......................................................................................................................42
APPENDIX A: MAIL DELIVERY DATA TO ACTIVE RESIDENTIAL ADDRESSES
BY NEIGHBORHOOD .........................................................................................................45
APPENDIX B: SOCIOECONOMIC VARIABLES FOR NEIGHBORHOODS .................47
APPENDIX C: ARCGIS MAP OF ABSOLUTE FLOOD DEPTHS BY
NEIGHBORHOOD ...............................................................................................................48
APPENDIX D: POPULATION COUNT FOR GREATER NEW ORLEANS ....................49
VITA ......................................................................................................................................51

iv
LIST OF TABLES
1. Percent Change in Active Residential Addresses Receiving Mail (June 2005 – June
2015) ................................................................................................................................17
2. Variables for Neighborhood Analysis .............................................................................19
3. Changes in Selected RIM and BRIC Variables in Orleans Parish...................................22
4. Statistics for Central Business District ............................................................................23
5. Statistics for Marigny .......................................................................................................26
6. Statistics for Mid-City......................................................................................................29
7. Statistics for Village de L’Est ..........................................................................................31
8. Statistics for Lakeview .....................................................................................................33
9. Statistics for Lower Ninth Ward ......................................................................................35

v
LIST OF FIGURES
1. 73 “Official” New Orleans Neighborhoods .....................................................................3
2. West Bank and Vicinity Levee ........................................................................................7
3. SLOSH Model of Hurricanes Katrina and Camille .........................................................7
4. Cross-Section of the City of New Orleans .......................................................................8
5. Four Patterns of Recovery in a Social Economic Community ........................................12
6. Recovery Patterns for Selected Neighborhoods .............................................................21
7. Mercedes-Benz Superdome Following Hurricane Katrina and in September 2006 ........24
8. Hot Spots (Marked With Red Stars) of Post-Katrina Gentrification in New Orleans,
Shown With Circa-2000 Demographic Data and a Delineation of the “White Teapot” .27

vi
ABSTRACT
Hurricane Katrina made landfall on August 29, 2005, flooding over eighty percent of the
Greater New Orleans area and causing a mass exodus of the local population. Statistical
analysis was used to quantify recovery at a neighborhood level and answer the following
questions: What is the recovery rate of New Orleans neighborhoods ten years after
Hurricane Katrina? What factors account for variation in recovery rates among
neighborhoods? Six neighborhoods in Orleans Parish were selected for further study
based on their unique geographical and recovery metrics.
Recovery rates among the seventy-two neighborhoods were based on a comparison of
United States Postal Service active delivery of mail to residences in Orleans Parish.
USPS delivery rates are considered an accurate indicator of population change following
a disaster. The neighborhoods with the highest recovery rates based on active delivery of
mail were the Central Business District (259.5%), Gert Town (116.9%), and Algiers
Point (111.9%). Those with the lowest included West Lake Forest (54.9%), B.W. Cooper
(45.6%), and Lower Ninth Ward (36.7%). A closer look at the recovery narrative of six
selected neighborhoods is included to provide additional context for consideration of the
research results. This study provides an essential look at the chief components of
neighborhood solvency which will affect New Orleans in the future and further solidifies
the inexorable link between New Orleans residents, their native ecosystem, and the built
infrastructure which has done so much to change every facet of the city.

1
CHAPTER 1. INTRODUCTION
Hurricane Katrina provided a rare opportunity to study the resilience and recovery of a major
metropolis on a macro level. Multiple analyses have dissected New Orleans’ reclamation from
Katrina’s floodwaters in terms of social, economic, and physical sciences. However, one unit of
analysis which has received less attention is the neighborhood. An amalgam of culture and very
much the individual hearts of New Orleans, neighborhoods tell stories other statistical areas
cannot. With a renewed interest in land management and planning following Hurricane Katrina,
it is vital for land planners and policymakers to understand how New Orleans operates at a
neighborhood level. Each community stakeholder has a share in how their neighborhood
recovers from, adapts to, and prepares for natural disasters.
This study examines population recovery among sixty-nine neighborhoods in New Orleans and
attempts to answer and address the following questions and research objective: What is the
recovery rate of New Orleans neighborhoods ten years after Hurricane Katrina? What factors
account for variation in recovery rates among neighborhoods? In addition to this analysis, six
neighborhoods in Orleans Parish were selected for further study based on their unique
geographical and recovery metrics to provide additional detail and insight into the likely
influences on recovery.
a. History of New Orleans
La ville de La Nouvelle-Orléans was formally founded in 1718 by Jean-Baptiste Le Moyne,
Sieur de Bienville (Bienville) (Campanella 1999). The story of New Orleans, however, begins
hundreds of years before. French coureurs des bois, or woodsmen, travelled down the

2
Mississippi River from French Canada and Louisiana (Kendall 1922). René-Robert Cavelier,
Sieur de La Salle was the first European to travel from the Great Lakes to the Gulf of Mexico
down the Mississippi River in 1682, opening the idea of linking French Canadian territories to
the territory of Louisiane, named after King Louis XVI (Kendall 1922). The first documented
expedition to discover the mouth of the Mississippi River and establish a city there was
undertaken by Bienville and his brother, Pierre Le Moyne d'Iberville (Iberville) in 1698 (Kendall
1922). The brothers established settlements in what is now Biloxi, Mississippi and Mobile,
Alabama; frequently leaving to chart the mouth of the Mississippi and find a suitable location to
establish a port city on the river. Iberville preferred Biloxi, but Bienville argued in favor of
“…the most beautiful crescent of the river" in between the Mississippi River and Lake
Pontchartrain (Kendall 1922). He named the new town after a Duke of Orléans and thus New
Orleans was born.
New Orleans was selected by Bienville for a variety of reasons. The city was built on a bend in
the river on high ground, allowing a tactical advantage in case of advances up the river by enemy
ships (Kendall 1922). The location in between the Mississippi River and Lake Pontchartrain, as
illustrated in Figure 1 with current neighborhoods, was the shortest route between the two bodies
of water. Please note the Desire Development and Desire neighborhood will be merged for
statistical analysis. A portage canal, Bayou St. John, allowed easy access between the two. The
deltaic alluvial soil was rich and it was easy to grow crops despite frequent flooding from the
river which served a dual purpose of replenishing soil and ruining crop yields simultaneously.
Despite these advantages, early inhabitants of New Orleans were also faced with a myriad of
hardship. Multiple floods, hurricanes, and fires took their toll on the city and it’s inhabitants.

3
Being situated in a humid subtropical climate, settlers also had to combat disease. Over 41,000
New Orleanians died of yellow fever between 1817 and the disease’s eradication in 1905
(McKiven 2007). Yellow fever and malaria were transmitted via mosquitos that bred in cisterns
and accounted for multiple epidemics in the early history of New Orleans. Other tropical
diseases, including cholera and dysentery, were responsible for thousands of deaths until
sanitation practices improved around the turn of the 20th
Century.
Figure 1: 73 “Official” New Orleans Neighborhoods (NOLA.com 2015)
The reasons for which Bienville selected New Orleans to be the capital of French Louisiana have
manifested themselves throughout history and to this day. Because of its location near the mouth

4
of the Mississippi River, New Orleans grew into a strategic port of great importance, comingling
French, Spanish, African, Creole, and eventually American heritages. The city also became a
major port for the slave trade, which caused an exponential growth in the city’s population from
its inclusion into the United States through the Louisiana Purchase in 1803 to the start of the
Civil War in 1861 (Kendall 1922, Campanella 2006). New Orleans was the largest city in the
Confederate States of America at the start of the Civil War and a primary target for Union
strategists hoping to capture the city and blockade supplies from reaching Confederate troops.
Admiral David Farragut captured New Orleans in 1862 and the Civil War ended in 1865
(Kendall 1922). During the Reconstruction Era the city was beset with problems stemming from
a large military presence, political factionism, and disenfranchisement of African-Americans
(Kendall 1922). The city still continued to grow steadily through these issues due to the
continued importance of its location which served as a major port for trade and immigration
through the end of the 19th
Century and into the 20th
.
One of the last major flood events to impact New Orleans was the Great Mississippi River Flood
of 1927. Heavy rains throughout the Mississippi River Basin swelled the river to record flood
stages and inundated 27,000 square miles of land (Campanella 2006, Campanella 2008). In New
Orleans, fears of a major natural disaster caused businessmen to detonate a levee in Caernarvon
in St. Bernard Parish downriver from the city as a last-ditch effort to save New Orleans from
being flooded (Campanella 2006, Campanella 2008). This act was unnecessary and caused
widespread flooding in St. Bernard and on the eastbank of Plaquemines Parish. The populations
affected by this flooding were not compensated and the repercussions from this decision have set
a precedent for resilience research today. After this flood, the United States Army Corps of

5
Engineers (USACE) enacted a massive building project, leveeing virtually the entire length of
the Mississippi River.
The Great Mississippi River Flood of 1927 signaled the beginning of the end of an upward
population growth trend in New Orleans and the South as a whole. African-Americans whose
residences were flooded by the river moved out of the predominantly rural South to
manufacturing centers in the West, Midwest, and Northeast; and this trend persisted until the
1970s (Campanella 2008). During World War II, New Orleans gained fame as the primary
location for the manufacture of Higgins Boats, or Landing Craft, Vehicle, Personnel (LCVP)
(Strahan 1994). Higgins LCVPs were used in both theatres of World War II and most famously
during Operation Overlord as Allied troops invaded beaches in the Normandy region of France
on June 6, 1944 (Strahan 1994). After the war, New Orleans’ population began to decline, a
trend which has continued to the present.
Many postwar trends that swept across the United States took longer to impact New Orleans. The
city’s urban core experienced growth until the 1960s, a marked difference from similar-sized
cities. This was due to the inability of Orleans Parish, co-terminous to the City of New Orleans,
to annex suburban development in adjacent parishes (Lewis 2003). The modern metropolitan
New Orleans footprint was born out of this movement, as neighborhoods contiguous to the city
like Metairie and Gretna in Jefferson Parish grew. The city was also slower to respond to the
growing Civil Rights Movement in the 1960s, leading to an educational and income gap which
persists to this day.

6
b. Recent Hurricanes
Two major hurricanes preceding Hurricane Katrina which played an integral part in New
Orleans’ response to Katrina were Hurricanes Betsy and Camille. Betsy was a Category 3
hurricane which made landfall on the Louisiana coast southwest of New Orleans on September
9, 1965 (Campanella 2008). Betsy drove left of New Orleans, exposing the city to the strongest
side of storm and flooding the Lower Ninth Ward and St. Bernard Parish. Locals were quick to
believe a rumor that the levees near these areas had been deliberately destroyed in order to save
the wealthier areas of the city, a rumor which was also levied in the immediate aftermath of
Katrina (Landphair 2007). Betsy was the first hurricane to cause over one billion dollars of
damage at the time in the United States (Campanella 2008). In the years after Betsy and aided by
the Flood Control Act of 1965, the city and USACE began to construct three hurricane protection
systems: New Orleans to Venice, Lake Pontchartrain and Vicinity, and West Bank and Vicinity
(“New Orleans District”). At the time of Katrina’s landfall none of these projects had been
completed. As of 2015, the only project which has been completed is West Bank and Vicinity, as
is illustrated in Figure 2 (“New Orleans District”).
Hurricane Camille was widely considered to be the worst-case scenario for a hurricane impact on
New Orleans. A Category 5 storm on the Saffir-Simpson scale, Camille followed an almost
identical path to Katrina but did not impact New Orleans as greatly as Katrina due to the
compact nature of Camille and the lower storm surge associated with it (Campanella 2008). The
storm made landfall in Waveland, Mississippi on August 17, 1969, mere miles away from where
Katrina would land thirty-six years later, as
7
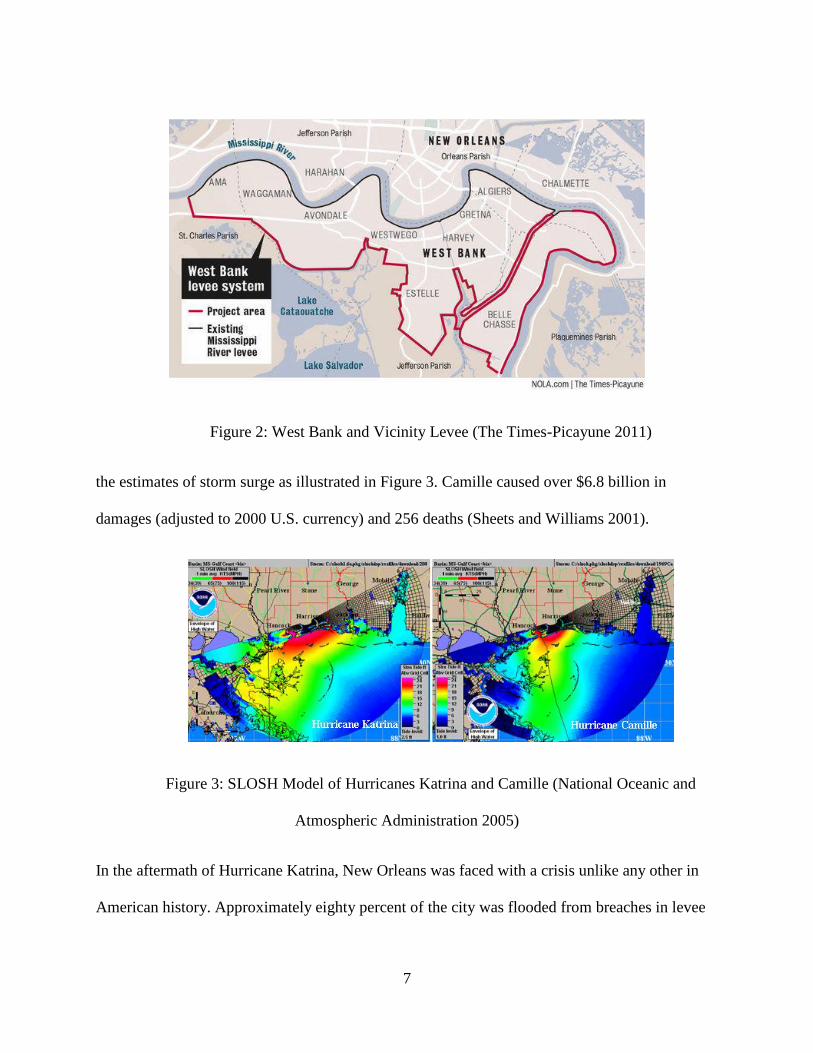
Figure 2: West Bank and Vicinity Levee (The Times-Picayune 2011)
the estimates of storm surge as illustrated in Figure 3. Camille caused over $6.8 billion in
damages (adjusted to 2000 U.S. currency) and 256 deaths (Sheets and Williams 2001).
Figure 3: SLOSH Model of Hurricanes Katrina and Camille (National Oceanic and
Atmospheric Administration 2005)
In the aftermath of Hurricane Katrina, New Orleans was faced with a crisis unlike any other in
American history. Approximately eighty percent of the city was flooded from breaches in levee

8
protection and canal systems (Plyer 2014). Due to subsidence and residents building away from
the high ground on the natural Mississippi River levee, the topography of New Orleans
resembles a bowl with the Mississippi River and Lake Pontchartrain serving as rims as illustrated
in Figure 4. Fifty-one percent of the parishes that comprise Greater New Orleans (Jefferson, St.
Bernard, and Orleans) are at or below sea level and this made pumping out the floodwaters more
odious than expected (Campanella 2008).
Figure 4: Cross-Section of the City of New Orleans (Staten Island Advance 2008)
Aside from engineering failures, New Orleans was presented with a failure in social support
systems during Katrina as well. Approximately eighty to ninety percent of New Orleanians
evacuated before Hurricane Katrina made landfall but those who stayed behind were trapped in
their own homes by floodwaters or transported to the Louisiana (now Mercedes-Benz)
Superdome where widespread reports of squalid living conditions and violence captured national
media attention, many of which reports turned out to be false. Looting was also reported across
9
the city and it was not until weeks later and under martial law residents were allowed back into
the Greater New Orleans area. A diaspora of over 800,000 residents left the GNO and as of 2015,
mail delivery rates indicate the number of residents currently in New Orleans is roughly equal to
pre-Katrina levels (Plyer et. al 2015).
c. Recovery Following Hurricane Katrina
Ten years after Hurricane Katrina opinions are split as to whether New Orleans has fully
recovered from the storm. Over $100 billion in aggregate federal funding was distributed to
shareholders and governments in the GNO area and this infusion of cash buoyed the city through
the economic crisis of 2008 (Plyer et. al 2015). From 2008 to 2012, New Orleans experienced a
total 1 percent increase in job recovery, well above the 2 percent loss suffered by the rest of the
United States (Plyer et. al 2015). The population count in New Orleans is estimated to have
increased as a 2014 estimate puts total population at 384, 320; an increase from the 2010 Census
value of 343,829 (Plyer et al. 2015). New Orleans has since landed on multiple lists for being
young professional- and business-friendly. Even the city’s moribund National Football League
franchise, the Saints, were able to capture a long-overdue and deserved Super Bowl
championship in 2009 behind a swelling of civic pride led by owner Tom Benson and the
pinpoint accuracy of quarterback Drew Brees. By all economic indicators, the city has rebounded
from Katrina extremely well with some going as far as to say the aftermath of the storm was the
social and economic wake-up call the region desperately needed.
But even for the redemptive story of economic growth in New Orleans post-Katrina, the story of
fractured social strata must also be told. It is estimated 100,000 African-Americans did not return
to New Orleans after the storm (Plyer et. al 2015). This loss of population separated families who

10
had lived in the same house for multiple generations, a practice fifty percent more prevalent in
New Orleans pre-Katrina as compared to the rest of the country. The Housing Authority of New
Orleans’ decision to demolish Section 8 housing developments, locally known as the Big Four,
also played a major role in separating residents from each other. While well-known social aid
and pleasure clubs like Zulu were able to keep ties together; smaller, more neighborhood-
oriented clubs were disbanded due to lack of membership. It is unknown, even ten years after the
storm, how these losses will further impact residents in newer Section 8 housing or rapidly
gentrifying neighborhoods like the Faubourg Marigny and Upper and Lower Ninth Wards.
This first chapter has presented an overview on the research questions and objectives along with
a history of the City of New Orleans. The next chapter presents related research concerning
community resilience. Findings from these studies were used to formulate and inform the
research questions and objectives. The third chapter contains a detailed description of data
selection methods that were used to acquire data related to New Orleans neighborhoods. The
fourth chapter presents six case studies of New Orleans neighborhoods ten years after Hurricane
Katrina. The fifth chapter includes a discussion of the results, suggestions for future research,
and a summary of findings. References, appendices with data used in the analyses, and related
maps follow the sixth chapter.

11
CHAPTER 2. RELATED RESEARCH
At its core, resilience is defined by reaction to disturbance. The catalyst necessary to begin a
resilience cycle is the impact caused by a perturbation in a defined system and the recovery
afterwards. This pattern was first identified in ecology (Adger 2000). The ecological definition
of resilience is the measure of how far a system can be disturbed or the magnitude of the
disturbance it can absorb before it shifts to another regime (Walker et. al 2006). The ecology
focus has given way to another idea of resilience: engineering resilience. The major difference
between ecological and engineering resilience is the number of system states. Engineering
resilience is measured by the impact on one system state whereas ecological resilience is
measured using multiple systems (Gunderson 2000). This thesis will study both the ecological
and engineering concepts of resilience.
Borrowing from ecological resilience, community resilience can be described using four types of
community classifications: usurper, resilient, resistant, and susceptible (Lam et al., 2015;
DeFrank 2009). In Figure 5 below, these classifications are illustrated on graphs which show the
x-axis of exposure, damage, and recovery and the y-axis of z-scores for the aggregate of these
dimensions (Li 2011). If the z-score is high after receiving a disturbance to a system, it correlates
to a resilient community. Communities which receive a major disturbance and do not fully
recover are considered susceptible. Those which recover to pre-disturbance levels are considered
resilient. Usurper communities receive a disturbance, but exhibit higher than before z-scores
which indicate the transfer of resources or capital from surrounding communities to the usurper
community (DeFrank 2009, Li 2011). Counties which receive less of a disturbance from the
initial event are considered resistant.

12
Figure 5: Four Patterns of Recovery in a Social Economic Community (Liu et. al 2006,
DeFrank 2009, Li 2011, Lam et. al 2015)
The intersection of ecological and engineering resilience is the study of socioeconomic
resilience. Human systems involve communities which must endure a disturbance that disrupts
their engineered infrastructure, surrounding ecological systems, and the community’s culture and
way of life. There are three key characteristics that define resilience as indicated by the
Resilience Alliance: the amount of change a system can experience and still maintain the same
controls and/or function; the degree to which a system can self-organize; and the system’s ability
to build and increase its capacity for adaptation and learning (Carpenter et al. 2001, Holling 1973
and 1996).
The amount of change a system can experience and maintain the same controls and/or function
varies based on a myriad of variables, most notably the ecological resilience of the natural
systems surrounding the socioeconomic system. In Louisiana, and especially New Orleans, the
natural ecosystem does not lend itself to a resilient environment. The state has lost over 1,900

13
square miles of coastal wetlands since 1932 and the loss continues at the rate of roughly one
football field per hour (Campanella 2008). This loss can be attributed to the leveeing of the
Mississippi River, cross-cutting of canals through marsh by oil and gas prospectors, sea level
rise, subsidence, hurricanes, and invasive species (Campanella 2008). Orleans Parish and the
greater New Orleans area has virtually been separated from the water surrounding it due to
levees and pump stations. These measures are taken to protect economic assets and residences
from flooding during storms but also prevent the Mississippi River from depositing sediment
over the levee, a historical event which allowed for the creation of the river delta over the course
of 7,000 years (Campanella 2008).
Self-organization is the foundation of resilience and can be hindered by excessive external
subsidies (Carpenter et. al 2001). In the aftermath of Hurricane Katrina, the city of New Orleans
did not exhibit the necessary self-organization and reliance on local systems to be considered
resilient. Over 100,000 residents were not able to evacuate in advance of the storm despite a plan
which had been honed by past hurricanes (Plyer et. al 2015). The most vulnerable populations
were those without personal vehicular transportation. In the aftermath of the storm the city relied
too heavily on state and federal resources which were delayed and disorganized in transit and
execution when they arrived in New Orleans. It is clear the city did not succeed at any municipal
or private level in self-organizing before or immediately after the storm.
Adaptive and organizational learning are among the most important of strategies needed to build
resilience. An organization has three paths when faced with a crisis: learn no lessons from the
crisis and risk repeating the same mistakes which led to the crisis, take steps to mitigate the

14
impact of the crisis and maintain a system as close to the normal state as possible, or adapt and
react to the crisis in a way which builds resilience and allows for a proactive response during the
next crisis event. In the case of the city of New Orleans, the approach taken to adaptive and
organizational learning was one that targeted high-visibility variables while ignoring other low-
visibility yet equally important ones, one such example being the constant attention paid to the
levee systems while ignoring non-structural measures such as community organization and
proactive planning and management strategies.
Organizational learning, or the capacity of an organization to create, retain, and disseminate
information internally, is one of the most critical pathways to ensuring an organization can
operate in the midst of any type of crisis, fast- or slow-burning. Organizations that do not
develop this capacity cannot draw on the experience of past crisis management decisions and
often repeat the same mistakes in their decision-making which lead to losses from a social or
economic standpoint in previous crises. The importance of organizational learning cannot be
understated, and if a modern organization is to succeed in the realm of crisis and disaster
management these principles must be enacted to create a strong, sustainable culture able of
withstanding internal and external shocks to the core competencies of the organization.
The review of these studies sheds light on the attributes and abilities of more resilient human
communities. These studies point to the important role of socioeconomic resources in
encouraging resilience. Thus, this analysis will include measures of socioeconomic vulnerability
along with a measure of the exposure of the residents to the disruptive events of Hurricane
Katrina.

15
This chapter reviewed several research studies that were used to inform the data selection and
analysis process. The next chapter is an explanation of data analysis.

16
CHAPTER 3. DATA SELECTION
United States Postal Service (USPS) counts of residential addresses actively receiving mail in
Orleans Parish annually from June 2005 – June 2015, socioeconomic variables based on the
Resilience Inference Model (RIM) and Baseline Resilience Index for Communities (BRIC)
analyses, and average flood depth by neighborhood were used to indicate and explain variations
in recovery between neighborhoods in relation to Orleans Parish (Lam et al. 2015, Cutter et al.
2010). These variables were provided by the New Orleans Data Center (NODC) at the
neighborhood level and include a combination of recovery, human/social, economic, and
natural/physical elements. The variables selected were: Percentage of Mail Delivery to Active
Residential Addresses from June 2005 – June 2015; Race: Percent black population; Female
headed household with no husband present; Education: population 25 years and older with a
bachelor’s degree; Median household income; Number of owner occupied housing units; Median
Rent; and Average Flood Depth.
The NODC dataset of active mail recipients takes into account variations in the data such as mail
delivery to trailers, unoccupied housing units, and differences at the Census block and tract level
by requesting data through the Valassis Residential and Business Database and checking the data
against Department of Housing and Urban Development Aggregated USPS Administrative Data
on Address Vacancies and USPS Delivery Statistics Product (Ortiz et al. 2011). Valassis uses a
proprietary formula based on the USPS Computerized Delivery Sequence software to mimic
active residential addresses receiving mail (Ortiz et al. 2011). The mail return rates used for this
study are tabulated at June of every given year with the exception 2006 and 2007 due to the
disruption in postal service after Hurricane Katrina. Seventy-two neighborhoods comprise the
17
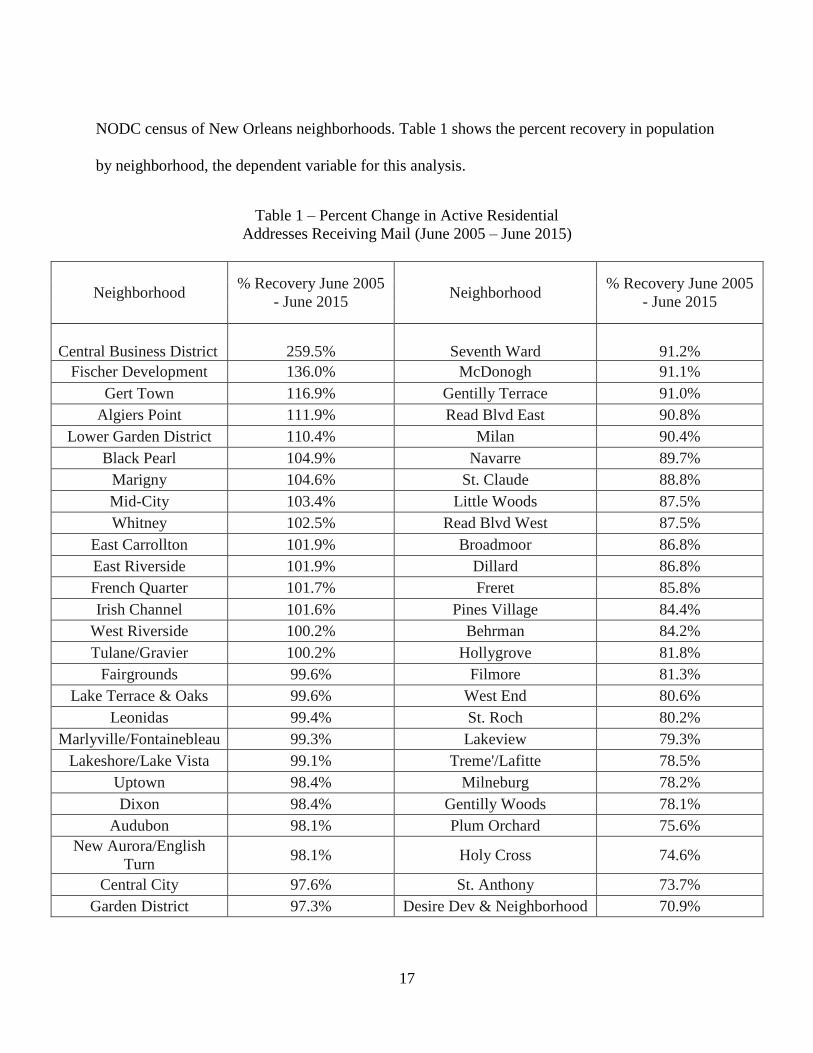
NODC census of New Orleans neighborhoods. Table 1 shows the percent recovery in population
by neighborhood, the dependent variable for this analysis.
Table 1 – Percent Change in Active Residential
Addresses Receiving Mail (June 2005 – June 2015)
Neighborhood % Recovery June 2005
- June 2015 Neighborhood
% Recovery June 2005
- June 2015
Central Business District
259.5%
Seventh Ward
91.2%
Fischer Development 136.0% McDonogh 91.1%
Gert Town 116.9% Gentilly Terrace 91.0%
Algiers Point 111.9% Read Blvd East 90.8%
Lower Garden District 110.4% Milan 90.4%
Black Pearl 104.9% Navarre 89.7%
Marigny 104.6% St. Claude 88.8%
Mid-City 103.4% Little Woods 87.5%
Whitney 102.5% Read Blvd West 87.5%
East Carrollton 101.9% Broadmoor 86.8%
East Riverside 101.9% Dillard 86.8%
French Quarter 101.7% Freret 85.8%
Irish Channel 101.6% Pines Village 84.4%
West Riverside 100.2% Behrman 84.2%
Tulane/Gravier 100.2% Hollygrove 81.8%
Fairgrounds 99.6% Filmore 81.3%
Lake Terrace & Oaks 99.6% West End 80.6%
Leonidas 99.4% St. Roch 80.2%
Marlyville/Fontainebleau 99.3% Lakeview 79.3%
Lakeshore/Lake Vista 99.1% Treme'/Lafitte 78.5%
Uptown 98.4% Milneburg 78.2%
Dixon 98.4% Gentilly Woods 78.1%
Audubon 98.1% Plum Orchard 75.6%
New Aurora/English
Turn 98.1% Holy Cross 74.6%
Central City 97.6% St. Anthony 73.7%
Garden District 97.3% Desire Dev & Neighborhood 70.9%

18
Neighborhood % Recovery June 2005
- June 2015 Neighborhood
% Recovery June 2005
- June 2015
City Park 96.6% Village de L'est 70.5%
Bywater 96.4% Viavant/Venetian Isles 69.5%
Tall Timbers/Brechtel
96.4% Lake Catherine 69.3%
Touro 95.9% U.S. Naval Support Area 63.7%
Old Aurora 95.4% St. Bernard Area 59.6%
Bayou St. John 93.3% Florida Area 57.6%
Pontchartrain Park 92.7% West Lake Forest 54.9%
Lakewood 92.5% B.W. Cooper 45.6%
Lower Ninth Ward 36.7%
In addition to the recovery variable based on mail delivery to active residential addresses, six
other variables representing human/social, financial, and economic capital indicators were
selected from the RIM and BRIC analyses. The RIM model uses exposure, damage, and
recovery indicators to determine the vulnerability and adaptability of a location to a disturbance
(Lam et al. 2015). RIM variables selected were female headed household with no husband
present and median rent. BRIC is an empirically based resilience index which was developed to
measure the overall resilience of a location. BRIC variables selected for analysis were percent
black population, population 25 years and older with a bachelor’s degree, median household
income, and number of owner occupied housing units.
Average flood depth data was calculated using data provided by the City of New Orleans and
joined using a neighborhood statistical area shapefile in ArcGIS. This data was used to calculate
an average absolute flood depth in each neighborhood. Flood depths were recorded by property
after Hurricane Katrina and converted into polygons with a value for absolute flood depth. The
flood depths provided by the City of New Orleans are absolute flood depths, or depths that take

19
into account water depth and elevation changes. For example, if an area’s elevation is four feet
below sea level and the flood depth measures four feet, the absolute flood depth of the area
would be eight feet. This absolute flood depth is the number used by the City of New Orleans
and was used for this analysis for that reason. Flood data was augmented using high water marks
provided by the Federal Emergency Management Agency (FEMA) in their document High
Water Mark Collection for Hurricane Katrina in Louisiana (Federal Emergency Management
Agency 2006). High water marks were recorded at certain addresses in selected neighborhoods
and those points were overlaid on the flood map generated using the City of New Orleans data as
a method of checking high water marks against mean absolute flood depths. The difference in
flood depths can be explained by FEMA’s use of mean elevation and the City of New Orleans
not using flooding relative to mean sea level as a measurement.
Based on a percent recovery rate of active residential addresses receiving mail from 2005 to
2015, the neighborhoods which experienced the most mail recovery received little to no flooding
damage during Katrina have experienced a usurper pattern of recovery led by the Central
Business District, which has had a 259.5% increase in addresses actively receiving mail. Other
neighborhoods with a similar pattern include Gert Town (116.9%), Algiers Point (111.9%), and
Marigny (104.6%).
Six independent variables were selected from the related research as indicators of community
resilience (Lam et al., 2015; Cutter et al. 2010) and the earlier study of New Orleans population
return using mail delivery to active residential address data at the Census tract level (DeFrank,
2009). The variables for the analysis are show in Table 2.
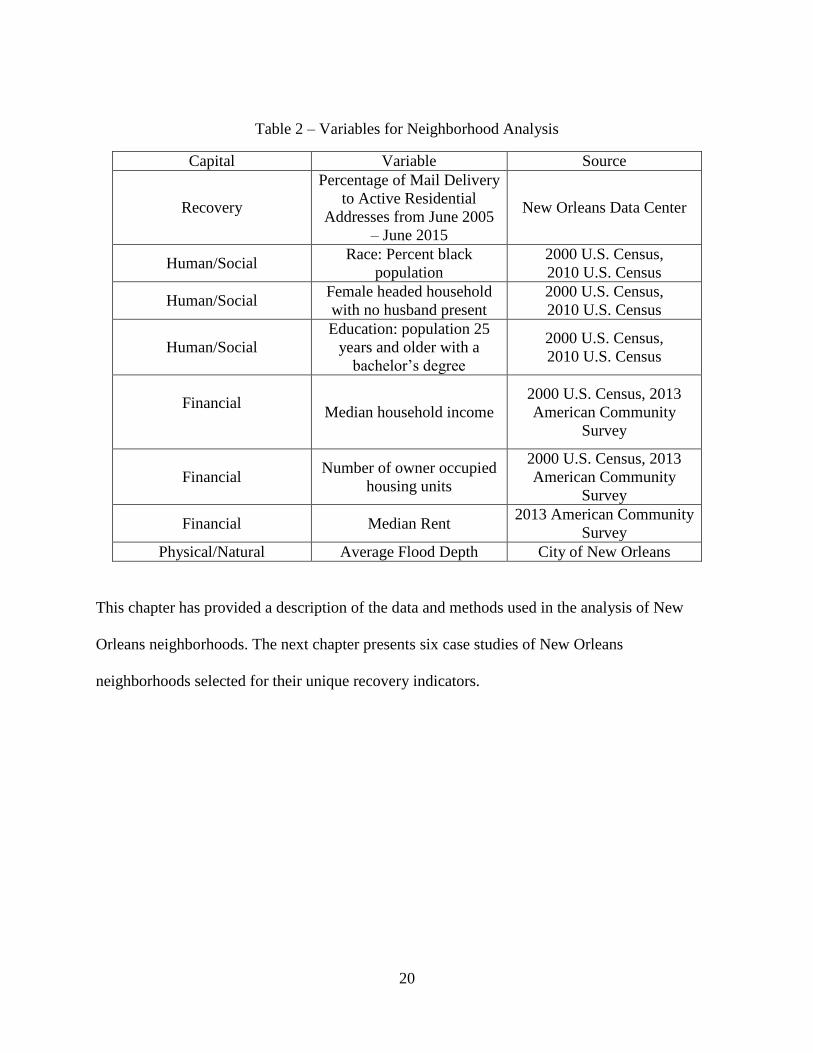
20
Table 2 – Variables for Neighborhood Analysis
Capital Variable Source
Recovery
Percentage of Mail Delivery
to Active Residential
Addresses from June 2005
– June 2015
New Orleans Data Center
Human/Social Race: Percent black
population
2000 U.S. Census,
2010 U.S. Census
Human/Social Female headed household
with no husband present
2000 U.S. Census,
2010 U.S. Census
Human/Social
Education: population 25
years and older with a
bachelor’s degree
2000 U.S. Census,
2010 U.S. Census
Financial
Median household income
2000 U.S. Census, 2013
American Community
Survey
Financial Number of owner occupied
housing units
2000 U.S. Census, 2013
American Community
Survey
Financial Median Rent 2013 American Community
Survey
Physical/Natural Average Flood Depth City of New Orleans
This chapter has provided a description of the data and methods used in the analysis of New
Orleans neighborhoods. The next chapter presents six case studies of New Orleans
neighborhoods selected for their unique recovery indicators.
21
CHAPTER 4. CASE STUDIES
In the context of New Orleans, the neighborhood designation speaks to the city’s community
more than Census tracts or ZIP codes. Born out of a classification system which divided New
Orleans into wards, each neighborhood in New Orleans has a distinct culture and history all its
own. All neighborhoods experienced a significant decline in mail delivery after Hurricane
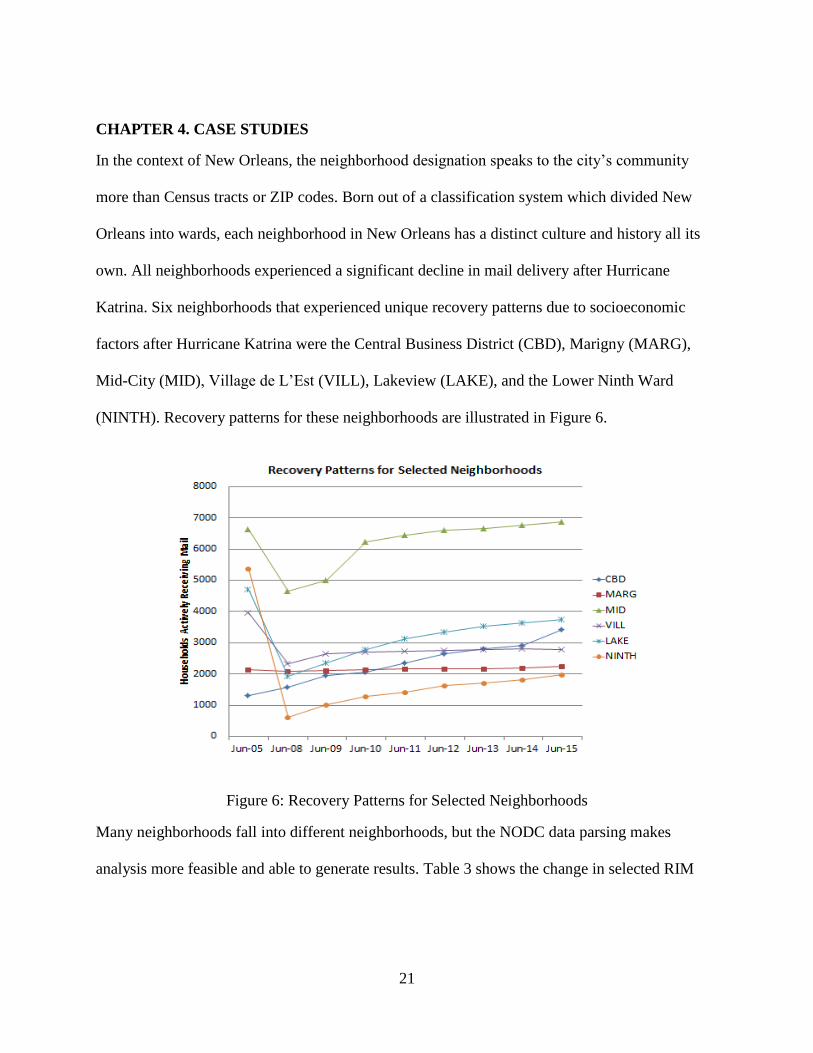
Katrina. Six neighborhoods that experienced unique recovery patterns due to socioeconomic
factors after Hurricane Katrina were the Central Business District (CBD), Marigny (MARG),
Mid-City (MID), Village de L’Est (VILL), Lakeview (LAKE), and the Lower Ninth Ward
(NINTH). Recovery patterns for these neighborhoods are illustrated in Figure 6.
Figure 6: Recovery Patterns for Selected Neighborhoods
Many neighborhoods fall into different neighborhoods, but the NODC data parsing makes
analysis more feasible and able to generate results. Table 3 shows the change in selected RIM

22
and BRIC variables in Orleans Parish. Please note average flood depth is not listed as it is only
applicable on a neighborhood level.
Table 3 – Changes in Selected RIM and BRIC Variables in Orleans Parish
As a whole, Orleans Parish advanced in resilience capital indicators with the exception of
median household income. These variables are further explained with the introduction of six case
studies.
a. Central Business District
The Central Business District, or CBD, is financial center of New Orleans. Built adjacent to the
French Quarter across Canal Street, the CBD was once a neighborhood which was largely
inhabited by American settlers who flocked to the area following the Louisiana Purchase of
1803. This demographic switch gave the CBD its first nickname: the American Sector
(Campanella 2006, 2008). In the decades after the Louisiana Purchase the neighborhood
expanded and by the 20th
Century the CBD was considered the economic heart of New Orleans.
Skyscrapers, high-rise buildings, and multipurpose venues such as the iconic Mercedes-Benz
Change in Variables
from 2000 - 2010
Recovery Rate (%) 89.2% NA
% African-American (2000) 60.3%
% African-American (2010) 57.2%
% Female-Headed Households (2000) 16.9%
% Female-Headed Households (2010) 13.9%
% Population Over 25 With Bachelor's Degree (2000) 14.7%
% Population Over 25 With Bachelor's Degree (2010) 17.9%
Household Income in Dollars (2000) 61,859.27$
Household Income in Dollars (2010) 59,014.09$
% Owner-Occupied Housing Units (2000) 48.4%
% Owner-Occupied Housing Units (2010) 49.3%
Median Rent in Dollars (2013) 823.72$ NA
0.8%
Orleans Parish
-3.1%
-3.0%
3.2%
(2,845.18)$

23
(then Louisiana) Superdome were constructed and still stand today. The CBD has experienced
widespread growth since Hurricane Katrina due to the revitalization of the Warehouse District
and influx of young professionals into the city. The CBD was selected for case study due to its
259.5% recovery rate in mail delivery to active mailing addresses, 12.6% increase in Owner-
Occupied Housing Units, and $17,204.66 decline in household income during that time. Table 4
shows the statistics for the CBD.
Table 4 – Statistics for Central Business District
In perhaps the most widely-shared story told of the hurricane, the then-Louisiana Superdome was
damaged by wind and water as Hurricane Katrina made landfall. Much of the Superdome’s white
roof was sheared off by wind and over 20,000 residents were forced to spend the duration of the
storm and up to a week after in the venue without air conditioning and electricity, which led to
rapidly devolving sanitary and health conditions (Lewis 2015). The Superdome’s roof and
images of residents trying to leave New Orleans from the battered stadium became one of the
Change in Variables
from 2000 - 2010
Recovery Rate (%) 259.5% NA
% African-American (2000) 32.9%
% African-American (2010) 23.1%
% Female-Headed Households (2000) 0.9%
% Female-Headed Households (2010) 1.1%
% Population Over 25 With Bachelor's Degree (2000) 25.4%
% Population Over 25 With Bachelor's Degree (2010) 33.4%
Household Income in Dollars (2000) 93,198.62$
Household Income in Dollars (2010) 75,993.96$
% Owner-Occupied Housing Units (2000) 23.2%
% Owner-Occupied Housing Units (2010) 35.8%
Median Rent in Dollars (2013) 977.88$ NA
Average Flood Depth (in feet) 2.2 NA
Central Business District
-9.8%
0.2%
8.0%
(17,204.66)$
12.6%

24
most identifiable symbols of the city after Hurricane Katrina. Every resident in the Superdome
was evacuated to the Houston Astrodome by September 4, 2005 (Lewis 2015). Due to the
hazards posed by human waste and storm damage from Katrina, the Superdome was forced to
undergo a 336-million dollar cleaning and renovation a shown in Figure 7; and opened for its
first event after Hurricane Katrina on September 25, 2006, when the New Orleans Saints
defeated the Atlanta Falcons 23-3 in their first game back after being forced to move temporarily
to San Antonio for the 2005 season (Lewis 2015). The now-Mercedes-Benz Superdome
celebrated its fortieth anniversary in 2015.
Figure 7: Mercedes-Benz Superdome Following Hurricane Katrina and in September 2006
(Louisiana Recovery Authority 2008)
The CBD is unique in that it has been a catalyst for growth in New Orleans after Hurricane
Katrina. The neighborhood experienced an average of 2.22 feet of flooding, but it was focused
away from the natural levee at the Mississippi River where most of the tourist and business

25
interests in the city lie. This allowed the CBD to welcome visitors back relatively quickly while
other parts of the city faced a longer recovery period. The CBD experienced 259% growth in
mail delivery from 2005 to 2015 and many other key indicators of socioeconomic recovery have
followed as well. Owner occupied housing units have increased from 23.2% in 2000 to 35.7% in
2010, but the average household income dropped from $93,198 in 2000 to $75,993 in 2010 and
the percentage of female headed households increased from 0.9% to 1.1% though that increase is
negligible. This trend is likely due to the influx of residents in the neighborhood as before
Katrina the CBD was largely a commuter neighborhood. The CBD has also experienced
development of the new residential “South Market District” around the Mercedes-Benz
Superdome which has seen numerous apartment and condominium complexes built on Poydras
Street in an effort to make downtown New Orleans more livable.
b. Marigny
The word “faubourg” from French roughly translates into suburb. The Marigny and Treme
neighborhoods are often described together colloquially as “the Faubourg” or individually as
“Faubourg Marigny” and “Faubourg Treme,” respectively. This area has seen an influx of
transplants post-Katrina, described by Richard Campanella as YURPS, or Young Urban
Rebuilding Professionals. YURPS are skilled, educated professionals who were drawn to the
rebuilding of New Orleans as a personal cause or endeavor and settled into neighborhoods like
Marigny, Treme, and Mid-City which had historic housing and were coterminous to each other.
Over the course of recovery these neighborhoods became more affluent and natives who did not
own their houses were often being priced out. This trend has led to oft-contentious relationships
between the new residents and older natives about the course of their neighborhood and the issue

26
of culture. Marigny was selected due to its $14,295.29 increase in household income, 5.0%
decrease in African-American population, and negligible flooding in the neighborhood. These
indicators point to an increase in affluence and influence of YURPS in the neighborhood.
Statistics for the Marigny are presented in Table 5 below.
Table 5 – Statistics for Marigny
The Marigny Neighborhood is located in between the French Quarter and Bywater
neighborhoods travelling on the Mississippi River due north. Once a plantation, the land was
sold by owner Bernard Marigny de Mandeville to create New Orleans’ first suburb (Campanella
2008). Incidentally, de Mandeville also owned land which became St. Bernard Parish and the
city of Mandeville, lending his name to three areas in greater New Orleans. The Marigny grew
through the reunification of New Orleans in 1851 into a multi-ethnic neighborhood due to de
Mandeville selling lots to whoever would be willing to buy (Campanella 2008). The area became
Change in
Variables from
2000 - 2010
Recovery Rate (%) 104.6% NA
% African-American (2000) 17.7%
% African-American (2010) 12.7%
% Female-Headed Households (2000) 3.0%
% Female-Headed Households (2010) 1.4%
% Population Over 25 With Bachelor's Degree (2000) 18.8%
% Population Over 25 With Bachelor's Degree (2010) 23.7%
Household Income in Dollars (2000) 49,283.97$
Household Income in Dollars (2010) 63,579.26$
% Owner-Occupied Housing Units (2000) 32.9%
% Owner-Occupied Housing Units (2010) 36.3%
Median Rent in Dollars (2013) 777.70$ NA
Average Flood Depth (in feet) 0.02 NA
Marigny
-5.0%
-1.6%
4.9%
14,295.29$
3.4%

27
industrialized and property valued dropped severely from the turn of the century to World War
II. The gentrification process of reclaiming the neighborhood started in the 1970s and continues
to this day. The Marigny received negligible flooding from Katrina and today, along with the
Bywater, is among the most desirable neighborhoods to live in for young professionals and
families (Campanella 2008). Despite this growth the neighborhood has become a flashpoint for
many issues plaguing the city since Katrina, the primary concern of natives being gentrification.
A map of post-Katrina gentrification hot spots is listed as Figure 8 below.
Figure 8: Hot Spots (Marked With Red Stars) of Post-Katrina Gentrification in New Orleans,
Shown With Circa-2000 Demographic Data and a Delineation of the “White Teapot”
(Campanella 2008)

28
The Marigny has also seen tangible growth after Hurricane Katrina. Mail delivery rates to active
residential addresses placed population recovery at 104% from 2005 to 2015.
c. Mid-City
Mid-City was once considered back of the town, or “backatown” in local dialect; the back end of
the natural Mississippi River levee which kept the Vieux Carre elevated above sea level. This
meant the neighborhood, built along the New Basin Canal, was largely uninhabitable until 1913
when the invention of the screw pump made it possible to drain parts of the city under sea level.
Mid-City is considered the “heart” of New Orleans both geographically and culturally, with little
tourist value and a host of local associations and neighborhood shops. While Mid-City was
swamp for the early part of New Orleans’ history, the adjacent neighborhoods build on the
higher Esplanade Ridge bordering Bayou St. John were home to multi-million dollar Creole
homes. Mid-City was flooded during Hurricane Katrina, but not to the extent of other
neighborhoods near to it because of the Esplanade Ridge and proximity to the levee breaks in
Lakeview.
Mid-City has seen a similar growth pattern to the Marigny after Katrina despite high absolute
flood depths, mainly due to the geography of Mid-City being at the back end of the Mississippi
River Levee and in the middle of New Orleans’ “bowl” as seen in Figure 4. Mid-City was
selected for case study due to its recovery rate based on mail delivery to active residential
addresses of 103% despite the neighborhood’s absolute flood depth average of 9.7 feet. FEMA
high water marks in the neighborhood include 2913 Gravier Street which measured 2.6 feet; the
Lafitte Greenway, which measured 2.4 feet; and 3005 St. Philip Street, which recorded a high
water mark of 2.4 feet. The flood depths surveyed by the City of New Orleans data measure
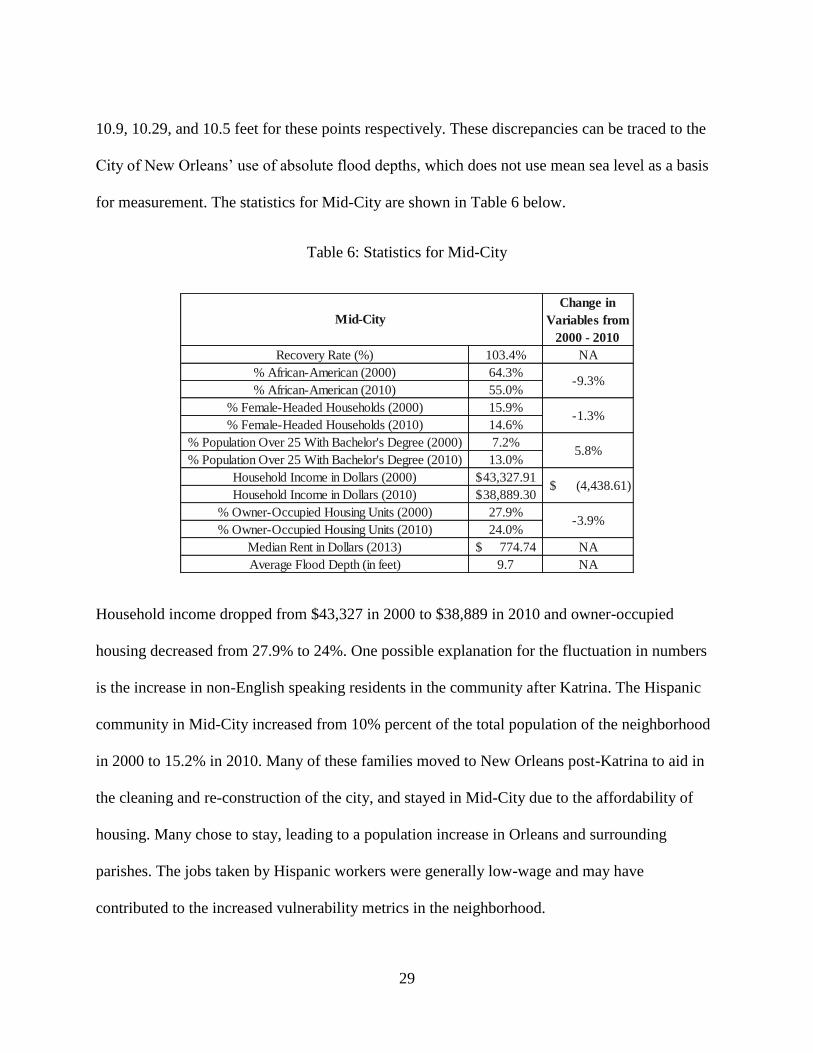
29
10.9, 10.29, and 10.5 feet for these points respectively. These discrepancies can be traced to the
City of New Orleans’ use of absolute flood depths, which does not use mean sea level as a basis
for measurement. The statistics for Mid-City are shown in Table 6 below.
Table 6: Statistics for Mid-City
Household income dropped from $43,327 in 2000 to $38,889 in 2010 and owner-occupied
housing decreased from 27.9% to 24%. One possible explanation for the fluctuation in numbers
is the increase in non-English speaking residents in the community after Katrina. The Hispanic
community in Mid-City increased from 10% percent of the total population of the neighborhood
in 2000 to 15.2% in 2010. Many of these families moved to New Orleans post-Katrina to aid in
the cleaning and re-construction of the city, and stayed in Mid-City due to the affordability of
housing. Many chose to stay, leading to a population increase in Orleans and surrounding
parishes. The jobs taken by Hispanic workers were generally low-wage and may have
contributed to the increased vulnerability metrics in the neighborhood.
Change in
Variables from
2000 - 2010
Recovery Rate (%) 103.4% NA
% African-American (2000) 64.3%
% African-American (2010) 55.0%
% Female-Headed Households (2000) 15.9%
% Female-Headed Households (2010) 14.6%
% Population Over 25 With Bachelor's Degree (2000) 7.2%
% Population Over 25 With Bachelor's Degree (2010) 13.0%
Household Income in Dollars (2000) 43,327.91$
Household Income in Dollars (2010) 38,889.30$
% Owner-Occupied Housing Units (2000) 27.9%
% Owner-Occupied Housing Units (2010) 24.0%
Median Rent in Dollars (2013) 774.74$ NA
Average Flood Depth (in feet) 9.7 NA
-9.3%
-1.3%
5.8%
(4,438.61)$
-3.9%
Mid-City

30
d. Village de L’Est
The neighborhood of Village de L’Est is one of the most unique neighborhoods in New Orleans.
In its present form, the neighborhood is the result of Vietnamese Catholics who fled the
communist government of Ho Chi Minh in 1975 (Leong et al. 2007). This diaspora was resettled
into the Versailles Arms apartments in New Orleans East and more Vietnamese immigrants
followed. The neighborhood grew into a multiethnic enclave with Vietnamese, existing African-
American families, and Central American workers living in a sparsely populated area of New
Orleans East (Leong et al. 2007). The unique characteristic of this Village de L’Est and the
reason it was selected for case study arrives from its post-Katrina return of Vietnamese, who
created a resilient community strong in the three key characteristics of resilience: the amount of
change a system can experience and still maintain the same controls and/or function; the degree
to which a system can self-organize; and the system’s ability to build and increase its capacity
for adaptation and learning (Carpenter et al. 2001, Holling 1973 and 1996).
The “Vietnamese Versailles community” as they were referred to post-Katrina have withstood
multiple changes in their community from the influx of Central American populations to rising
housing prices and have maintained the same level of function, are self-organized around the
Mary Queen of Vietnam Catholic Church which serves as a meeting place and rallying point for
the community, and have actively engaged in stakeholder participation as a method for learning
and adapting to changing political and ecological systems (Leong et al. 2007). Despite the media
attention garnered from the resilient adaptation of residents of Village de L’Est, community
leaders have made sure to note the need for top-down funding from the state and federal

31
government, and the challenges the community would have faced without it. The statistics for
Village de L’Est are shown in Table 7 below.
Table 7: Statistics for Village de L’Est
The majority of homes in the Village de L’Est neighborhood were flooded with 2-4 feet of water
based on absolute flood depth, but the immediate aftermath of the storm saw over 90 percent of
the Vietnamese population return. No FEMA high water marks were recorded in Village de
L’Est, but points around the neighborhood serve as proxy for flooding depths in the
neighborhood as indicated by FEMA high water marks at 6391 Eastover Drive which measured -
1.4 feet; Fernley Drive, which measured -1.1 feet; and 13414 Old Gentilly Drive, which recorded
a high water mark of 2.0 feet (Federal Emergency Management Agency 2006). All proxy
addresses were located in the adjacent neighborhood of Read Boulevard East. The flood depths
surveyed by the City of New Orleans data measure 13.5, 12.8, and 13.9 feet for these points
respectively. These discrepancies can be traced to the City of New Orleans’ use of absolute flood
Change in Variables
from 2000 - 2010
Recovery Rate (%) 70.5% NA
% African-American (2000) 55.4%
% African-American (2010) 43.4%
% Female-Headed Households (2000) 24.2%
% Female-Headed Households (2010) 16.6%
% Population Over 25 With Bachelor's Degree (2000) 9.2%
% Population Over 25 With Bachelor's Degree (2010) 8.2%
Household Income in Dollars (2000) 50,788.68$
Household Income in Dollars (2010) 40,926.17$
% Owner-Occupied Housing Units (2000) 47.1%
% Owner-Occupied Housing Units (2010) 63.6%
Median Rent in Dollars (2013) 636.40$ NA
Average Flood Depth (in feet) 3.5 NA
-12.0%
-7.6%
-1.0%
(9,862.51)$
16.5%
Village de L'Est

32
depths in their measurement, which does not use mean sea level as a basis for measurement.
African-Americans who shared apartment complexes with the Vietnamese only returned at a rate
of 50 percent due to rising rent prices which had begun driving many African-American tenants
out before Katrina (Leong et al. 2007). The aggregate of these population returns saw Village de
L’est return 70.5 percent of its pre-Katrina population, the majority of this population being
Vietnamese.
e. Lakeview
Lakeview was one of the most impacted neighborhoods in the aftermath of Hurricane Katrina.
The failure of the 17th
Street Canal levee to the west inundated the neighborhood with
floodwaters reaching up to an average absolute depth of sixteen feet. No FEMA high water
marks were recorded in Lakeview proper, but points around the neighborhood serve as proxy for
flooding depths in the neighborhood as indicated by FEMA high water mark 5590 Canal
Boulevard, in the Navarre neighborhood, which measured 2.4 feet; 720 Gem Street, in the
Lakeshore-Lake Vista neighborhood which measured 2.4 feet; and on Marconi Drive, in Navarre
which recorded a high water mark of 0.7 feet (Federal Emergency Management Agency 2006).
The flood depths surveyed by the City of New Orleans data measure 10.5, 13.87, and 13.88 feet
for these points respectively. These discrepancies can be traced to the City of New Orleans’ use
of absolute flood depths in their measurement, which does not use mean sea level as a basis for
measurement.
Lakeview is an affluent neighborhood with an average rent of more than 442 dollars above the
average for Orleans Parish and an average household income of 97,926 dollars, over 37,000
dollars higher than the Orleans Parish average. Only 5.4% of residents in Lakeview live in
33
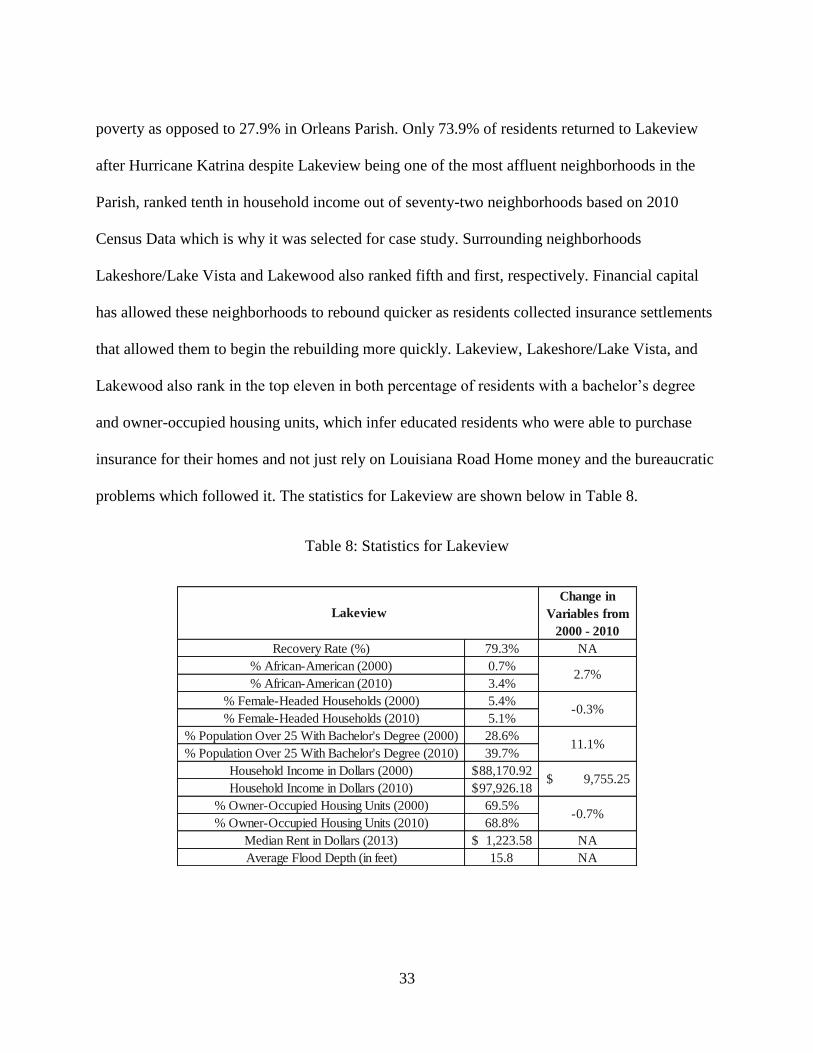
poverty as opposed to 27.9% in Orleans Parish. Only 73.9% of residents returned to Lakeview
after Hurricane Katrina despite Lakeview being one of the most affluent neighborhoods in the
Parish, ranked tenth in household income out of seventy-two neighborhoods based on 2010
Census Data which is why it was selected for case study. Surrounding neighborhoods
Lakeshore/Lake Vista and Lakewood also ranked fifth and first, respectively. Financial capital
has allowed these neighborhoods to rebound quicker as residents collected insurance settlements
that allowed them to begin the rebuilding more quickly. Lakeview, Lakeshore/Lake Vista, and
Lakewood also rank in the top eleven in both percentage of residents with a bachelor’s degree
and owner-occupied housing units, which infer educated residents who were able to purchase
insurance for their homes and not just rely on Louisiana Road Home money and the bureaucratic
problems which followed it. The statistics for Lakeview are shown below in Table 8.
Table 8: Statistics for Lakeview
Change in
Variables from
2000 - 2010
Recovery Rate (%) 79.3% NA
% African-American (2000) 0.7%
% African-American (2010) 3.4%
% Female-Headed Households (2000) 5.4%
% Female-Headed Households (2010) 5.1%
% Population Over 25 With Bachelor's Degree (2000) 28.6%
% Population Over 25 With Bachelor's Degree (2010) 39.7%
Household Income in Dollars (2000) 88,170.92$
Household Income in Dollars (2010) 97,926.18$
% Owner-Occupied Housing Units (2000) 69.5%
% Owner-Occupied Housing Units (2010) 68.8%
Median Rent in Dollars (2013) 1,223.58$ NA
Average Flood Depth (in feet) 15.8 NA
2.7%
-0.3%
11.1%
9,755.25$
-0.7%
Lakeview

34
The Lakeview neighborhood is located on the southshore of Lake Pontchartrain. It is bordered by
Lakeshore/Lake Vista to the north, City Park to the east, Navarro to the south, and West End and
Lakewood to the west. Lakeview and its surrounding neighborhoods were largely undeveloped
swampland until after World War II, when expansion to the suburbs such as Metairie and Kenner
became the norm of life in New Orleans.
f. Lower Ninth Ward
The reason for selected the Lower Ninth Ward for case study was that the neighborhood became
the face of Hurricane Katrina for much of the world after media outlets reported multiple
breaches in the Industrial Canal levee and the failure of floodwalls bordering MRGO, the
combination of which flooded the Lower Ninth Ward. The Lower Ninth Ward is one of the
poorest neighborhoods in Orleans Parish, ranking fifty-sixth in mean household income at
$33,557, twenty-seventh in female-only headed households at 18.7%. In contrast to these
numbers, however, is that the Lower Ninth Ward ranks twelfth in owner-occupied housing at
66.4%. This number can be explained by the widespread existence of multigenerational housing
in the neighborhood. A large number of families live in houses which have been passed down
from generation to generation. This arrangement allows lower-income families to live free of
rent in the same neighborhood for decades and also contributes to a stronger sense of
community, an aspect for which the Lower Ninth Ward has been celebrated.
The flood data used for this analysis shows the average flood depth at twelve feet for the Lower
Ninth Ward, but many residences that flooded at an equal or higher depth in the north part of the
neighborhood were not accounted for during the City of New Orleans’ Phase I and II labeling of
flood depths. In actuality, the flood depth in the Lower Ninth Ward was much higher as indicated

35
by FEMA high water mark at 1616 Caffin Street, which measured 19.0 feet; 1833 Tricou Street,
which measured 13.0 feet; and 1724 Esteban Street, across the St. Bernard Parish line but still
may serve as a proxy for the Lower Ninth Ward, with recorded a high water mark of 11.0 feet
(Federal Emergency Management Agency 2006). All depths provided by the City of New
Orleans for these locations averaged 10 feet. Much like the scene at the then-Louisiana
Superdome, images of residents who could not afford to evacuate signaling for help from their
rooftops became enduring pieces of Katrina media coverage. The statistics for the Lower Ninth
Ward are shown below in Table 9.
Table 9: Statistics for Lower Ninth Ward
This chapter has presented six case studies of New Orleans neighborhoods. The next chapter
includes the discussion of the analysis and case studies, suggestions for future research, and a
summary of findings.
Change in
Variables from
2000 - 2010
Recovery Rate (%) 36.7% NA
% African-American (2000) 98.3%
% African-American (2010) 95.5%
% Female-Headed Households (2000) 24.9%
% Female-Headed Households (2010) 18.7%
% Population Over 25 With Bachelor's Degree (2000) 4.7%
% Population Over 25 With Bachelor's Degree (2010) 3.9%
Household Income in Dollars (2000) 37,894.10$
Household Income in Dollars (2010) 33,557.37$
% Owner-Occupied Housing Units (2000) 59.0%
% Owner-Occupied Housing Units (2010) 66.4%
Median Rent in Dollars (2013) 591.55$ NA
Average Flood Depth (in feet) 12.0 NA
-2.8%
-6.2%
-0.7%
(4,336.73)$
7.4%
Lower Ninth Ward

36
CHAPTER 6. DISCUSSION AND CONCLUSIONS
In the weeks and months after Hurricane Katrina there was a fear that New Orleans as America
knew it would cease to exist. Outwardly a destination for revelry, featuring hot trumpets and
loose morals, New Orleans was reduced to the largest insurance claim in history with over $76
billion in federal funding spent in Louisiana after the storm. However, the recovery effort
spurred a renaissance that buoyed the city through the recessions of 2008 and 2010, and new
transplants who worked in every sector from construction to finance injected energy, vigor, and
most importantly money into the local economy. Roughly ten years after the storm Orleans
Parish has recovered 89.2% of its population based on using mail delivery as an indicator, 12.1%
of that in the last five years, and metrics shows stable growth which will allow the parish to
reach 100% of its pre-Katrina population based on indicators before the twentieth anniversary of
Hurricane Katrina. The use of 2010 Census variables in the analysis compared against recovery
indicators in 2015 presents a slight incongruence in the data, but the 12.1% growth in mail
delivery to residential addresses shows that the area is still experiencing growth after the
hurricane, even if it will be another five years before an official census is conducted.
As rosy a picture the overall metrics of recovery paint for New Orleans, the actual portrait is
much more uneven. Neighborhoods that received the most water have taken the longest to
recover. While this may seem obvious, the struggle for normality crosses racial and economic
boundaries. Lakeview is one of the most affluent neighborhoods in the city, but ranks in the
twenty-third percentile of recovering neighborhoods. The Lower Ninth Ward ranks dead last in
recovery by population, and is also one of the poorest neighborhoods in the city. These two

37
neighborhoods linked by nothing more than a nine to eleven foot high cascade of water explain
how recovery, like many things in New Orleans, transcends all boundaries.
Primary among lessons learned after Katrina was the need to manage the relationship between
land and water better. Katrina’s floodwaters did not discriminate in depth and extent of flooding,
and maybe the city should not either. However, when the complex tapestry that is the
neighborhood ethos in New Orleans is laid over the land itself the question becomes impossibly
complex. New Orleans’ traditions and stubbornness seem to predate the city itself, a location at
the mercy of then-yearly flooding by the Mississippi River and hurricanes which arrived like
cathartic clockwork to clean the nascent city out before the Fall arrived. Out of this persistent
survival grew the Wards of New Orleans, first on the levee where high ground preordained
survival and then further back to Lake Ponchartrain as technology fought Mother Nature.
Faubourgs gave way to backatown and ultimately baby boomers; and the names stuck. Those
living in their neighborhoods knew their lot in life from their traditions: Catholic schools, block
parties, second lines, even down to how amalgamated was their accent. To tell a New Orleanian
they must move out of the neighborhood which has served as de facto mother, family, and nest is
to tell a New Orleanian they cannot watch the Saints on Sunday or stand on their block for
Endymion. Simply put, it is the worst form of offense.
This ethos which has pervaded in the city for centuries is perhaps the most limiting factor of
successful land management in the city. New Orleans has grown unsustainable in preventing
damage from hurricanes. Hurricane Katrina’s flooding profile matches that of Hurricanes Betsy
and Camille and even that of Sauvé's Crevasse, a flood caused by a break in the Mississippi

38
River Levee in 1849. The most widely known brass band in New Orleans folklore is Rebirth, and
for good reason. New Orleanians are well-versed in the art of rising from the water. While the
U.S. Army Corps of Engineers has finished the first portion of their hurricane protection system
for New Orleans, the West Bank and Vicinity Levee; two other systems on the Eastbank of New
Orleans: Lake Pontchartrain and Vicinity and New Orleans to Venice have yet to be completed.
The trio of protection projects were awarded in 1965 and the combined project cost has
ballooned to over $765 million over fifty years of NEPA review and bureaucratic snags.
Compounding the issue is wetland loss along the Louisiana coast, at a rate of almost sixteen
square miles a year. A total of 2.7 miles of wetlands absorbs one foot of storm surge and current
rate of loss leaves New Orleans extremely vulnerable to another storm similar to Katrina, whose
eleven to nineteen foot surge overtopped levees along MRGO and the Industrial Canal levee and
contributed to the catastrophic flooding of the Lower Ninth Ward (DeFrank 2009). Funding for
the Louisiana State Coastal Master Plan whose main goal is to combat and reverse the land loss
trend is currently lacking, even with over $18.7 billion in fines paid for by British Petroleum as
the result of a 2010 oil spill in the Gulf of Mexico (BP Press Office 2015). Without proper
planning and resource management, New Orleans and its environs are set to become a peninsula,
separated from the mainland only by an elevated roadway and a yet-to-be completed levee
system.
a. Suggestions for Future Research
The single most daunting task in researching an event more than a decade after its impact is the
availability of data related to said impact. Multiple servers were sunset prior to the tenth
anniversary of Katrina and this made it near impossible to find significant data with which to run

39
an analysis. The New Orleans Data Center was by far the best source for socioeconomic and
mail delivery data to active residential address, but there are substantial limitations as to what
academics could and could not use as the NODC restricts data availability to individuals and
organizations other than registered non-academic non-profit agencies.
Another issue which arose in data sourcing was the availability of flood depth data and the
measurements taken by differing agencies. The flood depth data for this analysis was obtained
from the City of New Orleans and was provided in absolute flood depth, which provides a sum
of water depth plus elevation changes in its measurement. This absolute measurement differs
from other sources of flood depth data such as FEMA, the Department of Housing and Urban
Development, and Louisiana State University, whose data used methods including point data
taken in the field after Katrina and LIDAR. The City of New Orleans did not release how the
absolute measurements were taken nor was there available metadata that could be traced to the
files provided. The flood depth data was obtained through public records request and was
provided on good faith from the city. This data was considered a primary source due to the
agencies which provided the data and therefore was used in the analysis for that reason. This data
was also checked against FEMA high water marks which take factors such as elevation into
account.
A future study could perhaps expand this analysis to adjacent parishes and compare the means of
analysis using 2010 Census variables. The City of New Orleans may be coterminous to Orleans
Parish, but New Orleans is very much a commuter city. Expanding a study to Jefferson, St.
Bernard, and Plaquemines Parish would shed a light on the region’s vitality as a whole ten years
40
after the storm, important because St. Bernard and Plaquemines Parish arguably suffered equal
or greater scaled damage from Katrina. However, this study would remove the sub-group
analysis of neighborhoods from the scope because neighborhoods are not as well-defined in the
largely suburban parishes bordering Orleans Parish. In fact, many of these neighborhoods bleed
into Orleans Parish, with West End and Metairie considered an extension of Lakeview and St.
Bernard a continuation of sorts from the Ninth Ward.
Where earlier studies could not predict how New Orleans would grow after so devastating a
blow to the region, it is now known that the city is experiencing stable growth and will return to
or exceed pre-Katrina populations with an increased quality of life for its residents. The scope of
projects in the city range from culinary to recreational to industrial and all have a positive impact
on the post-Katrina New Orleans. Further and constant analyses are required of the city and its
environs, much like a heart attack patient who is preparing to run a marathon: the recovery may
have been near-miraculous and exceeded all expectations, but it is still in the best interest of all
parties to be as prudent as possible when examining and predicting adverse effects that may crop
up in the future.
b. Summary of Findings
Ten years after Hurricane Katrina the majority of indices show New Orleans close to recovering
100% of its pre-Katrina population based on indicators, though the recovery patterns have been
uneven and skewed toward upwardly mobile neighborhoods which experienced negligible flood
damage. This knowledge can be used to better predict and prepare vulnerable neighborhoods for
flooding risks.
41
New Orleans remains a city to be watched as it is one of a handful in the country to experience a
catastrophic natural disaster and be repopulated in the 21st Century. The union of social,
economic, and natural systems will determine the viability of the city in the decades to come,
even as questions surrounding political, infrastructure, and ecosystem capital continue to persist.
Despite these continuing questions as the second decade of recovery begins, New Orleanians
continue to live by the credo set forth by former Times-Picayune writer Chris Rose, “...as bad as
it is here, it's better than being somewhere else."
42
REFERENCES
Adger, W.N. 2000. Social and Ecological: Are They Related? Progress in Human Geography
24(3):347-364.
BP Press Office. 2015. “BP to settle federal, state and local Deepwater Horizon claims for up to
$18.7 billion with payments to be spread over 18 years.” British Petroleum. Web.
Campanella, R. 2006. Geographies of New Orleans. Center for Louisiana Studies. Lafayette.
Campanella, R. 2008. Bienville’s Dilemma: A Historical Geography of New Orleans. Center for
Louisiana Studies. Lafayette.
Carpenter,S., B. Walker, J. M. Anderies, and N. Abel. 2001. From metaphor to measurement:
Resilience of what to what? Ecosystems 4:765-781.
Cutter, S.L., Burton, C, and Emrich, C. 2010. Disaster Resilience Indicators for Benchmarking
Baseline Conditions. Journal of Homeland Security and Emergency Management. 7
[2010], No. 1, Article 51.
DeFrank, Lauren. 2009. Resiliency of New Orleans Following Hurricane Katrina: A Study of
Communities Three Years After the Storm. Thesis. Louisiana State University. (n.d.): n.
pag. Print.
Federal Emergency Management Agency. 2006. High Water Mark Collection for Hurricane
Katrina in Louisiana. Retrieved from
https://www.fema.gov/pdf/hazard/flood/recoverydata/katrina/katrina_la_hwm_public.pdf
Gunderson, L.H. 2000. Ecological resilience – in theory and application. Annual Review of
Ecology and Systematics 31:425-39.
Holling, C.S. 1973. Resilience and stability of ecological systems. Annual Review of Ecology
and Systematics 4:1-23.
Holling, C.S. 1996. Surprise for science, resilience for ecosystems, and incentives for people.
Ecological Applications 6(3):733-735.
Kendall, John S. 1922. History of New Orleans. Chicago: Lewis Pub. Print.
Lam, N.S.N., Reams M.A., Li K, Li C, Mata L. 2015. “Measuring Community Resilience to
Coastal Hazards along the Northern Gulf of Mexico”, Natural Hazards Review.
http://ascelibrary.org/doi/full/10.1061/(ASCE)NH.1527-6996.0000193.
43
Landphair, J. 2007. “The Forgotten People of New Orleans”: Community, vulnerability, and the
Lower Ninth Ward. The Journal American History 94(3):837-845.
Leong, Karen J., et al. 2007. Resilient history and the rebuilding of a community: The
Vietnamese American community in New Orleans East. The Journal of American
History 94.3: 770-779.
Lewis, Peirce F. 2003. New Orleans: The making of an urban landscape.
Lewis, Ted. 2015. "Designed to Be 'Greatest Building in the History of Mankind' Superdome
Still Amazes Even on 40th Birthday." New Orleans Advocate. New Orleans Advocate,
Web.
Li, Kenan. 2011. Temporal Changes of Coastal Community Resilience in the Gulf of Mexico
Region. Thesis. Louisiana State University. (n.d.): n. pag. Print.
McKiven, Henry M. 2007. The Political Construction of a Natural Disaster: The Yellow Fever
Epidemic of 1853. The Journal of American History 94.3: 734-742.
New Orleans District. 2015. HSDRRS. U.S. Army Corps of Engineers, n.d. Web.
Ortiz, E., and Plyer, A. 2011. Valassis Lists Data as an Indicator of Population Recovery in the
New Orleans Area. The Data Center. Web.
Plyer, Allison. Facts for Features: Katrina Impact. 2014. The Data Center Facts for Features
Katrina Impact Comments. The Data Center. Web.
Plyer, A., Bonaguro, J., & Hodges, K. 2010. Using administrative data to estimate population
displacement and resettlement following a catastrophic U.S. disaster. Population and
Environment, 31(1–3), 150–175.
Plyer, A., Shrinath, N., and Mack, V. 2015. The New Orleans Index at Ten: Measuring Greater
New Orleans’ Progress toward Prosperity Impact Comments. The Data Center. Web.
Reams MA, Lam NSN, Baker A. 2012. Measuring capacity for resilience among coastal counties
of the U.S. Northern Gulf of Mexico Region. American Journal of Climate Change
1:194-204.
Sheets, B. and J. Williams. 2001. Hurricane Watch: Forecasting the Deadliest Storms on Earth.
Vintage Books. New York.
Strahan, Jerry E. 1994. Andrew Jackson Higgins and the boats that won World War II. LSU
Press.

44
Walker, B.H., J.M. Anderies, A.P. Kinzig, and P. Ryan. 2006. Exploring resilience in social-
ecological systems through comparative studies and theory development: introduction to
the special issue. Ecology and Society 11(1):12.

45
APPENDIX A: MAIL DELIVERY DATA TO ACTIVE RESIDENTIAL ADDRESSES BY
NEIGHBORHOOD
Neighborhood Jun-05 Jun-08 Jun-09 Jun-10 Jun-11 Jun-12 Jun-13 Jun-14 Jun-15
%
Change
June
2010-
%
Recovery
June 2015
Algiers Point 1,322 1,351 1,417 1,429 1,395 1,402 1,406 1,464 1,479 3.5% 111.9%
Audubon 7,576 7,344 7,292 7,319 7,388 7,390 7,386 7,424 7,433 1.6% 98.1%
B.W. Cooper 1,269 357 345 379 382 411 619 446 579 52.8% 45.6%
Bayou St. John 2,292 1,921 1,976 2,027 2,027 2,077 2,118 2,133 2,139 5.5% 93.3%
Behrman 3,878 3,697 3,832 3,670 3,341 3,294 3,316 3,257 3,265 -11.0% 84.2%
Black Pearl 1,115 1,107 1,082 1,082 1,110 1,123 1,126 1,154 1,170 8.1% 104.9%
Broadmoor 3,139 2,551 2,324 2,378 2,469 2,534 2,610 2,671 2,725 14.6% 86.8%
Bywater 2,570 2,091 2,165 2,181 2,208 2,324 2,372 2,414 2,478 13.6% 96.4%
Central Business District 1,316 1,585 1,939 2,060 2,357 2,635 2,799 2,917 3,415 65.8% 259.5%
Central City 8,175 6,405 6,233 6,417 7,062 7,322 7,517 7,725 7,980 24.4% 97.6%
City Park 1,670 1,534 1,585 1,600 1,632 1,645 1,645 1,651 1,613 0.8% 96.6%
Desire Dev & Neighborhood 1,555 565 660 812 1,020 1,053 1,073 1,085 1,102 35.7% 70.9%
Dillard 2,608 1,728 1,767 2,040 2,354 2,349 2,408 2,309 2,264 11.0% 86.8%
Dixon 631 453 529 565 598 615 621 604 621 9.9% 98.4%
East Carrollton 2,286 2,275 2,276 2,244 2,282 2,297 2,312 2,326 2,330 3.8% 101.9%
East Riverside 1,539 1,601 1,472 1,474 1,509 1,533 1,539 1,562 1,568 6.4% 101.9%
Fairgrounds 3,091 2,843 2,919 3,000 3,001 3,025 3,044 3,072 3,079 2.6% 99.6%
Filmore 2,831 1,345 1,480 1,686 2,033 2,096 2,144 2,238 2,302 36.5% 81.3%
Fischer Development 300 294 291 292 328 405 401 412 408 39.7% 136.0%
Florida Area 1,351 457 523 614 642 697 719 740 778 26.7% 57.6%
Florida Development 460 1 2 2 2 3 3 3 4 100.0% 0.9%
French Quarter 4,106 3,917 3,936 3,888 3,984 4,030 4,053 4,144 4,176 7.4% 101.7%
Freret 1,014 671 789 839 865 879 885 892 870 3.7% 85.8%
Garden District 1,216 1,192 1,192 1,179 1,182 1,192 1,191 1,171 1,183 0.3% 97.3%
Gentilly Terrace 4,417 3,380 3,589 3,745 3,939 3,999 4,042 4,085 4,018 7.3% 91.0%
Gentilly Woods 1,512 764 906 979 1,092 1,137 1,149 1,166 1,181 20.6% 78.1%
Gert Town 1,513 1,411 1,547 1,545 1,597 1,719 1,742 1,743 1,768 14.4% 116.9%
Hollygrove 2,751 1,772 1,889 1,995 2,122 2,244 2,282 2,204 2,250 12.8% 81.8%
Holy Cross 2,240 774 1,061 1,226 1,426 1,522 1,562 1,619 1,672 36.4% 74.6%
Iberville Development 830 815 801 646 593 658 651 649 1 -99.8% 0.1%
Irish Channel 1,973 2,002 1,913 1,907 1,940 1,969 1,983 1,991 2,004 5.1% 101.6%
Lake Catherine 733 420 420 439 451 491 498 506 508 15.7% 69.3%
Lake Terrace & Oaks 688 653 657 675 678 684 685 690 685 1.5% 99.6%
Lakeshore/Lake Vista 1,608 1,424 1,482 1,495 1,572 1,554 1,571 1,592 1,593 6.6% 99.1%
Lakeview 4,711 1,912 2,358 2,774 3,133 3,337 3,516 3,636 3,734 34.6% 79.3%
Lakewood 786 590 593 624 670 696 711 720 727 16.5% 92.5%
Leonidas 3,726 3,521 3,485 3,288 3,425 3,494 3,610 3,664 3,705 12.7% 99.4%
Little Woods 16,504 8,907 11,385 12,751 13,743 14,066 14,146 14,267 14,448 13.3% 87.5%
Lower Garden District 4,406 4,073 4,295 4,542 4,656 4,670 4,721 4,796 4,863 7.1% 110.4%
Lower Ninth Ward 5,363 601 1,017 1,271 1,417 1,624 1,697 1,826 1,970 55.0% 36.7%
Marigny 2,133 2,079 2,119 2,128 2,150 2,167 2,160 2,177 2,232 4.9% 104.6%
Marlyville/Fontainebleau 3,010 2,706 2,752 2,792 2,866 2,939 2,959 2,968 2,989 7.1% 99.3%
McDonogh 1,270 1,323 1,281 1,279 1,202 1,222 1,227 1,234 1,157 -9.5% 91.1%
Mid-City 6,634 4,652 4,998 6,217 6,442 6,606 6,667 6,765 6,858 10.3% 103.4%
Milan 3,452 2,720 2,718 2,835 2,959 3,016 3,061 3,122 3,119 10.0% 90.4%
Milneburg 2,273 1,008 1,342 1,450 1,556 1,648 1,691 1,734 1,777 22.6% 78.2%
Navarre 1,528 972 1,153 1,210 1,296 1,317 1,342 1,359 1,370 13.2% 89.7%
New Aurora/English Turn 2,127 2,198 2,123 2,096 2,180 2,187 2,200 2,211 2,086 -0.5% 98.1%
Old Aurora 6,241 6,215 6,187 6,131 6,243 6,227 6,230 6,221 5,951 -2.9% 95.4%
Pines Village 1,864 862 1,161 1,189 1,357 1,495 1,499 1,532 1,573 32.3% 84.4%
Plum Orchard 2,488 1,210 1,407 1,517 1,708 1,778 1,805 1,850 1,882 24.1% 75.6%
Pontchartrain Park 1,024 389 507 566 871 913 910 928 949 67.7% 92.7%
Read Blvd East 3,099 2,162 2,307 2,493 2,635 2,693 2,722 2,752 2,814 12.9% 90.8%
Read Blvd West 2,107 1,104 1,275 1,430 1,689 1,767 1,783 1,823 1,843 28.9% 87.5%
Seventh Ward 6,470 4,665 4,939 5,116 5,481 5,654 5,717 5,769 5,901 15.3% 91.2%
St. Anthony 2,450 1,088 1,395 1,510 1,682 1,728 1,757 1,748 1,806 19.6% 73.7%
St. Bernard Area 1,936 446 420 467 941 1,007 1,058 1,133 1,154 147.1% 59.6%
St. Claude 4,490 2,957 3,276 3,454 3,508 3,651 3,732 3,901 3,986 15.4% 88.8%
St. Roch 4,735 2,804 3,105 3,255 3,277 3,417 3,519 3,617 3,799 16.7% 80.2%
St. Thomas Development 386 627 862 1,091 1,123 1,132 1,136 1,150 1,174 7.6% 304.1%
Tall Timbers/Brechtel 5,504 4,679 4,710 4,811 5,238 5,252 5,232 5,250 5,304 10.2% 96.4%
Touro 1,829 1,803 1,752 1,761 1,741 1,764 1,762 1,766 1,754 -0.4% 95.9%
Treme'/Lafitte 3,556 2,520 2,291 2,247 2,454 2,550 2,631 2,686 2,792 24.3% 78.5%
Tulane/Gravier 1,830 1,215 1,237 1,684 1,590 1,621 1,719 1,770 1,833 8.8% 100.2%
U.S. Naval Support Area 1,404 1,106 1,041 1,016 1,074 884 862 889 895 -11.9% 63.7%
Uptown 3,329 3,274 3,202 3,201 3,278 3,303 3,315 3,267 3,277 2.4% 98.4%
Viavant/Venetian Isles 616 383 328 380 415 428 434 440 428 12.6% 69.5%
Village de l'est 3,948 2,322 2,642 2,701 2,726 2,763 2,775 2,799 2,783 3.0% 70.5%
West End 2,711 1,218 1,511 1,702 1,850 1,937 2,031 2,104 2,185 28.4% 80.6%
West Lake Forest 3,822 1,276 1,399 1,570 1,681 1,755 2,043 2,061 2,100 33.8% 54.9%
West Riverside 2,838 2,864 2,720 2,706 2,756 2,791 2,795 2,839 2,844 5.1% 100.2%
Whitney 1,006 1,007 995 1,009 994 999 1,008 1,026 1,031 2.2% 102.5%
Unknown (could not be geocoded) 276 16 13 22 19 19 27 29 32 45.5% 11.6%
Total 203,457 146,174 154,592 162,115 170,607 174,825 177,682 179,888 181,766 12.1% 89.3%

46
Neighborhood Jun-05 Jun-08 Jun-09 Jun-10 Jun-11 Jun-12 Jun-13 Jun-14 Jun-15
%
Change
June
2010-
%
Recovery
June 2015
Algiers Point 1,322 1,351 1,417 1,429 1,395 1,402 1,406 1,464 1,479 3.5% 111.9%
Audubon 7,576 7,344 7,292 7,319 7,388 7,390 7,386 7,424 7,433 1.6% 98.1%
B.W. Cooper 1,269 357 345 379 382 411 619 446 579 52.8% 45.6%
Bayou St. John 2,292 1,921 1,976 2,027 2,027 2,077 2,118 2,133 2,139 5.5% 93.3%
Behrman 3,878 3,697 3,832 3,670 3,341 3,294 3,316 3,257 3,265 -11.0% 84.2%
Black Pearl 1,115 1,107 1,082 1,082 1,110 1,123 1,126 1,154 1,170 8.1% 104.9%
Broadmoor 3,139 2,551 2,324 2,378 2,469 2,534 2,610 2,671 2,725 14.6% 86.8%
Bywater 2,570 2,091 2,165 2,181 2,208 2,324 2,372 2,414 2,478 13.6% 96.4%
Central Business District 1,316 1,585 1,939 2,060 2,357 2,635 2,799 2,917 3,415 65.8% 259.5%
Central City 8,175 6,405 6,233 6,417 7,062 7,322 7,517 7,725 7,980 24.4% 97.6%
City Park 1,670 1,534 1,585 1,600 1,632 1,645 1,645 1,651 1,613 0.8% 96.6%
Desire Dev & Neighborhood 1,555 565 660 812 1,020 1,053 1,073 1,085 1,102 35.7% 70.9%
Dillard 2,608 1,728 1,767 2,040 2,354 2,349 2,408 2,309 2,264 11.0% 86.8%
Dixon 631 453 529 565 598 615 621 604 621 9.9% 98.4%
East Carrollton 2,286 2,275 2,276 2,244 2,282 2,297 2,312 2,326 2,330 3.8% 101.9%
East Riverside 1,539 1,601 1,472 1,474 1,509 1,533 1,539 1,562 1,568 6.4% 101.9%
Fairgrounds 3,091 2,843 2,919 3,000 3,001 3,025 3,044 3,072 3,079 2.6% 99.6%
Filmore 2,831 1,345 1,480 1,686 2,033 2,096 2,144 2,238 2,302 36.5% 81.3%
Fischer Development 300 294 291 292 328 405 401 412 408 39.7% 136.0%
Florida Area 1,351 457 523 614 642 697 719 740 778 26.7% 57.6%
Florida Development 460 1 2 2 2 3 3 3 4 100.0% 0.9%
French Quarter 4,106 3,917 3,936 3,888 3,984 4,030 4,053 4,144 4,176 7.4% 101.7%
Freret 1,014 671 789 839 865 879 885 892 870 3.7% 85.8%
Garden District 1,216 1,192 1,192 1,179 1,182 1,192 1,191 1,171 1,183 0.3% 97.3%
Gentilly Terrace 4,417 3,380 3,589 3,745 3,939 3,999 4,042 4,085 4,018 7.3% 91.0%
Gentilly Woods 1,512 764 906 979 1,092 1,137 1,149 1,166 1,181 20.6% 78.1%
Gert Town 1,513 1,411 1,547 1,545 1,597 1,719 1,742 1,743 1,768 14.4% 116.9%
Hollygrove 2,751 1,772 1,889 1,995 2,122 2,244 2,282 2,204 2,250 12.8% 81.8%
Holy Cross 2,240 774 1,061 1,226 1,426 1,522 1,562 1,619 1,672 36.4% 74.6%
Iberville Development 830 815 801 646 593 658 651 649 1 -99.8% 0.1%
Irish Channel 1,973 2,002 1,913 1,907 1,940 1,969 1,983 1,991 2,004 5.1% 101.6%
Lake Catherine 733 420 420 439 451 491 498 506 508 15.7% 69.3%
Lake Terrace & Oaks 688 653 657 675 678 684 685 690 685 1.5% 99.6%
Lakeshore/Lake Vista 1,608 1,424 1,482 1,495 1,572 1,554 1,571 1,592 1,593 6.6% 99.1%
Lakeview 4,711 1,912 2,358 2,774 3,133 3,337 3,516 3,636 3,734 34.6% 79.3%
Lakewood 786 590 593 624 670 696 711 720 727 16.5% 92.5%
Leonidas 3,726 3,521 3,485 3,288 3,425 3,494 3,610 3,664 3,705 12.7% 99.4%
Little Woods 16,504 8,907 11,385 12,751 13,743 14,066 14,146 14,267 14,448 13.3% 87.5%
Lower Garden District 4,406 4,073 4,295 4,542 4,656 4,670 4,721 4,796 4,863 7.1% 110.4%
Lower Ninth Ward 5,363 601 1,017 1,271 1,417 1,624 1,697 1,826 1,970 55.0% 36.7%
Marigny 2,133 2,079 2,119 2,128 2,150 2,167 2,160 2,177 2,232 4.9% 104.6%
Marlyville/Fontainebleau 3,010 2,706 2,752 2,792 2,866 2,939 2,959 2,968 2,989 7.1% 99.3%
McDonogh 1,270 1,323 1,281 1,279 1,202 1,222 1,227 1,234 1,157 -9.5% 91.1%
Mid-City 6,634 4,652 4,998 6,217 6,442 6,606 6,667 6,765 6,858 10.3% 103.4%
Milan 3,452 2,720 2,718 2,835 2,959 3,016 3,061 3,122 3,119 10.0% 90.4%
Milneburg 2,273 1,008 1,342 1,450 1,556 1,648 1,691 1,734 1,777 22.6% 78.2%
Navarre 1,528 972 1,153 1,210 1,296 1,317 1,342 1,359 1,370 13.2% 89.7%
New Aurora/English Turn 2,127 2,198 2,123 2,096 2,180 2,187 2,200 2,211 2,086 -0.5% 98.1%
Old Aurora 6,241 6,215 6,187 6,131 6,243 6,227 6,230 6,221 5,951 -2.9% 95.4%
Pines Village 1,864 862 1,161 1,189 1,357 1,495 1,499 1,532 1,573 32.3% 84.4%
Plum Orchard 2,488 1,210 1,407 1,517 1,708 1,778 1,805 1,850 1,882 24.1% 75.6%
Pontchartrain Park 1,024 389 507 566 871 913 910 928 949 67.7% 92.7%
Read Blvd East 3,099 2,162 2,307 2,493 2,635 2,693 2,722 2,752 2,814 12.9% 90.8%
Read Blvd West 2,107 1,104 1,275 1,430 1,689 1,767 1,783 1,823 1,843 28.9% 87.5%
Seventh Ward 6,470 4,665 4,939 5,116 5,481 5,654 5,717 5,769 5,901 15.3% 91.2%
St. Anthony 2,450 1,088 1,395 1,510 1,682 1,728 1,757 1,748 1,806 19.6% 73.7%
St. Bernard Area 1,936 446 420 467 941 1,007 1,058 1,133 1,154 147.1% 59.6%
St. Claude 4,490 2,957 3,276 3,454 3,508 3,651 3,732 3,901 3,986 15.4% 88.8%
St. Roch 4,735 2,804 3,105 3,255 3,277 3,417 3,519 3,617 3,799 16.7% 80.2%
St. Thomas Development 386 627 862 1,091 1,123 1,132 1,136 1,150 1,174 7.6% 304.1%
Tall Timbers/Brechtel 5,504 4,679 4,710 4,811 5,238 5,252 5,232 5,250 5,304 10.2% 96.4%
Touro 1,829 1,803 1,752 1,761 1,741 1,764 1,762 1,766 1,754 -0.4% 95.9%
Treme'/Lafitte 3,556 2,520 2,291 2,247 2,454 2,550 2,631 2,686 2,792 24.3% 78.5%
Tulane/Gravier 1,830 1,215 1,237 1,684 1,590 1,621 1,719 1,770 1,833 8.8% 100.2%
U.S. Naval Support Area 1,404 1,106 1,041 1,016 1,074 884 862 889 895 -11.9% 63.7%
Uptown 3,329 3,274 3,202 3,201 3,278 3,303 3,315 3,267 3,277 2.4% 98.4%
Viavant/Venetian Isles 616 383 328 380 415 428 434 440 428 12.6% 69.5%
Village de l'est 3,948 2,322 2,642 2,701 2,726 2,763 2,775 2,799 2,783 3.0% 70.5%
West End 2,711 1,218 1,511 1,702 1,850 1,937 2,031 2,104 2,185 28.4% 80.6%
West Lake Forest 3,822 1,276 1,399 1,570 1,681 1,755 2,043 2,061 2,100 33.8% 54.9%
West Riverside 2,838 2,864 2,720 2,706 2,756 2,791 2,795 2,839 2,844 5.1% 100.2%
Whitney 1,006 1,007 995 1,009 994 999 1,008 1,026 1,031 2.2% 102.5%
Unknown (could not be geocoded) 276 16 13 22 19 19 27 29 32 45.5% 11.6%
Total 203,457 146,174 154,592 162,115 170,607 174,825 177,682 179,888 181,766 12.1% 89.3%

47
APPENDIX B: SOCIOECONOMIC VARIABLES FOR NEIGHBORHOODS
Neighborhood % Recovery June 2015 RACEBLK00 RACEBLK10 FEMHH00 FEMHH10 POPBCH00 POPBCH10 HHINC00 HHINC10 OOHOU00 OOHOU10 MEDRENT AVGFLD
Central Business District 259.5% 0.3290 0.2311 0.0090 0.0111 0.2545 0.3342 93198.6182 75993.9582 0.2320 0.3579 977.8813 2.2204
Fischer Development 136.0% 0.9920 0.9741 0.6330 0.3755 0.0194 0.0828 17790.4172 23700.3497 0.1210 0.1561 332.8829 0.0000
Gert Town 116.9% 0.9450 0.8760 0.1950 0.1849 0.0458 0.0615 31260.2543 25011.3328 0.2420 0.2491 771.0989 9.1932
Algiers Point 111.9% 0.2510 0.2248 0.0770 0.0708 0.1739 0.1831 72285.8879 84864.5057 0.4800 0.4662 838.9344 0.0000
Lower Garden District 110.4% 0.3420 0.1892 0.0680 0.0310 0.2422 0.3509 78520.3436 103239.9673 0.2480 0.3086 1019.0595 0.0001
Black Pearl 104.9% 0.3670 0.2151 0.0680 0.0438 0.2585 0.3103 59420.5716 58712.0000 0.3810 0.4103 903.1423 0.0000
Marigny 104.6% 0.1770 0.1271 0.0300 0.0144 0.1882 0.2368 49283.9705 63579.2560 0.3290 0.3626 777.7000 0.0175
Mid-City 103.4% 0.6430 0.5498 0.1590 0.1457 0.0722 0.1301 43327.9105 38889.2973 0.2790 0.2398 774.7446 9.7176
Whitney 102.5% 0.8500 0.8338 0.2730 0.2119 0.0661 0.0885 46320.4525 42929.3779 0.5040 0.4490 787.1391 0.0000
East Carrollton 101.9% 0.3150 0.1966 0.0770 0.0537 0.2944 0.3006 82106.2174 71843.2059 0.3920 0.3911 937.8601 0.7038
East Riverside 101.9% 0.6390 0.4142 0.1570 0.0695 0.1094 0.2268 44055.0349 55361.8182 0.4290 0.4856 849.5935 0.0000
French Quarter 101.7% 0.0430 0.0435 0.0100 0.0076 0.2929 0.2977 80711.5410 100320.1003 0.2460 0.3226 1021.7175 0.1208
Irish Channel 101.6% 0.6840 0.3988 0.1920 0.0757 0.1500 0.2770 41887.3573 60744.4578 0.3740 0.4270 952.4070 0.0000
West Riverside 100.2% 0.3610 0.2281 0.0930 0.0546 0.2073 0.3221 67262.8656 74440.9903 0.4080 0.4601 933.6547 0.0000
Tulane/Gravier 100.2% 0.7820 0.7117 0.2070 0.2087 0.1001 0.1009 22832.3376 28974.0678 0.1930 0.1375 633.1946 9.5235
Fairgrounds 99.6% 0.6900 0.6402 0.1310 0.1118 0.1224 0.1679 53759.5141 47267.2771 0.4360 0.4335 880.1922 8.0582
Lake Terrace & Oaks 99.6% 0.1890 0.2593 0.0130 0.0275 0.1984 0.3933 155458.0396 146581.4727 0.9510 0.6782 805.6818 2.0171
Leonidas 99.4% 0.7550 0.6203 0.1870 0.1333 0.1141 0.1856 44118.9605 51215.5735 0.4180 0.4439 751.1100 4.3804
Marlyville/Fontainebleau 99.3% 0.2790 0.2392 0.0810 0.0737 0.2599 0.3230 82773.2428 87450.3046 0.5200 0.5375 1045.2525 8.1014
Lakeshore/Lake Vista 99.1% 0.0060 0.0214 0.0400 0.0383 0.3419 0.3789 153874.9560 125472.9181 0.8570 0.8376 1149.5413 3.8809
Uptown 98.4% 0.3600 0.2181 0.0800 0.0411 0.2503 0.3585 76179.3148 107832.1464 0.4340 0.4646 990.3226 1.6434
Dixon 98.4% 0.9490 0.9031 0.2290 0.2250 0.0741 0.1034 34586.3487 35623.5529 0.4210 0.3615 841.9162 9.7927
Audubon 98.1% 0.0510 0.0479 0.0270 0.0270 0.2779 0.2796 150153.3391 153702.1792 0.5430 0.5575 1388.5686 2.9749
New Aurora/English Turn 98.1% 0.6810 0.6339 0.2140 0.1580 0.0907 0.1312 86730.8659 104242.0085 0.7280 0.7473 698.0354 0.0000
Central City 97.6% 0.8710 0.7237 0.2400 0.1366 0.0678 0.1213 32021.1886 35687.0826 0.1630 0.2307 626.4618 4.8423
Garden District 97.3% 0.0270 0.0322 0.0150 0.0103 0.4222 0.4694 124988.5743 128701.2435 0.4910 0.5268 1153.2300 0.0114
City Park 96.6% 0.0940 0.0764 0.0510 0.0352 0.2934 0.3899 64798.1230 76162.4519 0.4200 0.4202 956.4498 12.2110
Bywater 96.4% 0.6100 0.3311 0.1580 0.0658 0.1212 0.2828 37544.7143 54024.2708 0.3810 0.4237 779.4118 1.5779
Tall Timbers/Brechtel 96.4% 0.5460 0.6981 0.1570 0.1688 0.1649 0.1499 73420.8387 57807.1199 0.3540 0.3734 745.4921 0.0000
Touro 95.9% 0.1840 0.1448 0.0200 0.0121 0.2920 0.3835 66344.2206 71375.6656 0.3230 0.3352 1052.0496 0.1740
Old Aurora 95.4% 0.3090 0.5450 0.0960 0.1352 0.2175 0.2197 77750.8135 66867.8664 0.7370 0.6345 782.1449 0.0000
Bayou St. John 93.3% 0.6780 0.4902 0.1730 0.0942 0.1262 0.2007 50037.2303 51746.3987 0.3500 0.4142 799.5851 6.5579
Pontchartrain Park 92.7% 0.9670 0.9717 0.1150 0.1906 0.1851 0.1352 60729.0318 38441.1765 0.9210 0.7967 805.5556 17.0492
Lakewood 92.5% 0.0170 0.0402 0.0290 0.0352 0.2985 0.2691 212201.0075 179088.6179 0.9170 0.8842 2238.4615 8.1843
Seventh Ward 91.2% 0.9360 0.8736 0.2330 0.1914 0.0499 0.0882 36544.0902 29840.1300 0.3320 0.3522 678.1756 7.6666
McDonogh 91.1% 0.8760 0.8670 0.2350 0.1952 0.0914 0.0480 37401.7981 32552.9470 0.4790 0.4455 671.0824 0.0000
Gentilly Terrace 91.0% 0.6970 0.7777 0.1530 0.1692 0.1641 0.1530 58318.9094 53599.1754 0.6870 0.6386 861.2261 9.6376
Read Blvd East 90.8% 0.7330 0.8116 0.1140 0.1351 0.1763 0.1405 85052.9619 63508.9113 0.8860 0.8771 760.4839 12.1608
Milan 90.4% 0.7380 0.5904 0.1760 0.1341 0.1348 0.2211 50242.9563 55291.9452 0.3300 0.3904 842.2606 7.6905
Navarre 89.7% 0.0320 0.0505 0.0630 0.0563 0.2556 0.2957 75007.3133 70502.0084 0.5590 0.5330 924.0891 9.6004
St. Claude 88.8% 0.9050 0.8110 0.2620 0.1718 0.0719 0.0696 41066.9197 29029.4951 0.4490 0.4888 738.1790 5.4483
Little Woods 87.5% 0.8610 0.9262 0.2140 0.2416 0.1425 0.0840 59553.0679 40222.4630 0.5140 0.5087 732.6653 8.2308
Read Blvd West 87.5% 0.7980 0.9262 0.1490 0.1962 0.1213 0.0872 62427.9586 40498.0880 0.8510 0.7850 762.2642 10.5308
Broadmoor 86.8% 0.6820 0.6110 0.1720 0.1734 0.1370 0.2013 50158.0138 58215.6723 0.4810 0.4780 920.5304 10.5200
Dillard 86.8% 0.8840 0.9126 0.1470 0.1462 0.1190 0.1527 48359.1045 39013.8843 0.5790 0.5755 713.9001 9.0640
Freret 85.8% 0.8260 0.7201 0.2100 0.2130 0.0608 0.1176 56065.3348 46938.4848 0.3540 0.3843 692.9412 9.6652
Pines Village 84.4% 0.8750 0.9487 0.2510 0.2654 0.0724 0.0722 59786.4596 48098.6891 0.6350 0.5173 707.1856 9.1904
Behrman 84.2% 0.7740 0.8146 0.2610 0.2287 0.0671 0.0794 41903.7575 40574.3799 0.4710 0.5280 742.7867 0.0000
Hollygrove 81.8% 0.9470 0.9390 0.2240 0.2164 0.0626 0.0789 42248.2878 32664.8564 0.5420 0.5065 662.3404 9.8023
Filmore 81.3% 0.5690 0.7050 0.1000 0.1239 0.1829 0.1679 79776.9817 70679.8960 0.8560 0.7672 1015.1603 14.5668
West End 80.6% 0.0170 0.1103 0.0460 0.0638 0.2178 0.2880 96335.5208 77560.5801 0.6070 0.5680 1036.8664 12.1943
St. Roch 80.2% 0.9150 0.8682 0.2530 0.1966 0.0624 0.0669 38970.4234 29135.9494 0.4220 0.4505 624.5091 9.8446
Lakeview 79.3% 0.0070 0.0339 0.0540 0.0509 0.2857 0.3970 88170.9249 97926.1763 0.6950 0.6882 1223.5813 15.8388
Treme'/Lafitte 78.5% 0.9240 0.7446 0.3220 0.1302 0.0517 0.1361 26959.6673 33409.4634 0.2180 0.3429 634.3705 6.5061
Milneburg 78.2% 0.7540 0.8699 0.1640 0.1960 0.1181 0.0917 58356.4500 40925.1105 0.7120 0.6028 860.9524 17.2535
Gentilly Woods 78.1% 0.6840 0.6933 0.1120 0.1331 0.1567 0.0911 57182.9022 50583.5616 0.7570 0.6336 870.0000 12.0409
Plum Orchard 75.6% 0.9310 0.9570 0.2300 0.2390 0.0973 0.0841 45120.8421 36214.0441 0.5740 0.5886 688.1517 10.1494
Holy Cross 74.6% 0.8750 0.8928 0.2510 0.2173 0.0541 0.0771 44375.1112 36462.5272 0.4180 0.5548 728.1915 2.5073
St. Anthony 73.7% 0.5800 0.7330 0.1550 0.2378 0.1487 0.0858 52321.0305 38428.8716 0.5750 0.4385 663.5569 16.7074
Desire Dev & Neighborhood 70.9% 0.9470 0.9526 0.2810 0.3260 0.0380 0.0046 35041.6036 28786.2185 0.4392 0.5044 363.6029 9.2155
Village de L'est 70.5% 0.5540 0.4342 0.2420 0.1657 0.0915 0.0819 50788.6758 40926.1661 0.4710 0.6363 636.4030 3.4878
Viavant/Venetian Isles 69.5% 0.7650 0.6143 0.2720 0.1163 0.0854 0.0256 28380.6123 20703.2086 0.2760 0.2122 511.1842 2.7042
Lake Catherine 69.3% 0.0200 0.0628 0.0250 0.0274 0.1023 0.1388 75464.0574 71489.3939 0.9020 0.9288 2.7042
U.S. Naval Support Area 63.7% 0.6320 0.6698 0.1590 0.1468 0.0841 0.0796 50580.6375 47594.8317 0.5050 0.4863 872.9050 0.0000
St. Bernard Area 59.6% 0.9780 0.9055 0.4920 0.2060 0.0204 0.1065 27535.7996 28482.9982 0.1700 0.4938 558.3333 12.5388
Florida Area 57.6% 0.9840 0.9647 0.2040 0.2071 0.0346 0.0498 40369.2840 29450.2049 0.5850 0.6450 649.2537 11.8195
West Lake Forest 54.9% 0.9530 0.9572 0.2830 0.3011 0.1216 0.1296 44516.6113 35079.8280 0.2380 0.3672 763.8462 12.3192
B.W. Cooper 45.6% 0.9840 0.9082 0.5910 0.2830 0.0031 0.0820 18277.0172 16130.6709 0.0390 0.0723 310.0324 7.4402
Lower Ninth Ward 36.7% 0.9830 0.9546 0.2490 0.1866 0.0468 0.0393 37894.0966 33557.3696 0.5900 0.6645 591.5493 12.0043
2000 2010 2000 2010 2000 2010 2000 2010 2000 2010 NA
0.6029 0.5719 0.1689 0.1386 0.1467 0.1791 61859.2650 59014.0900 0.4844 0.49256.2899
Orleans Parish
Δ 2000-2010 -0.0310 -0.0302 0.0324 -2845.1750 0.0081823.7211
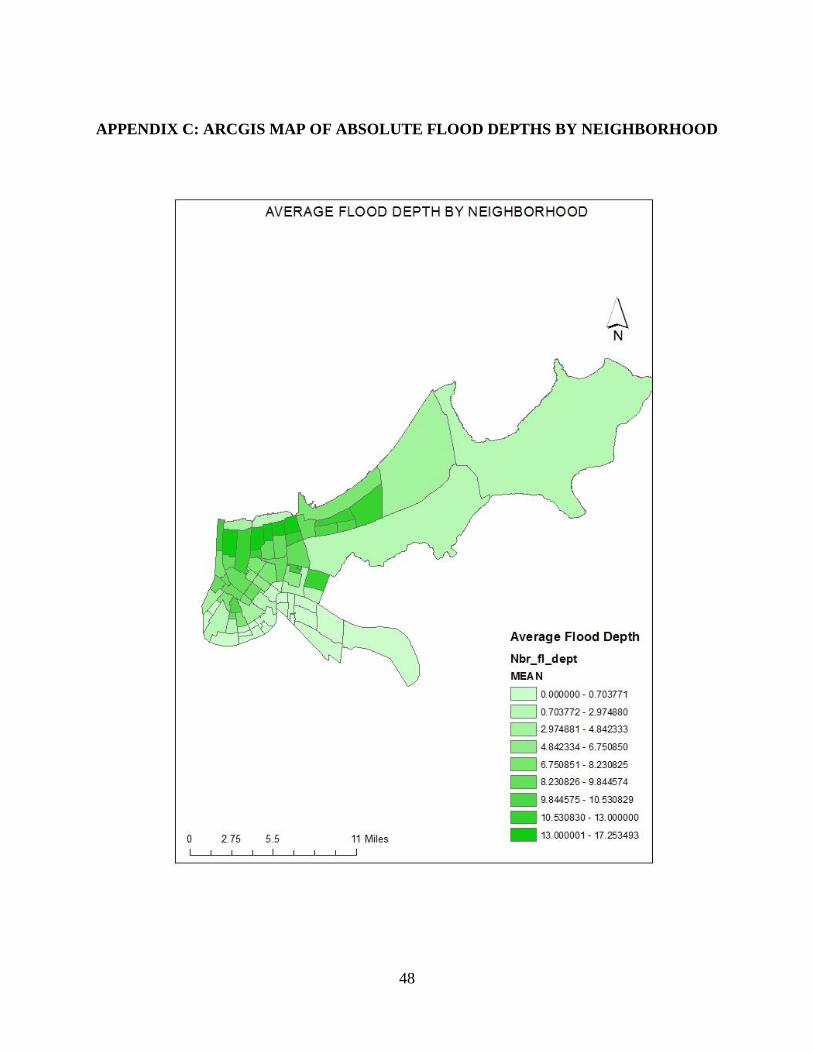
48
APPENDIX C: ARCGIS MAP OF ABSOLUTE FLOOD DEPTHS BY NEIGHBORHOOD

49
APPENDIX D: POPULATION COUNT FOR NEW ORLEANS NEIGHBORHOODS
Total numbers
(2010)Population
Total
households
Algiers Point 2,455 1,229
Audubon 15,865 5,335
B.W. Cooper 806 318
Bayou St. John 3,529 1,719
Behrman 8,064 2,877
Black Pearl 1,734 936
Broadmoor 5,381 2,203
Bywater 3,337 1,763
Central Business
District2,276 1,260
Central City 11,257 5,279
City Park 2,708 1,447
Desire Dev &
Neighborhood2,005 678
Dillard 4,373 1,901
Dixon 1,270 520
East Carrollton 4,253 2,084
East Riverside 2,699 1,324
Fairgrounds 5,192 2,496
Filmore 4,227 1,654
Fischer
Development849 269
Florida Area 1,302 507
Florida
Development6 2
French Quarter 3,813 2,635
Freret 1,715 648
Garden District 1,926 1,063
Gentilly Terrace 8,210 3,351
Gentilly Woods 2,817 999
Gert Town 3,614 1,060
Hollygrove 4,377 1,761
Holy Cross 2,714 1,040
Iberville
Development1,238 482
Irish Channel 3,373 1,665
Lake Catherine 892 365
Lake Terrace &
Oaks2,464 982
Lakeshore/
Lake Vista3,453 1,435
Lakeview 6,394 2,672
Lakewood 1,642 596
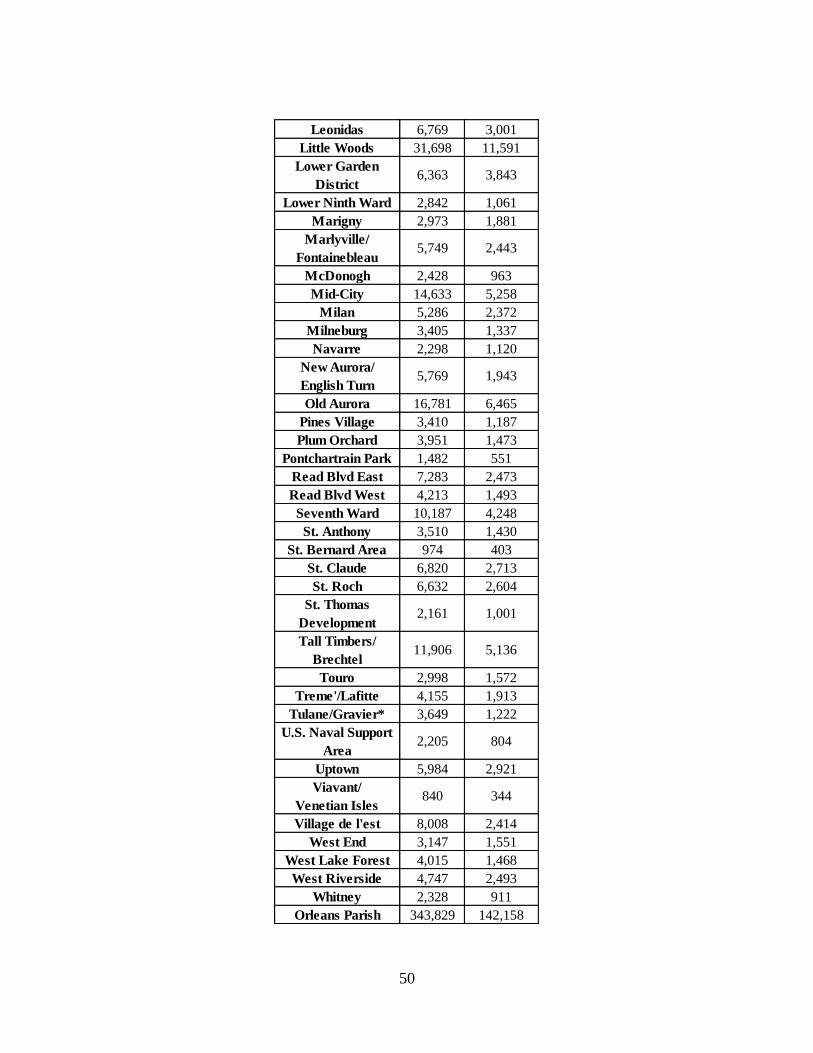
50
Leonidas 6,769 3,001
Little Woods 31,698 11,591
Lower Garden
District6,363 3,843
Lower Ninth Ward 2,842 1,061
Marigny 2,973 1,881
Marlyville/
Fontainebleau5,749 2,443
McDonogh 2,428 963
Mid-City 14,633 5,258
Milan 5,286 2,372
Milneburg 3,405 1,337
Navarre 2,298 1,120
New Aurora/
English Turn5,769 1,943
Old Aurora 16,781 6,465
Pines Village 3,410 1,187
Plum Orchard 3,951 1,473
Pontchartrain Park 1,482 551
Read Blvd East 7,283 2,473
Read Blvd West 4,213 1,493
Seventh Ward 10,187 4,248
St. Anthony 3,510 1,430
St. Bernard Area 974 403
St. Claude 6,820 2,713
St. Roch 6,632 2,604
St. Thomas
Development2,161 1,001
Tall Timbers/
Brechtel11,906 5,136
Touro 2,998 1,572
Treme'/Lafitte 4,155 1,913
Tulane/Gravier* 3,649 1,222
U.S. Naval Support
Area2,205 804
Uptown 5,984 2,921
Viavant/
Venetian Isles840 344
Village de l'est 8,008 2,414
West End 3,147 1,551
West Lake Forest 4,015 1,468
West Riverside 4,747 2,493
Whitney 2,328 911
Orleans Parish 343,829 142,158
51
VITA
Paul Ramnauth Algu, a native of Gretna, Louisiana and alumnus of Brother Martin High School,
received his bachelor’s degree in Environmental Management Systems at Louisiana State
University in 2011. He worked for three years at PPM Consultants, Inc. in Baton Rouge,
Louisiana, in environmental compliance and began to develop an interest in policy formation and
implementation, especially in the greater New Orleans area. He began his graduate career in the
School of Coast and Environment at Louisiana State University in 2013 and is a candidate for
graduation in December of 2015.