A Study of Radiologists Viewing Multiple CT Scans Using … · A Study of Radiologists Viewing...
20
A Study of Radiologists Viewing Multiple CT Scans Using An Eyetracking Device TR89-039 December, 1989 David V. Beard, R. Eugene Johnston Osamu Toki, Claire Wilcox Medical Image Display Group Department of Computer Science Department of Radiation Oncology Department of Radiology The University of North Carolina Chapel Hill, NC 27599-3175 UNC is an Equal Opportunity/ Affirmative Action Institution.
Transcript of A Study of Radiologists Viewing Multiple CT Scans Using … · A Study of Radiologists Viewing...
A Study of Radiologists Viewing Multiple CT Scans Using An Eyetracking Device
TR89-039 December, 1989
David V. Beard, R. Eugene Johnston Osamu Toki, Claire Wilcox
Medical Image Display Group Department of Computer Science Department of Radiation Oncology Department of Radiology
The University of North Carolina Chapel Hill, NC 27599-3175
UNC is an Equal Opportunity/ Affirmative Action Institution.
A STUDY OF RADIOLOGISTS VIEWING MULTIPLE CT SCANS USING AN EYETRACKING DEVICE
David V. Beard, Ph.D.1·z, R. Eugene Johnston, Ph.D.1,
Osamu Toki2, and Claire Wilcox, M.D.l
I Department of Radiology 2 Department of Computer Science
University of North Carolina. Chapel Hill.
Correspondence should be directed to: David Beard Department Of Radiology CB# 7510 Old Clinic Bldg. UNC-CH, School of Medicine Chapel Hill, NC. 27599-7510 (919) 966-5467
This research was sponsored by NCI ROl CA44060 and POl CA 47982.
A preliminary version of this paper was presented at RSNA, 1989, under the title "Eyetracking as a Means of Studying Image Display Systems."
I
ABSTRACT
Understanding the visual scan patterns radiologists use to view medical images is critical to the de
sign of image viewing devices_ We used an Eyetracker, a device for recording eye and head
movement, to determine the visual scan patterns during the interpretation of single and multiple
computed tomographic (CT) scans presented on a four-over-four viewbox. CT scans were used
because they represent complex viewing situations.
In two separate experiments, radiologists viewed patient folders containing single or multiple CT
chest scans, and dictated a report. Eye movement was recorded with an eyetracker and video cam
era. After mounting the films in order, radiologists generally started with a sequential visual scan
through the entire set of images, followed by careful examination of two to four clusters of one to
four images, followed by dictating the interpretation report.
These results indicate that a well designed radiology workstation should provide an image index,
arbitrarily and sequential movement through the image set, image comparison, and image marking.
Keywords: Human Factors, CT Interpretation, Radiology Workstations.
2
1. INTRODUCTION
Previous insight into the radiologist's interpretation process has been gained from experiments
which recorded eye movements during image interpretation [Kundel 1969, Gale 1983, Rogers
1986, Beard 1987]. Much of this research focused on determining the source of interpretation er
rors. Experienced radiologists employ a variable, though basically, circumferential scan pattern
when reading radiographs [Carmody 1980]. Visual scan patterns develop with experience [Kundel
1972], are affected by prior knowledge [Kundel" 1969], and deviate from textbook recommenda
tions [Gale 1983]. While some studies have suggested that misreadings (false negatives which
range around 30% [Yerushallmy 1969, Smith 1967, Tuddenham 1962]) may occur because large
areas of film are not viewed foveally [Llewellyn-Thomas 1969], or because there is non-uniform
coverage of the film [Tuddenham 1961]. Eyetracking experiments indicate that only about 30% of
missed lung nodules can be attributed to the lesion not having been foveally viewed [Kundel 1978].
More recently, studies have been initiated to determine workstation requirements for interpreting
single small radiographs [Rogers 1989, Carbone 1989].
In 1986, the University of North Carolina developed a fingerpointing study to identify the visual
visual scan patterns (fixation location and fixation duration) used by different radiologists when
reading chest CT scans [Rogers 1986, Beard 1987]. In other words, how often, in what order, and
how long was each image in a CT scan viewed? The accuracy level of fixation location was a single
image (CT SLICE), not locations within the image. Five radiologists each read three CT scans us
ing a four-over-four viewbox. Each CT scan was accompanied by its requisition form, and all its
films could simultaneously fit onto the viewbox. The experimenter sat next to the radiologist and
recorded times for certain activities, information accessed, placement of the films on the viewboxes,
and the visual scan path as indicated by the radiologist. Radiologists were instructed to read and
interpret aCT scan as naturally as possible, except to always point to the image under regard, and
generate verbal descriptions.
3
Despite individual differences, basic similarities were observed among radiologists. Usually, they
started a reading session by sequentially viewing the images while placing them on the viewboxes.
In a second phase, radiologists concentrated (fixated) on several groups or clusters of specific im
ages which were suspect. Finally, during a dictation (or reporting) phase, they scanned the images
in a non-sequential manner fixating on those clusters of images on which they were reponing.
These clusters were small. A cluster was operationally defined as a group of images which were
connected by repeated fixation visual scan paths. ·
. There were two possible sources of error in the fingerpointing approach: First, there was no infor
mation as to where the radiologist actually looked, only where he indicated he was looking. Sec
ond, the radiologist's visual scan path might have been somewhat modified by this task.
We repeated the fingerpointing study using an eyetracker, a device for measuring a subject's eye
movement while performing a visual task. In this study, radiologists read patient folders contain
ing both single and multiple CT scans. As with the fingerpointing study, our objectives were to
determine the following: what visual scan patterns were used, how images in different CT scans are
cross-compared, the size of clusters, how the films are managed on the viewbox space, and how
much time is spent manipulating them.
We first describe the eyetracker study of single CT chest scans presenting the details of the study.
A second eyetracker study is then described in which the radiologists interpret patient folders con
taining multiple CT scans. Finally, we briefly describe the implications this work has on the design
of viable radiology workstations.
4
2. SINGLE CT CHEST SCANS
Patient folders containing single CT chest scans were chosen for the initial eyetracker study. CT
chest scans are representative of the complex image manipulation and viewing tasks performed by
radiologists.
2.1 Equipment and Observers
To determine eye and head movements as the radiologist conducted their reading of medical im
ages, we used an eyetracking device, the Eye Mark Recorder Model V (EMR-V) manufactured by
NAC, Inc (Figure 1). The system has two main components, the head/goggle unit, and the camera
controller unit with remote control. The goggle unit is a head mounted unit that contains the eye
tracking optics and electronics. In operation an infrared LED light source (950 nm wavelength),
which is not sensed by the eye projects a spot of light onto the subject's cornea. The spot is re
flected from the cornea along an optical path, detected by aMOS image device (video camera), and
sent to the camera controller for processing. Besides the MOS image devices for each eye there is a
third "field unit" which observes the central portion of the subjects field of view. The camera
controller provides power to the LED's and video cameras, and superimposes the eye position in
dicator spots onto the video image of the subject's field of view, which is in turn available to a
video monitor and VCR. The unit's field of view is 60 degrees horizontal and 45 degrees vertical
with an accuracy of 0.6 degrees.
PLACE FIGURE 1 HERE
Radiologists need to have freedom to move their heads and bodies in any fashion during the reading
process. While many eyetrackers require fixed head position, the EMR-V allows such movement,
5
and was chosen in order to minimize any intrusion on the radiologists' normal image reading pro
cess. The cost of allowing this freedom caused calibration to be more difficult and necessitated
periodic calibration checks and occasional recalibration. This freedom of movement also compro
mised the eye-spot position accuracy. Horizontal eye-spot position accuracy was within 0.8 de
grees, but in the vertical direction, as the eye moved toward the vertical limits, the accuracy de
graded to about 3 degrees. Since a single CI' image slice ( 15 images on a 14" by 17'' sheet of
film) is 3" by 4" at an average viewing distance of 20" we could resolve which image slice was
being viewed, but not accurately which location within the image slice.
We taped each reading session with a video camera that recorded audio and time with a built-in
stopwatch. These records helped in data analysis by providing timing information and voice clues
as to what the radiologist was doing when.
We chose the four-over-four viewbox to simplify tracking which image was being viewed, and it
typifies the standard display space available for viewing films. Four board certified radiologists
and one senior radiology resident participated· in the study. All subjects had experience with
chest CI' scans. None wore eyeglasses, but one had contact lenses. In our experience, contact
lenses do not affect the use of the eyetracker. Each radiologist read an initial patient folder wearing
the eyetracker to become comfonable with the device. All subjects reponed that the eyetracker
had not affected the quality of their interpretation or their operational methods, but that the eye
tracker occasionally began to feel heavy toward the end of a reading session. The later occurred
when the calibration procedure had been unusually long.
2.2 Procedure
The test material consisted of three different patient cases each having a single chest CI' scan.
Each CI' scan contained about 30 to 40 image slices of which all image slices were recorded on
6
film with an intensity window selected for viewing the mediastinum (three sheets of film). Another
two sheets of film contained a subset of about 20 images that were recorded with an intensity
window selected for viewing lung. The referring physician's requisition was provided. The radi
ologists were instructed to read the chest cr scans and report their interpretations using the same
professional standards they would use in the clinic and end the study by replacing the films in the
patient folder. Their report was dictated via a microphone onto the Eyetracker VCR. Informed
consent was obtained after the procedure was explained.
2.3 Data Collection and Analysis
The objectives of this experimental work were to determine radiologists' film handling habits, in
ter-image search patterns, and how they used text information, cr planer views, and screen space.
We also wanted to know the size and number of image clusters they viewed. A cluster was defined
as the number of sequential images that were viewed together as a group. Cluster size is important
in determining the minitnum amount of display area a radiology workstation must have for simul
taneous display of the smallest working group of itnages.
Visual scan patterns were determined manually. The tape was reviewed on a playback machine
that allowed frame by frame viewing. From the video tapes, the experimenter documented the eye
path of the subject noting when the radiologist paused (fixated) on an image. Repeated fixations on
one or more images was defined as a cluster. We documented how many images were in a cr scan. We recorded the amount of time taken for each aspect of the reading session.
7
2.4 Results
2.4.1 Film Handling and Organization
Lung and Mediastinum (M) "intensity windowed" images were printed in two separate sequential
series, and this separation was maintained by the radiologists when loading flims onto the view
boxes. Generally, the radiologists placed M images on the bottom view boxes, with the lung images
either placed in a single pile on one upper viewoox, or spread out on the upper viewbox. One radi
ologist only used the bottom viewboxes, using the left three view boxes for the M images, and pil
ing the lung images on the right-most box. For the other radiologists, lung images on the upper
viewboxes were viewed by looking up at them, by removing them and viewing them in hand, by
"swapping" them with M images on the lower boxes, or by standing up.
Radiologists constantly changed their viewing position during the interpretation, often moving close
to an image (zooming in) for a detailed look at the image, or moving away from the viewbox
(zooming out) for a broader view. They would move left or right from the center to better view im
ages on the outer viewboxes.
2.4.2 Visual Scan Patterns
The following visual scan pattern generally occurred during interpretation of these single CT scans:
First, images were removed from the patient folder, sorted, and selected films were placed onto the
viewbox. Images were often viewed as they were being loaded onto the viewboxes. Second, dur
ing what we call an overview phase, a systematic visual scan was performed over all the images.
Sometimes this systematic search was by organ, but in general, a systematic sequential visual scan
pattern was initially used to view the series of slices in the CT scan. In general, radiologists frrst
viewed the images "intensity-windowed" for the mediastinum, followed by those "intensity win
dowed" for the lungs. Little or no cross comparison between images of different intensity win-
8
dowing occurred. Third, during the detail phase, two to six critical clusters of image slices show
ing important radiology findings were reviewed. These clusters typically contained from one to
four images, with occasionally as many as six, depending on the local anatomy and radiology find
ing under consideration. Radiologists averaged less than 0.2 seconds when moving eyes from one
image to another, with typically two to five second pauses at each image. Fourth, during the dicta
tion phase an interpretation report was generated, often while the images continued to be viewed.
Fifth, the films were removed from the viewbox and replaced back into the patient folder.
A great deal of time was spent locating and non-sequentially accessing these small clusters of im
ages showing important radiological findings. When asked how much of the patient's folder must
be simultaneously viewed radiologists typically answer "all of it"[ Rogers 1986, Beard 1987]. The
above results contradict this, indicating a maximum of six images are viewed in rapid sequence de
manding simultaneous display. But radiologists are not incorrect in feeling they need most of the
patient folder displayed on the viewbox. The simultaneous display of the complete contents of a
patient folder appeared to be used as a visual image index, allowing the radiologist to locate quickly
any particular image, with rapid eye and head movement. This visual image index was not perfect.
Some radiologists occasionally used their finger to mark the location of critical image clusters to
speed subsequent access. The fingerpointing method could not show this because one hand was
busy pointing out the eye's location, and the other manipulating films on the viewboxes.
2.4.3 Timing
Table 1 summarizes several categories of mean times for interpretations. Film Viewing/Dictation
Time, is the total time radiologists spent actually viewing images, rather than moving films. Film
Manipulation Time, is the total time radiologists spent moving and manipulating films, including
time to load the images onto the viewboxes, and time for radiologists to move images from one lo
cation on the viewbox to another location. The time to unload the films and place them back into the
9
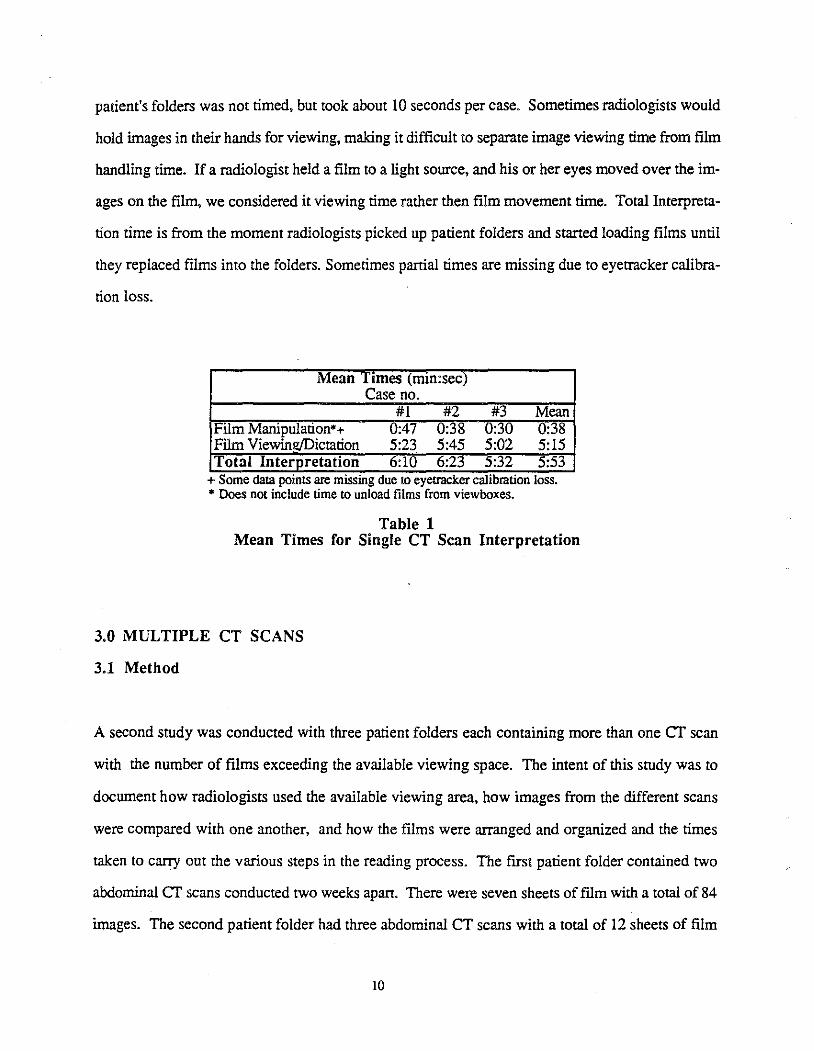
patient's folders was not timed, but took about 10 seconds per case. Sometimes radiologists would
hold images in their hands for viewing, making it difficult to separate image viewing time from film
handling time. If a radiologist held a film to a light source, and his or her eyes moved over the im-
ages on the film, we considered it viewing time rather then film movement time. Total Interpreta
tion time is from the moment radiologists picked up patient folders and started loading films until
they replaced films into the folders. Sometimes partial times are missing due to eyetracker calibra-
tion loss.
Mean Times (Imn:sec) Case no.
#1 #2 #3 Mean Film Manipulation*+ 0:47 0:38 u:30 0:38 Film Viewin!!)])ictation 5:23 5:45 5:02 5:15 Total Interpretation 6:10 6:23 5:32 5:53
+ Some data pomts are mlSSmg due to eyetracker callbrauon loss. • Does not include time to unload films from viewboxes.
Table 1 Mean Times for Single CT Scan Interpretation
3.0 MULTIPLE CT SCANS
3.1 Method
A second study was conducted with three patient folders each containing more than one CT scan
with the number of films exceeding the available viewing space. The intent of this study was to
document how radiologists used the available viewing area, how images from the different scans
were compared with one another, and how the films were arranged and organized and the times
taken to carry out the various steps in the reading process. The first patient folder contained two
abdominal CT scans conducted two weeks apart. There were seven sheets of film with a total of 84
images. The second patient folder had three abdominal CT scans with a total of 12 sheets of film
10
and 135 images. Finally, the third patient folder had three abdominal CT scans and one MR scan
(obtained after the first CT scan) with a total of 18 sheets of film and 244 images. Radiologists
were presented with the patient folder, the requisition for the most recent scan, and the radiologist
repon for the previous scan. The remainder of the experimental protocol remained the same as for
the single CT scan. Informed consent was obtained after the procedure was explained.
Radiologists compared images from the various CT scans to evaluate changes that occurred over
time. So, we observed the size of image clusters and how they were cross compared. The analysis
of the video records, both from the video camera and the eyetracker, were manually reviewed, vi
sual scan patterns were documented, and the number of fixations, image cluster size, and timing
were obtained the same as for the single CT scan. Additional information was recorded as to how
radiologists soned and organized films on the viewbox and what they did with the films not occu
pyingviewbox space.
3.2 Results
3.2.1 Film Handling and Organization
Radiologists began the interpretation by reading the requisition form, and in most cases the previous
interpretation repons and then soned through the various films to put them into an order of their
liking. Images were usually quickly scanned during the sorting process. Images were piled by in
tensity window within a scan, with different piles for each scan . Piles were located either on the
table or on the upper viewboxes. Radiologists appeared to use both the image appearance as well as
the scan date printed on each image for sorting purposes.
In two cases, there were far more films than viewbox space, so radiologists kept the films in the
piles, until needed. This resulted in a great deal of film movement during the interpretation, most
likely, requiring a great deal of attention. Funher, access to images in the piles was much slower
11
than access to images displayed on the viewbox. Radiologists could no longer use their spatial
knowledge of the viewbox organization to quickly index to the required image. Rather, they had to
slowly move through a pile, looking at each film in turn until the desired one was located. The
bottom panel (or row of four viewboxes) was generally used to hold the current cr scan, with the
upper panel (and sometimes the outer view boxes on the bottom panel used to hold films being
compared. As with the single scan interpretation, films were read while being held, and the radiolo
gists moved to the left and right, and sometimes stood up in order to better view the images. One
radiologist organized each scan, along vertical rather than horizontal lines.
3.2.2 Visual Scan Patterns
After reading the requisition form, possibly the previous interpretation reports, and sorting the
films, the radiologist began scanning the images. The initial overview phase observed with single
CT scans was still evident, but more diverse. In different orders, all radiologists sequentially
viewed the current scan, selectively viewed the previous scan (most likely focusing on radiologic
findings identified by the requisition and previous interpretation report) and looked at any older
images, (this varied with the radiologist and the case). This overview phase was again followed by
a more complex detail phase with a focus on small clusters. A final dictation phase was again pre
sent with the same review of critical clusters. Radiologists repeatedly accessed related text
information such as requisitions, interpretation reports, and text information such as scan step size
written on the films, before and during the interpretation. This text information appeared to be very
important to interpretation strategy for decision making.
One or more clusters from one scan were often compared, in pairs, with those from a previous scan
to determine anatomical changes. Radiologists averaged less than 0.2 seconds when moving eyes
from one image to another, with typically two to five second pauses at each image. Two methods
of cluster comparison were observed. In one, the radiologists rapidly moved their eyes back and
12
fonh many times between two very small clusters with a maximum of a two second fixation per
cluster. With the second method, somewhat larger clusters were compared with longer fixations on
each cluster and far fewer movements back-and-fonh. Radiologists averaged less than 0.2 seconds
when moving eyes from one image to another, with typically two to five second pauses at each im
age. (Most cross comparisons occurred between the current and most recent previous scan). As
before, clusters for single scan viewing typically ranged from one to four images with a maximum
of six. However, when clusters from different scans were compared, they ranged from one to three
images with a maximum of eight, for a total set of two to eight images normally requiring simulta
neous display.
When comparing clusters, the films from the different scans were placed as close together as possi
ble. Sometimes the films were placed above and below each other, sometimes side-by-side, and
often one film remained on the viewbox with the other being hand-held close by.
3.2.3 Timing
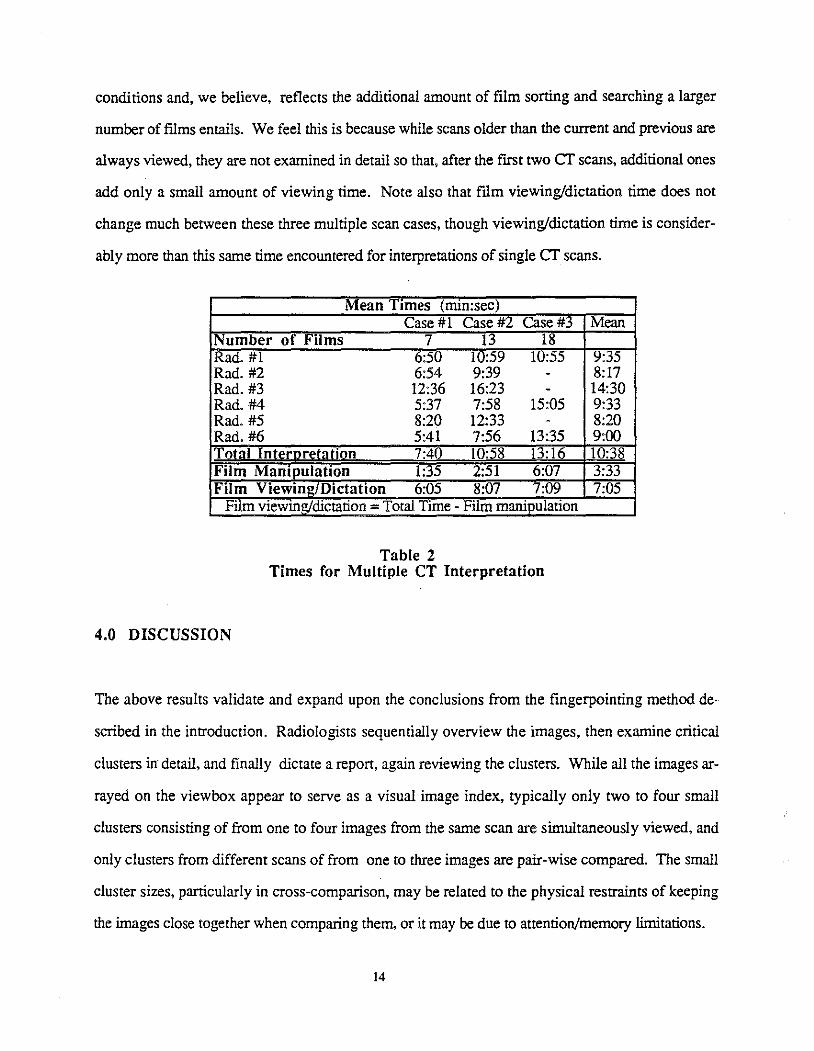
Table two contains the times for manipulating the films and the total times for the interpretations.
Blanks occurred in several sessions with case three due to the eyetracker loosing calibration. Both
film manipulation time and total time were gathered. film viewing/dictation time was calculated and
is the difference between the above two times. We show total time for individual radiologists
reading individual cases to allow the reader to ascenain the degree of individual difference among
radiologists as well as the rime differences between cases. Radiologists # 5 and #6 were the resi
dents.
As with most human factors studies, the differences among response times for individual radiolo
gists is almost as much as that between the different cases. Film manipulation time increased with
the number of films for a case. This observation matches what we have observed under clinical
13
conditions and, we believe, reflects the additional amount of film sorting and searching a larger
number of films entails. We feel this is because while scans older than the current and previous are
always viewed, they are not examined in detail so that, after the frrst two cr scans, additional ones
add only a small amount of viewing time. Note also that film viewing/dictation time does not
change much between these three multiple scan cases, though viewing/dictation time is consider
ably more than this same time encountered for interpretations of single cr scans.
Mean Times (mm:sec) Case # 1 Case #2 Case#3 Mean
Number of Films 7 13 18 Rad.#1 6:50 10:59 10:55 9:35 Rad.#2 6:54 9:39 - 8:17 Rad.#3 12:36 16:23 - 14:30 Rad.#4 5:37 7:58 15:05 9:33 Rad. #5 8:20 12:33 - 8:20 Rad.#6 5:41 7:56 13:35 9:00 Total Interoretal ion 7:40 10:58 13:16 10:38 Film Manipulation 1:35 2:51 6:07 3:33 Film Viewing/Dictation 6:05 8:07 7:09 7:05
Film viewmg!dictation - Total Time - Film manipulation
Table 2 Times for Multiple CT Interpretation
4.0 DISCUSSION
The above results validate and expand upon the conclusions from the fingerpointing method de
scribed in the introduction. Radiologists sequentially overview the images, then examine critical
clusters in detail, and finally dictate a report, again reviewing the clusters. While all the images ar
rayed on the viewbox appear to serve as a visual image index, typically only two to four small
clusters consisting of from one to four images from the same scan are simultaneously viewed, and
only clusters from different scans of from one to three images are pair-wise compared. The small
cluster sizes, particularly in cross-comparison, may be related to the physical restraints of keeping
the images close together when comparing them, or it may be due to attention/memory limitations.
14
The visual image index (all the images displayed on the viewbox) works well for image access,
with radiologists generally moving their eyes directly to the target images (though they occasionally
use their finger to mark a location for future reference). However, this visual image index fails
when there are more films than viewbox space, as was often the case with multiple cr scans. There
appears to be a great deal of manipulation of ftlms for larger cases. Films must either be left in piles
on nearby tables, or stacked on several view boxes. A great deal of time may be wasted looking for
particular films, removing and replacing films on the view boxes.
We would expect somewhat improved film handling with an alternator, but it, by no means, solves
the film handling problem. Our observation of radiologists using an alternator indicates two prob
lems: first, radiologists sometimes loose track of the location of particular scans on the alternator's
moving strip. Second, the "seek" time on the alternator, that is, the average time to locate a needed
image or scan, can be quite long.
The fact that little comparison, as measured by the eyetracker records, was made between different
intensity windowed images, such as those intensity windowed for lung versus bone, was a surprise
to both the radiologists and the experimenters. The radiologists thought that they did physically
make that comparison. In one of our previous experiments with a prototype electronic workstation
[Johnston 1986] some radiologists did place the lung windowed image adjacent to the mediastinum
windowed image and thought this was useful, but there was no indication that it was an important
or necessary feature. Of course if that comparison can be conveniently and rapidly made with an
electronic workstation, the radiologists habits may change. This qualification, of course, must be
applied to all the results we obtained from studying the radiologist using the traditional display de
vice that they have been trained on and which has imposed limitations on the reading process.
15
5.1 Implications for Radiology Workstation Design
Electronic workstations, are the essential means for physicians to view electronically stored medical
images [Beard 1989, Pizer 1989]. However, producing an acceptable image-display radiology
workstation is difficult. The typical viewbox array can easily display the equivalent of 32 high res
olution display monitors (32 x 10242) which the physician can quickly access using techniques-
the movement of eyes and head -- that have been practiced for an entire professional career. Even
the best workstations barely have this much real memory, let alone display space. Current work
stations begin to show their advantage only with large patient folders that overflow viewboxes.
From our eyetracking research, we conclude that a viable radiology workstation for single and mul
tiple cr scans at least needs the following: an image index for rapid access to patient folders, scans,
and images; sequential and arbitrary viewing of images in a scan; access to all current patient text
information; sufficient area to simultaneously display ten full-resolution cr images; function for
comparing image clusters from different scans; function for marking critical images and clusters;
and function for intensity windowing an image slice. Rapid response time, simple hand-motions,
the ability to quickly measure anatomy, and an easy to understand interaction are also clearly
needed.
6. ACKNOWLEDGEMENTS
We wish to thank Drs. Bell, Kennedy, Klymenko, Mauro, Mikhail, Pizer, and Schiebler for their
assistance in this research and in reviewing this manuscript. This work was supported by NIH
grants (ROI CA 44060, POl CA 47982).
16
7. REFERENCES
Beard DV, Pizer SM, Rogers DC, and Cromartie R, A Prototype Single-Screen PACs Console Development Using Human Computer Interaction Techniques. SPIE Medica/Imaging, Newport Beach CA., 1985; 767: 646-653.
Beard DV, Designing a Radiology Workstation: Focus on Navigation During the Interpretation Task, submitted for publication in IEEE Tranactions on Medica/Imaging, 1989.
Carboni N, Tombaugh J, Dillon R, The effect of simultaneous vs sequential viewing of digital images on comparative judgement performance, SPIE Medica/Imaging, Newport Beach CA. 1989; 1091:252-261.
Carmody DP, Nodine CF, and Kundel HL, Global and Segmented Search for Lung Nodules of Different Edge Gradients, Investigative Radiology 1980;15: 224-233.
Gale AS and Worthington BS, The Utility of Scanning Strategies in Radiology, Eye Movements and Psychological Functions: International Views, Groner, R, Menz, C, Fisher, DF, and Monty, RA, eds., Hillsdale, NJ: Erlbaum, 1983; .
Johnston RE, Rogers DC, Hemminger BM, Pizer SM, Creasy JL, Perry JR, Staab EV, Curnes IT, and Parker LA, A Multiscreen Multiple Image Display Console,SPIE Medica/Imaging, Newport Beach CA., 1986; 626: 447-450.
Kundel HL and Wright DJ, The Influence of Prior Knowledge on Visual Search Strategies During the Viewing of Chest Radiographs, Radiology 1969; 93: 315-320.
Kundel HL and LaFollette PS, Visual Search Patterns and Experience with Radiological Images, Radiology 1972;103: 523-528.
Kundel HL, Nodine CF, and Carmody D, Visual Scanning, Pattern Recognition and Decision-Making in Pulmonary Nodule Detection, Investigative Radiology 1978; 13:175-181.
Llewellyn-Thomas E, Search Behavior ,Radiology Clinics of North America 1969; 1: 403-417.
Pizer SM and Beard DV, Medical Image Workstation: State of Science & Technology, Accepted by The Journal of Digital Imaging 1989.
Rogers DC, Johnston RE, Hemminger BM, and Pizer SM, Development of and Experience With a Prototype Medical Image Display, Presented at the Farwest Image Perception Conference, Univ. of New Mexico, Dept. of Radiology 1986.
Rogers E and Goldberg M, Image organization and navigation strategies for a radiological workstation, SPIE Medica/Imaging, Newport Beach CA., 1989; 1091: 315-324.
Smith MJ, Error and Variation in Diagnostic Radiology, Springfield, IL: CC Thomas, 1967; 148.
17
Tuddenharn WJ and Calven WP, Visual Search Patterns in Roentgen Diagnosis, Radiology 1961;76: 225-256.
Tuddenharn WJ, Visual Search, Image Organization, and Reader Error in Roentgen Diagnosis: Studies of the Psychophysiology of Roentgen Image Perception,Radiology 1962;78: 694-704.
Yerushalmy J, The Statistical Assessment of the Variability in Observer Perception and Description of Roentgenographic Pulmonary Shadows, Radiology Clinics of North America 1969;1: 381-392.
18
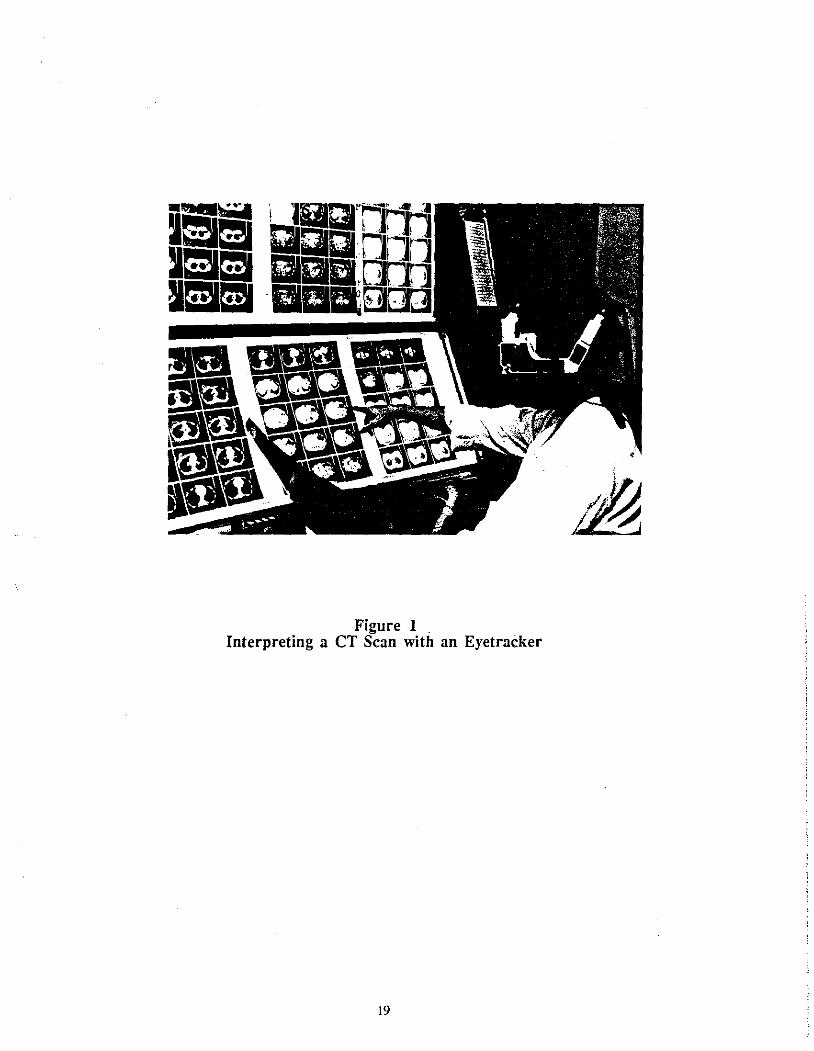
Figure 1 Interpreting a CT Scan with an Eyetracker
19