A Study of Liquid Droplet Disintegration for the … Study of Liquid Droplet Disintegration for the...
12
A Study of Liquid Droplet Disintegration for the Development of Nanostructured Coatings H. Tabbara School of Engineering Sciences, University of Southampton, Highfield, Southampton, SO17 1BJ, U.K. S. Gu School of Engineering, Cranfield University, Cranfield, Bedfordshire, MK43 0AL, U.K. Xi’an Jiaotong-Liverpool University, Suzhou Dushu Lake Higher Education Town, Suzhou 215123, China DOI 10.1002/aic.13755 Published online February 15, 2012 in Wiley Online Library (wileyonlinelibrary.com). Thermal spray coatings produced from a liquid feedstock are receiving an increasing level of interest due to the advanced, nanostructured coatings which are obtainable by these processes. In this article, a high-velocity oxy-fuel (HVOF) thermal spray system is computationally investigated to make a scientific assessment of the liquid droplet behavior on injection. An existing liquid-fuelled HVOF thermal spray gun is simulated using the computational fluid dynamic approach. The steady- state gas-phase dynamics are initialized by the introduction of liquid kerosene and oxygen which react within the combustion chamber producing a realistic compressible, turbulent jet. Discrete-phase water droplets are injected at the powder injection port. On injection, the water droplets breakup and vaporize, while being entrained through the acceleration barrel of the HVOF system. The results obtained give an insight to the mechanism which control the water droplet sizes and disintegration process, and serve as a fundamental reference for future development of liquid feedstock devices. V V C 2012 American Institute of Chemical Engineers AIChE J, 58: 3533–3544, 2012 Keywords: coating flows, complex fluids, computational fluid dynamics, particulate flows, particle technology Introduction Thermal spray coatings are formed by accelerating a stream of molten, semimolten, or solid powder particles to- ward a targeted substrate where the particles initially undergo impact deformation and then adhere to the surface through diffusion-type bonds and mechanical interlocking. Then, the particles impinge onto one another, building up the coating particle by particle in a lamellar structure. A va- riety of different techniques can be used to heat and acceler- ate the particles, and can include a combination of plasma arc, 1 high-pressure inert gases, 2,3 and a combustion reaction. 4 As a result, a wide spectrum of particle impact velocities and temperatures can be achieved; ranging from several tens to several thousands of meters per second and from below room-temperature up to several thousand degrees Kelvin. Using these methods, almost every type of material that does not degrade when heated can be deposited to form a coating. Thermally sprayed coatings are typically formed to protect a component against wear and corrosion, and in some cases create low-friction surfaces. Furthermore, new advanced functional surfaces are evolving in conjunction with thermal spray processing. Two interesting and topical examples include: the dye-sensitized solar cell 5 and functionally gradi- ent prosthetic coatings with antibacterial components. 6 As part of the high level of interest in more complex thermal spray coatings, there is a growing desire to deposit nano- structured films. However, the deposition of ultrafine submi- cron and nanosized particles requires current techniques to be adapted. For both health and safety reasons as well as to avoid particle agglomeration during storage and feeding into the spray device, a nanopowder feedstock has to be mixed to form a suspension (suspension thermal spraying, STS) or a solution precursor (solution precursor thermal spraying, SPTS). The liquid injection method also increases the mo- mentum of the feedstock particles, aiding penetration into the thermal jet core. The consistently high levels of interest in the fields of STS and SPTS in recent years is reflected by the number of review papers published. 7–11 In all, a variety of thermal spray methods have been used in pursuit of depositing nanoparticles from a liquid feedstock, including: plasma, flame, and high-velocity oxy-fuel (HVOF). An over- view of theses achievements is provided as follows. Hydroxyapatite (HA), TiO 2 , and Al 2 O 3 are some of the most popular materials being deposited with the plasma spray method. Their respective functions include: prosthetics coatings, photocatalytic devices, and wear and corrosion pro- tection. SPTS of HA using a plasma torch can produce fine splat morphologies, and demonstrates superior control of coating porosity, which is a key feature of prosthetic coat- ings. 12 The deposition of TiO 2 nanoparticles using liquid feedstock plasma spraying has been successfully achieved with grain sizes of roughly 40 nm, and with a high propor- tion (90%) of desirable anatase phase; vital in the production Correspondence concerning this article should be addressed to S. Gu at S.Gu@cranfield.ac.uk. V V C 2012 American Institute of Chemical Engineers AIChE Journal 3533 November 2012 Vol. 58, No. 11 SOFT MATTER: SYNTHESIS, PROCESSING AND PRODUCTS
Transcript of A Study of Liquid Droplet Disintegration for the … Study of Liquid Droplet Disintegration for the...

A Study of Liquid Droplet Disintegration for the Developmentof Nanostructured Coatings
H. TabbaraSchool of Engineering Sciences, University of Southampton, Highfield, Southampton, SO17 1BJ, U.K.
S. GuSchool of Engineering, Cranfield University, Cranfield, Bedfordshire, MK43 0AL, U.K.
Xi’an Jiaotong-Liverpool University, Suzhou Dushu Lake Higher Education Town, Suzhou 215123, China
DOI 10.1002/aic.13755Published online February 15, 2012 in Wiley Online Library (wileyonlinelibrary.com).
Thermal spray coatings produced from a liquid feedstock are receiving an increasing level of interest due to the advanced,nanostructured coatings which are obtainable by these processes. In this article, a high-velocity oxy-fuel (HVOF) thermalspray system is computationally investigated to make a scientific assessment of the liquid droplet behavior on injection. Anexisting liquid-fuelled HVOF thermal spray gun is simulated using the computational fluid dynamic approach. The steady-state gas-phase dynamics are initialized by the introduction of liquid kerosene and oxygen which react within thecombustion chamber producing a realistic compressible, turbulent jet. Discrete-phase water droplets are injected at thepowder injection port. On injection, the water droplets breakup and vaporize, while being entrained through theacceleration barrel of the HVOF system. The results obtained give an insight to the mechanism which control the waterdroplet sizes and disintegration process, and serve as a fundamental reference for future development of liquid feedstockdevices. VVC 2012 American Institute of Chemical Engineers AIChE J, 58: 3533–3544, 2012
Keywords: coating flows, complex fluids, computational fluid dynamics, particulate flows, particle technology
Introduction
Thermal spray coatings are formed by accelerating astream of molten, semimolten, or solid powder particles to-ward a targeted substrate where the particles initiallyundergo impact deformation and then adhere to the surfacethrough diffusion-type bonds and mechanical interlocking.Then, the particles impinge onto one another, building upthe coating particle by particle in a lamellar structure. A va-riety of different techniques can be used to heat and acceler-ate the particles, and can include a combination of plasmaarc,1 high-pressure inert gases,2,3 and a combustion reaction.4
As a result, a wide spectrum of particle impact velocitiesand temperatures can be achieved; ranging from several tensto several thousands of meters per second and from belowroom-temperature up to several thousand degrees Kelvin.Using these methods, almost every type of material that doesnot degrade when heated can be deposited to form a coating.
Thermally sprayed coatings are typically formed to protecta component against wear and corrosion, and in some casescreate low-friction surfaces. Furthermore, new advancedfunctional surfaces are evolving in conjunction with thermalspray processing. Two interesting and topical examplesinclude: the dye-sensitized solar cell5 and functionally gradi-ent prosthetic coatings with antibacterial components.6 As
part of the high level of interest in more complex thermalspray coatings, there is a growing desire to deposit nano-structured films. However, the deposition of ultrafine submi-cron and nanosized particles requires current techniques tobe adapted. For both health and safety reasons as well as toavoid particle agglomeration during storage and feeding intothe spray device, a nanopowder feedstock has to be mixed toform a suspension (suspension thermal spraying, STS) or asolution precursor (solution precursor thermal spraying,SPTS). The liquid injection method also increases the mo-mentum of the feedstock particles, aiding penetration intothe thermal jet core. The consistently high levels of interestin the fields of STS and SPTS in recent years is reflected bythe number of review papers published.7–11 In all, a varietyof thermal spray methods have been used in pursuit ofdepositing nanoparticles from a liquid feedstock, including:plasma, flame, and high-velocity oxy-fuel (HVOF). An over-view of theses achievements is provided as follows.
Hydroxyapatite (HA), TiO2, and Al2O3 are some of themost popular materials being deposited with the plasmaspray method. Their respective functions include: prostheticscoatings, photocatalytic devices, and wear and corrosion pro-tection. SPTS of HA using a plasma torch can produce finesplat morphologies, and demonstrates superior control ofcoating porosity, which is a key feature of prosthetic coat-ings.12 The deposition of TiO2 nanoparticles using liquidfeedstock plasma spraying has been successfully achievedwith grain sizes of roughly 40 nm, and with a high propor-tion (90%) of desirable anatase phase; vital in the production
Correspondence concerning this article should be addressed to S. Gu [email protected].
VVC 2012 American Institute of Chemical Engineers
AIChE Journal 3533November 2012 Vol. 58, No. 11
SOFT MATTER: SYNTHESIS, PROCESSING AND PRODUCTS

of photocatalytically active coatings.13 Liquid feedstock alu-mina has also been deposited by plasma spraying with con-trolled coating density and with high levels of thermody-namically stable corundum (a-Al2O3), which is necessary forgood wear resistance and electrical insulation.14
The flame spray method with liquid feedstock injection hasbeen used for both manufacturing15–17 and depositing TiO2
nanometric particles. SPTS of TiO2 using flame spray havesuccessfully created nanostructured coatings, consisting of80%18 and 95%19 anatase phase. However, cohesion betweenparticles and their adhesion to the substrate can be limited.The high-velocity suspension flame spray method, based onexisting HVOF technology, has shown a high level of poten-tial for the deposition of submicron and nanosized particlesdue to its high momentum throughput and controllable flamecharacteristics, which can be used to improve the particleimpact conditions. As a result, dense TiO2 coatings withgood adhesion to the substrate have been formed.20 Further-more, Al2O3 nanosized particles can be completely melted bythis process, resulting in little interlamellar defects andextremely low interconnected porosity.21 The liquid feedstockHVOF method has also been applied to experimentally manu-facture Ceria-based electrolytes for solid-oxide fuel cells,where the flame limits the evaporation and decomposition ofthe feedstock compared to plasma spray alternatives, produc-ing a low-porosity, smooth and defect free coating.22
In comparison to the conventional thermal spray methods,STS and SPTS are more complex due to the final particlemorphology being largely controlled by the rates of fragmen-tation and vaporization of the liquid component of the feed-stock on injection. Detailed images of the initial disintegra-tion of liquid feedstock injection are provided in Ref. 23,exhibiting stripping and catastrophic breakup of the droplets.Depending on the size of the liquid droplets, the intensity ofthe flow and the liquid feedstock properties, the dropletsmay precipitate their solid mass along one of many processroutes, as depicted in Figure 1. A simulation study of liquidceramic precursor droplets processed by plasma and HVOFspraying are presented,24,25 providing some explanation to
the different precipitation routes. These results show smallerfeedstock droplets form a thicker precipitate shell and aremore likely to form solid particles due to rapid heating andvaporization. Larger droplets, however, undergo surface pre-cipitation forming a shell. Depending on its porosity andability to vent the evaporating liquid core, this shell structurecan erupt due to internal pressurization. Furthermore, thetemperatures associated with HVOF are lower than plasmaspray methods, leading to larger particle diffusion timeswithin feedstock droplets and, therefore, are more likely toproduce thick shell and solid uniform agglomerates.25
Experiments using modified HVOF thermal spraying witha liquid feedstock indicate that if the feedstock is waterbased, poorer coatings might be created due to insufficientflame temperatures when mixing within the combustionchamber.26 However, the water-based feedstock allowshigher particle concentrations, are less expensive to produce,and are safer to handle compared with the organic alterna-tives.27 Better coatings have been obtained when the feed-stock is a combustible, organic-based compound. However,injecting a combustible liquid into the combustion chamberraises the pressure and can lead to instabilities in the flow.9
Despite the work undertaken to date in the fields of STSand SPTS, several investigations are still very necessary toimprove our fundamental understanding of spray kinematics,suspension and solution feedstock properties, and injectionsystems. This study investigates liquid droplet disintegrationwithin a supersonic combustion flame, based on HVOF-typeprocessing. A good overview of the combustion characteris-tics and supersonic flow field within the JP5000 have beenpreviously documented.28,29 The reader may also refer to lit-erature30,31 for detailed simulation-based investigations con-cerning micron sized powder particles and process gas inter-actions in cold gas spraying and HVOF, respectively. Thework presented within the latter example applies multiscalemodeling by combining steady-state combustion, particulatephase dynamics and heating, and rule-based stochastic meth-ods, leading to the prediction and control of detailed andaccurate coating microstructures.31–33
Figure 1. Variations in liquid feedstock droplet disintegration and drying.
[Color figure can be viewed in the online issue, which is available at wileyonlinelibrary.com.]
3534 DOI 10.1002/aic Published on behalf of the AIChE November 2012 Vol. 58, No. 11 AIChE Journal
In this investigation, a commercial finite volume compu-tational fluid dynamic code, user-defined functions, and anequilibrium combustion reaction program are combined tosimulate the flow field through the most widely used liq-uid-fuelled HVOF thermal spray system, JP5000 (Praxair).The water droplets at room-temperature and various sizesare introduced at the normal powder feeder location. Then,a detailed study is conducted to assess the manner ofdroplet disintegration within the barrel of a standardHVOF system, close to the de Laval nozzle. By incorpo-rating detailed thermophysical properties of water, the pri-mary and secondary breakup regimes are captured andcompared to the timescales involved with those of vaporiz-ing droplets. The information obtained sheds new light onthe process of water droplet disintegration and serve asa reference for future development of liquid feedstockdevices.
Model Description
An overview of the gas-phase modeling techniques
A schematic diagram of the JP5000 thermal spray systemis illustrated in Figure 2 highlighting the fuel-oxygen inlet,the combustion chamber, the convergent–divergent nozzle,and the barrel. The position of the powder feeder is alsoshown. A mixture of fuel and oxygen is injected into thecombustion chamber through the central inlet. The feedstockpowder particles are introduced downstream of the conver-gent–divergent nozzle using a carrier gas. The axisymmetricgun design can be well represented by a 2-D simulation do-main which is adopted in this study. Details of the computa-tion domain, boundary conditions, and refinement regionsare given in previous studies.28,29 The geometric parametersand the working conditions for the simulation are summar-ized in Table 1 and are based on values provided by indus-try.
The segregated solution algorithm34 is applied in this studywith a control volume-based technique. This numerical methodis chosen over the alternative coupled approach to aid conver-
gence and avoid oscillations in the pressure and velocity fields.The pressure and velocity fields are linked using the semi-implicit method for pressure linked equations algorithm35,36
due to it being computationally economical and more stable incomparison to other algorithms. The second-order upwindscheme is used to discretize the transport equations.
The steady-state flow field of the gaseous continuum iscomputed using the Reynolds averaged Navier–Stokes equa-tions and is assumed to behave as a compressible, ideal gas.The absolute pressure is represented by the sum of the oper-ating pressure and the static pressure of the flow. The vari-able density is calculated by taking into account the massfraction of each species in the flow as given in Eq. 1.
q ¼ pop þ p
RTP
iYi
Mx;I
(1)
The continuity equation for the steady state, axisymmetriccomputations is given by Eq. 2. The terms on the left handside represent the mass entering and leaving a control volumeand the change in mass due to a change in density. The Sm
term is the additional mass contribution from the vaporizingkerosene fuel droplets, where x is the axial coordinate, r is theradial coordinate, vx is the axial velocity, and vr is the radialvelocity. The individual water droplets are the focus of thisstudy and are injected as single droplets to make particularassessment of individual droplet behavior. These droplets areone way coupled, therefore, do not impact on the gas-phasedynamics.
@
@xðqvxÞ þ
@
@rðqvrÞ þ
qvrr
¼ Sm (2)
The axial and radial momentum conservation equations aregiven in Eqs. 3 and 4 in their cylindrical form. The effectiveviscosity is equal to the sum of the physical dynamic viscosityand the artificial turbulent viscosity, which is used to accountfor the enhanced mixing due to turbulent fluctuations withinthe mean flow. The flow in this case is compressible; hence,
Figure 2. Schematic diagram of the JP5000 thermal spray system.
Table 1. A summary of Geometric Parameters and the Working Conditions Based on the Industrial Setup
Geometric Parameter Working Conditions
Barrel length 111.1 mm Fuel Flow rate: 0.0057 kg/s Temperature: 300 KBarrel entrance diameter 11.0 mm Oxygen Flow rate: 0.022 kg/s Temperature: 300 KBarrel exit diameter 11.1 mm Atmosphere Pressure: 101325 Pa Temperature: 300 KCombustion chamber length 92.5 mm Internal wall boundary Temperature: 350 K NonslipCombustion chamber diameter 37.8 mmNozzle throat diameter 7.9 mm
AIChE Journal November 2012 Vol. 58, No. 11 Published on behalf of the AIChE DOI 10.1002/aic 3535

the two equations below are Favre averaged. The radial andaxial sources Fr and Fx represent the volumetric forces due tointeraction with the dispersed kerosene fuel droplets.
1
r
@
@xðrqvxvxÞ þ
1
r
@
@rðrqvrvxÞ ¼
� @p
@xþ 1
r
@
@xrleff 2
@vx@x
� 2
3ðD �~vÞ
� �� �
þ 1
r
@
@rrleff
@vx@r
þ @vr@x
� �� �þ Fx ð3Þ
1
r
@
@xðrqvxvrÞ þ
1
r
@
@rðrqvrvrÞ ¼
� @p
@rþ 1
r
@
@xrleff
@vr@x
� @vx@r
� �� �
þ 1
r
@
@rrleff 2
@vr@r
� 2
3ðr �~vÞ
� �� �
� 2leff
vrr2
þ 2
3
lreff
rðr �~vÞ þ Fr ð4Þ
where
r �~v ¼ @vx@r
þ @vr@r
þ vrr
(5)
The energy conservation equation is given below, and is linkedto the conservation of mass and momentum through themultispecies ideal gas law (Eq. 1). The source term Sh
represents the energy dissipated and received by the gas phaseduring the vaporization and exothermic combustion reaction ofthe kerosene fuel droplets within the combustion chamber.
@
@x½vxðqEþ pÞ� þ @
@r½vrðqEþ pÞ� ¼ @
@xðvxrxx þ vrsxr þ qxÞ
þ @
@xðvxsxr þ vrrrr þ qrÞ þ Sh ð6Þ
where
rxx ¼ 2leff
@vx@x
� 2
3leffðr �~vÞ (7)
rrr ¼ 2leff
@vr@r
� 2
3leffðr �~vÞ (8)
sxr ¼ srx ¼ leff
@vx@r
þ @vr@x
� �(9)
qx ¼ Keff
@T
@x(10)
qr ¼ Keff
@T
@r(11)
The kerosene liquid fuel, C12H26, in this study is used torepresent the average size of the kerosene hydrocarbon chain.The combustion reaction is represented by a single, one-stepglobal reaction scheme, as given in Eq. 12.
n1C12H26 þ n2O2 �!�DH
n3CO3 þ n4H2Oþ n5COþ n6OH
þ n7O2 þ n8Oþ n9H2 þ n10H ð12Þ
The eddy-dissipation model37 is adopted to predict the rate ofcombustion reaction between kerosene and oxygen. Thismethod is a turbulence–chemistry interaction model, where the
rate (Ri,r) at which species i is produced due to reaction r, isgiven by the limiting value of Eqs. 13 and 14. An iterativeapproach is used4 to estimate the mole fraction of each productspecies appearing on the right hand side of Eq. 12, to achievethe correct combustion chamber pressure and thermal flowfield.
Ri;r ¼ v0i;rMx;iAqek
minR
YRv0R;rMx;R
!(13)
Ri;r ¼ v0i;rMx;iABqek
PP YPPN
J v00j;rMx;j
!(14)
The k-e model38 is the most frequently used turbulence model incomputing flows within a practical engineering environment. Themodel assumes that the turbulent viscosity of the flow is isotropicand the flow is fully turbulent. One of the main downfalls of thestandard k-e model is its inability to accurately predict thespreading rate of an axisymmetric planar jet. This problem wasthought to originate within the equation of turbulent dissipation.Hence, the realizable k-e model39 addresses this by containing amodified transport equation to describe the rate of turbulentdissipation. Equations 15 and 16 describe the transport of turbulentkinetic energy and the rate of turbulent dissipation.
@
@rðrqkvrÞ þ
@
@xðrqkvxÞ ¼
@
@xr lþ lt
rj
� �@k
@x
� �
þ @
@rr lþ lt
rj
� �@k
@r
� �þ rðGk þ Gb � q�� YMÞ ð15Þ
@
@xðrqevxÞ þ
@
@rðrqevrÞ ¼
@
@rr lþ lt
re
� �@e@r
� �
þ @
@xr lþ lt
re
� �@e@x
� �
þ r qC1Se� qC2
e2
k þffiffiffiffive
p þ qC1eekC2eGb
� �ð16Þ
The realizable model also considers the requirement of a morecomplete description of the normal stresses, which makes themodel physically more complete. The normal stress is bydefinition, positive and to satisfy this requirement Cl is madevariable in relation to the mean flow and the turbulence, asdefined in Eq. 17. Then, the variable Cl is directly applied toestimate the tubulent viscosity lt.
Cl ¼ 1
A0 þ AsðkU�=eÞ (17)
Droplet Dynamics with Heat and Mass Transfer
Spherical, discrete-phase water droplets are injected verti-cally into the barrel at the standard powder inlet port, asshown in Figure 2. The acceleration of each droplet particleis calculated using Newton’s second law, equating the inertiaof each droplet with the forces applied by the continuum,described by Eq. 18.
dupdt
¼ 18lqpd2
p
CDRep24
ðv� upÞ þ Ft (18)
Subsequently, the trajectory of each droplet is tracked bycomputing its displacement through time. Ft is a source termwhich accounts for the thermophoretic force. This force arises
3536 DOI 10.1002/aic Published on behalf of the AIChE November 2012 Vol. 58, No. 11 AIChE Journal

due to temperature gradients within the flow. As outlined inprevious studies,40 in particle laden flows where the relativeMach number Mr exceeds 0.6 shock patterns form on theparticle surface. Therefore, the calculation of the particle drag
force should include both the particle Reynolds number andthe relative Mach number. For this reason, the drag forcecoefficient CD is calculated using the model proposed byHenderson,41 as given in Eqs. 19–21.
IF M\1 :
CD¼24 ReþS 4:333:65 � 1:53
TpT
1 þ 0:353TpT
!�expð�0:247
Re
SÞ
( )" #�1
þ exp � 0:5MffiffiffiffiffiffiRe
p� �
4:5 þ 0:38ð0:03Reþ 0:48ffiffiffiffiffiffiRe
pÞ
1 þ 0:03Reþ 0:48ffiffiffiffiffiffiRe
p þ 0:1M2 þ 0:2M8
� �þ 1 � exp � M
Re
� �� �0:6S ð19Þ
IF M > 1:75 :
CD ¼0:9 þ 0:34
M21þ 1:86 M1
Re1
� �0:52 þ 2
S21þ 1:058
S1
TpT
� �0:5� 1
S41
� �
1 þ 1:86 M1Re1
� �0:5
(20)
IF 1\M\1:75 :
CDðM1;Re1Þ ¼ CDð1;Re1Þ
þ 4
3ðM1 � 1Þ½CDð1:75;Re1Þ � CDð1;Re1Þ� ð21Þ
The droplet temperature during heating and vaporization isgoverned by Eq. 22. The convective heat-transfer coefficientbetween each droplet and the gaseous phase in which they aresubmersed is calculated using the Ranz–Marshall correla-tion42,43 given in Eq. 23. The variation in specific heatcapacity with temperature for liquid water is applied usingdata presented in the literature.44
mpcpdTpdt
¼ hApðT1 � TpÞ þdmp
dthfg (22)
Nu ¼ hdpK1
¼ 2:0 þ 0:6Re12pPr
13 (23)
During vaporization, the reduction of the droplet’s massbegins to reduce in accordance to Eq. 24. If Ni is negative, andhence, the droplet temperature is lower than the dew point acondensation conditions would exist. In this instance, Ni is setto zero, and the droplet will undergo inert heating and cooling.The vapor concentration at the droplet outer surface Ci,s iscalculated by assuming that the vapor partial pressure isequivalent to its saturation vapor pressure, Psat at Tp. Therelationship between the temperature of the droplet Tp and thesaturation vapor pressure Psat(Tp) is calculated using the well-known Clapeyron–Clausius relation.45
mpðtþ DtÞ ¼ mpðtÞ � NiApMx;iDt (24)where,
Ni ¼ kcðCi;s � Ci;1Þ
Ci;s ¼psatðTpÞRTp
Ci;1 ¼ Xi
p
RT1
The mass-transfer coefficient is evaluated through the Sher-wood number correlation,42,43 given by Eq. 25. The diffusioncoefficient is calculated using the binary diffusion relationprovided by Ref. 46, whereby the average molecular weight ofthe gas phases is calculated using the mass-fraction of eachgaseous species within the gas phase surrounding thevaporizing droplet.
kc ¼Di;m
dp2:0 þ 0:6Re
12pSc
13
� �(25)
Droplet breakup
For the simulation of primary droplet breakup, the wavebreakup model43 is applied which simulates the strippingbreakup mechanism. This model is appropriate for highspeed applications, where We [ 100, as defined in Eq. 26.The model considers the breakup of the droplets due to therelative velocity between the gas and liquid phases creatingKelvin–Helmholtz instabilities. The model assumes that thetime of breakup and the resulting droplet sizes are related tothe fastest growing Kelvin–Helmholtz instabilities at thedroplet surface, where the droplet–gas interface exists.
We ¼ q1V2reldpr
(26)
Figure 3. Diagram showing surface wave and breakupmechanism on a liquid blob droplet.
[Color figure can be viewed in the online issue, which is
available at wileyonlinelibrary.com.]
AIChE Journal November 2012 Vol. 58, No. 11 Published on behalf of the AIChE DOI 10.1002/aic 3537
The droplet breakup is simulated by assuming the radius of thechild droplets is proportional to the wavelength of the fastestgrowing unstable surface wave on the parent droplet, asdescribed by Eq. 27, and depicted in Figure 3, where B0 is amodel constant equal to 0.61.47 The maximum growth rate, X,and its corresponding wavelength, K, are estimated by Eqs. 28and 29, respectively.
rp ¼ B0K (27)
X ¼ ð0:34 þ 0:38We1:52 Þ
ð1 þ OhÞð1 þ 1:4Ta0:6Þq1a
3
r
� ��1
(28)
K ¼ 9:02að1 þ 0:45Oh0:5Þð1 þ 0:4Ta0:7Þ
ð1 þ 0:8We1:672 Þ0:6
(29)
The rate of change of droplet radius of the parent droplet iscalculated by Eq. 30, where the breakup time s is given in Eq.31. The model constant B1 is tested for values of 1 and 10.Variations in viscosity and surface tension with temperaturefor the liquid water droplets are applied using data correlationsfrom the literature, respectively.48,49
da
dt¼ �ða� rpÞ
sp(30)
sp ¼3:726B1a
KX(31)
For the secondary droplets whose We are far less than 100, theTaylor analogy breakup (TAB) model is applied. Thisapproach is based on Taylor’s analogy50 between an oscillat-ing and distorting droplet and a spring mass system. When theoscillations of the parent droplet grow to a critical value, breakup occurs, and several smaller droplets are created. Thecriterion for droplet break up is based on the distortion ratio.The nondimensional mass, spring, damper system for thecalculation of droplet distortion is given in Eq. 32, wherebreak up occurs if y[ 1.
€y ¼ CF
Cb
qgqp
V2rel
r2p
� Ckrqpr3
p
� CdVrel
qpr2p
_y (32)
The droplet oscillation frequency and the undamped oscilla-tion amplitudes are calculated using Eqs. 33 and 34. Breakupis only possible if the condition in Eq. 35 is met.
A ¼
ffiffiffiffiffiffiffiffiffiffiffiffiffiffiffiffiffiffiffiffiffiffiffiffiffiffiffiffiffiffiffiffiffiffiffiffiffiffiffiffiffiffiffiffiffiffiffiffiffiffiffiffiffiffiffiðyn �WecÞ2 þ ðdy=dtÞn
x
� �2s
(33)
x2 ¼ Ckr
qlr3¼ 1
t2d(34)
Wec þ A > 1 (35)
If this condition is met, the breakup time is calculated based onthe time required for y to equal unity. If the breakup time isgreater than the droplet time at the next droplet time step thenbreakup will not occur during the current time step, and y and(dy/dt) are updated accordingly. Conversely, if the current andnext droplet time steps are less than and greater than thedroplet breakup time, respectively, breakup will occur. Thechild droplet radii are determined by Eq. 36, which is derivedby equating the energy of the parent droplet to the combined
energy of the child droplets.
r32 ¼ r
1 þ 8Zy2
20þ qpr3ðdy=dtÞ2
r6Z�5120
� (36)
The empirical constants applied for the wave breakup modeland TAB model are based on recommended values, and thepredicted breakup times and child droplet sizes compare wellto experimental observations, as presented later in thisinvestigation.
Results and Discussion
Gas-phase dynamics summary
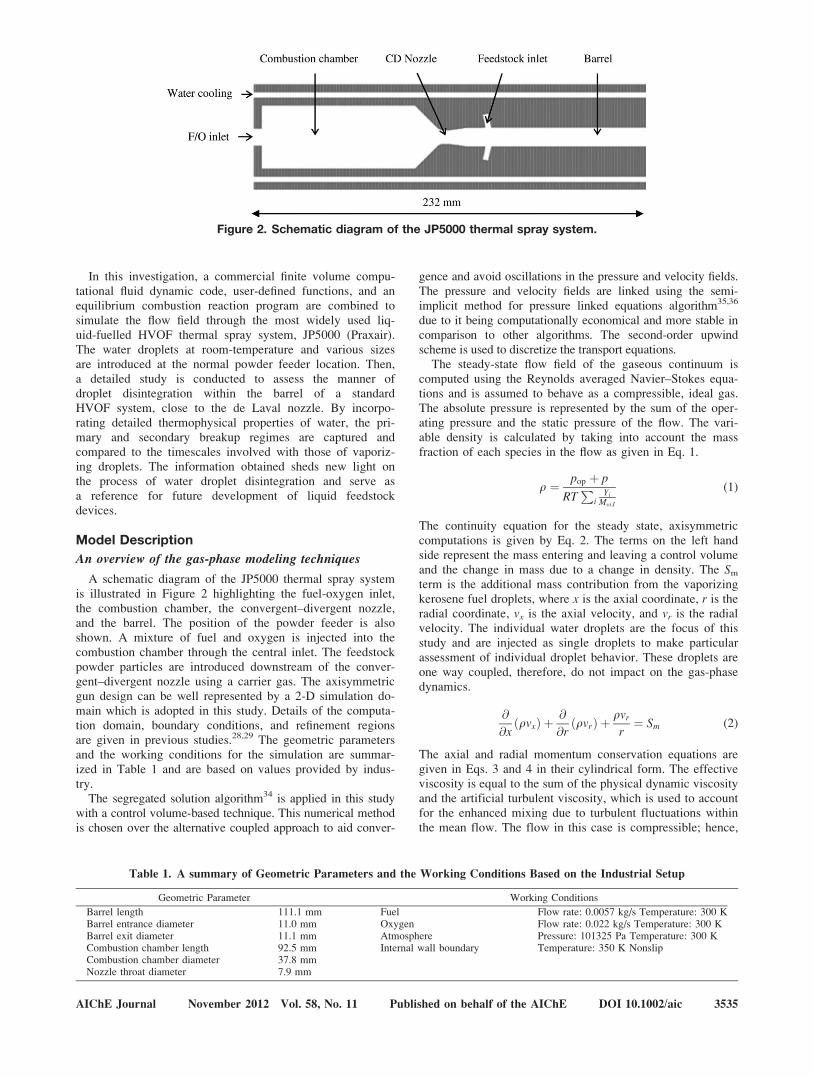
The steady state, compressible flow field through theHVOF thermal spray system is captured based on the indus-trial fuel and oxygen injection flow rates, as listed in Table1. The simulated velocity distribution at the barrel exit iscompared with experimental observations51 in Figure 4, withthe simulated under expanded jet structure showing a goodphysical likeness. The flame temperature within the combus-tion chamber is compared to the expected values for varyingequivalence ratios in Figure 5a, and the temperature varia-tions at the exit of the barrel are also compared to experi-mental measurements52 in Figure 5b, both showing goodconcordance.
The process is initialized by injecting liquid fuel dropletsinto the combustion chamber with pure oxygen gas wherethey heat, evaporate, and then exothermically combust, creat-ing a highly pressurized gaseous mixture at a maximumflame temperature of 3377 K. The simulated exhaust gasmixture consisting of O, O2, H, H2, OH, H2O, CO2, and COexits the combustion chamber. At the convergent–divergentnozzle, the gas is rapidly accelerated. At the throat of theconvergent–divergent nozzle, the flow is choked at Machone. Two small discontinuities follow as the gas expandsand accelerates through the divergent section, marked byslight increases in velocity along the centerline. These flowcharacteristics are described by the interlinked gas velocity,temperature, and pressure along the centerline as depicted inFigure 6. Several shocks occur through the barrel due to the
Figure 4. Comparison between simulated gas-phasevelocity contours (ms21) (a) and an experi-mental image51 (b) of the under expandedflow regime at the JP5000 barrel exit.
[Color figure can be viewed in the online issue, which is
available at wileyonlinelibrary.com.]
3538 DOI 10.1002/aic Published on behalf of the AIChE November 2012 Vol. 58, No. 11 AIChE Journal

expansion of the supersonic gas and strong reflections at thesolid internal surface of the barrel. An under-expanded flowregime at the exit of the barrel is present, enforced by aslightly subcritical atmospheric back pressure. The fluctua-tions in flow properties at the exit of the barrel are createdby the flow periodically over expanding and then reconverg-ing above and below atmospheric pressure. These adjust-ments continually overshoot due to the boundary communi-cating with the jet by sound waves, which naturally travelslower than the bulk supersonic flow.
Droplet investigation
Water droplets are injected vertically into the barrel at thepowder inlet port 0.138 m from the combustion chamberback wall, as depicted in Figure 2. Their initial droplet ve-locity is 20 ms�1, and this process is repeated for dropletsizes varying between 50 and 500 lm. First, the droplets aresimulated to breakup without vaporization as predicted bythe wave breakup model. Figure 7 describes the modeled lin-ear decrease in a 50-lm parent droplet diameter as the childdroplets are shed from its surface. The modeling constant B1
is set to both 1 and 10. These values represent a lower andupper limit of this coefficient and directly control the rate atwhich the droplet breaks up (Eq. 31). The time taken for the50-lm parent droplet to completely breakup is, therefore,estimated to be between 2.2 ls and 16.5 lm. This process isrepeated for increasing droplet sizes, and the time taken foreach parent droplet to shed all of its mass is plotted in Fig-ure 8 for both values of B1. For the 500-lm parent dropletthis time may, therefore, be between 17 and 115 ls.
Figure 9a plots the converging size of the child dropletsduring the breakup process with initial parent droplet diame-
ters varying from 50 to 500 lm, as predicted by the wavebreakup model. The dimensionless time in this graph repre-sents the total time from injection of the initial parent drop-let divided by the time taken for the initial parent droplet tocompletely disintegrate (see Figure 8) with a B1 value ofunity. Because of the continuing decrease in child dropletsize beyond a dimensionless time of 1, it is clear a second-ary atomization process is simulated. The primary dropletsare filtered from the data presented in Figure 9a and areplotted in Figure 9b. The results indicate that the initial pri-mary child droplets are roughly 4.5–4.6 lm for all the testedparent droplets. The data obtained also indicates that as theinitial parent droplet size is increased from 50 to 500 lm,the average primary child droplet size decreases. Conse-quently, the minimum primary droplet size obtained is 2.3lm for the 500 lm parent droplet.
Figure 10 describes the rate of evaporation and decreasein droplet diameter of a 50-lm droplet without breakupbeing modeled. The results indicate that a 50-lm diameterdroplet only decreases by 6 lm in a time of 0.5 ms, at whichpoint the parent droplet reaches the exit of the computationaldomain. Furthermore, the decrease in particle diameter dueto evaporation within the time taken for the 50 lm droplet
Figure 6. Variations in gaseous velocity (a), tempera-ture (b), and pressure (c) along the centerlineof the simulated HVOF torch.
[Color figure can be viewed in the online issue, which is
available at wileyonlinelibrary.com.]
Figure 5. Graph showing the flame temperature varia-tion for changes in equivalence ratio52 (a) andcomparison between point measured temper-atures52 and modeled temperature distribu-tion at the exit of the barrel (b).
[Color figure can be viewed in the online issue, which is
available at wileyonlinelibrary.com.]
AIChE Journal November 2012 Vol. 58, No. 11 Published on behalf of the AIChE DOI 10.1002/aic 3539

to shed its mass during breakup (i.e., between 2.2 ls to 16lm) is at most 0.03%. From these result, it is clear that theprimary droplet break up regimes for the tested parent drop-lets occur on a much smaller time scale compared to the va-porization process.
Figure 11 plots the times taken for a range of smallersized droplets to decrease their mass by 10% due to vapori-zation alone, and also the time taken for these droplets tocompletely disintegrate due to breakup predicted by theTAB model. The initial displacement, velocity, and tempera-ture of these droplets are representative of the droplets emit-ted by the wave breakup model. As the results suggest, for a10-lm droplet the evaporation time far exceeds the breakuptime. As the droplet size is decreased, these timescalesbecome more comparable. When the droplet diameter is
between 2.5 and 3 lm, the breakup time increases rapidly.Within this small size range, vaporization suddenly becomesthe main driving force for the droplet disintegration.
In Figure 12, the breakup simulation results are presentedalongside several different experimental observations show-ing a good level of agreement in all cases. Figure 12a com-pares the nondimensional child droplet sizes (d/D0) with theinitial parent droplet We. The experimental observations aretaken from Refs. 53–56, and the simulation points plottedinclude all tested particle sizes from 500 to 2.5 lm. Figure12b compares the dimensionless time taken to initiatebreakup for particles with varying We, where the experimen-tal observations are from Ref. 53 and the four simulationpoints plotted represent the dimensionless times for dropletsizes: 10, 7, 4, and 3 lm. The 2.5-lm droplet requires adimensionless time of 60.0 for breakup to initialize, andtherefore, resides outside the plotted region. Finally, Figure12c plots experimentally measured57 critical Weber number
Figure 7. Graph describing the rate of decrease in 50lm droplet diameter and the child dropletsizes for B1 values of 1 (a) and 10 (b).
[Color figure can be viewed in the online issue, which is
available at wileyonlinelibrary.com.]
Figure 8. Graph comparing the time required for differ-ent sized initial parent droplets to shed alltheir mass. Both sets of data for B1 values of1 and 10 are presented.
[Color figure can be viewed in the online issue, which is
available at wileyonlinelibrary.com.]
Figure 9. Stabilization of child droplet sizes for differ-ent initial parent droplets (a) and filteredresults containing only initial primary childdroplets (b).
[Color figure can be viewed in the online issue, which is
available at wileyonlinelibrary.com.]
Figure 10. Graph showing the rate of decrease in di-ameter of an evaporating 50 lm droplet.
3540 DOI 10.1002/aic Published on behalf of the AIChE November 2012 Vol. 58, No. 11 AIChE Journal

Wecrit against the droplet Ohnesorge number. These resultsare compared to the simulation breakup of the small drop-lets: 10, 7, 4, 3, and 2.5 lm.
As Figure 12a illustrates, the child droplet sizes predictedby the wave breakup model are in close agreement with theexperimental observations. Although TAB breakup simula-tion results lie outside the experimental data range, theirsizes follow a logical trend alongside the wave breakupmodel. As exhibited, a maximum dimensionless child dropletsize ratio exists in the region of the 2.5 and 3 lm parentdroplets, with corresponding We of 10.5 and 12.6, respec-tively. Figure 12b illustrates how the time required to initiatebreakup, as predicted by the TAB model, increases continu-ously with decreasing We number. For droplets below 3 lmand We less than 12.6, the time required increases rapidly.Both the experimental and simulation results presented inFigure 12c are in agreement with Figure 12b, indicating thatwhen the droplet size is reduced below 2.5 lm We fallsbelow Wecrit of roughly 12, resulting in exponential increasesin breakup initiation times.
It is evident that the disintegration process of a water drop-let between 50 and 500 lm injected into a HVOF-type sys-tem is dependant on both aerodynamic breakup and vaporiza-tion to varying degrees; and depends on the droplet fragmen-tation sizes produced. The respective mass-weighted averagediameters of the primary child droplets shed from the 50,100, 200, and 500 lm parent droplets are 4.403, 4.149,3.798, and 3.342, respectively. The transition region high-lighted in Figure 11 marks the region in which the vaporiza-tion mode becomes the dominant form of disintegration pro-cess. Looking back at Figure 9b, for a 200-lm parent droplet,
the smallest primary child droplets are close to the transitionboundary, whereas for a 500-lm parent droplet roughly halfof the primary child droplets reside within the transitionzone. As a result, for an initial parent droplet smaller than200 lm, the disintegration process for its primary child drop-lets is governed by breakup only. The resulting secondarychild droplets then vaporize without breakup. For an initialparent droplet greater than 200 lm, the disintegration process
Figure 11. Time taken for various sized droplets to ei-ther breakup or for their mass to decreaseby 10% of their original mass due to vapori-zation.
[Color figure can be viewed in the online issue, which
is available at wileyonlinelibrary.com.]
Figure 12. Comparisons between simulations and ex-perimental observation: Time to initiatebreak up (a), child droplet sizes (b), and thecritical We (c).
[Color figure can be viewed in the online issue, which
is available at wileyonlinelibrary.com.]
Figure 13. Path diagram showing the different water droplet disintegration routes when injected into a HVOF jet.
[Color figure can be viewed in the online issue, which is available at wileyonlinelibrary.com.]
AIChE Journal November 2012 Vol. 58, No. 11 Published on behalf of the AIChE DOI 10.1002/aic 3541

for its primary child droplets may follow one of two routes.For the child droplets larger than 3 lm, disintegration is gov-erned by aerodynamic breakup only, and then vaporization.For the droplets between 2.5 and 3 lm, disintegration isdriven simultaneously by both vaporization and aerodynamicbreakup. These investigated droplet disintegration regimesare finally summarized schematically in Figure 13.
The characterized disintegration process may be controlledto some extent, by the predetermined properties of the solutionor suspensions being sprayed, and by doing so, the depositionprocess can be optimized for the spray method at hand.
For instance, fragmentation of the feedstock depends onthe Weber (We) and Ohnesorge (Oh) numbers and can betailored by adjusting the liquid viscosity. For example, inliquid precursor thermal spraying, it has been shown thatchanging the concentration of 7 wt % yttria-stabilized zirco-nia from 0.6 to 2.4 mol raises the solution viscosity from0.0014 to 0.007 Pa S.58 For suspensions, certain additivessuch as polyvinyl alcohol can be used to increase the sus-pension viscosity.59,60 The suspension solid volume fractionand particle-size distribution influences the suspension vis-cosity, but to a less extent, and can be expected to raise theviscosity by no more than 50%.61,62
In general, the fundamental understanding of liquid feed-stock thermal spraying is still in its infancy and the optimumfeedstock configurations such as concentrations of solid par-ticles, additives, dispersants, and precursor solutions, as wellas the particle-size and size distributions, and type of solventused for different deposited materials and for different proc-essing methods are not yet fully determined. Furthermore,the levels of experimental data trends for estimating the ther-mophysical properties such as viscosity, surface tension, spe-cific heat capacity, and thermal conductivity during the com-plete liquid disintegration process are limited. The resultspresented serve as a baseline study for liquid feedstockinjection using detailed water properties to study the liquiddroplet disintegration process. The insight gained from thestudy is a useful step forward in the understanding and ongoing developments of liquid feedstocks in thermal spraying.
Conclusions and Future Work
The disintegration process of water droplets between 50and 500 lm entering a HVOF-type system are simulated andthe breakup time scales and droplet sizes compare well toexperimental observations. The results obtained indicate thatthe droplet disintegration process is dependant on the initialparent droplet sizes. An initial parent droplet between 50and 200 lm in size will breakup, forming droplets whichthen vaporizes. For a parent droplet between 200 and 500lm, a fraction of the child droplets will undergo vaporiza-tion, and a fraction will undergo further breakup and simul-taneous vaporization.
Acknowledgments
The authors gratefully acknowledge the financial support from EUFP7 SIMUSPRAY Project (Grant No. 230715) and FP7 ECOFUEL pro-ject (Grant No. 246772).
Notation
General symbols
Ap ¼ surface area of a particleA0 ¼ constant in realizable k-e model (4.04)
As ¼ constant in eddy dissipation model (4.0)a ¼ decreasing parent droplet radiusB0 ¼ wave breakup model constantB1 ¼ wave breakup model constantC1 ¼ constant for the linear pressure strain model (1.8)C1e ¼ constant for the turbulent dissipation of energy (1.44)C2 ¼ constant for the linear pressure strain model (0.6)C2e ¼ constant for the turbulent dissipation of energy (1.92)CD ¼ Drag coefficientCp ¼ specific heat capacity at constant pressureCb ¼ TAB model constant (0.5)Cd ¼ TAB model constant (5)CF ¼ TAB model constant (1/3)Ck ¼ TAB model constant (8)dp ¼ particle diameter
Di,m ¼ diffusion coefficient of water vapor in the bulk flowE ¼ total energyF ¼ additional force termGb ¼ generation of turbulence energy due to buoyancyGk ¼ generation of turbulence energy due to mean velocity gradientsh ¼ convective heat-transfer coefficient
hfg ¼ enthalpy of vaporizationK ¼ thermal conductivityk ¼ turbulent kinetic energykc ¼ mass-transfer coefficientm ¼ massM ¼ Mach number
Mx,i ¼ molecular weight of species iNi ¼ molar flux of vaporNu ¼ Nusselt numberOh ¼ Ohnesorge numberP ¼ pressurePr ¼ Prandtl numberPsat ¼ saturated pressure
r ¼ radial distance from centerlinerp ¼ particle radiusr32 ¼ Sauter mean radius of the droplet size distributionRi,r ¼ net rate of production of species i due to reaction rR ¼ universal gas constantRe ¼ Reynolds numberS ¼ molecular speed ratioSc ¼ Schmidt numberSm ¼ mass source termTa ¼ Taylor numbert ¼ TimeT ¼ Temperatureup ¼ particle velocityv ¼ gas-phase velocity
vrel ¼ relative velocity magnitude between the gas phase and discretedroplet
v0i;r ¼ stoichiometric coefficient for reactant i in reaction rv00j;r ¼ stoichiometric coefficient for product i in reaction r
We ¼ Weber numberXi ¼ local bulk mole fractionY ¼ local bulk mass fractiony ¼ nondimensional distortion
YM ¼ contribution of the fluctuating dilatation in compressibleturbulence to dissipation rate
Z ¼ ratio of total energy in distortion and oscillation to the energy inthe fundamental mode
Greek letters
e ¼ turbulent kinetic energy dissipation ratel ¼ dynamic viscosityq ¼ densityr ¼ particle surface tensionK ¼ wavelength of most unstable wave on droplet surfacesp ¼ particle breakup timeX ¼ maximum growth rate for the droplet surface instability wavesu ¼ kinematic viscosityrk ¼ turbulent Prandtl number for kre ¼ turbulent Prandtl number for e
Subscripts
eff ¼ sum of the physical and turbulent valuesi ¼ referring to one of many speciesp ¼ particle
3542 DOI 10.1002/aic Published on behalf of the AIChE November 2012 Vol. 58, No. 11 AIChE Journal

r ¼ radial coordinate directionR ¼ reactantt ¼ thermophoreticx ¼ axial coordinate direction
1 ¼ free stream conditions
Mathematical operators
q ¼ partial differential! ¼ Del operatorD ¼ difference between two quantities of a variable~v ¼ vector form of variablev ¼ time derivative€v ¼ double time derivative
Literature Cited
1. Fauchais P, Vardelle A. Innovative and emerging processes inplasma spraying: from micro- to nano-structured coatings. J Phys D:Appl Phys. 2011;44:1–14.
2. Kumar A, Bae G, Kang K, Yoon S, Lee C. Effect of powder stateon the deposition behaviour and coating development in kineticspray process. J Phys D: Appl Phys. 2009;42:1–8.
3. Yoon S, Xiong Y, Kim H, Lee C. Dependence of initial powdertemperature on impact behaviour of bulk metallic glass in a kineticspray process. J Phys D: Appl Phys. 2009;42:1–5.
4. Li M, Christophides PD. Modelling and control of high-velocity ox-ygen-fuel (HVOF) thermal spray: a tutorial review. J Therm SprayTechnol. 2009;18:753–768.
5. O’Regan B, Gratzel M. A low-cost, high-efficiency solar cell basedon dye-sensitized colloidal TiO2 films. Nature. 1991;353:737–740.
6. Bai X, More K, Rouleau CM, Rabiei A. Functionally graded hy-droxyapatite coating doped with antibacterial components. Acta Bio-mater. 2010;6:2264–2273.
7. Fauchais P, Montavon G, Lima R, Marple BR. Engineering a newclass of thermal spray nano-based microstructures from agglomer-ated nanostructured particles, suspensions and solutions: an invitedreview. J Phys D: Appl Phys. 2011;44:1–53.
8. Killinger A, Gadow R, Mauer G, Guignard A, Vaßen R, Stover D.Review of new developments in suspension and solution precursorthermal spray processes. J Therm Spray Technol. 2011;20:677–695.
9. Fauchais P, Montavon G. Latest developments in suspension andliquid precursor thermal spraying. J Therm Spray Technol. 2010;19:226–239.
10. Pawlowski L. Suspension and solution thermal spray coatings. SurfCoat Technol. 2009;203:2807–2829.
11. Pawlowski L. Finely grained nanometric and submicrometric coat-ings by thermal spraying: a review. Surf Coat Technol. 2008;202:4318–4328.
12. Huang Y, Song L, Liu X, Xiao Y, Wu Y, Chen J, Wu F, Gu Z. Hy-droxyapatite coatings deposited by liquid precursor plasma spraying:controlled dense and porous microstructures and osteoblastic cellresponses. Biofabrication. 2010;2:1–10.
13. Vaßen R, Yi Z, Kaßner H, Stover D. Suspension plasma spraying ofTiO2 for the manufacture of photovoltaic cells. Surf Coat Technol.2009;203:2146–2149.
14. Toma F-L, Berger L-M, Stahr CC, Naumann T, Langner S. Microstruc-tures and functional properties of suspension-sprayed Al2O3 and TiO2
coatings: an overview. J Therm Spray Technol. 2010;19:262–274.15. Bonini M, Bardi U, Berti D, Neto C, Baglioni P. A new way to
prepare nanostructured materials: flame spray of microemulsions.J Phys Chem B. 2002;106:6178–6183.
16. Makela JM, Keskinen H, Forsblom T, Keskinen J. Generation ofmetal and metal oxide nanoparticles by liquid flame spray process.J Mater Sci. 2004;39:2783–2788.
17. Heine MC, Pratsinis SE. Droplet and particle dynamics during flamespray synthesis of nanoparticles. Ind Eng ChemRes. 2005;44:6222–6232.
18. Li C-J, Yang G-J, Wang Z. Formation of nanostructured TiO2 by flamespraying with liquid feedstock. Mater Lett. 2003;57:2130–2134.
19. Yang G-J, Li C-J, Wang Y-Y. Phase formation of nano-TiO2 par-ticles during flame spraying with liquid feedstock. Therm SprayTechnol. 2005;14:480–486.
20. Killinger A, Kuhn M, Gadow R. High-velocity suspension flamespraying (HVSFS), a new approach for spraying nanoparticles withhypersonic speed. Surf Coat Technol. 2006;201:1922–1929.
21. Bolelli G, Rauch J, Cannillo V, Killinger A, Lusvarghi L, Gadow R.Microstructural and tribological investigation of high-velocity sus-
pension flame sprayed (HVSFS) Al2O3 coatings. J Therm SprayTechnol. 2009;18:35–49.
22. Oberste-Berghaus J, Legoux J-G, Moreau C, Hui R, Deces-Petit C,Qu W, Yick S, Wang Z, Maric R, Ghosh D. Suspension and HVOFspraying of reduced temperature solid oxide fuel cell electrolytes.J Therm Spray Technol. 2008;17:700–707.
23. Meillot E, Vert R, Caruyer C, Damiani D, Vardelle M. Manufacturingof nanostructured YSZ coatings by suspension plasma spraying (SPS):effect of injection parameters. J Phys D: Appl Phys. 2008;44:1–8.
24. Basu S, Cetegen BM. Modelling of thermo-physical processes in liq-uid ceramic precursor droplets injected into a plasma jet. Int J HeatMass Transfer 2007;50:3278–3290.
25. Basu S, Cetegen BM. Modeling of liquid ceramic precursor dropletsin a high velocity oxy-fuel flame jet. Acta Mater. 2008;56:2750–2759.
26. Gadow R, Killinger A, Rauch J. New results in high velocity suspensionflame spraying (HVSFS). Surf Coat Technol. 2008;202:4329–4336.
27. Tikkanen J, Gross KA, Berndt CC, Pitktnen V, Keskinen J, RaghuS, Rajala M, Karthikeyan J. Characteristics of the liquid flame sprayprocess. Surf Coat Technol. 1997;90:210–216.
28. Tabbara H, Gu S. Computational simulation of liquid-fuelled HVOFthermal spraying. Surf Coat Technol. 2009;204:676–684.
29. Tabbara H, Gu S. Computational modelling of titanium particles inwarm spray. Comput Fluids. 2011;44:358–368.
30. Tabbara H, Gu S, McCartney DG, Price TS, Shipway PH. Study onprocess optimization of cold gas spraying. J Therm Spray Technol.2010;20:608–620.
31. Li M, Christofides PD. Multiscale modeling and analysis of an indus-trial HVOF thermal spray process. Chem Eng Sci. 2005;60:3649–3669.
32. Shi D, Li M, Christofides PD. Diamond jet hybrid HVOF thermalspray: rule-based modeling of coating microstructure. Ind Eng ChemRes. 2004;43:3653–3665.
33. Li M, Shi D, Christofides PD. Diamond jet hybrid HVOF thermalspray: gas-phase and particle behavior modeling and feedback con-trol design. Ind Eng Chem Res. 2004;43:3632–3652.
34. Van Doormal JP, Raithby GD, McDonald BH. The segregatedapproach to predicting viscous compressible fluid flows. J Turbom-ach. 1987;109:268–277.
35. Peric M. Analysis of pressure–velocity coupling on non-orthogonalgrids. Numer Heat Transfer Part B. 1990;17:63–82.
36. Raithby GD, Schneider GE. Numerical solution of problems in com-pressible fluid flow: treatment of the velocity–pressure coupling.Numer Heat Transfer. 1979: 2; 417–440.
37. Magnussen BF, Hjertager BH. On mathematical models of turbulentcombustion with special emphasis on soot formation and combus-tion. Int Symp Combust. 1977;16:719–729.
38. Launder BE, Spalding DB. Lectures in Mathematical Models of Tur-bulence. London: Academic Press, 1972.
39. Shih TH, Liou WW, Shabbir A, Zhu J. A new eddy viscosity modelfor high Reynolds number turbulent flows. Comput Fluids.1995;24:227–238.
40. Crowe C, Sommerfeld M, Tsuji Y. Multiphase Flows With Dropletsand Particles. Boca Raton: CRC Press, 1998:73.
41. Henderson CB. Drag coefficients of spheres in continuum and rare-fied flows. AIAA J. 1976;14:707–708.
42. Ranz WE, Marshall WR. Evaporation from drops (part I). ChemEng Prog. 1952;48:141–146.
43. Ranz WE, Marshall WR. Evaporation from drops (Part II). ChemEng Prog. 1952;48:173–180.
44. Touloukian YS. Specific Heat: Nonmetallic Liquids and GasesThermophysical Properties of Matter TPRS Data Series. The Uni-versity of Michigan: IFI/Plenum, 1970. p. 102.
45. Cengal YA, Boles M. Thermodynamics: An Engineering Approach,4th ed. New York: McGraw-Hill, 2002:610–612.
46. Bird RB. Transport phenomena. USA: Wiley. 1960. p. 505.47. Reitz RD. Mechanisms of atomization processes in high-pressure
vaporizing sprays. Atom Spray Technol. 1987;3:309–337.48. Deguchi S, Ghosh SK, Alargova RG, Tsujii K. Viscosity measure-
ments of water at high temperatures and pressures using dynamiclight scattering. J Phys Chem B. 2006;110:18358–18362.
49. Kestin J, Sengers JV, Kamgar-Parsi B, Levelt Sengers JMH. Thermo-physical properties of H2O. J Phys Chem Ref Data. 1984;13:175–183.
50. Taylor GI. The shape and acceleration of a drop in a high speed airstream. Technical report, The Scientific Papers of G.I. Taylor, Vol.3, ed., G.K. Batchelor. University Press Cambridge, 1963.
51. Hackett CM, Settles GS. The influence of nozzle design on HVOFspray particle velocity and temperature. In: Berndt CC, Sampath S,editors. 1995 Advances in Thermal Spray Science & Technology,
AIChE Journal November 2012 Vol. 58, No. 11 Published on behalf of the AIChE DOI 10.1002/aic 3543

Proceedings of the 8th National Thermal Spray Conference. Materi-als Park, OH: ASM International, 1995.
52. Swank WD, Fincke JR, Haggard D, Irons G. HVOF gas flow fieldcharacteristics. In: Berndt CC, Sampath S, editors. Thermal SprayIndustrial Applications, Proceedings of the 7th National ThermalSpray Conference. Materials Park, OH: ASM International, 1994.
53. Wolfe HE, Anderson WH. Kinetics, mechanism, and resultant dropletsizes of the aerodynamics breakup of liquid drops. AGCD Report No.0395-04 (18) SP, Aerojet General Corp., Downey, California. 1964.
54. Lane WR, Prewett WC, Edwards J. Some Experiments on the Shat-ter of Drops by Transient Blasts of Air. Technical Paper No. 115,Serial 15, Porton, England. 1949.
55. Lane WR. Shatter of drops in stream of air. Ind Eng Chem.1951;43:1312–1337.
56. Lane WR, Dorman RG. Further experiments on the shattering of drops bya supersonic air blast. Technical paper No. 279, Porton, England. 1952.
57. Haas FC. Stability of droplets suddenly exposed to a high velocitygas stream. AICHE J. 1964;10:920–924.
58. Chen D, Jordan EH, Gell M. Effect of solution concentration onsplat formation and coating microstructure using the solution precur-sor plasma spray process. Surf Coat Technol. 2008;202:2132–2138.
59. Rampon R, Toma F-L, Bertrand G, Coddet C. Liquid plasmasprayed coatings of yttria-stabilized zirconia for SOFC electrolytes.J Therm Spray Technol. 2006;15:682–688.
60. Rampon R, Filiatre C, Bertrand G. Suspension plasma spraying ofYPSZ coatings: suspension atomization and injection. J Therm SprayTechnol. 2008;17:105–114.
61. Roscoe R. The viscosity of suspensions of rigid spheres. Br J ApplPhys. 1952;3:267–269.
62. Nguyen CT, Desgranges F, Galanis N, Roya G, Mared T, BoucherS, Angue Mintsa HA. Viscosity data for Al2O3–water nanofluid—hysteresis: is heat transfer enhancement using nanofluids reliable?Int J Therm Sci. 2008;47:103–111.
Manuscript received Nov. 20, 2011, and revision received Jan. 9, 2012.
3544 DOI 10.1002/aic Published on behalf of the AIChE November 2012 Vol. 58, No. 11 AIChE Journal