A STUDY OF EMPLOYEE ATTITUDES AS THEY …summit.sfu.ca/system/files/iritems1/13881/Sonya Martin.pdfa...
93
A STUDY OF EMPLOYEE ATTITUDES AS THEY AFFECT ABSENTEEISM AND TURNOVER IN A GOVERm1ENT CORPORATION by Sonya Odilia Martin RESEARCH PROJECT SUBMITTED IN PARTIAL FULFILLMENT OF THE REQUIREMENTS FOR THE DEGREE OF MASTER OF BUSINESS ADMINISTRATION in the Department of Economics and Commerce i C i Sonya Odilia Martin \..,.-· ' SIMON FRASER UNIVERSITY May 1977 All rights reserved. This work may not be reproduced in whole or in part, by photocopy or other means, without permission of the author.
Transcript of A STUDY OF EMPLOYEE ATTITUDES AS THEY …summit.sfu.ca/system/files/iritems1/13881/Sonya Martin.pdfa...

A STUDY OF EMPLOYEE ATTITUDES
AS THEY AFFECT ABSENTEEISM AND TURNOVER
IN A GOVERm1ENT CORPORATION
by
Sonya Odilia Martin
RESEARCH PROJECT SUBMITTED IN PARTIAL
FULFILLMENT OF THE REQUIREMENTS FOR THE DEGREE OF
MASTER OF BUSINESS ADMINISTRATION
in the Department
of
Economics and Commerce
-~ i C i Sonya Odilia Martin \..,.-· '
SIMON FRASER UNIVERSITY
May 1977
All rights reserved. This work may not be reproduced in whole or in part, by photocopy or other means, without permission of the author.
Name:
Degree:
'I i.t:.Le of Research Project:
Stl~>E~rv.iso-r:y C~:::L~:_ t tee:
Sonya OJil ia Martin
Master of Business Adminjstration
A Study of Employee Attit:udcs as they Affect Absenteeism and Turnover in a Government Corporation
George c. Iioyt, Professol7
----~--·-· --·--~-··-·---------
A. Clifford Silcox, Assistant Professor

. " .
PARTIAL COPYRIGHT LICENSE
I hereby grant to Simon Fraser University the r~ght to lend
my thesis or dissertation (the title of which is shown below) to users
of the Simon Fraser University Library, and to make partial or single
copies only for such users or in response to a request from the library
of any other university, or other educational institution, on its ·own
behalf or for one of its users. I further agree that permission for
multiple copying of this thesis for scholarly purposes may be granted
by me or the Dean of Graduate Studies. It is understood that copying
or publication of this thesis for financial gain shall not be allowed
without my written permission.
Title of Research Project
absentceim'l ~.nd tUX'nover i n ~ r;nv2rn~,1cnt cor· o-ratinn .
Author:
(signature)
Sonya o. Martin
(name)
~Tune ?S1 /77 .
(date)

ABSTRACT
This study explored differences in attitude between two sections of
a B. C. government corporation as causes of absenteeism and turnover.
The two sections of the company under observation employ one hundred and
sixty-four people. No previous study of this kind has been carried out
in a governmental setting in this province.
As a preliminary indication of attitude differences, a casual
observation of five parameters -attendance, peer group interaction,
work habits, supervisory style and organizational climate, was used.
It was believed that these parameters would encompass all differences
in the attitudes and behavior between the two sections of the corpor
ation. The preliminary results did suggest a differential. These results
were used as a starting point for a more detailed study designed to
explore further- this distinction and to determine the variances in both
absenteeism and turnover which might be attri~uted to the different
attitudes.
A questionnaire consisting of twenty-one questions relating to
fi~e major variables was used. These variables were: job satisfaction,
peer group interaction, supervisory style, task repetitiveness and company
policy and salary. In addition three short written answers were
solicited in order to capture any possible employee attitudes which
may have been overlooked or not properly obtained with the previous
questions. The questionnaire was sent to one hundred and eighty-six

people (including some who had already left the company). Sixty-two
questionnaires were returned of which five were not completed (a com
pletion rate of slightly over 30%).
The results did not show any significant difference in attitude
levels or in perceived absenteeism between the two sections. Thus the
results failed to confirm the hypotheses generated from the observational
phase of the study. However (for the technical/clerical personnel
only), correlational tests revealed a strong negative correlation
between the five variables and absenteeism. For all personnel, four
of the five variables were negatively correlated to absenteeism (the
exception was 11 peer group interaction 11). Of these four, all but
supervisory style has been consistently confirmed in the literature.
(iv)

CONTENTS
ABSTRACT
CHAPTER I: Introduction
General Problem of Absenteeism and Turnover
Description of the Specific Problem under Study
CHAPTER II: Hypotheses
Literature Survey Relative to the Specific Elements
Conclusion Drawn from Literature Survey
Casual Observation and Results
Predicted Results based on Casual Observation and Literature Survey
CHAPTER III: Method of Research
CHAPTER IV:
CHAPTER V:
APPENDICES:
Questionnaire tool comments
Results Obtained from the Questionairre
Discussion
Conclusion
Results of Casual Observation
Sample Questionnaire
Details of Questionnaires sent
Details on Results
Bibliography
( v )
Page
1
1
3
6
16
18
22
22
26
52
58
62
64
71
72
84

FOREWORD
This research project is an attempt to search for attitudinal
causes of behavior, absenteeism and turnover in a government corpor
ation. I sincerely hope I have obtained results which will provide
anyone embarking in similar study of a government corporation with
ground work for further study.
I would like to express my profound gratitude to my first advisor,
Dr. G.C. Hoyt for giving me confidence and moral support. I also
express my gratitude to my second advisor, A.C. Silcox, for the hours
spent guiding, correcting, clarifying and supporting me in my effort.
{vi)
1.
CHAPTER 1
INTRODUCTION
General Problems of Absenteeism and Turnover
" Absenteeism and turnover are symptomatic of organizational
shortcomings. Absenteeism is a form of withdrawal which is not easily
detected, and, in most cases, is not taken sufficiently seriously by
management. "Absenteeism is a temporacy measure to avoid an unreward
ing situation without the loss of employment" (Porter & Steers, 1973) ~
Most companies today carry some type of sick leave plan which entitles
the employee to be absent from work for a certain period of time
without loss of pay or promotion. Furthermore, the decision to be
absent is easier and less consequential than the decision to leave
permanently. It can be considered a predictor or a substitute for
turnover in particular situations. However, when dissatisfaction
persists and the employee is no longer able to cope with it, he or she
will then make the more drastic decision to leave for a more rewarding
job elsewhere. Therefore, absenteeism is a cost that can be added to
the total turnover cost of an unsatisfactory work situation.
Turnover may be considered, in some respects, to be a healthy
phenomenon. A person leaving an unrewarding or undesirable job may
find a more satisfactory one. A company losing one ineffective

2.
performer may be able to offer a position to a better performer.
But overall, turnover is an expensive withdrawal phenomenon.
Expenses are incurred by the personnel department in advertising to
attract, engage, and retain new staff and in the training of the new
employee. Costs may also appear in the form of salaries paid to two
employees doing the same job during the period of transition.
Besides the direct cost which can be translated into dollars
and cents, a less tangible expense is that related to the behavioral
patterns of the employees affected by the turnover within the department
experiencing the phenomenon. The cost is observable in the decrease
and interruption of the work flow and the decline in the quantity and
quality of production.
Studies which are currently being conducted (Silcox, 1976) show
that one cost of turnover is reaction to the entry of a new employee
into a department. Affected employees show an "uncommitted" attitude
toward the new employee for a certain period of time. This "neutral"
attitude is a natural and widespread reaction. The new employee is
"abstractly" tested to assess if he or she should or should not be
accepted into the group. This period of evaluation produces a decrease
in the quantity and quality of work until the group arrives at the
decision to include the new employee within the group.
High absenteeism and turnover are therefore detrimental to the
company and the employees. An attempt should be made to eliminate, as
much as possible, the withdrawal symptoms, by creating an attitude of
well-being with respect to the job and the work environment.

3.
Description of the Specific Problem under Study
This research has been undertaken to determine the factors which
affect the rate of absenteeism and turnover in a particular government
corporation. The corporation being examined in this research is
divided into two sections: section A, with all the administrative
personnel, and section B, with all the computer personnel. In section
A there are at present 94 employees of whom 6 are part of management.
In section B there are 70 employees of whom 5 are part of management.
This situation is almost ideal for this type of research because the
environment is highly bureaucratic, the work, management and supervis
ory style have not changed for several years, and advancement is
essentially a function of seniority. Further both sections can be
tested simultaneously and the data compared. I
The job content in these two sections of the corporation is very
similar. Each employee has certain tasks that have to be completed
within a certain time. These tasks usually cover a period of work of
one to four weeks. At the end of thid period the tasks are repeated.
These tasks are defined and guided not by any written methods or
procedures, but by certain unwritten traditional ways, which are passed
from employee to employee. From observation it does not appear that the
jobs have been changed or modified in any way for a long period of time.
The employees have developed a pattern of work, unplanned and undetected
even by the employees themselves, which regulates the work flow, breaks
the monotony of the day, minimizes the responsibilities for the work
done and helps to avoid any excessive use of energy or effort.
4.
In observation of and conversation with the employees, the observer
detected that most of the employees seem to have a low level of job
satisfaction and low morale. It is also apparent that the employees
do not seem to have any esteem or consideration for their supervisors,
nor do they appear attached to the job or to the company in any way.
Although the tasks performed in both sections are relatively
repetitive and monotonous, the observer noticed particular differences
in the attitude and behavior between the two sections. The employees
in section A appear to be less satisfied with the work and their
environment than the employees in section B. The latter seem to be
relatively happy with their work, to have a common goal to achieve
certain determined results, and to be better adapted to the work
environment. Further evidence from casual observation will be presented
later.
In the next Chapter a literature survey and two hypotheses will be
presented which will guide the further course of this research.

5.
CHAPTER II
HYPOTHESES
Attitude has been defined as a "predisposition or a tendency of
a person to evaluate some symbol, person, place or thing in a favourable
or unfavourable manner. In essence an attitude is a state of mind
which the individual carries around in his head, through which he
focuses on particular objects in his environment" (J. Kelly, 1974).
Attitudes toward work are influenced by certain needs, called motivators,
which may or may not be satisfied. In other words, these motivating
agents determine whether the individual will respond positively or
negatively towards the job. If the individual perceives some "reward"
in his work, his attitude will be one of satisfaction and he will pursue
the behavior which led to the gratification of his needs. If the
individual does not perceive any "reward," his behavior will lead to
a negative attitude towards the work, he will not pursue gratification,
will possibly engage in absenteeism, and, in a stressed situation,
contribute to turnover.
From the above argument and observation of the employees two
hypotheses are drawn in this research. The first hypothesis is:
"There is a significant attitude difference between the two sections of the corporation"
and the second hypothesis is:

"If attitude is different, then the absenteeism rate and the turnover rate should also be different in the two sections."
6.
Among all the elements of dissatisfaction causing or contributing
to absenteeism and turnover, discussed in all the literature, five
variables have been selected. These variables appear to provide a
logical explanation for the withdrawal symptoms in the particular
corporation under study. This does not mean that other elements may
not, directly or indirectly, affect the behavior, but it means that in
the particular situation in this. corporation, these five variables
appear to be most applicable. These elements are: job satisfaction
and job motivation, supervisory style, peer group interaction, task
repetitiveness, and company policy and salary.
Discussion and Literature Survey of the Specific Elements
Five variable elements will be considered in the attempt to
search for the forces influencing absenteeism and turnover in the
government corporation. These variables have .been studied and tested
by several researchers and many inconsistencies have been found in the
results obtained. Some discrepancies were found for each of the five
variable elements presented here. It is difficult to explain these
discrepancies, except to speculate that they are relate'd somehow to the
methodology used and/or to differences in the employees tested. Another
possibility is that the two types of withdrawal may not have the same
roots, as suggested. Let us now turn to the literature survey for the
five variables and to the predicted results for this research.

7.
Job Satisfaction and Job Motivation
The degree to which personal needs are satisfied by a person's
employment is directly related to the likelihood of his or her staying
in the company. These personal needs include recognition, achievement,
being entrusted with responsibilities, advancement, expression of one's
abilities and finding the work itself interesting. When these needs
are satisfied by the job, the person is motivated to achieve an
established performance level, and to continue using the job to satisfy
his or her needs.
responsibility recognition achievement advancement work itself
e,'b o.-v.c;
~~0 satisfaction of personal
increased productivity
the use of the job, next time, to satisfy needs
Figure 2. l- Motivation Circle.
Job satisfaction, thus motivation to achieve established performance level

8.
This motivation will lead to increased productivity which itself
increases the worker's satisfaction. "Thus gratification will accrue
from accomplishment, from the expression of one's abilities, and from
the exercising of one's decisions" (Herzberg, 1957). The individual's
expectation is that his or her behavior will lead to reward or incentive.
This is illustrated in figure 2.1.
When personal needs are not satisfied by the job, the person will
not be motivated to achieve the established performance level, thus in
the long run, reducing the motivation to produce more. Reduced
productivity will reduce the worker's satisfaction, thus reducing the
expectation of reward and incentive. The employee will be dissatisfied
with the job, and he or she will not use the job next time to satisfy
needs (Figure 2.2). When this situation persists, the lack of fulfillment
and dissatisfaction become a continual source of frustrations, and have
a significant impact on absenteeism behavior. When outside conditions
are such as to present opportunities advantageous to the employee,
absenteeism will change into turnover.
Most of the literature has been concerned with the concept that
job satisfaction and job motivation are central factors in withdrawal
behavior and that they represent an important force in the employee's
~ decision to participate within the companr\( Job satisfaction is defined
as an overall positive attitude towards the job and its environment.
Job motivation is defined as the tendency to perform or to expend the

,..
no responsibility no recognition no achievement no advancement no work satisfaction
Personal needs not satisfied
9.
decreased productivity I Job dissatisfaction,
I no use . of the next tllne, to
needs
Figure 2.2 - Non-Motivation Circle
job, satisfy
thus negative motivation to established performance level
effort required to maintain a higher quantity and quality of output.
Wofford (1971) based a study upon a theoretical formulation of the work
of Rotter (1955), Davidson, Suppes and Siegel (1957) and Vroom (1964).
This formulation holds that job satisfaction is a function of the
strength of certain needs of a person and the extent to which these
needs are fulfilled. These needs were defined as the desire to
maintain a sense of personal worth and importance and are considered
to be ego motives.
The principal hypothesis of Herzberg's two-factor theory of
satisfaction and motivation, states that "the job content such as
responsibility, advancement, recognition, achievement, met expectations,
growth opportunities and the work itself account for the variance in
job satisfa~tion and job motivation. The context elements such as

10.
company policy and administration, supervisory relationship, peer
relationship, salary and working conditions are determinants of job '·'>-'
dissatisfaction" (Herzberg, 1957) ·( ~ §tudies by Brayfield and Crockett
(1955) and Herzberg (1957) found a strong relationship between employee
dissatisfaction and withdrawal behavior. In reviewing some of these
studies Vroom (1964) found job satisfaction to be strongly related to
turnover, but not as strongly related to absenteeism. Kraut (1970) and
Atchinson and Lefferts (1972) found that an expressed intention to
leave represented an even more accurate predictor of turnover than job
satisfaction. Only two studies, however, have considered job satisfaction
related to absenteeism. Talacchi (1969) found a significant inverse
relationship between job satisfaction and absenteeism, but not between
job satisfaction and turnover. Waters and Roach (1971) found an inverse
relationship between job satisfaction and both absenteeism and turnover.
Porter & Steers (1973) have reviewed many of the studies done in the
past concerning absenteeism and turnover. In reviewing the various
conclusions they postulated that "met expectations" have an impact on
withdrawal behavior. They predicted that when a person's expectations
are not consistently met, his propensity for withdrawal will increase.
Mumford (1972) conducted a study of the effects of ego needs on
absenteeism and turnover. The ego needs tested were classified into
two levels. The first level involved the needs of self-esteem,
self-confidence, achievement and independence. The second level was -concerned with the needs of approval, prestige, and recognition of
one's work. He found that the latter needs constitute job aspiration

ll.
and job expectations and are important factors in the individual's
decision to stay or to leave the company. In addition he found that
financial rewards were insufficient compensation for the unmet ego
needs.
Much research has been conducted on the organizational climate as
a determining factor of the phenomenon of withdrawal. The organizational
climate referred to in this study relates to a set of measurable
properties of work environment perceived directly or indirectly by the
people who live and work in that environment which are assumed to
influence their motivation and behavioral patterns. The variables of
the organizational climate pertinent to this research are: Supervisory
style, peer group interaction, task repetitiveness and company policy
and salary.
Supervisory Style
Supervision is the function of leading, coordinating, and directing
the work of others to accomplish designated objectives. The style of
supervision influences the employee's behavior and may be a contributing
factor in withdrawal. If the supervisory style is supportive (allows
for recognition and contributes to met expectations,1
allows for
. . 2 f . . f ~nnovat~on, or recogn~tion o one's ab 'l' . 3 f ~ ~t~es, or
1 What an employee or person perceives he will encounter on the job (met expectation) •
2 The introduction of something new (ideas or methods) to improve or change an old system, for better future results.
3 The acknowledgement of merits or talents, shown to the employee, during the course of employment.

12.
'd . 4 consJ. eratJ.on, d f . . h 5 an or open comrnunJ.catJ.on c annels between the
employee and the supervisors) then the employee will be motivated to
participate in accomplishing the goals of the department. Receiving
6 recognition and feedback sufficient to meet expectations, by the
acknowledgement of one's ·talent and ability, and by participation in
decision-making, represents a significant factor in the employee's
decision to remain in the company.
Thus supervisory style is an important factor determining
satisfaction. A supervisor who is employee-centered tends to have a
department that is highly motivated. "Supervisors who can capitalize
upon internal motivation and who build up a relationship of responsib-
ility and respect, are more successful in obtaining productivity,
quality_ and good morale" (Beach, 1970) • The employee who does not
receive recognition, consideration, and proper feedback or who perceives
inequitable treatment, will feel frustrated and will not be motivated
to participate in the goals of the department and the company. This
frustration will affect the absenteeism rate.
4 By the supervisor, knowing that he or she is able to act or behave fairly, and is able to discern good from bad performance.
5 The medium used in the art of exchanging information
6 "The response to a communication, in which B not only gives a reaction to A's message, but also may control and correct further signals, thus making A and B truly interacting members of a communication system." J. Kelly, Organizational Behavior (R. Irwin, 1974) •

13.
The importance of supervisory style on employee behavior was first
disclosed by the research conducted by Katz, Maccoby, Guring & Morse
(1950) and Stogdill & Coones (1957). Fleishman & Harris (1962) and
Hulin (1968) studied the impact of supervisory consideration and found
it related to turnover. Turnover was highest for those work groups
whose foremen were rated low in consideration. Ross & Zander (1957)
investigated the effect of recognition and feedback on turnover. Their
findings showed that receiving sufficient recognition and feedback to
meet expectations represented a significant factor in the employee's
decision to participate.
Peer Group Interaction
"One of the recent discoveries in the socialization process within
an organization is the interactive dynamics between the individual and
his peer" (Porter & Steers, 1973). Such interaction provides the
support and reinforcement necessary for adjustment and attachment to
the work environment. Employees gather in the work group to satisfy
their needs for belonging, friendship, and security.
Peer group interaction provides a basis in the work environment
for combating frustration and for obtaining the support and comfort
necessary to fulfill perceived needs for affiliation. In addition
positive peer group interaction will meet the employee's basic needs
for self-esteem, achievement, respect, prestige, and confidence in the
fact of the demands of the work environment. Satisfaction of these
needs leads to a feeling of self-confidence, worth, strength, and
capabi~ity, and results in good morale, a sense of belonging and
14.
reduced tension. When these needs are not fulfilled, the employee
cannot cope with the job. Morale becomes low, thus lowering the
performance level, and the employee becomes apathetic. When this
state persists, the propensity to leave increases. This propensity
may be in the form of absenteeism or turnover. If the employee feels
that there are no opportunities in the outside world for job advancement,
he or she will choose the option of absenteeism to counteract the lack
of support frcm the group. If the outside world does have opportunities
available, then the employee will choose to leave the company.
Evans (1963) and Hulin (1968) found in their research that co-
worker support is related to the retention and stabilization of
employees. Failure to secure such support contributes to stress and
the propensity to leave. Taylor & Weiss (1969a, 1969b) and Waters &
Roach (1971) found that peer interaction was significantly and inversely
related to absenteeism but unrelated to turnover.
Task Repetitiveness
\Modern technology has contributed to severe strain on personnel
by making jobs repetitive. Although the new routine has decreased the
cost of operations, it has unintentionally increased costs in other
areas; for example,by directly influencing absenteeism and turnover.
The repetitiveness of the tasks decreases expectations, lowers morale
and creates a negative feeling toward the job. It also creates a
feeling of frustration and lack of accomplishment. When the employee
arrives at this state of discontent, he or she will no longer be
inclined to participate in the mutual goal of the department and the

15.
company. The employee will use any possible excuse to remain absent
from work. He or she will find a way to satisfy only basic needs 7 in
the job, and look for opportunities for growth outside the company.
When the conditions render the situation unbearable, the employee will
look for suitable employment elsewhere.
Studies related to this element performed by Kilbridge (1961) found
task repetitiveness to be related to absenteeism but unrelated to
turnover. Further studies were performed by Walker & Guest (1952) and
again by Guest (1955). Research by Wild (1970) and others supported
Guest's findings. Guest found that a definite trend emerged in which
the stress resulting from the fractionated and routinized job appeared
to be the primary factor producing termination.
Company Policy and Salary
Company policy and salary, as related to this study, refers to
level of participation, types of communication channels, feedback,
performance appraisal, incentive and recognition by way of promotion
opportunities, working conditions and salary. Recognition of merit and
accomplishment through promotion or increases in pay is part of management
action affecting the behavioral patterns of the employees at work. If
such action is taken to reward behavior, the probability that the
behavior will be repeated increases and the employee will be likely to
continue to perform above standard, to be satisfied, and to be willing
to remain in the system. The reward system can be in the form of pay
7 Basic needs refer to physiological and safety needs (Maslow, 1954).
I II

16.
increases, fringe benefits, recognition of one's work, fairness of
treatment, advancement, promotion or better working conditions. Such
rewards are instrumental in providing incentives for entering and
remaining in the system, and thus for the satisfaction of employee
needs.
If no action is forthcoming to reward the behavior, and the person
undertaking such behavior is ignored, then the behavior is not likely
to be repeated. If no reward system is used by the company, the
employee becomes dissatisfied and unattached to the work place. This
state of dissatisfaction will show up first in the rate of absenteeism
and turnover.
Knowles (1964) and Ross and Zander (1957) conducted studies on
company policies, salary, promotion, job autonomy and responsibilities.
They found a strong relationship between satisfaction with one's
perceived level of responsibilities and autonomy and the propensity
to remain. They also found that one reason given by the factory workers
under study for leaving the company was the failure to obtain the
"expected wages."
ConclusionsDrawn from the Literature Survey
The results of the research carried out support the following
conclusions related to the five variables under observation in this
paper. //
/iob satisfaction and job motivation are important c_c:>Illl'~Il.ents
affecting turnover. Job satisfaction is defined as the extent to which -------a person's job-related needs are met. The researchers found a strong

17.
negative correlation between met expectations and withdrawal behavior.
Only two studies disclosed a strong relationship between job satisfaction
and absenteeis~;/' Other studies showed instead a consistent negative
relationship between job satisfaction and turnover, and i'somewhat less
consistent relationship between job satisfaction and absenteeism. Some
studies found a significant relationship between job satisfaction and
both absenteeism and turnover.
In general, the researchers showed that supervisory style is a
major contributor to turnover. No studies, however, have been found
relating supervisory style to absenteeism. Another variable affecting
behavioral patterns, peer group interaction, has been demonstrated to
be important in the decision to leave. It was found that satisfaction
with co-workers was significantly and negatively related to absenteeism,
but unrelated to turnover. However, one study (Waters & Roach, 1971)
showed it to be related to turnover but unrelated to absenteeism.
, Studies conducted by Kilbridge (1961) on task repetitiveness
found it to affect the rate of absenteeis~/but not of turnover. ,/
A different conclusion was arrived at by Taylor & Weiss (1969a, 1969b)
who found that task repetitiveness was significantly and negatively
related to turnover./ Studies conducted on company policy showed that
this element is of secondary importance in the decision to stay or
leave. The rate of turnover did not seem to be greatly affected by
this element. The fairness of pay and promotion, rather than their
amount and rapidity, appeared to be correlated with absenteeism. /l

18.
In conclusion, evidence was found in support of the theory that
overall job satisfaction represents an important force in the individual's
participation decision. Such satisfaction appears also to have a
significant impact on absenteeism behavior. Job satisfaction, as viewed
here, is the sum total of an individual's met expectations on the job.
Porter & Steers (1973) stated that "it is not sufficient, for our
understanding of the withdrawal process, to supply the relationship
between job satisfaction and both absenteeism and turnover; it is
important to consider what constitutes job satisfaction." In their
article they strongly suggested that "more investigation is necessary
which simultaneously study both absenteeism and turnover among the
same sample as they are affected by various factors in an organizational
situation."
Casual Observation
As a preliminary mode of investigation of these factors in the
above mentioned setting of two sections of a government corporation, a
casual observation was undertaken for a period of one week. It was
intended to capture any behavioral signals and unusual patterns of the
employees, that might indicate a difference in dissatisfaction between
sections A and B. The observation was conducted on a sample of 10
technical/clerical employees, 6 from section A and 4 from section B.
Sixteen different items were divided into 5 categories relating
to attendance, peer group interaction, work habits, supervisory style
and organizational climate. Each item was rated according to a scale
measuring from (1) excellent, to (5) very poor. Observations were made

19.
randomly three times each day. Daily results were accumulated and
means calculated. Results are·in appendix A, Table 1.2.
From the results of the observation it seemed likely that there
was a difference in attitude between the two sections. Section A
appeared to be less satisfied than section B. These results are
consistent with the first hypothesis drawn in this study which stated
that there would be a difference in attitude between the employees in
section A and the employees in section B. The difference in satisfaction
observed in the casual observation should be reflected in differences in
the rates of absenteeism and turnover.
Predicted Results Based on Casual Observation and Literature Survey
It is said that absenteeism and turnover are directly influenced
by several factors, which grouped together, constitute the overall job
satisfaction element. From the literature survey five elements were
selected for this study for their possible effects on the absenteeism
and turnover rate in the corporation. From the information gathered
in the casual observation, section A is less satisfied than section B.
Hence the results will show that the level of job satisfaction is lower
in section A than in section B. In addition it will show that the
supervisory style in the organization is directly related to absenteeism
and, indirectly, to turnover. The results will indicate that the
supervisory style elements receives less favourable ratings in section
A than in section B. Further the results will demonstrate that the
peer group interaction element is the third most important element with
respect to absenteeism and again that this element will be viewed more

20.
negatively in section A than in section B, where some supportive
interaction between the employees is present.
A markedly different score on the element of task repetitiveness
between section A and section B will also be demonstrated. The
absenteeism rate will be worse in section A, thus indicating that the
employees indeed are bored on the job, and are using absenteeism as an
escape route to break the monotony and to be able to cope with the daily
tasks. Concerning the element of company policy and salary, it appears
that in the corporation, advancement is strictly a function of seniority.
Furthermore there does not appear to be any appraisal system in existence.
Minimum pay increases seem to be granted regardless of the level of
performance. Some employees have expressed concern about their salary,
not because it is an important subject, but because the lack of reward
is depriving the employees of the incentive and desire to work better
and harder than others. Salaries in the corporation are relatively
competitive with the outside market. The results will show that
employees in section A are less satisfied with company policy and
salary than those in section B (including the present system of yearly
increases without appraisal). Section B employees probably see
themselves as more mobile people and thus not terribly concerned with
lack of incentive and/or appraisal systems. From working with the
employees it appears that they have resorted to absenteeism to combat
the unsatisfactory situation without losing their jobs.
In the next chapter the research method, its application and the
system used in measuring the results will be presented. Chapter IV will
describe the results obtained from the research and propose an explanation

21.
of these results. Chapter V will draw conclusions from the results
and will contain a discussion related to the findings on this study
and the findings in the literature survey.

22.
CHAPTER III
METHOD OF RESEARCH
The purpose of the methodology used in this research is to confirm
the casual observation of the first hypothesis and to substantiate the
second hypothesis, that is, if there are different attitudes in the
two sections, it is possible to determine that the absenteeism and turn-
over rates will also be different in the two sections. The second
purpose is to determine and substantiate whether the five variable
elements discussed in the theory chapter are significant elements
affecting absenteeism and turnover in the government corporation. The
method is intended to measure the level of morale, the level of satisfied
needs, and the level of job satisfaction, the level of met expectations,
and the level of interaction of the employees in the two sections under
observation. One tool is used for this method.
Questionnaire Tool*
The tool used was a comprehensive questionnaire with 21 questions
related to job satisfaction, supervisory style, peer group interaction,
task repetitiveness and company policy. The questionnaire was intended
to search for in\Dormation regarding the elements related to the five
variables, to enlarge the field of the study, and to determine possible
* See appendix B

23.
motives for satisfaction and dissatisfaction. The questionnaire was
sent,to all employees in both sections of the company, including ones
who had already left. Each of the first 21 questions could be scored
in a range fran "very satisfied" (1) to "very dissatisfied" (5).
Three more common-type questions were added at the end of the questionnaire
to inquire further into the 21 questions and to give the employees the
opportunity to express ideas and/or suggestions. These last three
common-type questions were intended to explore any possible miscon
ceptions in some of the questions presented and to obtain additional
information which might be overlooked in the questionnaire. Each variable
element was tested with a different set of questions.
Six questions were designed to measure the level of job satisfaction.
These were 1, 2, 3, 10, 16 and 21, appendix B. The questions were
related to achivement, recognition and responsibilities. It is predicted
that section A will show a more negative attitude toward the' work by
scoring "very dissatisfied" while section B will have a less negative
attitude, scoring between "dissatisfied" and "very dissatisfied."
Six questions have been designed to test the supervisory style
element. Questions 4, 5, 6, 7, 8 and 9, appendix B, were related
to expectations, recognition and feedback. Each question has a point
scale range from "very satisfied" to "very dissatisfied." It is
proposed that section A again will demonstrate that it does not perceive
that its expectations are met, nor does it obtain recognition and
necessary feedback and thus scores at the "dissatisfied"
24.
level. Section B instead will show that it is neither "satisfied" nor
"dissatisfied," scoring better than A.
The peer group interaction factor, tested with questions 14 and
15, appendix B, related to the supportive nature of the group and the
degree of fulfillment of basic needs of affiliation and belonging. It
is predicted that section A will reveal some dissatisfaction with the
peer group interaction indicating that these employees do not receive
the supportive atmosphere perceived necessary to fulfill basic needs.
Section B will score at the "indifferent" or "neutral" point, indicat
ing greater satisfaction with the present peer group interaction level.
The task repetitiveness element was tested with three questions,
numbers 17, 18 and 19, appendix B which related to the increasing
repetitiveness of the job and the inability to make good use of one's
abilities. It is expected that section A scores will be between
"satisfied" and "indifferent." Section B will show that the tasks
are relatively liked, will not perceive any repetitiveness in them
and will score near the "satisfied" level. ·
The last element, company policy and salary, tested with
questions 1, 10, 11, 12, 13 and 20 related to general company policy
in treatment of employees, the perceived fairness of this treatment,
the availability of communication channels, and salary. Section A
will show that it is not satisifed with the communication channel,
the fairness of treatment or the general policy, thus being between
"indifferent" and "dissatisfied." Section B's responses will
reveal that this element is not terribly important to the satisfaction

25.
level, scoring between "satisfied" and "neutral."
The questionnaire (appendix B) was sent to all 129 technical/
clerical employees and all 57 supervisors, at their home addresses,
with a pre-paid return envelope. A letter accompanying each questionnaire
explained the subject of the thesis, the reason for choosing this
subject, the purpose of the questionnaire and the use to be made of
it. It also expressed appreciation for their assistance and cooperation
in completing the questionnaire and returning it to the observer
(appendix C).
Comments
In this study the researcher has intentionally not discussed
age or length of service, as it was felt, in view of the results
obtained from the previous researchers, that these elements were
not directly related to job satisfaction and withdrawal behavior in
this particular corporation. In addition the employees in the company
represent an extremely broad range, with length of service varying
from 1 to 25 years, and a range in age from 18 to 62 years. These
two elements, age and length of service, could be part of a future
extended study in the same corporation, and could be measured against
the results obtained here to acquire more documentation on the hypothesis
of job satisfaction related to absenteeism and turnover.
In summary, the study was conducted with a questionnaire tool
to attempt to confirm the first hypothesis, differences in attitude
between the two sections, and to search for causes of absenteeism and
possible turnover in the corporation. The next chapter will present the
results obtained in this study.

26.
CHAPTER IV
RESULTS OBTAINED FROM THE QUESTIONNAIRE
General Description
This research, designed to determine the causes of attitude
differences between two sections of a company and the causes of
absenteeism and, possibly, turnover, used a questionnaire to measure
and determine these effects. One hundred and eighty-six questionnaires
were sent to the employees in both sections, including ones who had
already left the company. On the 186 questionnaires sent, 62 were
returned. Five of the 62 were returned uncompleted accompanied by
remarks such as "I do not want to get involved." Table D.l, appendix
D, shows the results of the number of questionnaires sent and received,
grouped by section and by type of employees.
Results Pertinent to the Questionnaire
For each question a 5 point scale from "very satisfied" (1) to
"very dissatisfied" (5) was used, with a middle point of "indifferent"
or "neutral" (3). The average,variance and number of responses on each
question of the questionnaire are shown in tables E.l to E.5, appendix E.
The following employee combinations were used:
1. All employees, section A vs. B.
2. Technical/clerical, section A vs. B.
3. Supervisors, A vs. B.

27.
4. Technical/clerical vs. supervisors, section A
5. Technical/clerical vs. supervisors, section B
Figure 4.1 indicates these combination.
Clerks Superv •
Section .. .. A 4.
indicates 4 ..
1. 2. 3. experimental
- - - - - - - - - relationship I
Section B 5.
4 •
Clerks Superv.
Figure 4.1 - Employee Combinations -- t-test
Legend: Clerk = Technical/clerical Superv. = Supervisors
The test gave the value for the mean, the standard deviation, the t-
value, the 2-Tail probability and the degree of freedom.
A t-test was used to obtain statistical inference necessary to
ascertain the validity of the hypothesis stated in this research. The
hypothesis stated was that section A would be more dissatisfied than
se9tion B, thus scoring a higher value on the scale than section B.
Confirmation of this prediction would support the model. To examine
this assumption a null hypothesis or hypothesis of equality was formulated.
In other words, H represented )J :j. _u (where )4 signifies the mean) or 1 1 2
the fact that section A scored differently than section B. H represented 0
M1 = ,u2
or the fact that the scoring in section A was equal to section B.

28.
If the data does not support H0
, then H1 will be accepted and this would
support the research conclusion and the underlying theory.
When the null hypothesis and the alternative hypothesis were defined,
a level of significance (a) was selected to be the value of ~ -.05.
this means is that H1
is to be accepted if the value yielded by the
statistical test is equal to or less than .05~.
What
Table E.l, appendix E, shows the results obtained in the statistical
test, for all employees in section A compared to all employees in section
B. Only six of the 21 questions gave significant differences in means.
These were questions 1, 5, 7, 8, 11 and 12. Table IV.l is an extract of
these significant differences in means from table E.l. All other results
shown in the table supported the null hypothesis that the mean scoring
was equal for both sections, thus were above • 05~.
Table E.2 appendix E, represents the statistical test results
computed on each question to compare for differences between all the
technical/clerical employees in section A and those in section B. The
results from seven questions (1, 5, 7, 8, 11, 12 and 18) supported the
alternative hypothesis that the mean of the responses was not equal for
the two sections.

Table IV, 1 - Extract from table E .1 appendix E - Questionnaire response to each question - Section A versus Section B - Overall
1 - Opportunity
5 - Encouragement
7 - Explanations received
8 - Performance discussion
11 - Information received
12 - Promotion system
Sections
All A All B
All A
All A All B
All A All B
All A All B
All A AllB
X
3.765 2.913
3.618
3.323 2.609
3.676 1. 783
3.853 3.174
4.176 3.522
0.819 0.208
1.231
1.121 0.988
1. 788 1.594
1.048 1.230
0.834 0.187
Legend: X = mean a = standard deviation
Df = degree of freedom
Tvalue
3.53
2.72
2.48
4.10
2.24
2.82
2-tail prob
0.001
0.001
0.016
0.001
0.029
0.007
Table IV.2- Extract from table E.2 appendix E - Questionnaire response to each question - Section A versus Section B - All technical/clerical employees
1 - Opportunity
5 - Encouragement
7 - Explanations received
8 - Performance discussion
11 - Information received
12 - Promotion system
18 - Like or dislike job
Sections
T/C A T/C B
T/C A T/C B
T/C A T/C B
T/C A T/C B
T/C A T/C B
T/C A T/C B
T/C A T/C B
X
3.845 2.875
3.731 2.812
3.346 2.562
3.538 - 1. 937
4.000 3.125
4.192 3.375
2.923 2.000
t1
0.834 0.957
1.282 1.328
1.231 0.892
1.964 1.769 0.980 1.147
0.895 1.025
1.055 0.894
T- 2-tail value prob
3.46 0.001
2.22 0.032
2.21 0.033
2.66 0.011
2.63 0.012
2.72 0.010
2.91 0.006
29.
Of
55
55
55
55
55
55
Df
40
40
40
40
40
40
40

30.
These significant data are seen in questions 1, 5, 7, 8, 11, 12 and 18.
These are identical to the first set except that question 18 is
added. Table IV.2 shows the relevant differences only.
Table E.3 appendix E represents the statistical test used for the
third combination, that is, for all supervisors in section A vs. all
supervisors in section B. These results show only four significantly
different results (questions 8, 19, 20 and 21). One notable aspect of
these results is that the supervisors in section B scored worse than
those in section A on all questions except number 8 (discussion of
performance with supervisors). These results are contrary to the
prediction that section B would score better than section A. Table IV. 3
presents the relevant differences.
Table IV.3 Extract from table E.3 appendix E- Questionnaire response to each question - Section A versus Section B -Supervisors
T- 2-tail Relevant data Sections X q value Prob. Df.
8- Performance Superv. A 4.125 0.991 4.92 c.ooo 13 discussion Superv. B 1.428 1.134
19- Thoughts about Superv. A 1.875 0.835 -2.60 0.022 13 leaving Superv. B 3.286 1.264
20- Absences Superv. A 1.125 0.354 -2.32 0.037 13 Superv. B 2.000 1.000
21- Satisfaction Superv. A 2.375 0.518 -2.16 0.050 13 with job Superv. B 3.428 1.272
Legend: X= mean cr= standard deviation Df = degree of freedom
All other results support the hypothesis H . 0

31.
Table E.4, appendix E, represents results obtained from section A
to compare all technical/clerical employees to all supervisors. The
results show that only two data are significantly different. This
difference is seen in the results obtained from questions 3 and 18.
Table IV. 4 presents these differences.
TableiV.4 -Extract from table E.4 appendix E- Questionnaire response to each question - section A only -supervisors versus technical/clerical
T- 2-tail Sections X value prob. Df
3- Opportunities Clk. A 3.923 0.977 2.45 0.020 32 to make Supv. A 3.000 0.756
18- Like or Clk. A 2.923 1.055 2.29 0.029 32 dislike job Supv. A 2.000 0.760
Legend: X = mean d = standard deviation Df = degree of freedom
Again all other results seem to substantiate the hypothesis H • 0
The last table, E.S appendix E, gives a comparison of the results
obtained for all technical/clerical employees compared with all
supervisors in section B. The significant differences are found in
the answers to question 20 and 21. Table IV. 5 shows the significant
results.

32.
Table IV.S- Extract from table E.5 appendix E - Questionnaire response to each question - Section B only -Supervisors versus technical/clerical
T- 2-tail Sections X a value Erob.
20- Absences Clk. B 1.375 0.500 -2.02 0.056 Sup. B 2.000 1.000
21- Satisfaction Clk. B 2.312 1.078 -2.17 0.042 on the job Sup. B 3.429 1.272
Df.
21
21
Legend: X = mean 0= standard deviation Df = degree of freedom
In both of the latter two cases the supervisors seem less satisfied
with the job than the technical/clerical employees.
The elements being employed to test the second hypothesis were
stated in chapter III along with the predicted scoring for each element
for section A and section B. A summary of the predictions for each of
these elements is presented here:
No. 1 - Job satisfaction and job motivation (questions 1, 2, 3, 10, 16
and 21).
Scoring: Section A more dissatisfied than section B.
Effects: Low job satisfaction and job motivation cause a
high rate of absenteeism and turnover.
No. 2- Supervisory style (questions 4, 5, 6, 7, 8, and 9).
Scoring: Section A more dissatisfaction than section B.
Effects: Poor supervisory style causes high absenteeism;
absenteeism could convert to turnover if the poor
situation continues.
---------.........

r ! 33. f
No. 3- Peer group interaction (questions 14 and 15).
Scoring: Section A greater dissatisfaction than section B.
Effects: Absenteeism is a remedy for lack of moral support
in th4 work environment.
No. 4- Task repetitiveness (questions 17, 18 and 19).
Scoring: Section A less satisfied than section B, both
sections nearly indifferent.
Effects: Poor or monotonous job tasks cause high absenteeism.
No. 5- Company policy and salary (questions 1, 10, 11, 12, 13 and 20).
Scoring: Section A more dissatisfied than section B.
Effects: Poor working conditions and poor company policy in
general cause high absenteeism and turnover.
A t-test was then computed for the mean of each combination of
questions that comprised the stated elements. The employees were
combined in the following manner:
1. All employees, section A vs section B
2. Supervisors, A vs B
3. Technical/clerical, A vs B

Section A
Section B
Clerks
clerks
Superv.
Superv.
Figure 4.2 - Employee Combination - t-test on five variablea.
Legend: ...... ~--~·~ = indicates experimental relationships
Clerks = Technical/Cerlical
Superv.= Supervisors
34.
Table IV.6 presents the results obtained for the first element,
concerning job satisfaction and job motivation. The results presented
in each table are total results, not an extraction.
In the t-tests computed, the means were summarized. The standard
deviation given corresponds to the mean of means not to the accumulated
means. The hypothesis used was the same as that used for the individual
questions with • OS cC confidence level. For all t'b.ree combinations of
employees, the results confirmed the H hypothesis that there is no 0
statistically significant difference in the level of job satisfaction
between the two sections.
The second element tested, supervisory style, was measured with
questions 4, 5, 6, 7, 8 and 9. The next three tables show the results
obtained for each of the combinations of employees used with respect to
this element.

35.
Table IV.6- Results from t-test - Job satisfaction and motivation (Ques. 1, 2, 3, 10, 16, 21)
1. All employees section A vs. all section B.
Standard T- 2-tail Mean deviation value prob. Df.
Group A 17.470 3.887 1.47 0.148 55
Group B 15.913 3.999
A 2.91 Mean of means B 2.65
2. Supervisors: section A vs. section B.
Standard T- 2-tail Mean deviation value pro b. Df.
Group A 16.000 2.449 -0.29 0. 777 13
Group B 16.571 4.962
Mean of A 2.67 means B 2.76
3. Technical/clerical staff section A compared with section
Standard T- 2-tail Mean deviation value prob. Df.
Group A 17.923 4.166 1.82 0.077 40
Group B 15.625 3.649
Mean of A 2.99 means B 2.60
Legend:
A, B are sections Df = degree of freedom
B
Mean of Means: 4X; Mean is "mean of sum of responses on questions N listed."
-

Table IV. 7- Results from t-test - Supervisory style Ques. 4, 5, 6, 7, 8, and 9
1. All employees in section A vs. all section
Standard T-Mean deviation value
Group A 18.088 5.053 2.50
Group B 14.740 4.845
Mean of means A 3 .. 015 B 2.457
2. Supervisors: section A vs. section B.
Standard T-Mean deviation value
Group A 17.500 3.117 0.95
Group B 15.429 5.192
Mean of A 2.917 means B 2.571
36.
B.
2-tail prob.
0.016*
2-tail prob.
0.358
3. Technical/clerical staff section A compared with section
Mean
Group A 18.269
Group B 14.437
Mean of A 3.044 means B 2.406
Legend:
A, B are sections
Mean of means = ~ N
Df = Degree of freedom
Standard T- 2-tail deviation value pro b.
5.554 2.28 0.028*
4.830
Df
55
Df
13
B
Df
40
37.
The results obtained for all the staff rejected the hypothesis
that the two sections would have equal scores, as the level of
probability was less than .OS. Looking at the mean of means, section
A appeared indifferent, while section B showed some satisfaction.
The management in section B appears to satisfy more the needs of its
employee. If we look at the results for the three combinations of
employees, these results show that the technical/clerical employees
are the group creating this difference, not the supervisors; in other
words, the difference in perception of supervisory style occurs only
at the technical/clerical level.
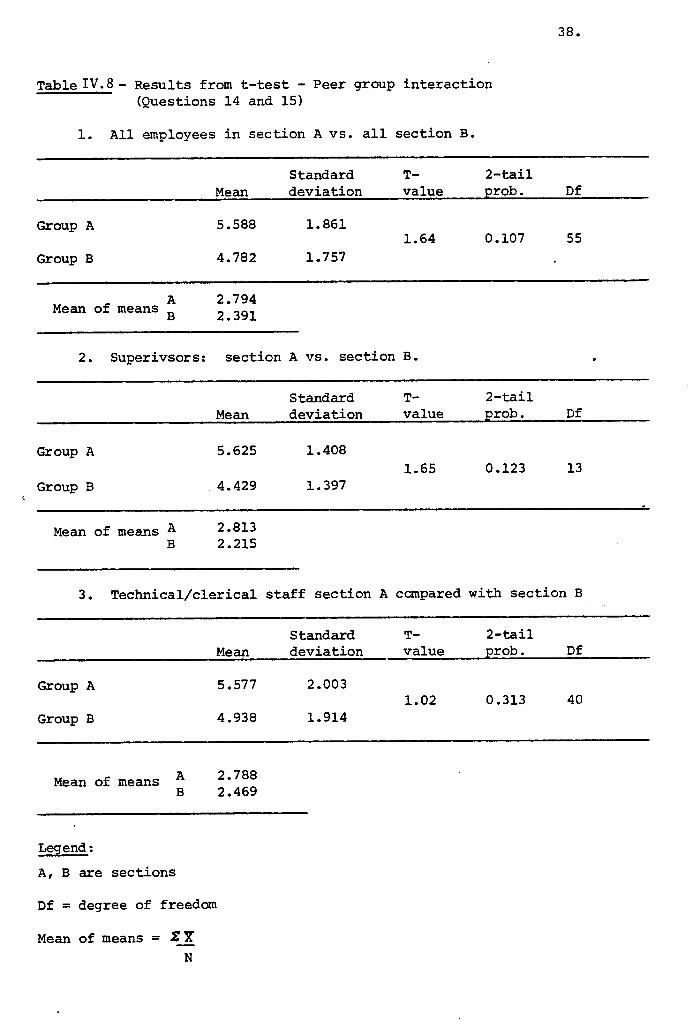
The next table (IV.8) shows the results obtained for the third
element, peer group interaction, for the same combinations of staff.
It is necessary to remember that the mean is being adjusted to show
a single simplified result.
38.
Table IV. 8 - Results from t-test - Peer group interaction (Questions 14 and 15)
1. All employees in section A vs. all section B.
Standard T- 2-tail Mean deviation value prob. Df
Group A 5.588 1.861 1.64 0.107 55
Group B 4.782 1. 757
Mean of means A 2.794 B 2.391
2. Superivsors: section A vs. section B.
Standard T- 2-tail Mean deviation value prob. Df
Group A 5.625 1.408 1.65 0.123 13
Group B 4.429 1.397
Mean of means A 2.813 B 2.215
3. Technical/clerical staff section A compared with section B
Mean
Group A 5.577
Group B 4.938
Mean of means A 2.788 B 2.469
Legend:
A, B are sections
Df = degree of freedom
Mean of means = ~ X N
Standard T- 2-tail deviation value prob. Df
2.003 1.02 0.313 40
1.914

39.
Again the results showed no significant difference in the mean
scoring of both sections, although all three groupings show differences
in the predicted direction (section A is lower in satisfaction than
section B). No difference was noticed between the supervisors and the
technical/clerical staff.
The task repetitiveness element, or the effect of a repetitive
or monotonous job on morale and the level of absenteeism in the
corporation was tested using the same combinations of staff (Table IV.9).
No significant differences are noticed in the scoring for all three
combinations of employees.

40.
Table IV.9- Results from t-test - Task (Questions 17, 18, 19)
repetitiveness
1. All employees in section A vs. all section B.
Standard T- 2-tail Mean deviation value prob. Df
Group A 8.029 3.109 0.92 0.363 55
Group B 7.304 2.636
Mean of A 2.676 means B 2.435
2. Supervisors: section A vs. section B
Standard T- 2-tail Mean deviation value prob. Df
Group A 6.125 1.959 -2.08 0.058 13
Group B 6.286 2.059
Mean of A 2.042 means B 2.095
3. Technical/clerical staff section A compared with section
Mean
Group A 8.615
Group B 6.975
Mean of A 2.872 means B 2.325
Legend:
A, B are sections
Df = degree of freedom
Mean of means = l:: X N
Standard T- 2-tail deviation value prob. Df
3.188 1.80 0.080 40
2.802
B

41.
From the results for all the employees it is possible to ascertain
the validity of hypothesis H1 , that is, there is a strong difference
between the scoring in section A and the scoring in section B. It
is evident that this overall difference is caused completely by the
technical/clerical employees, since the supervisors show no difference.
This difference is the strongest obtained thus far, and as predicted,
section A shows greater dissatisfaction than section B.
The last element tested was concerned with company policy and
salary, again tested with the same combinations of employees (Table IV.lO).

42.
Table IV.lO- Results from t-test - Company policy and salary {Questions 1, 10, 11, 12, 13 and 20)
1. All employees in section A vs. all section B
Standard T- 2-tail Mean deviation value prob. df
Group A 18.529 3.145 2.95 0.005* 55
Group B 16.000 3.233
A 3.088 Mean of means
B 2.667
2. Supervisors: section A vs. section B
Mean Standard T- 2-tail deviation value prob. Df
Group A 17.500 2.507 0.36 0.728 13
Group B 17.000 2.944
Mean of A 2.917 meansB 2.833
3. Technical/clerical staff section A compared with section B
Group A
Group B
A Mean of means
B
Legend:
A, B are sections
Df = degree of freedom
Mean of means = % X N
Mean
18.845
15.562
3.141
2.594
Standard T- 2-tail deviation value prob. Df
3.295 3.12 0.003* 49
3.346
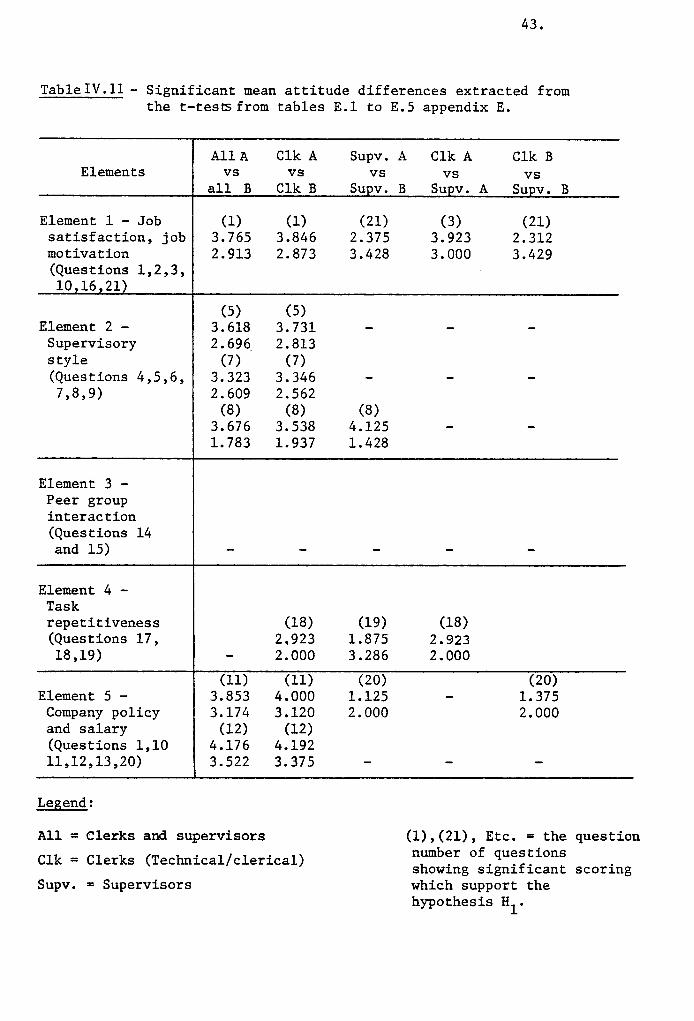
Table IV .11 summarizes the significant attitude differences obtained in the t-test for each of the employee combinations described above.
43.
TableiV.ll- Significant mean attitude differences extracted from the t-tes~from tables E.l to E.5 appendix E.
Elements
Element 1 - Job satisfaction, job motivation (Questions 1,2,3, 10.16,21)
Element 2 -Supervisory style (Questions 4,5,6, 7,8,9)
Element 3 -Peer group interaction (Questions 14 and 15)
Element 4 -Task repetitiveness (Questions 17, 18,19)
Element 5 -Company policy and salary (Questions 1,10 11,12,13,20)
Legend:
All A vs
all B
(1) 3.765 2.913
(5) 3.618 2.696
(7) 3.323 2.609
(8) 3.676 1. 783
(11) 3.853 3.174
(12) 4.176 3.522
All = Clerks and supervisors
Clk A vs
Clk B
(1) 3.846 2.873
(5) 3.731 2.813
(7) 3.346 2.562
(8) 3.538 1.937
(18) 2.923 2.000
(11) 4.000 3.120
(12) 4.192 3.375
Clk = Clerks (Technical/clerical)
Supv. = Supervisors
Supv. A Clk A Clk B vs
Supv. B VS
Supv. B
(21) 2.375 3.428
(8) 4.125 1.428
(19) 1.875 3.286
(20) 1.125 2.000
VS Supv. A
(3) 3. 923 3.000
(18) 2.923 2.000
(21) 2.312 3.429
(20) 1.375 2.000
(1),(21), Etc. =the question number of questions showing significant scoring which support the hypothesis H1 •

44.
In analyzing the significant data in table IV .11 the following
peculiarities are evident:
a - only half of the questions used for most of the elements listed
reveal significant differences between the two sections;
b - none of the peer group interaction factors show any significant
difference in the scoring between the two sectio"ns.
For the job satisfaction element the questions having significant
differences are: opportunities on the job, opportunities to make
major decisions affecting the job, and job satisfaction itself. For
supervisory style the significant questions related to exchange of
ideas and/or suggestions, discussion of performance, and explanation
of duties and responsibilities received at the commencement of a new
job. For task repetitiveness the significant differences are shown
on questions concerning liking or disliking the job and ideas about
leaving the job. Finally, for the company policy and salary element,
the questions presenting significant differences relate to information
received about what is happening in the company, promotional systems
and perceived absenteeism.
In summing up the results it appears that overall, section A
is more dissatisfied than section B. This result is caused by the
technical/clerical employees. The supervisors in section B, however,
are more dissatisfied than the supervisors in section A. The results
for the supervisors is, however, an exception. It is important to
remember that the significant differences are occurring only on certain
questions for each of the elements.
45.
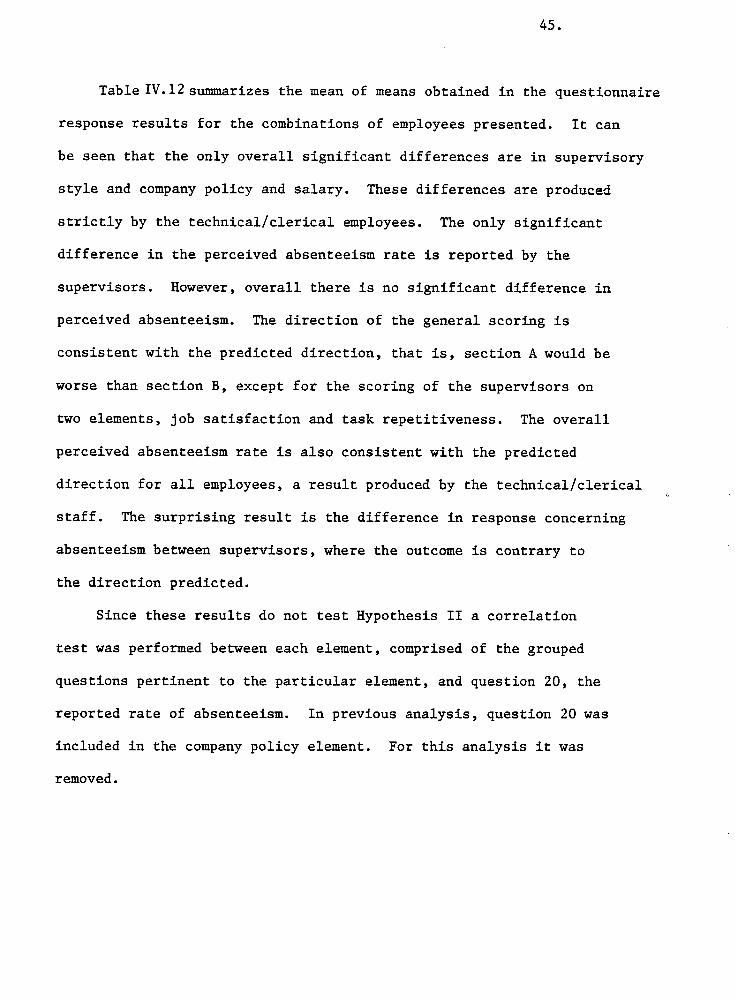
Table IV.12 summarizes the mean of means obtained in the questionnaire
response results for the combinations of employees presented. It can
be seen that the only overall significant differences are in supervisory
style and company policy and salary. These differences are produced
strictly by the technical/clerical employees. The only significant
difference in the perceived absenteeism rate is reported by the
supervisors. However, overall there is no significant difference in
perceived absenteeism. The direction of the general scoring is
consistent with the predicted direction, that is, section A would be
worse than section B, except for the scoring of the supervisors on
two elements, job satisfaction and task repetitiveness. The overall
perceived absenteeism rate is also consistent with the predicted
direction for all employees, a result produced by the technical/clerical
staff. The surprising result is the difference in response concerning
absenteeism between supervisors, where the outcome is contrary to
the direction predicted.
Since these results do not test Hypothesis II a correlation
test was performed between each element, comprised of the grouped
questions pertinent to the particular element, and question 20, the
reported rate of absenteeism. In previous analysis, question 20 was
included in the company policy element. For this analysis it was
removed.

46.
Table IV .12- Mean of means obtained on the t-test for each of the elements stated - Hypothesis 2
Questionnaire tool All empl. Superv. A Tech/Clk A in A in B Superv. B Tech/Clk B
1 - Job satisfaction, A 2.91 2.67 2.99 job motivation B 2.65 2.76 2.60
2 - Supervisory style A 3.01 *
2.92 3.04 * B 2.46 2.57 2.41
3 - Peer group A 2.79 2.81 2.78 interaction B 2.39 2.21 2.49
4 - Task repetitiveness A 2.67 2.04 2.87 B 2.43 2.09 2.32
5 - Company policy A 3.08 *
2.91 3.14 * and salary B 2.66 2.83 2.59
Absenteeism Rate A 1.62 1.12 * 1.77 (perceived) B 1.56 2.00 * 1.38
Legend:
Empl = Employees
Superv. = Supervisors
A,B are sections
Tech/Clk = technical/clerical

The following groups of employees were used:
1. All employees section A and section B
2. Technical/clerical employees and supervisors
3. Technical/clerical employees and supervisors
4. Technical/clerical employees A and B
5. Supervisors A and B
6. Technical/clerical employees section A only
7. Technical/clerical employees section B only
8. Supervisors section A only
9. Supervisors section B only.
Section A
1. Section
B
Tech/Clk Supv.
!.. .. '.2. 8 .I ..,_... I ~
4.:. - - - - - ~ - - - - _J._ -,, g,
____... I .,_.
'3. ... I •
Tech/Clk Supv.
section
section
Figure 4.3- Employee Combination-Correlation Test
47.
A
B
The results are summarized in table IV .13 and its details are in
appendix F. These will be reviewed column by column and the results
discussed more fully in Chapter V.
Beginning with column (a) for the results obtained for all
employees in both sections, it can be seen that there is a negative
correlation for four out of the five elements related to the absenteeism
rate. The only insignificant correlation is for element 3, peer group
interaction.

Table IV.l3- Significance of Pearsons' correlations of survey results of each variable to absenteeism. Extract from table F.l and F.2, appendix F.
(a) (b) (c) (d) (e~ ~f) <s> (h) All A Tech/Clr. Tech/Clr. Tech/Clr. A Supv. A Tech/Cler. A Tech/Cler. B Su~v. A
Factors + A + B + + + only only on y All B Supv. A Supv. B Tech/Clr. B Supv. B Df 57 Df 34 Df 23 Df 42 Df 15 Df 26 Df 16 Df 8
1 - Job satisfaction Yes* Yes No* Yes No No No No
2 - Supervisory style Yes Yes No Yes No Yes Yes No
3 - Peer group interaction No No No Yes No No Yes No
4 - Task repetitiveness Yes Yes No Yes No Yes No No
5 - Company policy and salary 1 Yes Yes No Yes No Yes No No
Legend:
A,B are sections Yes* means a correlation value that is significant at p ~.osa All, means all employees, supervisors and technical/clerical No* indicates p >.05 Tech/Clr., are technical/clerical
Df is degrees of freedom
1 Question 20 was not included in this element
Note: Due to the particular measuring range used in the questionnaire, the correlation results appendix F, should read as negatives not positives. The negatives swing in Table F.2 of same appendix should read as positives not negatives.
(i) Su~v. B on y
Df 7
No
No
No
No
No
..,. "'
49.
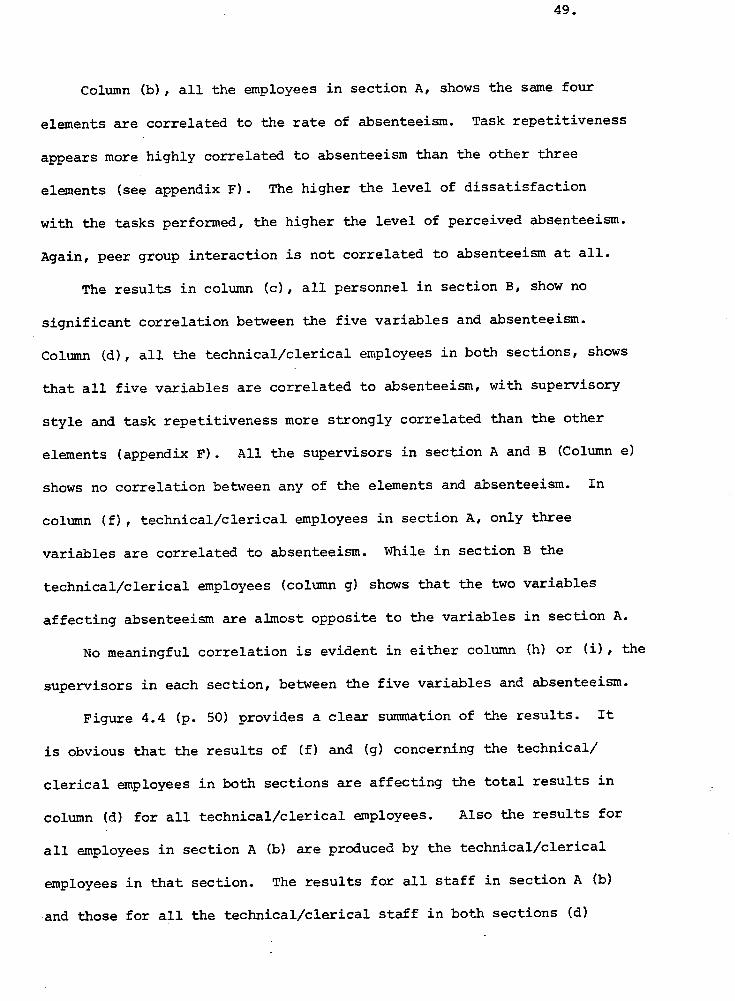
Column (b) , all the employees in section A, shows the same four
elements are correlated to the rate of absenteeism. Task repetitiveness
appears more highly correlated to absenteeism than the other three
elements (see appendix F) • The higher the level of dissatisfaction
with the tasks performed, the higher the level of perceived absenteeism.
Again, peer group interaction is not correlated to absenteeism at all.
The results in column (c), all personnel in section B, show no
significant correlation between the five variables and absenteeism.
Column (d), all the technical/clerical employees in both sections, shows
that all five variables are correlated to absenteeism, with supervisory
style and task repetitiveness more strongly correlated than the other
elements (appendix F). All the supervisors in section A and B (Column e)
shows no correlation between any of the elements and absenteeism. In
column (f), technical/clerical employees in section A, only three
variables are correlated to absenteeism. While in section B the
technical/clerical employees (column g) shows that the two variables
affecting absenteeism are almost opposite to the variables in section A.
No meaningful correlation is evident in either column (h) or (i), the
supervisors in each section, between the five variables and absenteeism.
Figure 4.4 (p. 50) provides a clear summation of the results. It
is obvious that the results of (f) and (g) concerning the technical/
clerical employees in both sections are affecting the total results in
column (d) for all technical/clerical employees. Also the results for
all employees in section A (b) are produced by the technical/clerical
employees in that section. The results for all staff in section A (b)
and those for all the technical/clerical staff in both sections (d)

Figure 4.4 - A comprehensive diagram of correlation results for all the employees/combinations
1
Legend:
OVERALL (a}
1 2 4 5
--------- I --- -- I -- I All A (b) ,- I -- I
I
2 4 5 Tech/Cler. (d) A+ B
1 2 3 4 5 - -
OVERALL means all the employees in both sections All A means the technical/clerical and supervisors in section A All B means the technical/clerical and supervisors in section B A,B are sections Tech/Cler. means technical/clerical
Supervisors A+ B
(e)
1,2,3,4,5 are the numbers given to each of the elements as per table 5.13 Blank spaces signify that there is no correlation between the elements and absenteeism ---- ~ contribution made to overall results ~===~contribution to total T/C results
All B (c)
\J1 0
51.
are producing the results shown in (a). Thus the overall result in
(a) is strictly derived from the Technical/Clerical staff.
The overall results of this study are demonstrated by the two
types of statistical analysis performed. Examining all of the mean
of means data obtained from the questionnaire responses, table IV.12
page 46, no significant attitude difference appears between the two
sections. Section A, however, consistently scored lower than section B.
The overall correlation results seem to be produced by the technical/
clerical employees only. A clear divergence is noticeable between
the questionnaire response and the correlation test. In the next
Chapter this ~iscrepancy and the results of the research will be
discussed, along with the discrepancies observed in the literature
survey.

52.
CHAPTER V
DISCUSSION AND CONCLUSION
This research was undertaken in an attempt to verify if there is
a difference in the behavior and attitudes between two sections of a
government corporation and to determine if, when attitude differs,
the absenteeism and turnover rates will also be different.
Two hypotheses were drawn. The first was concerned with identifying
differences in attitude. The second postulated that, given a difference
in attitude, there would be a difference in absenteeism and turnover.
The research method employed both casual observation and a questionnaire
tool. Let us now discuss the findings in detail.
The casual observation indicated a difference in attitude between
the two sections. But casual observation is insufficiently rigorous
and it is not possible to control for bias in using this method.
Therefore the casual observation was used only to obtain sufficient
data to facilitate preparation of the questionnaire, a more precise
and detailed method. This second tool was used to search for difference
in attitude between the two sections, and whether such a difference in
attitude would result in differences in absenteeism and turnover.

53.
Results of the t-Test on Questionnaire
The responses on the questionnaire were used to seek support for
the first hypothesis, attitude difference and to attempt confirmation
of the second hypothesis, that is, difference in attitude result in
differences in absenteeism and turnover. The results obtained did not
support either hypotheses as no significant difference in the scoring
between the two sections was revealed. Examining tableiV.llpage 43,
which represents only the significant differences between the two
sections, it is possible to ascertain that only particular questions
appear relevant to attitude and job satisfaction differences. The
relevant questions refer to job satisfaction itself, achievement,
decision making, promotion and self-esteem. Together, these constitute
the overall job satisfaction level which influences the individual's
attitude toward the job and the work environment. In Chapter II it
was stated that if these elements or motivators are not fulfilled the
individual will have the tendency to remain absent from work and search
for satisfaction outside the work environment. When this dissatisfaction
becomes unbearable the individual will decide to leave the company
permanently.
The significant differences in attitude were primarily produced by
the technical/clerical employees, with some support from the supervisors.
These results suggest that if the questions used for each of the five
elements were presented in a different combination, then the responses
on the questionnaire would show significant differences in attitude
level between the two sections.

54.
The final results shown on table IV.12page 46, indicate significant
differences in attitude between the two sections for only two elements,
that is supervisory style and company policy. The results show that
the general level of satisfaction is almost at the indifferent or
neutral point, that is, neither satisfied nor dissatisfied. Section A,
however, is slightly less satisfied than section B as originally
predicted. In perceived absenteeism, however, only the supervisors
showed significant differences between group A and group B, with group
B indicating higher absenteeism. This scoring is contrary to the
predicted results.
In the attempt to explore the apparently "neutral" level of
satisfaction, the questionnaires of all the employees were scrutinized
for the comments requested at the end of the 21 questions. Nineteen <
people out of the 34 who completed the questionnaire in section A added
comments. Two people who had left the company two weeks prior to
distribution of the questionnaire were included. In section B, 13
people out of the 23 had written comments, and out of the 13 two had
left the company prior to completing the questionnaire.
The comments received from the 4 ex-employees support the second
attitude hypotheses. Their reasons for leaving were:
- Poor job satisfaction level,
-Working conditions,
- Very poor supervisory style,
- No promotion or incentive systems to reward personnel who were
performing better than others, and
- No potential for future advancement.

55.
The comments that were received from 28 out of the 57 people who
completed the questionnaire, 7 of whom were supervisors (all of whom
are still working for the company), also support the second attitude
survey hypotheses. They revealed:
Poor job satisfaction and/or job motivation in general,
Poor supervisory style,
No promotion system,
No job opportunities available in the market, nor better salary
scale in the market,
Lack of management direction, recognition and feedback, and
No potential for future advancement.
In considering the comments obtained in the questionnaire from
both groups a discrepancy arises: these comments point out an un
satisfactory situation in both sections for one-half the people whereas
the responses on the questionnaires indicate a neutral or indifferent
level of satisfaction. It is difficult to determine the unaerlying
causes of this discrepancy, but possible explanations will be proffered
in the discussion chapter.
Results from the Correlation Test
The correlation test, to relate the overall job satisfaction level
to the perceived absenteeism rate, disclosed a definite negative corre
lation between four of the five elements tested and the perceived
absenteeism for all the employees. It appears then that, for the technical/
clerical employees, the rate of absenteeism is directly related to the
level of dissatisfaction with the 4 variables. In other words, the

56.
assumption that overall job satisfaction and motivation are determining
these employees' behavior is supported. The employees were broken down
by group to search for differences between the two sections and between
the technical/clerical and the supervisors. Table V.l shows these results.
Table V.l -Summary results of correlation test from table F.l and F.2, appendix F.
All Empl. Supv. T/C T/C T/C in A & B A & B A & B A B
No. 1 - Job satisfaction &
job motivation Yes* No* Yes No No
No. 2 - Supervisory style Yes No Yes Yes Yes
No. 3 - Peer group interaction No No Yes No Yes
No. 4 - Task repetitiveness Yes No Yes Yes No
No. 5 - Company policy and salary Yes No Yes Yes No
Number of employees tested 57 15 42 26 16
Legend:
A,B are sections * Yes indicates a correlation . value that is significant T/C are technical/clerical at p ~.OS.
Empl. means employees * No indicates p > . OS
Supv. means supervisors
Looking at table V.l it is evident that the negative correlation with
absenteeism is produced primarily by the technical/clerical employees. It
is also evident that the elements contributing to absenteeism in section
A are not the same as the ones contributing to absenteeism in section B.
The results demonstrate that the variables tested do affect absenteeism.
In other words, although the staff as a group appear neither satisfied

57.
nor dissatisfied with their jobs, each of the five variables are
nevertheless contributing in some way to absenteeism.
An interesting pattern has evolved from the results of the
correlation for the technical/clerical group in both sections. In
section A, the elements contributing to absenteeism are: supervisory
style, task repetitiveness and company policy and salary. In section
B, the elements contributing to absenteeism are: supervisory style and
peer group interaction. The difference in the elements assumed to
contribute to absenteeism would confirm the first hypothesis in which
a difference in attitude was assumed to be present between the two
sections. The attitude difference could be created by the difference
in elements which each group perceives to be met or unmet. This is
a difference in attitude type but not a difference in degree of attitude
or absenteeism. This could explain the failure of the questionnaire
to reveal different absenteeism rates.
No specific statistical data were obtained for the effects of the
five variables on turnover. However, in this study, it was asserted
that absenteeism is a predictor or a substitute for turnover. Absenteeism
represents a replacement factor for turnover in particular situations,
such as lack of opportunities in the market. Furthermore the decision
to remain absent is a less consequential and drastic decision than to
leave permanently. Thus it was said that the cost of absenteeism could
be added to the total cost of turnover. If the absenteeism rate is
high, then it is assumed that the rate of turnover also would be high.

58.
From the data gathered during the research period it appears that
the company faces high absenteeism and turnover. It also appears that
turnover is higher in section A than in section B. Every month at
least 15% of all employees are absent from work at least one day.
The rate of absenteeism in similar government corporations, such as
among postal employees, is about the same, while the rate of absenteeism
among the gas and electrical employees is about 11.2%. 8
In section A, in the past 18 months, 13 employees out of· the 106
have left the company, for an annual rate of 8.17%. In section B, in
the same period, 9 employees out of 80 have left the company, for an
annual rate of 7.5%. If we look at the statistics of turnover for other
government corporations, such as the Post Office we see that the rate of
turnover ranges from 5 to 6.7% a year, while for the gas and electrical
employees the rate is about 7.3% per year. The percentage in turnover
is not high if compared with the national average, but may be considered
high for a government corporation.
The above data indicate that the turnover rate is higher in section
A than in section B, and substantiate the predicted outcomes. Thus
the five elements shown to affect absenteeism could also be indicative
of higher turnover rate.
CONCLUSION
From all the results of the responses to the questionnaires it is
evident that there is no difference in the average attitude level and in
8 Manpower Planning Department, Preliminary Report on Absenteeism and Turnover, regular salaried employees, for March 31, 1972 to September 1976, Postal and Electrical Workers.

59.
the average absenteeism rate between the two sections. This means that
neither hypothesis was substantiated by the initial results. However,
the correlation test showed that all the variables tested are correlated
to absenteeism, but only for the technical/clerical personnel, not for
the supervisors. The results partially support the second hypothesis
and in some degrees the first hypothesis which stated that there would
be a difference in attitude between the two sections. This difference
is only evident in the type of attitude but not in the level. In other
words, each group was affected by different elements producing a difference
in the type of attitude, but this did not produce a difference
in the level of attitude or absenteeism. The statistical data obtained
regarding the turnover rate in the corporation also appear to support
the findings of the correlation test, that all the variables contribute
to turnover, and to absenteeism.
There is an apparent discrepancy between the results computed by
means and the results of the correlation test. Although the employees
in both sections are at the same attitude level, the satisfaction level
has a bearing on the absenteeism rate and possibly the turnover rate.
Another factor is that this apparent indifferent or neutral level
of satisfaction does not match with the solicited responses at the end
of the questionnaires. In other words, the employees in general are
saying on the questionnaire that they are happy with the present
conditions, while half of them are revealing by their comments dissatisfaction
with the present situation.
It is difficult to pinpoint the causes of these contradictions or
to obtain a satisfactory explanation for the discrepancy. One proposal

60.
is a possible inadequacy or ability in the questionnaire to obtain the
most appropriate and the more extreme responses. Further, the type of
questions asked may have caused a certain amount of suspicion among the
corporation's staff, as they lacked previous exposure to such a survey.
An atmosphere of misunderstanding and disbelief which could have caused
distortion in the answers may have been created thereby. It is possible
that management reacted to the questionnaire negatively, creating a
"certain kind of pressure" on the employees. This pressure was indicated
by an unsigned letter received by the observer, from an employee, who
was certain the survey was not an independent survey, but being done
on behalf of the company. A final suggested explanation is that not all
people are influenced in the same way by the five elements used to assess
overall job satisfaction. Furthermore the combinations of questions used
for each element may have not been appropriate, thus distorting the
results.
If we examine the literature we see that there are discrepancies
in the results obtained by various researchers. Some studies have shown
that job satisfaction and job motivation affect absenteeism (Talacchi,
1960), but do not affect turnover. Research done on supervisory style
(Fleishman & Harris, 1962) has shown this element to be negatively
related to turnover but not related to absenteeism. No studies were
found relating supervisory style to absenteeism. Peer group inter
action has been shown to be related to absenteeism in only one study
(Waters & Roach, 1971); other studies done on this element revealed
it to be negatively correlated to turnover but not to absenteeism.
61.
From what has been said in this research and from previous results it
can be assumed that the same elements would also be affecting turnover.
The results of this research demonstrate that all five elements
are correlated to absenteeism only for the technical/clerical employees
in this situation. However, four variables are correlated to absenteeism
for all the employees because of the strength of the technical/clerical
workers' responses. These results are consistent with the results of
the literature research. Peer group interaction was found to be
correlated to absenteeism only for the technical/clerical group in
section B.
The significant results that were achieved in demonstrating the
correlation between supervisory style and absenteeism have not been
reported in the literature. More studies are necessary, however, to
confirm this finding.

62.
Appendix A
Table A.l - Results of the 16 items used in the casual observation.
Statements Section A Section B
lA 2A 3A lB 2B
1) ATTENDANCE 60% 60% 60% 80% 80%
2) SUPERVISORY STYLE: · - Job given with
explanations 4.2 4.0 4.6 2.2 2.2
- Recognition 5.0* 4.8 4.6 2.8 2.6
- Encouragement for suggestions 5.0* 5.0* 5.0* 3.6 3.6
- Interest in employee's work 5.0* 4.6 4.8 3.6 3.4
MEAN 4.8 4.6 4. 75 3.05 2.95
3) PEER INTERACTION: - Behavior of person
under observation 4.0 4.8 3.6 3.2 3.2
Cooperation in group 3.4 3.6 4.4 2.8 2.8
- Behavior of group 3.8 4.0 4.4 3.2 3.0
MEAN 3.73 4.13 4.13 3.6 3.0
4) WORK HABITS: - Work steady 2.6 3.2 3.0 2.4 2.8
- Trips from desk 5.0* 5.0* 5.0* 3.4 2.8
- Trips from desk about work 3.0 2.8 3.0 2.2 2.4
- Conversation about work 3.2 3.0 2.8 2.4 2.4
MEAN 3.45 3.5 3.45 2.6 2.6
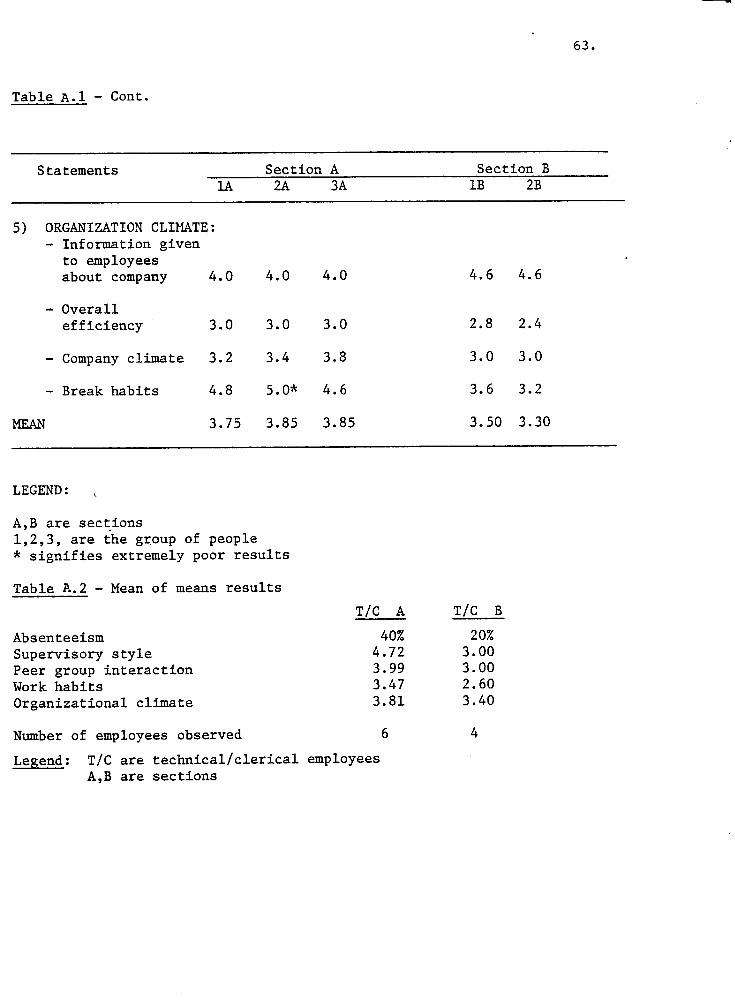
Table A.l - Cont.
Statements Section A lA 2A
5) ORGANIZATION CLH1ATE: - Information given
to employees about company 4.0 4.0
- Overall efficiency 3.0 3.0
- Company climate 3.2 3.4
- Break habits 4.8 5.0*
MEAN 3.75 3.85
LEGEND:
A,B are sec~ions 1,2,3, are the group of people * signifies extremely poor results
Table A.2 -Mean of means results
Absenteeism Supervisory style Peer group interaction Work habits Organizational climate
Number of employees observed
Legend: T/C are technical/clerical A,B are sections
3A
4.0
3.0
3.8
4.6
3.85
T/C A
40% 4.72 3.99 3.47 3.81
6
employees
'--63.
Section B lB 2B
4.6 4.6
2.8 2.4
3.0 3.0
3.6 3.2
3.50 3.30
T/C B
20% 3.00 3.00 2.60 3.40
4

Appendix B
SURVEY QUESTIONNAIRE
1) As you see it, how many opportunities do you feel that you hav~ in your job, to do your job more effectively. (Please circle one number only).
1 Unlimited 4 Few
2 A great many 5 None
3 Quite a few
2) Think about the specific duties of your job. How often have yw felt unable to use your skill and competence in performing your job.
1 Never 4 Very often
2 Seldom 5 Always
3 Often
3) How frequently does your job allow you to make major decisions to change the way you do your work.
1 Always 4 Rarely
2 Many times 5 Never
3 Few times
4) How well does your supervisor know how you do your job.
1 Very well 4 Poor
2 Well 5 Very poor
3 Neither well nor poor
5) Does your supervisor encourage people who work for him/her to
exchange ideas and suggestions.
1 Always 4 Seldom
2 Very often 5 Never
3 Often
64.

65.
Appendix B (Cont'd)
6) How comfortable do you feel about going to your supervisor to criticize his/her ideas about your job.
1 Perfectly comfortable
2 Very comfortable
3 Neither comfortable nor uncomfortable
4 Not very comfortable
5 Uncomfortable
7) When you were hired, how clearly did your supervisor explain the responsibilities and duties related to your job.
1 Perfectly clearly 4 Not very clearly
2 Very clearly 5 Not at all
3 Sufficiently clearly
8) How often does your supervisor discuss with you your performance on the job or tell you how well you are doing.
0 More than 3 times a year 3 Once a year
1 3 times a year 4 Not every year
2 Twice a year 5 Never
9) How often have you thought of not coming to work because of conflicts with your supervisor.
1 Never 4 Few times
2 Rarely 5 Many times
3 Sometimes
10) How often has your company offered you an opportunity for advancement. ( 1)
1 3 times a year 4 Not every year
2 Twice a year 5 Never
3 Once a year
(1) Due to the unrealistic scale of answers, the following adjustment was made when computed on the t-test. Answers to point 1,2, and 3 were considered all as 1, or once a year; answers to point 4 and 5 were considered on the scale of 2, or never.
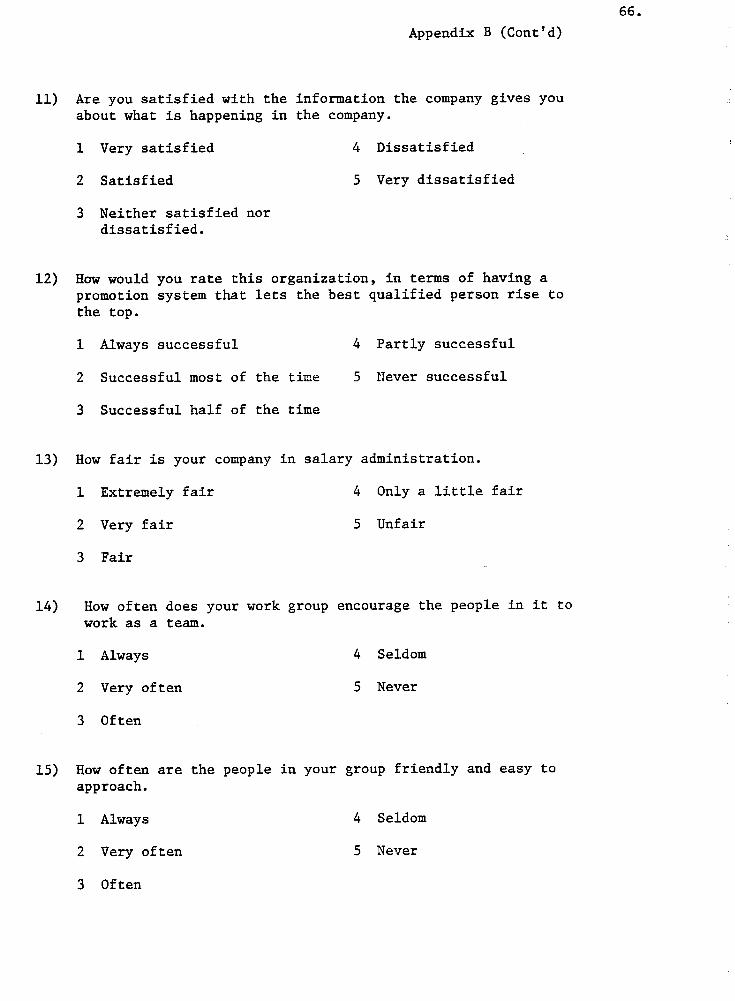
Appendix B (Cont'd)
11) Are you satisfied with the information the company gives you about what is happening in the company.
1 Very satisfied
2 Satisfied
3 Neither satisfied nor dissatisfied.
4 Dissatisfied
5 Very dissatisfied
12) How would you rate this organization, in terms of having a promotion system that lets the best qualified person rise to the top.
1 Always successful 4 Partly successful
2 Successful most of the time 5 tTever successful
3 Successful half of the time
13) How fair is your company in salary administration.
1 Extremely fair 4 Only a little fair
2 Very fair 5 Unfair
3 Fair
14) How often does your work group encourage the people in it to work as a team.
1 Always 4 Seldom
2 Very often 5 Never
3 Often
15) How often are the people in your group friendly and easy to approach.
1 Always 4 Seldom
2 Very often 5 Never
3 Often
66.

Appendix B (Cont'd)
16) How well does your job meet the expectations you had of it
when you were hired.
1 Exactly as expected
2 Mostly as expected
3 Partly as expected
17) How would you rate your job.
1 Always interesting
2 Occasionally interesting
3 Sometimes interesting-sometimes boring
18) Would you say of your job.
1 You wouldn't change it
2 You like it most of the time
3 Sometimes you like it, sometimes you dislike it
4 Only a little as expected
5 Not at all as expected
4 Occasionally boring
5 Always boring
4 You are bored with it most of the time
5 You dislike it very much
19) Within the past year, how frequently have you thought of leaving the company.
1 Never 4 Quite often
2 Once or twice 5 Many times
3 Occasionally
20) Not considering vacations and holidays, how often would you
estimate you are absent from your work, during the year.
1 Less than 5 days a year 4 15 - 20 days a year
2 Between 5 and 10 days a year 5 Over 20 days a year
3 10 - 15 days a year
67.

Appendix B (Cont'd)
21) Considering everything, how satisfied are you in your job.
1 Very satisfied
2 Satisfied
3 Neither satisfied nor dissatisfied
4 Dissatisfied
5 Very dissatisfied
22) Would you explain why you are still working in this company. (Please write down your own reasons as you see fit).
23) Would you explain why you did resign. (Please write down your own personal reasons as you see fit).
24) Comments: (Please write in this space any comments that you wish to make or any explanation or continuation of previous questions. Feel free to add as many pages as you like, or as many comments as you wish).
68.

Dear Friend,
Appendix C
Sonya 0. MARTIN Apt. 314, 9444 Cameron St. Burnaby, V3J lMl
I am enrolled in the M.B.A. program at Simon Fraser University, and one prerequisite to obtaining the master degree is to do a thesis.
The thesis can be done in any subject we choose. Mine is in the Human Behavioral aspect; I would like to explore the causes for satisfaction or dissatisfaction in the work environment.
I have taken the employees in our company as a sample to find out what makes us satisfied or dissatisfied with the work we perform every day.
We all are working for particular reasons, beside money, which may vary according to our needs and opportunities.
My research is aimed at exploring why we are too often dissatisfied with our work, our supervisors, our company. What can we do to modify this status, or what contribution can we make to make the work more enjoyable?
In order to uncover these causes, I need to ask particular questions.
I enclose a survey questionnaire, which I am asking you to complete and sent back to me in the enclosed self-addressed envelope.
Please mark only one answer for each question. Select the answer that is closest to your definition. Do not mark the survey questionnaire with your name, unless you wish to do so.
Once I have back all the survey questionnaires, I will tabulate them and use the derived statistical data for my thesis.
I would like to emphasize that the survey and the thesis are to be used strictly for my study at S.F.U. and are not related, in any way, to our company. In other words, they have nothing to do with the company.
If you should wish to have a copy of my thesis, once it is finished, please feel free to ask me for one. I will be happy to give a copy to any one of you.
69.

Appendix C (Cont 'd)
It is not my intention to give a copy to the management of our company, unless YOU specifically wish so. If so, please tell me in writing of your desire.
I would like to thank you for your help and time spent in completing the survey questionnaire, and to let you know that it is very much appreciated.
Thank you again,
Sincerely,
S.O. Martin
70.

Appendix D
Table D.l - Questionnaires sent, received, completed and/or not completed, by employee status and for each section.
Section A
Superv.
Questionnaires received 8 Questionnaires sent (a) 24
(a) Employees working 22 Left company 3 Could not be reached ( 1)
Total Employees by Status:
Legend:
Superv. = Supervisors Tech/Clerl. = Technical/Clerical
"V
106
Tech/ Clerl.
~ (*) 82
72 10
(*) = 3 employees did not want to complete it (**) = 2 did not want to complete it.
Section B
Superv. Tech/ Clerl.
7 (**) 16 33 47
32 41 1 8
( 2)
-....
80
71.

72.
Appendix E
Table E.l - Questionnaire response to each question. Section A versus Section B - Overall
2-tail
Questions x probabi-
--=- 'I-value lity Df
No.1 - Opportunities on the job All Section A 3.765 0.819 3.53 0.001* 55 All Section B 2.913 0.208
No.2 - Abil{ty to use skill and competence on job All Section A 2.353 1.041 -0.1.7 0.640 55 All Section B 2.478 0.187
No.3- Opportunities on job to make major decisions All Section A 3.706 1.001 0.67 0.505 55 All Section B 3.522 1.039
No.4 - Does supervisor know your job All Section A 2.648 1.178 0.54 0.591 55 All Section B 2.478 1.123
No.5 - Encouragement from supe~visor; exchange of All Section A 3.618 1. 231 2. 72 0.009* 55
ideas and suggestions All Section B 2.696 1. 295
No.6 - Would you be comfortable criticising All Section A 3.176 '1. 466 -0.22 0.824 55
your supervisor if necessary All Section B 3.260 1.287
No.7- Did supervisor explain job at time of hiring All Section A 3.323 1.121 2.48 0.016* 55 All Section B 2.609 0.988
No.8 - How often supervisor discusses performance All Section A 3.676 1.788 4.10 0.000* 55 All Section B 1. 783 1.594
No.9 - How often have you thought of not coming All Section A 1.647 1.070 -0.81 0.422 55
to work because of supervisor All Section B 1. 931 1.411
No.lO- Does company offer opportunity advancement All Section A 1.823 0.387 0. 76 0.452 55 All Section B 1. 739 0.449
No.ll- Satisfaction with information received All Section A 3.853 1. 048 2.24 0.029* 55
about company All Section B 3.174 1.230
No.l2- Is the organization successful with its All Section A 4.176 0.834 2.82 0.007* 55
promotion system All Section B 3.522 0.187

Table E-1 - Continues
Qlestions
No.13- How fair is the company regarding
salary administration
No.l4- Encouragement for work group to work as team
No.l5- People in work group are easy to approach
No.l6- Does your job meet your expectations
No.l7- How would you rate your job
No.l8- ~~at would you say of your job
No.l9-How many times have you thought of leaving the company
No.20- How often are you absent
No.21- Are you satisfi~d with your job
Legend:
Technical/clerical & Supervisors in Section A & Technical/clerical & Supervisors in Section B
x All Section A 3.294 1.060 All Section B 3.087 1.125
All Section A 3.412 1.131 All Section B 2.870 1.217
All Section A 2.176 1.029 All Section B J..913 0.900
All Section A 3.088 1.111 All Section B 2.609 1.270
All Section A 2.823 1.193 All Section B 2.304 1.105
All Secti-on A 2.706 1.060 All Secti-on B 2.217 0.998
All Section A 2.500 1.308 All Section B 2.783 1.380
All Secti-on A 1.618 0.853 All Section B 1.565 0.728
All Section A 2.735 1.136 All Section B 2.652 1.229
X "' mean C""' Standard deviation
Df =Degree of freedom (34 in section A; 23 in section B).
73.
2-tail probabi-
T-value Htr
0.71 :>.483
1. 72 :>.091
l.OO 0.324
1.51 :>.137
1.66 0.103
1. 76 1.086
-0.78 ).437
0.24 0.810
0.26 0.794
The score marked with an asterisks denote the significance of the probability that the event is not
equal for both sections.
DF
55
55
55
55
55
55
55
55
55

Table E.2 - Questionnaire response to each question. Section A versus Section B -All Technical/clerical ~plorees
74.
Appendix E
probabi-
..~.
Questions T-value lity
No.1 - Opportunities on the job
No.2 -Ability to use skill and competence on job
No.3 - Opportunities on job to make major decisions
No.4 - Does supervisor know your job
No.5 - Encouragement from supervisor, exchange of ideas and suggestions
, No.6 - Would yoL be comfortable criticising
your supervisor if necessary
No.7- Did supervisor explain job at time of hiring
No.8 - How often supervisor discusses performance
No.9 - How often have you thought not to come to work because of supervisor
No.lO- Does company offer opportunity advancement
No.ll- Satisfaction with information received about co::1pany
No.l2- Is the orga:1ization successful ~o:ith its promotion sys:cm
Tech/ Section A cler Section B
Tech/ Section A cler Section B
Tech/ Section A cler Section B
Tech/ Section A cler Section B
Techi Section A cler Section B
Tech/ Section A cler Section B
Tech/ Section A cler Section B
Tech/ Section A cler Section B
Tech/ Section A cler Section B
Tech/ Section A cler Section B
Tech/ Section A cler Section B
Tech/ Section A cler Section B
3.846 2.875
2.346 2.562
3.92 3.56
2.731 2.312
3.731 2.812
3.269 3.187
3.346 2.562
3.538 1. 937
1. 654 1.625
1.808 1.687
4.000 3.125
4.192 3.~75
0.834 0.957
1.129 0.892
o. 977 1.094
1.282 1.195
1.282 1.328
1.511 1.276
1.231 0.892
1.964 1. 769
1.129 1.258
0.402 0.479
0.980 1.147
0.895 1. 025
-0.65
1.11
1. 05
2.22
0.18
2.21
2.66
0.08
0.87
2.63
2.72
0.001*
0.519
0.273
0.299
0.032*
0.858
0.033*
o. 011*
0.939
0.387
0.012*
0.010*
Df
40
40
40
40
40
40
40
40
40
40
40
40
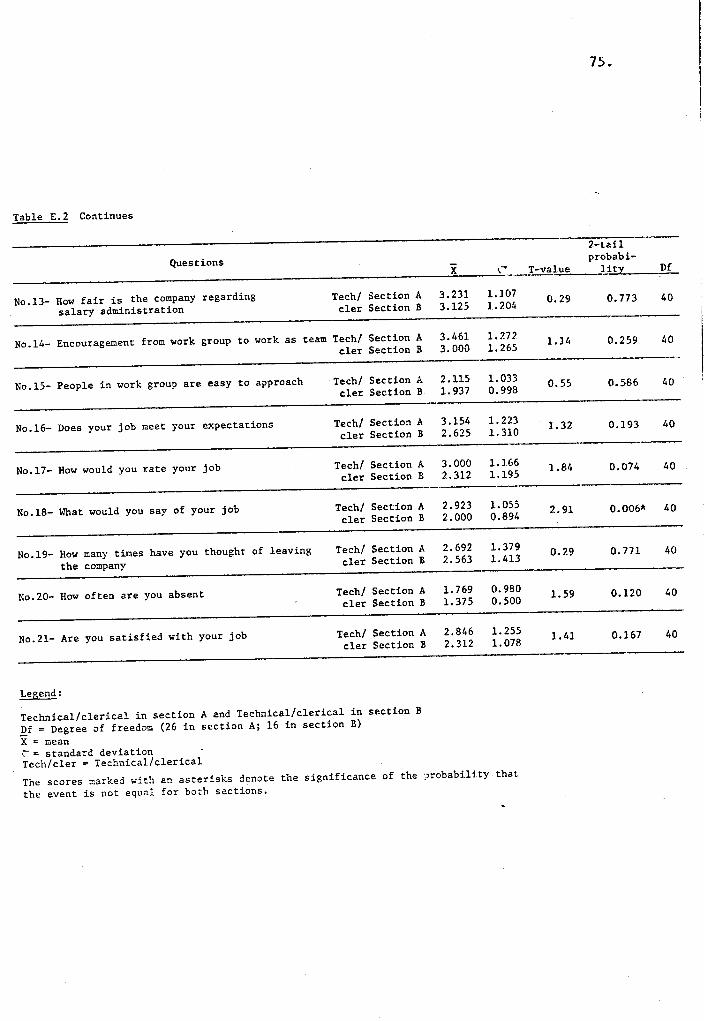
Table E. 2 Continues
Questions
No.l3- How fair is the company regarding Tech/ Section A
salary administration cler Section B
No.l4- Encouragement from work group to work as team Tech/ Section A cler Section B
No.l5- People in work group are easy to approach Tech/ Section A cler Section B
No.l6- Does your job meet your expectations Tech/ Section A cler Section B
No.l7- How would you rate your job Tech/ Section A cler Section B
No.l8- What would you say of your job Tech/ Section A cler Section B
No.l9- How many times have you thought of leaving Tech/ Section A
the company c1er Section B
No.20- How often are you absent Tech/ Section A cler Section B
No.21- Are you satisfied with your job Tech/ Section A cler Section B
Legend:
Technical/clerical in section A and Technical/clerical in section B
Df = Degree of freedom (26 in section A; 16 in section B)
X= mean \ = standard deviation Tech/cler = Technical/clerical
x \-
3.231 1.107 3.125 1. 204
3.461 1.272 3.000 1. 265
2.115 1.033 1. 937 0.998
3.154 1.223 2.625 1.310
3.000 1.166 2.312 1.195
2.923 1.055 2.000 0.894
2.692 1.379 2.563 1.413
1. 769 0.980 1.375 0.500
2.846 1. 255 2.312 1.078
The scores marked with an asterisks denote the significance of the ;>robability that
the event is not equal for both sections.
75.
2-tail probabi-
T-value Hrx D(
0.29 0.773 40
1.14 0.259 40
0.55 0.586 40
1.32 0.193 40
1.84 0.074 40
2.91 0.006* 40
0.29 0. 771 40
1.59 0.120 40
l. 41 0.167 40

76.
Appendix F.
Table E.3 - Questionnaire response to each question. Section A versus Section B. All supervisors
Questions
No.1 - Opportunities on the job
No.2 - Ability to use skill and competence on jar.
No.3 - Opportunities on job to make major decisions
No.4 - Does supervisor know your job
No.5 - Encouragement from supervisor, exchange of ideas and suggestions
No.6 - Would you be comfortable criticising your supervisor if necessary
No.7- Did supervisor explain job at time of hiring
No.8 - How often supervisor discusses performance
No.9 - How often have you thought not to come to work because of supervisor
No.lO- Does company offer opportunity advancement
No.ll- Satisfaction with information received about company
No.l2- Is the organization successful with its promotion system
Supv. Section A Supv. Section B
Supv. Section A Supv. Section B
Supv. Section A Supv. Section B
Supv. Section A Supv. Section B
Supv. Section A Supv. Section B
Supv. Section A Supv. Section B
Supv. Section A Supv. Section B
Supv. Section A Supv. Section B
Supv. Section A Supv. Section B
Supv. Section A Supv. Section B
Supv. Section A Supv. Section B
Supv. Section A Supv. Section B
3.500 3.000
2.375 2.286
3.000 3.428
2.375 2.857
3.250 2.429
2.875 3.428
3.250 2.714
4.125 1.428
1.625 2.571
1.875 1.857
3.375 3.286
4.125 3.857
0.756 1.155
0.744 0.951
o. 756 0.976
0.744 0.900
1.035 1.272
1.356 1.397
0. 707 1.254
0.991 1.134
0.916 1.618
0.354 0.378
1.188 1.496
0.641 0.378
2-tail probabi-
1'·-value litv
1. 01 0.333
0.20 0.842
-0.96 0.356
·-1.14 0.276
1.38 0.191
-0.78 0.451
1.04 0.318
4.92 0.000*
-1.42 0.179
0.09 0.926
0.13 0.899
0.97 0.352
Df
13
13
13
13
13
13
13
13
13
13
13
13

77.
'~---
Table E.3 Continues
2-tail
Questions x probabi-
T-value litv
No.l3- Row fair is the company regarding Supv. Secti.on A 3.500 0.926 1.01 0.333 salary administration Supv. Section B 3.000 1.000
No.l4- Encouragement from work group to work Supv. Section A 3.250 0.463 1.56 0.143 as team Supv. Section Jl 2.571 1.134
No.l5- People in work group are easy to approach Supv. Section A 2.375 1.061 1.10 0.291 Supv. Section B 1.857 0.690
No.l6- Does your job meet your expectations Supv. Section A 2.875 0.641 0.60 0.561 Supv. Section B 2.571 1.272
No.l7- Row would you rate your job Supv. Section A 2.250 1.165 -0.06 0.950 Supv. Section B 2.287 0.951
No.l8- What would you say of your job Supv. Section A 2.000 o. 7,56 -1.47 0.165 Supv. Section B 2.714 1 .. 113
No.l9- How many times have you thought of Supv. Section A 1.875 0.835 -2.60 0. 022* leaving the company Supv. Section B 3.286 1.264
No.20- How often are you absent Supv. Section A 1.125 0.354 -2.32 0.037* Supv. Section B 2.000 1.000
No.21- Are you satisfied with your job Supv. Section A 2.375 0.518 -2.16 0.050* Supv. Section B 3.428 1. 272
Legend:
Supervisors in section A & C = standard deviation
~upervisors in section B Df Degree of freedom (8 in section A. 7 in section B)
X = mean Supv. Supervisors
The scores marked with an asterisk denote the significance of the probability that the
event is not equal for both sections.
Df
13
13
13
13
13
13
13
13
13

78.
Appendix E
Table E.4 - Questionnaire response to each question. Section A only - Supervisors versus Technical/clerical
Questions
No.1 - Opportunities on the job
No.2 - Ability to use skill and competence on job
No.3 - Opportunities on job to make major decisions
No.4 - Does supervisor know your job
No.5 - Encouragement from supervisor, exchange of ideas and suggestions
No.6 - Would you be comfortable criticising your supervisor if necessary
No.7- Did supervisor explain job at time of hiring
Tech/elk Section A Supervisor Section A
Tech/elk Section A Supervisor Section A
Tech/elk Section A Supervisor Section A
Tech/elk Section A Supervisor Section A
Tech/elk Section A Supervisor Section A
Tech/elk Section A Supervisor Section A
Tech/elk Section A Supervisor Section A
3.846 3.500
2.346 2.375
3.923 3.000
2.731 2.375
3.731 3.250
3.269 2.875
3.346 3.250
0.834 0.756
1.129 0.744
0.977 0.756
1.282 0.744
1.282 1.035
1.511 1.356
1.321 0.707
2-tail probabi-
T-value litx_ __ _.::;D'""f-
1.05 0.303 32
-0.07 0.947 32
2.45 0.020* 32
o. 74 0.563 32
0.96 0.342 32
0.66 0.514 32
0.21 0.836 32
-----------------------------------------------------------------------------------------------~~-----~
No.8 - How often supervisor discusses performance
No.9 -How often have you thought not to come to work because of supervisor
No.lD- Does company offer opportunity advancement
No.ll- Satisfaction with information received about company
No.l2- Is the organization successful with its promotion system
Tech/elk Section A Supervisor Section A
Tech/elk Section A Supervisor Section A
Tech/elk Section A Supervisor Section A
Tech/elk Section A Supervisor Section A
Tech/elk Section A Supervisor Section A
3.539 4.126
1.654 1.625
1.808 1.875
4.000 3.375
4.192 4.125
1.964 0.991
1.129 0.916
0.402 0.125
0.980 1.188
0.895 0.641
-0.81 0.425 32
0.07 0.948 32
-0.42 0.674 32
1.50 0.143 32
0.20 0.845 32
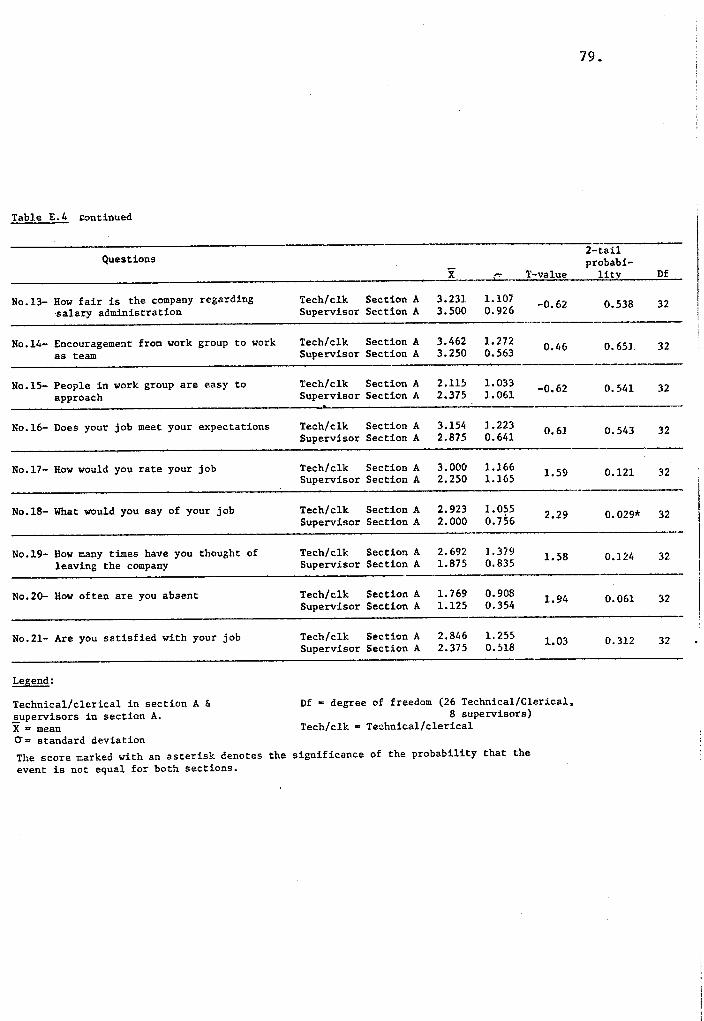
Table E.4 continued
Questions
No.13- How fair is the company regarding ·salary administration
No.l4- Encouragement from \l'ork group to work as team
No.l5- People in work group are easy to approach
No.l6- Does your job meet your expectations
No.17- Ho\1' would you rate your job
No.l8- What \l'ould you say of your job
No.l9- How many times have you thought of leaving the company
No. 20- How often are you absent
No.2!- Are you satisfied \l'ith your job
Legend:
Technical/clerical in section A & supervisors in section A. X a mean 0' = standard deviation
x .....:::..._ '1'-value
Tech/elk Section A 3.231 1.107 -0.62 Supervisor Section A 3.500 0.926
Tech/elk Section A 3.462 1.272 0.46 Supervisor Section A 3.250 0.563
Tech/elk Section A 2.115 1.033 -0.62 Supervisor Section A 2.375 1.061
Tech/elk Section A 3.154 1.223 0.61 Supervisor Section A 2.875 0.641
Tech/elk Section A 3.000 1.166 1.59 Supervisor Section A 2.250 1.165
Tech/elk Section A 2.923 1.055 2.29 Supervisor Section A 2.000 0.756
Tech/elk Section A 2.692 1.379 1.58 Supervisor Section A 1.875 0.835
Tech/elk Section A 1. 769 0.908 1.94 Supervisor Section A 1.125 0.354
Tech/elk Section A 2.846 1.255 1.03 Supervisor Section A 2.375 0.518
Df c degree of freedom (26 Technical/Clerical. 8 supervisors)
Tech/elk = Technical/clerical
The score marked with an asterisk denotes the significance of the probability that the event is not equal for both sections.
79.
2-t.ail probabi-
lity Df
0.538 32
0.65] 32
0.541 32
0.543 32
0.121 32
0.029* 32
0.124 32
0.061 32
0.312 32

80.
Appendix E
Table E.S - Questionnaire response to each question. Section B only. Supervisors versus Technical/clerical
2-tail
_________ Q_u_e_s_t_i_on_s ______________________ ___,X::_' --------~-----!:--~~lue_____:~~~~i~----~-f __
No.1 - Opportunities 'on the job
No.2 -Ability to use skill and co~petence on job
No.3 - Opportunities on job to make major decisions
No.4 - Does supervisor know your job
No.5 - Encouragement from supervisor; exchange of ideas and suggestions
No.6- Would you be comfortable criticising your supervisor if necessary
No.7- Did supervisor explain job at time of hiring
No.8 - Row often supervisor discusses performance
No.9 - How often have you thought not to come to work because of supervisor
No.lQ- Does company offer opportunity advancement
No.ll- Satisfaction with information received about company
No.l2- Is the organization successful with its pronation system
Tech/elk Section B Supervisor Section B
Tech/elk Section B Supervisor Section B
Tech/elk Section B Supervisor Section B
Tech/elk Section B Supervisor Section B
Tech/elk Section B Supervisor Section B
Tech/elk Section B Supervisor Section B
Tech/elk Section B Supervisor Section B
Tech/elk Section B Supervisor Section B
Tech/elk Section B Supervisor Section B
Tech/elk Section B Supervisor Section B
Tech/elk Section B Supervisor Section f
Tech/elk Section B Supervisor Section B
2.875 3.000
2.563 2.286
3.563 3.429
2.313 2.857
2.813 2.429
3.187 3.429
2.563 2.714
1. 938 1.429
1. 625 2.571
1.687 1.858
3.125 3.286
3.375 3.857
0.957 1.155
0.892 0.951
1. 094 0.976
1.195 0.900
1.328 1.272
1.276 1.397
0.892 1.254
1. 769 1.134
1.258 1.618
0.479 0.378
1.147 1.496
1.025 0.378
-0.27
0.67
0.28
-1.07
0.65
-0.41
-0.33
o. 70
-1.52
-0.83
-0.28
-1.20
o. 789 21
0.509 21
0.783 21
0.295 21
0.525 21
0.689 21
0.743 21
0.494
0.143 21
0.417 21
0.781 21
0.245 21
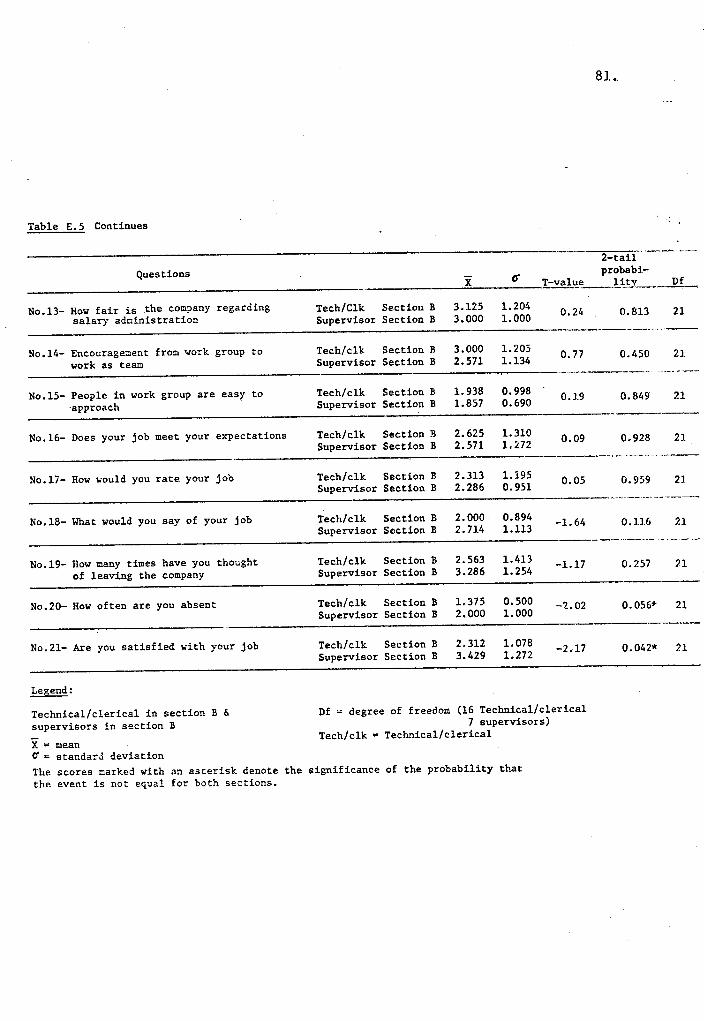
81.
Table E.5 Continues
...... , __ ,,_- .............. -2-tail
Questions x tf probabi-
T-value J_i_ty~~--....ll-
No.13- How fair is the company regarding Tech/Clk Section B 3.125 1.204 0.24 0.813 21 salary administration Supervisor Section B 3.000 1.000
--------~-----
No.l4- Encouragement from "'ork group to Tech/elk Section B 3.000 1.205 0.77 0.450 21 work as teaill Supervisor Section B 2.571 1.134
--------<- ---...-------
No.l5- People in work group are easy to ·approach
No.l6- Does your job meet your expectations
No.l7- How would you rate your job
No.l8- What would you say of your job
No.19- How many times have you thought of leaving the company
No.20- How often are you absent
No.21- Are you satisfied with your job
Legend:
Technical/clerical in section B & supervisors in section B
X = mean ~ = standard deviation
Tech/elk Section B 1. 938 0.998 0.19 Supervisor Section B 1.857 0.690
Tech/elk Section B 2.625 1.310 0.09 Supervisor Section B 2.571 1.272
Tech/elk Section B 2.313 1.195 0.05 Supervisor Section B 2.286 0.951
Tech/elk Section B 2.000 0.894 -1.64 Supervisor Section B 2.714 1.113
Tech/elk Section B 2.563 1.413 -1.17 Supervisor Section B 3.286 1.254
Tech/elk Section B 1.375 0.500 -'l.02 Supervisor Section B 2.000 1.000
Tech/elk Section B 2.312 1.078 -2.17 Supervisor Section B 3.429 1.272
Df ~ degree of freedom (16 Technical/clerical 7 supervisors)
Tech/elk • Technical/clerical
The scores marked with an asterisk denote the significance of the probability tb~t
the event is not equal for both sections.
0.849 21
0.928 21
--··~--~.........-.----,--~---
0.959 21
~·~-... -~~~-~.
0.116 21
··~~- ... ~~-~
o. 257 21
0.0567 21
0.042* 21

82.
Appendix F
Table F.l - Pearson's Correlation of survey results of each variable to absenteeism
All Employees A Tech/Cler. A Tech/Cler. B Tech/Cler. A
+ + + + Variables All Employees B Sueervisors A 8u2ervisors B Tech/Cler. B
r Df=57S r D£=34 5 r D£=23 S r Df=42 s
1 - Job satisfaction 0.3086 0.010 0.3304 0.028 0.2916 0.089 0.3336 0.015
2 - Supervisory style 0.2939 0.013 0.3570 0.019 0.2229 0.153 0.4206 0.003
3 - Peer group interaction 0.1701 0.103 0.1269 0.237 0.2427 0.132 0.2854 0.033
4 - Task repetitiveness 0.4201 0.001 0.5298 0.001 0.1906 0.192 0.4728 0.001
5 - Company policy and salary * 0.2442 0.034 0.3367 0.026 0.1239 0.287 0.3091 0.023
Table F.2 -Pearson's correlation of survey of each variable to absenteeism
Supv.A + Supv.B Tech/Cler. A Tech/Cler.B Supervisors A Supervisors
Variables Df=l5 Df=26 D£=16 Df-=8 Df=7
r s r s r 5 r s r
1 - Job satisfaction 0.2203 0.215 0.2715 0.090 0.2775 0.149 0.0820 0.423 0.2306
2 - Supervisory style -0.1762 0.265 0.3520 0.039 0.4342 0.046 0.4019 0.162 0.1589
3 - Peer group interaction -0.2613 0.173 0.1860 0.181 0.5138 0.021 -0.4664 0.122 0.1193
4 - Task repetitiveness 0.2277 0.207 0.5345 0.002 0.1309 0.315 -0.4382 0.139 0.0810
5 - Company policy and salary* 0.000 0.500 0.3506 0.040 -0.0140 0.480 0.0372 0.465 0.3457
Tech/Cler. is technical/clerical Legend: r is correlation coefficient 5 is level of significance Df is degree of freedom
All is all employees, technical/clerical and supervisors A.B are sections
* question 20 was not computed as part of this variable
Note: Due to the particular measuring scale used on the questionnaire, the above results should read as negatives not positives. The negative results on table F.2 should read positives not negatives.
s 0.305
0. 361
0. 395
0. 43<
0. 22l

Table 4.30 - Number of questionnaires sent, by employee status, to each section
Section A
Status of employees Super- Tech/ visors Clerl.
Employees currently working 22 72
Part-time/full-time who had left 3 10
TOTAL number of employees 25 82
Could not be reached (1)
TOTAL Questionnaires sent 24 82 .. .., , 106
Legend: Tech/Clerl. = Technical/clerical
Table 4.31 - Number of questionnaires received and number of questionnaries not completed or not
83.
Appendix F
Section B
Super- Tech/ visors Clerl.
32 41
1 8
33 49
(2)
33 47 v I
80
received, by employee status and for each section
Section A Section B
Explanation of data Super- Tech/ Super- Tech/ visors Clerl. visors Clerl.
Questionnaires received and completed 8 26 7 16
Did not want to complete it 3 2
Questionnaires not received 16 53 24 31
TOTAL Questionnaires, by status, for each section 24 82 33 47
... y ,
106 80

84.
BIBLIOGRAPHY
ATCHINSON, T.J. & LEFFERTS, E.A., "The prediction of turnover using Herzberg's job satisfaction technique." Personnel PsycholOSJY• 1972, 25. pp. 53-64.
ATKINSON, John W., Motivation, Halsted Press, New York, 1974.
BEACH, Dales., Personnel, the Management of People at Work, MacMillan, London, 1970.
BRAYFIELD, A.H. & CROCKETT, W.H., "Employee attitudes and employee perfonnance." Psychological Bulletin, 1955, Vol. 52. pp. 396-424.
DAVIDSON, D., SUPPES, P., & SIEGEL, S., Decision Making: An Experimental Approach. Stanford U.P., 1957
DUNNETTE, M.D., ARVEY, R., & BANAS, P., "Why Do they Leave?" Unpublished manuscript, 1969.
EVANS, W.M., "Peer-group interaction and organizational socialization: A study of employee turnover," American SociolOSJical Review, 1963, Vol. 28, pp. 436-440.
FLEISHMAN, E. A., & HARRIS, E.F., "Patterns of leadership behavior related to employee grievances and turnover." Personnel Psychology, 1962, Vol. 15, pp. 43-56.
GAVIN, James F., "Self-esteem as a moderator of the relationship between expectancy and job perfonnance." Journal of Applied Psychology, Vol. 58, No. 1, pp. 83-88.
GUEST, R.H., "A neglected factor in labour turnover," Occupational Psychology, 1955, Vol. 29, pp. 217-231.
HERZBERG, Frederick, Motivation to Work, Wiley, New York, 1964.
)}IERZBERG, Frederick, MAUSNER, B., PETERSON, R.O., Job Attitude: Review of Research and Qpinion. Pittsburg: Psychological Services, 1957.
HULIN, C.L., "Job satisfaction and turnover in a female clerical population," Journal of Applied Psychology, 1966, Vol. 50, pp. 280-285.
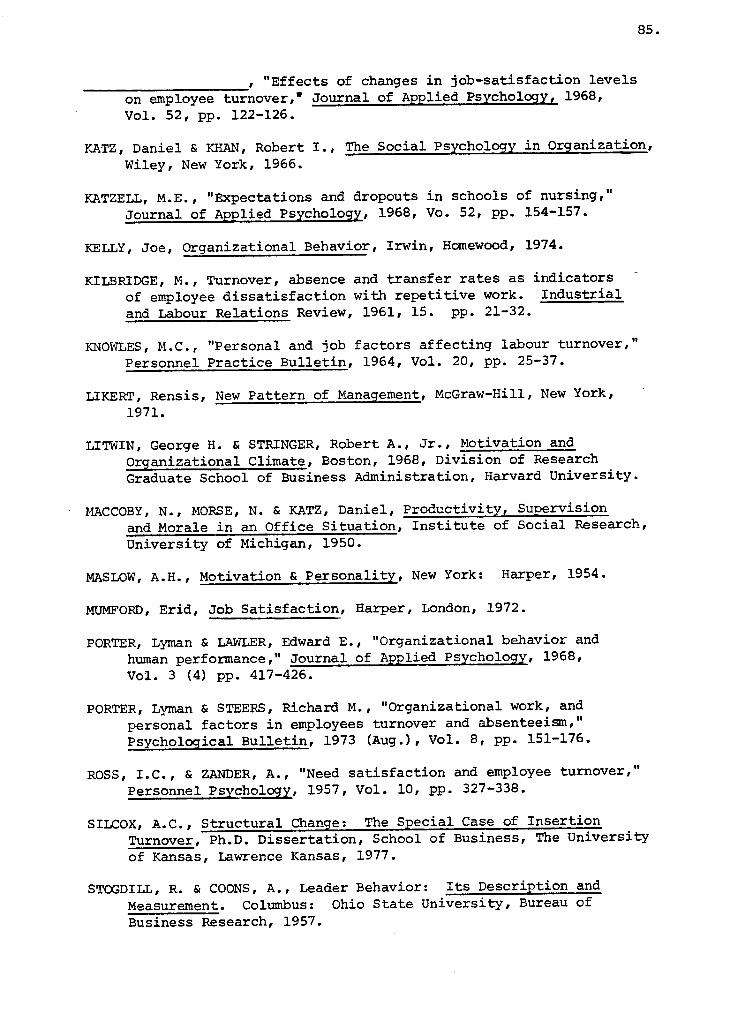
-----------' "Effects of changes in job-satisfaction levels on employee turnover,• Journal of Applied Psychology, 1968, Vol. 52, pp. 122-126.
85.
KATZ, Daniel & KHAN, Robert I., The Social PsychologY in Organization, Wiley, New York, 1966.
KATZELL, M.E., "Expectations and dropouts in schools of nursing," Journal of Applied Psychology, 1968, Vo. 52, pp. 154-157.
KELLY, Joe, organizational Behavior, Irwin, Homewood, 1974.
KILBRIDGE, M., Turnover, absence and transfer rates as indicators of employee dissatisfaction with repetitive work. Industrial and Labour Relations Review, 1961, 15. pp. 21-32.
KNOWLES, M.C., "Personal and job factors affecting labour turnover," Personnel Practice Bulletin, 1964, Vol. 20, pp. 25-37.
LIKERT, Rensis, New Pattern of Management, McGraw-Hill, New York, 1971.
LITWIN, George H. & STRINGER, Robert A., Jr., Motivation and Organizational Climate, Boston, 1968, Division of Research Graduate School of Business Administration, Harvard University.
MACCOBY, N., MORSE, N. & KATZ, Daniel, Productivity, Supervision and Morale in an Office Situation, Institute of Social Research, University of Michigan, 1950.
MASLOW, A.H., Motivation & Personality, New York: Harper, 1954.
MUMFORD, Erid, Job Satisfaction, Harper, London, 1972.
PORTER, Lyman & LAWLER, Edward E., "Organizational behavior and human performance," Journal of Applied Psychology, 1968, Vol. 3 (4) pp. 417-426.
PORTER, Lyman & STEERS, Richard M., "Organizational work, and personal factors in employees turnover and absenteeism," Psychological Bulletin, 1973 (Aug.), Vol. 8, pp. 151-176.
ROSS, I.e., & ZANDER, A., "Need satisfaction and employee turnover," Personnel Psychology, 1957, Vol. 10, pp. 327-338.
SILCOX, A.C., Structural Change: The Special Case of Insertion Turnover, Ph.D. Dissertation, School of Business, The University of Kansas, Lawrence Kansas, 1977.
STOGDILL, R. & COONS, A., Leader Behavior: Its Description and Measurement. Columbus: Ohio State University, Bureau of Business Research, 1957.

TALACCHI, S., "Organization size, .. individual attitudes and behavior: An empirical study." Administrative Science Quarterly, 1960, Vol. 5, 398-420.
86.
TAYLOR, K. & WEISS, D., Prediction of individual job termination from measured job satisfaction and biographical data. University of Minnesota, Work Adjustment Project (Research report #30), October 1969. (a)
------------~--~------' Prediction of individual job turnover: from measured job satisfaction, University of Minneapolis, May 1969 (b), Work Adjustment Project (Research #32).
VROOM, Victor H. & DECI, Edward L., Management and Motivation, Universal Litographers, 1970.