
A Study of Effect of Behavioural Biases on Investment ...
30
Durgadevi Saraf Institute of Management Studies (DSIMS) The Management Quest Vol.3, Issue 1, April - September 2020 Online ISSN:2581- 6632 * Financial & Risk Analyst, Thomson & Reuters, Mumbai ** Dean Academics, DSIMS, Mumbai A Study of Effect of Behavioural Biases on Investment Decisions Vaishnavi Seth* Sharad Kumar** ABSTRACT The field of finance has evolved over the past few decades based on the assumption that people make rational decisions and that they are unbiased in their predictions about the future. Investors are highly influenced by various behavioral biases which affect their decision making process. The main objective of the study is to determine the cognitive biases and the emotional biases that affect investor decisions and to understand if there is any relationship between behavioral biases and investment decisions. The study is conducted to mainly identify and prioritize those behavioral factors that influence investors decision making process. The study was conducted among the investors of Mumbai city and the observations drawn state that Representativeness bias (r=0.341, sig.= 0.001), Hindsight Bias (r=.226, sig.=0.021) and Regret Aversion Bias (r=.239, sig.=0.016) have statistically significant correlations with the Investors’ decisions. These dimensions of behavioral factors influence investor decisions. Self- Attribution Bias though is negatively correlated but does not have statistically significant correlation with the investor decisions when individual regression is conducted. However, collectively considering all independent biases shows that Self-Attribution Bias have a statistically significant influence on the investors’ decision. Even after performing individual regression or collective regression of all the variables together, the impact of Representativeness Bias was showing highest impact on the investors’ decision. This study would therefore help many stakeholders to understand how investors behave when they make investment decisions and is especially useful to the financial institutions to design financial products that address the psychological needs of the investors. Key Words: Behavioural Finance, Investor Decision, Behavioural Biases, Mental Accounting
Transcript of A Study of Effect of Behavioural Biases on Investment ...
Durgadevi Saraf Institute of Management Studies (DSIMS) The Management Quest
Vol.3, Issue 1, April - September 2020
Online ISSN:2581- 6632
* Financial & Risk Analyst, Thomson & Reuters, Mumbai
** Dean Academics, DSIMS, Mumbai
A Study of Effect of Behavioural Biases on Investment
Decisions
Vaishnavi Seth* Sharad Kumar**
ABSTRACT
The field of finance has evolved over the past few decades based on the
assumption that people make rational decisions and that they are unbiased
in their predictions about the future. Investors are highly influenced by
various behavioral biases which affect their decision making process. The
main objective of the study is to determine the cognitive biases and the
emotional biases that affect investor decisions and to understand if there is
any relationship between behavioral biases and investment decisions. The
study is conducted to mainly identify and prioritize those behavioral
factors that influence investors decision making process. The study was
conducted among the investors of Mumbai city and the observations drawn
state that Representativeness bias (r=0.341, sig.= 0.001), Hindsight Bias
(r=.226, sig.=0.021) and Regret Aversion Bias (r=.239, sig.=0.016) have
statistically significant correlations with the Investors’ decisions. These
dimensions of behavioral factors influence investor decisions. Self-
Attribution Bias though is negatively correlated but does not have
statistically significant correlation with the investor decisions when
individual regression is conducted. However, collectively considering all
independent biases shows that Self-Attribution Bias have a statistically
significant influence on the investors’ decision. Even after performing
individual regression or collective regression of all the variables together,
the impact of Representativeness Bias was showing highest impact on the
investors’ decision. This study would therefore help many stakeholders to
understand how investors behave when they make investment decisions
and is especially useful to the financial institutions to design financial
products that address the psychological needs of the investors.
Key Words: Behavioural Finance, Investor Decision, Behavioural Biases,
Mental Accounting
22
1. INTRODUCTION
1.1 Background of the Study
For a long time, everybody thought that traditional finance theory is
accurate because it states that investors think rationally and make informed
decisions, based on various estimations or using economic models. The
investment theories also suggested that investors are rational and base their
decisions on maximizing returns while limiting the risks.
According to Shefrin (2011) behaviour finance is the study of how
psychology affects financial decision-making process and financial
markets. Since psychology explores human judgment, behaviour and
welfare, it can also provide important facts about how human actions differ
from traditional economic assumptions.
1.2 Theoretical Review
1.2.1 Behavioural Biases
Pompian (2012) found that in finance and economics, behavioural biases
refer to the tendency of decision making that results in irrational financial
decisions caused by faulty cognitive reasoning and /or reasoning
influenced by emotions.
Faulkner (2002) puts forward that three types of traits represent the most
prominent characteristics of behavioural finance and these relate either to
regret theory, prospect theory, mental accounting or cognitive dissonance.
1.2.2 Regret Theory
Regret theory (RT) is a model of choice under uncertainty. Developed by
Loomes & Sugden (1982), it generalizes the minimax regret approach used
in decision theory for minimizing the possible losses while maximizing the
potential gain.
1.2.3 Prospect Theory
23
Prospect theory deals with the idea that people do not always behave
rationally. It considers preference as a function of “decision weights” and
it assumes that these weights do not always match with probabilities.
1.2.4 Mental Accounting
According to the mental accounting bias, individuals separate their money
and investments in separate categories (or different mental accounts) based
on certain criteria like source of earning and use of the money. Individuals
or investors might use mental accounting as a means of self-control. Since
investors have imperfect knowledge about the market, they may divide
their money into investments and expenditure pools in order to ensure that
they don’t over-spend. (Kanan Budhiraja, June-2018)
1.2.5 Cognitive Dissonance
Cognitive dissonance is the mental conflict that people experience when
they are presented with evidence that their beliefs or assumptions are
wrong; as such, cognitive dissonance might be classified as a sort of pain
of regret, regret over mistaken beliefs.
1.3 Determinants of Investment Decisions by Individuals
Engin Demirel et al. (2011) studied the interaction between demographic
and financial behavioural factors in investment decisions. The study was
carried to find the impact of demographic factors influencing individual
investors‟ behaviour. It showed that gender interacts with five financial
behavioural factors i.e. overreaction, herding, cognitive bias, irrational
thinking, and overconfidence and the level of individual savings interacts
with only four of the financial behavioural factors namely; overreaction,
herding, cognitive bias and irrational thinking. The following is a detailed
discussion of these factors determining investment decisions and
individual behaviours:
1.3.1 Representativeness Bias
Representativeness bias is a belief perseverance bias in which people tend
to classify new information based on past experiences and classifications.

24
They believe their classifications are appropriate and place undue weight
on them. Research shows that this bias occurs because people attempting
to derive meaning from their experiences tend to classify objects and
thoughts into personalized categories. Investors tend to stereotype. (Kanan
Budhiraja, June-2018)
1.3.2 Illusion of Control Bias
According to Pompian (2012), illusion of control bias is which people tend
to believe that they can control or influence outcomes when, in fact, they
cannot. A review by the author indicated that choices, task familiarity,
competition and active involvement can all inflate confidence and generate
such illusions. This may lead investors to either trade more than is prudent
or inadequately diversify portfolios, for instance, because of familiarity
due to, for instance, having worked in the company. (Mathew, June 2017)
1.3.3 Hindsight Bias
According to Pompian (2012), hindsight bias occurs when people see past
events as having been predictable and reasonable to expect. People tend to
remember their own predictions of the future as more accurate than they
actually were because they are biased by the knowledge of what has
actually happened. Thus people view things that have already happened as
being relatively predictable. (ATHUR, 2014)
1.3.4 Cognitive Dissonance Bias
This very influential theory of social psychology was put forward by Leon
Festinger (1957). Cognition of persons refers to their ideas, notions, beliefs
etc. It is human nature to seek consistency among the cognitions.(Satish K
Mittal, December 2016)
1.3.5 Self-Attribution Bias
Self-attribution bias is the tendency of individuals to ascribe their
successes to innate aspects such as talent or foresight, while more often
blaming failures on outside influences such as bad luck. Therefore, self-
attribution investors can, after a period of successful investing, believe that

25
their success is due to their acumen as investors rather than to factors out
of their control. (Mathew, June 2017)
1.3.6 Loss Aversion Bias
Pompian (2012) illustrates that in prospect theory, loss aversion occurs
when people tend to strongly prefer avoiding losses as opposed to
achieving gains. Prospect theory is a descriptive theory of choice under
uncertainty based on the outcome of numerous experimental psychological
studies. (Mathew, June 2017)
1.3.7 Regret Aversion Bias
It is the tendency of individuals to regret decisions when the outcome isn’t
favourable. Pompian (2012) defined regret-aversion bias as an emotional
bias in which people tend to avoid making decisions that will result in
action out of fear that the decision will turn out poorly. That is, people tend
to avoid the pain of regret associated with bad decisions.
1.3.8 Overconfidence Bias
Overconfidence is a state in which people tend to think they are better than
they really are (Trivers, 1991). Razek (2011) define overconfidence as an
overestimation of the probabilities for a set of events. Agrawal (2012)
noted that overconfidence causes people to overestimate their knowledge,
undervalue risks and overestimate their ability to control events
1.3.9 Over-Optimism Bias
According to Agrawal (2012), optimism is about expecting a favourable
outcome irrespective of the actual effort or skills devoted by individual to
bring about the outcome. The authors note that investors‟ earnings forecast
errors are significantly optimistic for buy recommendations and
significantly pessimistic for sell recommendations
1.3.10 Halo Effect
26
It is a bias in which the overall impression of a person influences how you
feel and think about his or her character. This especially applies to physical
attractiveness influencing how you rate their other qualities.
1.3.11 Self- Serving Bias
This is the tendency to blame external forces when bad things happen and
give yourself credit when good things happen. A number of factors have
been shown to influence the self-serving bias, including age and gender.
Older adults tend to make more internal attributions, that is, credit
themselves for their successes. Men are more likely to make external
attributions, meaning they tend to blame outside forces for their failures.
1.4 Significance of the Study
This study is an attempt to analyse cognitive and emotional biases by
taking behavioural financial factors (cognitive or emotional biases) and
their effects on investment decisions by individual investors. The findings
of this study will be of help to create awareness to the individual investors
on the behavioural biases that they must take cognizance of when making
investment decisions. It will assist investment managers to formulate
appropriate strategies that will help to minimize the negative impact of
such influences.
Stockbrokers and Mutual fund companies would be able to identify both
the cognitive and emotional biases that mostly influence investor
preferences and investment decisions so that they are able to properly
educate investors on how to leverage on the biases. The study will
contribute to the general body of knowledge by enriching the existing
literature in the field of finance.
1.5 SCOPE OF THE STUDY
The scope of the study is limited to Investors behaviour biases on
investment decisions in Mumbai city. The study is based on both
Secondary and Primary data sources.

27
1.6 OBJECTIVE OF THE STUDY
The overall objective of the study is to determine the effect of behavioural
biases on investment decisions of individual investors in India- with
special reference to Mumbai City. It specifically aims at:
1. To determine the cognitive biases that affect investor decisions
2. To determine the emotional biases that affect investor decisions
3. To understand if there is any relationship between behavioural biases
and investment decisions
2. LITERATURE REVIEW
Jaya Mamta Prosad (2014), in the paper on “Impact of Investors’
Behavioural Biases on the Indian Equity Market and Implications on
Stock Selection Decisions: An Empirical Analysis” explores various
noteworthy survey base studies in the field of behavioural finance. These
are divided into three themes. The first theme deals with factors behind the
individual investor behaviour. The second theme analyses the effect of
demographics on investor behaviour. The final strand investigates the role
of psychological biases on investor behaviour.
Abdulahi Dakane Athur (2014), in the paper on “Effect of Behavioural
Biases on Investment Decisions of Individual Investors in Kenya” studies
Successful stock investing is more than choosing a particular stock; it is
also how to go about doing it in Kenya. This is achieved through staying
rational, choosing a few stocks that are likely to outperform the market,
having fortitude to hold on them during short-term market volatility,
keeping track of them and controlling excess optimism and pessimism.
However, this has not been observed in practice.
Satish K Mittal & Deepa Shrivastava (2016), in the paper on “Investment
Behaviour & Biases of Investor: An Empirical Research Agenda in
Indian Perspective” in the 5th
International Conference on Recent Trends
in Engineering, Science & Management develops a conceptual
understanding and presenting a framework in the field of behaviour

28
finance & biases. This paper covers insights on the subject for developing
a deeper understating of the behaviour of investor.
Sukanya.R & Thimmarayappa.R (2015), in the paper on “Impact of
Behavioural biases in Portfolio Investment Decision Making Process” in
International Journal of Commerce, Business and Management presents a
new approach in the analysis of portfolio investment decisions, namely
behavioural finance. This paper examines the role of behavioural biases on
investment decision making process.
Amar Kumar Chaudhary (2013), in the paper on “Impact of Behavioural
Finance in Investment Decisions and Strategies – A Fresh Approach” in
International Journal of Management Research & Business Strategy
examines the meaning and importance of behavioural finance and its
application in investment decisions.
T.V. Raman, Gurendra Nath Bhardwaj and Kanan Budhiraja (June 2018),
in the paper on “Impact of Behavioural Finance in Investment Decision
Making” in International Journal of Civil Engineering and Technology
(IJCIET) explains through the research paper how these biases impact
investment decision making process and what steps can be taken by
individual investors to make rational decisions.
Swati Vishnoi (October 2015), in the paper “Impact of Behavioural
Biases on Investment Decision: With special Reference to Gwalior City”
studies the Behaviour or psychology of investors while making investment
decision is known as Behavioural finance.
Filip-Mihai Toma (2015) in Emerging Markets Queries in Finance and
Business in the paper on “Behavioural biases of the investment decisions
of Romanian investors on the Bucharest Stock Exchange” in Emerging
Markets Queries in Finance and Business Studies Classical economics and
wishes to analyse the investment decisions and behaviour of investors from
Bucharest’s Stock Exchange, Romania. Using financial transaction data, a
wish to study some of the most prominent behavioural biases investors
have shown to be prone to.

29
Mark KY Mak and WH Ip (2017), in the paper on “An exploratory study
of investment behaviour of investors” in International Journal of
Engineering Business Management studies the Chinese and Hong Kong
investor behaviour and provides and understanding on how Individual
investors are becoming more cautious towards financial investment which
makes it difficult for financial service providers to formulate marketing
strategies after experiencing several financial crises.
Sreeram Srivaramakrishnan, Mata Srivastava and Anupam Rastogi (July
2017), in the paper on “Financial literacy, Risk Tolerance and Stock
Market Participation” in an Article in International Journal of Bank
Marketing reports the findings of a study which explored how consumer
financial literacy, risk avoidance, financial wellbeing, regulatory
perception, social influence and hassles of investing influence stock market
participation.
Rajesh Mishra (2018), in the paper on “Financial literacy, Risk Tolerance
and Stock Market Participation” in Asian Economic and Financial
Review explores how households’ stock market investment decisions are
influenced by self-assessed financial literacy, investment awareness, risk
propensity and socio-economic characteristics. This study used national
survey data of Indian households across the country, a survey conducted
by SEBI (Securities and Exchange Board of India) to get a comprehensive
view of households’ characteristics, behaviour and investment patterns.
A. Charles and R. Kasilingam (May 2016), in the paper on “Impact of
Selected Behavioural Bias Factors on Investment Decisions of Equity
Investors” in ICTACT Journal on Management Studies, explains the
impact of behavioural bias factors on investment decision of equity
investors. This study also examines the relationship among these
behavioural bias factors.
H. Kent Baker and Victor Ricciardi (March 2014), in the paper on “How
Biases Affect Investor Behaviour” studies Investor behaviour often
deviates from logic and reason and investors display many behaviour
biases that influence their investment decision-making processes.

30
Joychen Manuel & George Mathew (June2017), in the journal article on
“Impact of Cognitive Biases in Investment Decisions of Individual
Investors in Stock Market” in International Journal of Engineering
Technology, Management and Applied Sciences states that Individuals’
decision on investment in stock market is affected by so many factors
which are influenced by their day to day affairs. The present study
focussing on the extent to which these behavioural and cognitive factors
influencing the investors investment decisions.
3. RESEARCH METHODOLOGY
The general objective of the study is to determine the impact of
behavioral biases on investment decisions of investors in India- special
reference to Mumbai.
3.1 Research Design
This research problem employed the use of partly Descriptive and partly
Conclusive/ Causal. This study generalized the findings to investors in
India-with special reference to Mumbai city. The study also included
quantifiable data and performed statistical techniques.
3.2 Population
For the purpose of this study, the population that was considered were the
investors of India. However major focus of the study was on the investors
of Mumbai city.
3.4 Sample
The sampling plan describes the sampling unit, sampling frame, sampling
procedures and the sample size for the study. The study targeted to have a
combination of Convenience sampling and Random Sampling. The
respondents were targeted by using snow-ball sampling technique as the
first respondent was requested to recommend a colleague who is an
investor and so on, until the desired sample is reached. The study also

31
included secondary data analysis. For the purpose of the study, the
responses of Eighty-one respondents were received from the survey.
3.5 Data Collection
The study included Primary and Secondary sources of data. Secondary
sources included data available in research reports, periodicals, journals
while Primary data collected by way of Questionnaire.
3.6 Data Analysis
Descriptive statistics (mean and std. deviation), Inferential statistic
(testing of hypotheses), causal statistics (correlation and multiple
regression analysis) were used to analyze the data taking help of SPSS and
R-Studio.
The following Linear Regression Model (lm test) was used as a best fit
model to identify the variables showing significant impact on the
Investors’ decision:
Y = α + β1X1 + β2X2 + β3X3 + β4X4 + β5X5 + β6X6 + β7X7 + β8X8 +
β9X9 + ε
Y – The dependent variable represents the investor decision and is
measured by an analysis of the individuals’ risk adjusted returns resulting
from such decisions.
X1 – Representativeness; X2 – Cognitive Dissonance Bias; X3 – Over-
optimism Bias
X4 – Herd Instinct Bias ; X5 – Illusion of Control Bias; X6 – Loss
Aversion Bias
X7 – Hindsight Bias ; X8 – Self Attribution Bias ; X9 – Regret Aversion
Bias
In the model, the dependent variables were operationalized and measured
as shown in appendix-II.
α – is the constant (intercept), and; β1x1….…Xn - the Predictors ; ε - Is
the error term

32
The β coefficients from the equation above represent the strength and
direction of the relationship between the independent and dependent
variables.
3.7 Hypotheses Tested
Set of Null and Alternative hypotheses were formulated to test the
significance of correlation between the Investor’s decision and factor of
bias (for each factor). For example:
Ho: There is no statistically significant correlation between Investor’s
decision and Representativeness Bias
Ha: There is a statistically significant correlation between Investor’s
decision and Representativeness Bias
Similar Null and Alternate hypotheses have been formulated for Cognitive
Dissonance Bias, Over-optimism Bias, Herd Instinct Bias, Illusion of
Control Bias, Loss Aversion Bias, Hindsight Bias, Self-Attribution
Bias and Regret Aversion Bias
4. DATA ANALYSIS AND INTERPRETATION
4.1 Profile of Respondents:
The demographic data collected on respondents was related to the Gender,
Age, and Education, to have an idea of the respondents’ profile in the
sample. No further analysis has been done on this information. The data
presented in Table 4.1 to 4.3 are self-explanatory.
Table 4.1: Distribution of Respondents' Gender
Distribution
Gender of
respondents Frequency Percent
Male 43 53.1
Female 38 46.9
Total 81 100
33
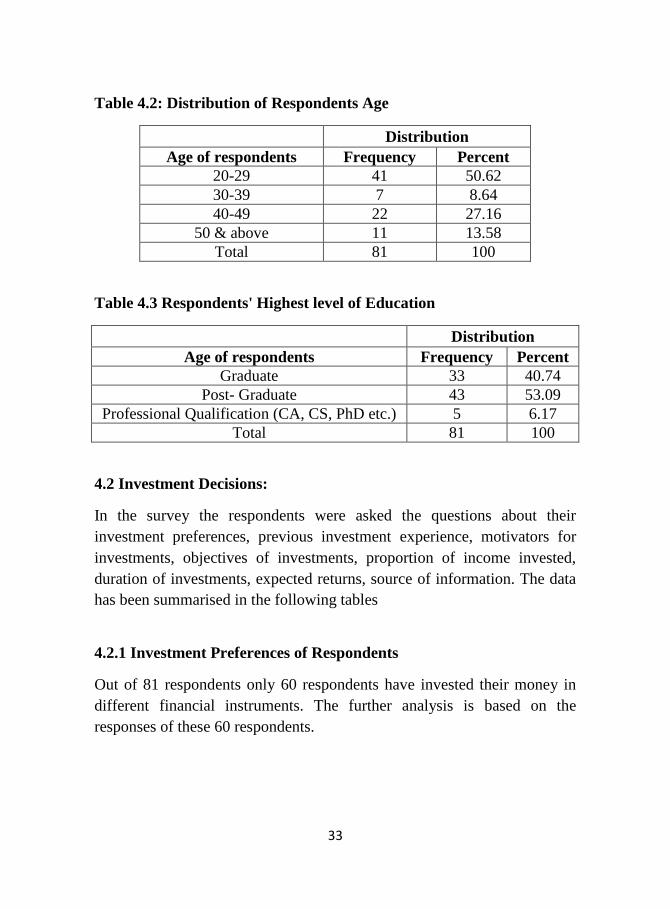
Table 4.2: Distribution of Respondents Age
Distribution
Age of respondents Frequency Percent
20-29 41 50.62
30-39 7 8.64
40-49 22 27.16
50 & above 11 13.58
Total 81 100
Table 4.3 Respondents' Highest level of Education
Distribution
Age of respondents Frequency Percent
Graduate 33 40.74
Post- Graduate 43 53.09
Professional Qualification (CA, CS, PhD etc.) 5 6.17
Total 81 100
4.2 Investment Decisions:
In the survey the respondents were asked the questions about their
investment preferences, previous investment experience, motivators for
investments, objectives of investments, proportion of income invested,
duration of investments, expected returns, source of information. The data
has been summarised in the following tables
4.2.1 Investment Preferences of Respondents
Out of 81 respondents only 60 respondents have invested their money in
different financial instruments. The further analysis is based on the
responses of these 60 respondents.
34
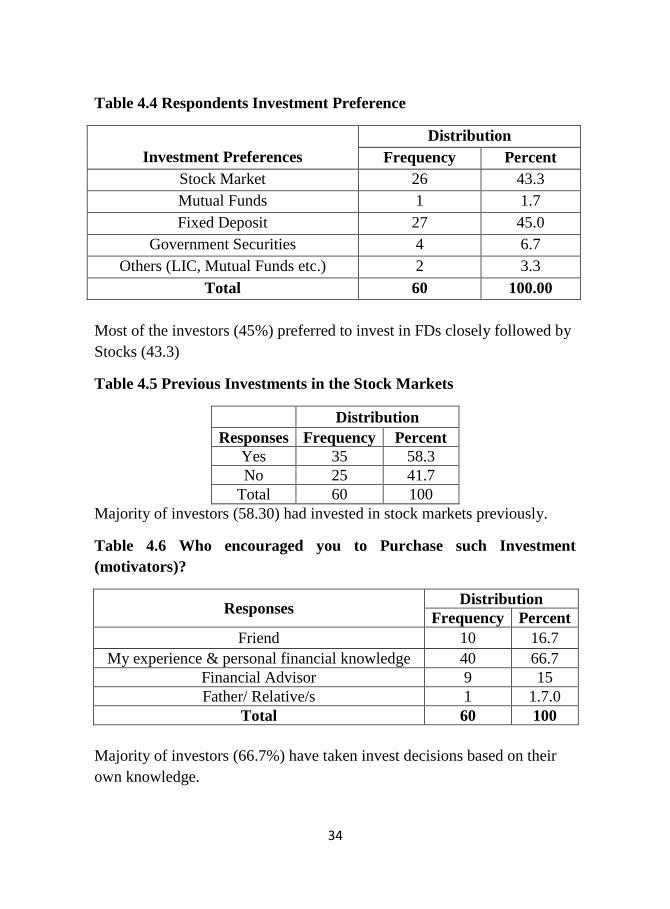
Table 4.4 Respondents Investment Preference
Investment Preferences
Distribution
Frequency Percent
Stock Market 26 43.3
Mutual Funds 1 1.7
Fixed Deposit 27 45.0
Government Securities 4 6.7
Others (LIC, Mutual Funds etc.) 2 3.3
Total 60 100.00
Most of the investors (45%) preferred to invest in FDs closely followed by
Stocks (43.3)
Table 4.5 Previous Investments in the Stock Markets
Distribution
Responses Frequency Percent
Yes 35 58.3
No 25 41.7
Total 60 100
Majority of investors (58.30) had invested in stock markets previously.
Table 4.6 Who encouraged you to Purchase such Investment
(motivators)?
Responses Distribution
Frequency Percent
Friend 10 16.7
My experience & personal financial knowledge 40 66.7
Financial Advisor 9 15
Father/ Relative/s 1 1.7.0
Total 60 100
Majority of investors (66.7%) have taken invest decisions based on their
own knowledge.
35
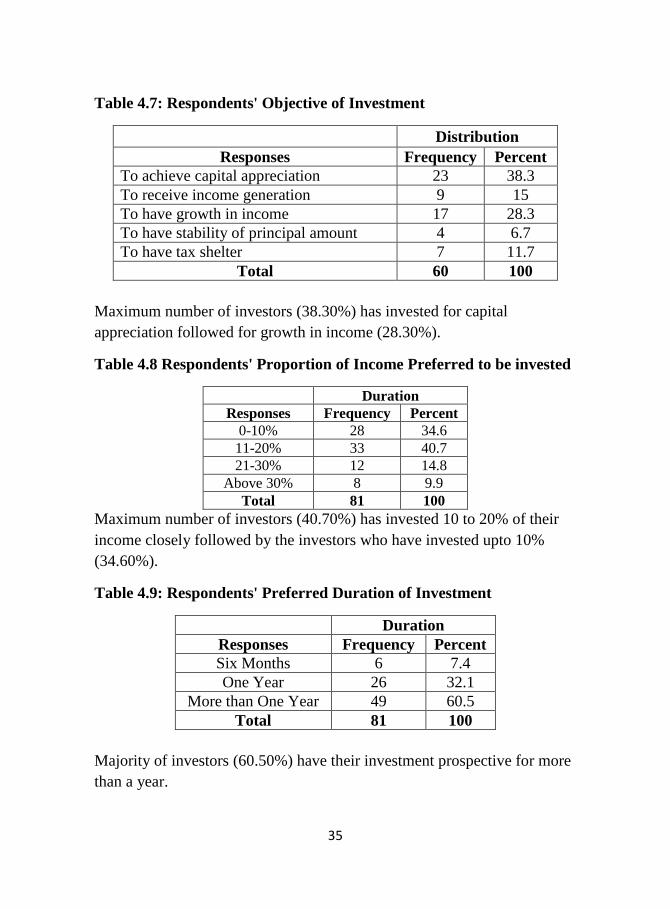
Table 4.7: Respondents' Objective of Investment
Distribution
Responses Frequency Percent
To achieve capital appreciation 23 38.3
To receive income generation 9 15
To have growth in income 17 28.3
To have stability of principal amount 4 6.7
To have tax shelter 7 11.7
Total 60 100
Maximum number of investors (38.30%) has invested for capital
appreciation followed for growth in income (28.30%).
Table 4.8 Respondents' Proportion of Income Preferred to be invested
Duration
Responses Frequency Percent
0-10% 28 34.6
11-20% 33 40.7
21-30% 12 14.8
Above 30% 8 9.9
Total 81 100
Maximum number of investors (40.70%) has invested 10 to 20% of their
income closely followed by the investors who have invested upto 10%
(34.60%).
Table 4.9: Respondents' Preferred Duration of Investment
Duration
Responses Frequency Percent
Six Months 6 7.4
One Year 26 32.1
More than One Year 49 60.5
Total 81 100
Majority of investors (60.50%) have their investment prospective for more
than a year.

36
4.10: Respondents' Expected Return from any Investment
Distribution
Responses Frequency Percent
Between 5 & 10% 15 18.5
Between 11 & 15% 38 46.9
Between 16 & 20% 17 21
Above 20% 11 13.6
Total 81 100
Most of the investors (46.90%) expect a return between 11 and 15%.
Table 4.11: Respondents' Source of Information about Investment
Market
Distribution
Responses Frequency Percent
Television 12 14.8
Websites from Internet 26 32.1
Reference groups 13 16
Print media (including newspapers) 13 16
Brokers/fund managers 17 21
Total 81 100
Most of the investors get the information about the market from the
websites and internet.
Table -1: Determination of the Effect of Behavioral Biases on
Investment Decisions
Influence of
Behavioral Biases
Strongly
Agree
(%)
Agree
(%)
Neutral
(%)
Disagree
(%)
Strongly
Disagree
(%)
Representativeness
Bias 8.64 28.4 29.63 23.46 9.88
Cognitive
Dissonance Bias 2.47 19.75 20.99 33.33 23.46
Over-Optimum Bias 3.7 24.69 28.4 25.93 17.28
Herd Instinct Bias 4.94 27.16 29.63 27.16 11.11

37
Illusion of Control
Bias 9.88 25.93 28.4 18.52 17.28
Loss Aversion Bias 3.7 18.52 23.46 29.63 24.69
Hindsight Bias 9.88 29.63 30.86 16.05 13.58
Self-attribution Bias 7.41 17.28 20.99 23.46 30.86
Regret Aversion Bias 17.28 24.69 27.16 22.22 8.64
Impact of Emotional Biases on the Investment Decisions
Table 2: Using Descriptive Statistics on Emotional Biases.
Emotional Biases N Mean Standard Deviation
Herd Instinct Bias 81 2.88 1.088
Loss Aversion Bias 81 2.47 1.163
Regret Aversion Bias 81 3.2 1.219
Table 2 above shows that emotional biases have high impact on investors
investment decisions. Among the emotional biases, Regret Aversion Bias
is having a high impact on the investors decision making (mean:3.20, std.
deviation:1.219) followed by Herd Instinct Bias (mean:2.88, std.
deviation:1.088) and the least impact of Loss Aversion Bias (mean:2.47,
std. deviation:1.163).
Impact of Cognitive Biases on the Investment Decisions
Table 3: Using Descriptive Statistics on Cognitive Biases
Cognitive Biases N Mean Standard Deviation
Representativeness Bias 81 3.02 1.129
Cognitive Dissonance Bias 81 2.44 1.129
Over-optimism Bias 81 2.72 1.132
Illusion of Control Bias 81 2.93 1.243
Hindsight Bias 81 3.06 1.187
Self-attribution Bias 81 2.47 1.295
Table 3 above shows that cognitive biases have high impact on investors
investment decision: Representativeness Bias (mean:3.02, std.

38
deviation:1.129), Cognitive Dissonance Bias (mean:2.44, std.
deviation:1.129), Over-optimism Bias (mean:2.72, std. deviation:1.132),
Illusion of Control Bias (mean:2.93, std. deviation:1.243), Hindsight Bias
(mean:3.06, std. deviation:1.187), Self-attribution Bias (mean:2.47, std.
deviation:1.295). Among the cognitive biases, Representativeness bias and
Hindsight biases are having high impact on investors decision making
(high mean value and low std. deviation), whereas Cognitive-dissonance
having least impact on investors investment decisions.
Correlation between Behavioral Biases and Investment Decisions
Pearson’s Correlation
Average
Return for
the past five
(5) years
Average Return for the past five years
(Investment Decisions)
Pearson Correlation 1
Sig. (1-tailed)
Past history influences present
investment decisions
(Representativeness Bias)
Pearson Correlation 0.341**
Sig. (1-tailed) 0.001
Holding to one’s investment because
selling them would be painful to him
since it would incur loss (Cognitive
Dissonance Bias)
Pearson Correlation 0.086
Sig. (1-tailed) 0.222
When it comes to trusting people, one
can usually rely on his “gut feelings”
(Over- optimism Bias)
Pearson Correlation 0.172
Sig. (1-tailed) 0.063
Thinking hard and for a long time
about something gives little
satisfaction (Herd Instinct Bias)
Pearson Correlation 0.123
Sig. (1-tailed) 0.138
Investor is informed about all the
fundamentals of the company that he is
confident in making his investments
(Illusion of Control Bias)
Pearson Correlation 0.164
Sig. (1-tailed) 0.071
Investor intends to sell his investments
immediately it goes back to the
acquisition price (Loss Aversion Bias)
Pearson Correlation 0.074
Sig. (1-tailed) 0.256
The previous profits generated from
similar investments by the company
made it very attractive to one to invest
in it (Hindsight Bias)
Pearson Correlation 0.226
Sig. (1-tailed) 0.021*

39
The last investment was more of a bad
luck than it was his own poor judgment
(Self-Attribution Bias)
Pearson Correlation -0.068
Sig. (1-tailed) 0.273
Holding to his investments because he
knows the prices will revert soon
(Regret Aversion Bias)
Pearson Correlation 0.239
Sig. (1-tailed) 0.016*
*Correlation is significant at 0.05 level (1-tailed). **Correlation is
significant at 0.01 levels (1-tailed).
In this above table, the relationships between individual investor decisions
and behavioral factors are analyzed in terms of correlations based on 81
respondents’. Table shows the significance of Pearson’s Correlation
coefficients with alpha at 0.05 and 0.01 levels. The investors’ decision is
positively correlated to all the behavioural factors except “Self Attribution
Bias”. It is statistically significant for the factors: Representativeness Bias
(r=0.341; p=0.001, significant at 0.01 level); Hindsight Bias (r=0.226,
p=0.021, significant at 0.05 level) and Regret Aversion Bias (r=0.239,
p=0.016, significant at 0.05 level). In these cases the null hypotheses have
been rejected and the alternative hypotheses have been accepted indicating
that the investors’ decisions are significantly influenced by
Representativeness Bias, Hindsight Bias and Regret Aversion Bias. The
further analysis is carried out using multiple regression equation taking
behavioural factors as independent variables and investors’ decision as
dependent variable.
Regression Analysis Showing Influence of Behavioral Biases on
Investors Decisions (Using SPSS)
Representativeness Bias
Model Summary
Model
R R R Square
Adjusted Square
Std.
Std. Error of the
Estimate
1 0.341a
0.117 0.105 0.1026854

40
Predictors: (Constant), Representativeness Bias. Dependent Variable:
Investors’ Decision
Table below gives the estimated regression coefficients, standard errors of
the estimates, t-values and significant levels.
Coefficients
Model Un-standardized
Coefficients
Standardized
Coefficients T Sig.
B Std. Error Beta
(Constant) 1.66 3.281 0.51 0.61
Representativeness
Bias 3.28 1.017 0.341 3.23 0
The R square shows the total variation of 11.7% in the Investors’ Decision
can be explained by Representativeness Bias. The regression equation will
be: Y (Investors’ Decision) =1.659 (Constant) + 3.284
(Representativeness Bias). The coefficient for Representativeness Bias
is statistically significant because its p-value (0.002) is smaller than
0.05.
Cognitive Dissonance Bias
Model Summary
Model R R R Square Adjusted Square
Std.
Std. Error of the
Estimate
1 0.086a 0.007 -0.005 0.1088448
Predictors: (Constant), Cognitive Dissonance Bias; Dependent Variable:
Investors’ Decision
Table below shows that the estimated regression coefficients, standard
errors of the estimates, t-values and significant levels.

41
Coefficients
Model Un-standardized
Coefficients
Standardized
Coefficients T Sig.
B Std. Error Beta
(Constant) 9.564 2.899 3.299 0.001
Cognitive
Dissonance Bias 0.83 1.078 0.086 0.77 0.443
The R square shows the total variation of 0.7% in the Investors’ Decision
can be explained by Cognitive Dissonance Bias. The regression equation
will be: Y (Investors’ Decision) =9.564 (Constant) + 0.830(Cognitive
Dissonance Bias). The coefficient for Cognitive Dissonance Bias is not
statistically significant because its p-value (0.443) is larger than 0.05.
Over-optimism Bias
Model Summary
Model
R R
R
Square
Adjusted Square
Std.
Std. Error of the
Estimate
1 0.172a 0.029 0.017 0.107633
Predictors: (Constant), Over-optimism Bias, Dependent Variable:
Investors’ Decision
Table below shows that the estimated regression coefficients, standard
errors of the estimates, t-values and significant levels.
Coefficients
Model Un-standardized
Coefficients
Standardized
Coefficients T Sig.
B Std. Error Beta
(Constant) 7.123 3.126 2.279 0.025
Over-optimism
Bias 1.646 1.063 0.172 1.548 0.126

42
The R square shows the total variation of 2.9% in the Investors’ Decision
can be explained by Over-Optimism Bias. The regression equation will be:
Y (Investors’ Decision) =7.123 (Constant) + 1.646(Over-optimism
Bias). The coefficient for Over-optimism bias is not statistically
significant because its p-value (0.126) is larger than 0.05.
Herd Instinct Bias
Model Summary
Model
R R
R
Square
Adjusted
Square Std.
Std. Error of the
Estimate
1 0.123a
0.015 0.003 0.1084280
Predictors: (Constant), Herd Instinct Bias; Dependent Variable: Investors’
Decision
Table below shows that the estimated regression coefficients, standard
errors of the estimates, t-values and significant levels.
Coefficients
Model Un-standardized
Coefficients
Standardized
Coefficients T Sig.
B Std. Error Beta
(Constant) 8.074 3.423 2.359 0.021
Herd Instinct
Bias 1.223 1.114 0.123 1.098 0.275
The R square shows the total variation of 2.9% in the Investors’ Decision
can be explained by Herd Instinct Bias. The regression equation will be: Y
(Investors’ Decision) =8.074 (Constant) + 1.223(Herd Instinct Bias).
The coefficient for Herd Instinct Bias is not statistically significant
because its p-value (0.275) is larger than 0.05.
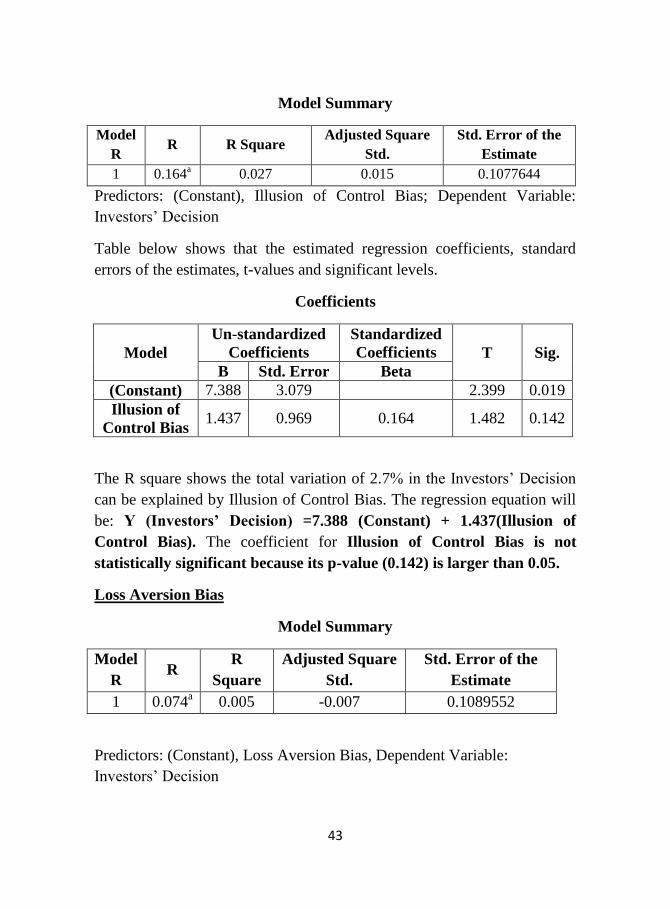
Illusion of Control Bias
43
Model Summary
Model
R R R Square
Adjusted Square
Std.
Std. Error of the
Estimate
1 0.164a
0.027 0.015 0.1077644
Predictors: (Constant), Illusion of Control Bias; Dependent Variable:
Investors’ Decision
Table below shows that the estimated regression coefficients, standard
errors of the estimates, t-values and significant levels.
Coefficients
Model
Un-standardized
Coefficients
Standardized
Coefficients T Sig.
B Std. Error Beta
(Constant) 7.388 3.079 2.399 0.019
Illusion of
Control Bias 1.437 0.969 0.164 1.482 0.142
The R square shows the total variation of 2.7% in the Investors’ Decision
can be explained by Illusion of Control Bias. The regression equation will
be: Y (Investors’ Decision) =7.388 (Constant) + 1.437(Illusion of
Control Bias). The coefficient for Illusion of Control Bias is not
statistically significant because its p-value (0.142) is larger than 0.05.
Loss Aversion Bias
Model Summary
Model
R R
R
Square
Adjusted Square
Std.
Std. Error of the
Estimate
1 0.074a
0.005 -0.007 0.1089552
Predictors: (Constant), Loss Aversion Bias, Dependent Variable:
Investors’ Decision
44
Table below shows that the estimated regression coefficients, standard
errors of the estimates, t-values and significant levels.
Coefficients
Model Un-standardized
Coefficients
Standardized
Coefficients T Sig.
B Std. Error Beta
(Constant) 9.892 2.856 3.464 0.001
Loss Aversion
Bias 0.689 1.048 0.074 0.657 0.513
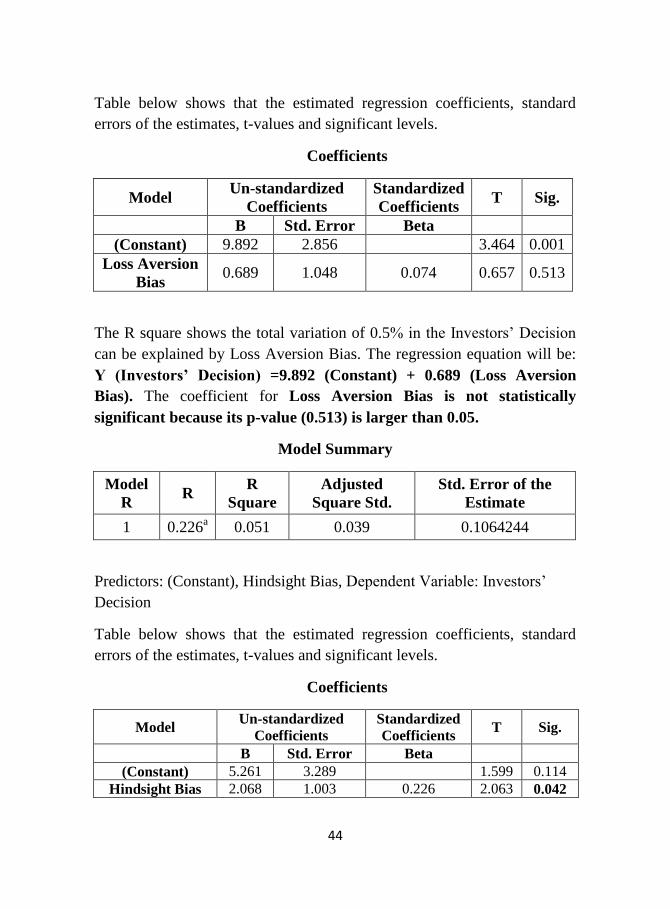
The R square shows the total variation of 0.5% in the Investors’ Decision
can be explained by Loss Aversion Bias. The regression equation will be:
Y (Investors’ Decision) =9.892 (Constant) + 0.689 (Loss Aversion
Bias). The coefficient for Loss Aversion Bias is not statistically
significant because its p-value (0.513) is larger than 0.05.
Model Summary
Model
R R
R
Square
Adjusted
Square Std.
Std. Error of the
Estimate
1 0.226a 0.051 0.039 0.1064244
Predictors: (Constant), Hindsight Bias, Dependent Variable: Investors’
Decision
Table below shows that the estimated regression coefficients, standard
errors of the estimates, t-values and significant levels.
Coefficients
Model Un-standardized
Coefficients
Standardized
Coefficients T Sig.
B Std. Error Beta (Constant) 5.261 3.289 1.599 0.114
Hindsight Bias 2.068 1.003 0.226 2.063 0.042

45
The R square shows the total variation of 5.1% in the Investors’ Decision
can be explained by Hindsight Bias. The regression equation will be: Y
(Investors’ Decision) =5.261 (Constant) + 2.068 (Hindsight Bias).. The
coefficient for Hindsight Bias is statistically significant because its p-
value (0.042) is smaller than 0.05.
Self-Attribution Bias
Model Summary
Model R R R Square Adjusted Square
Std.
Std. Error of the
Estimate
1 0.068a 0.005 -0.008 0.1089996
Predictors: (Constant), Self-Attribution Bias; Dependent Variable:
Investors’ Decision
Table below shows that the estimated regression coefficients, standard
errors of the estimates, t-values and significant levels.
Coefficients
Model Un-standardized
Coefficients
Standardized
Coefficients T Sig.
B Std. Error Beta (Constant) 13.001 2.62 4.962 0
Self-Attribution
Bias -0.57 0.941 -0.068 -0.606 0.546
The R square shows the total variation of 0.5% in the Investors’ Decision
can be explained by Self-Attribution Bias. The regression equation will be:
Y (Investors’ Decision) =13.001 (Constant) – 0.570 (Self-Attribution).
The coefficient for Self-Attribution Bias is not statistically significant
because its p-value (0.546) is larger than 0.05.
Regret Aversion Bias
Model Summary
Model R R R Square Adjusted
Square Std.
Std. Error of the
Estimate
1 0.239a
0.057 0.045 0.1060733

46
Predictors: (Constant), Regret Aversion Bias; Dependent Variable:
Investors’ Decision
Table below shows that the estimated regression coefficients, standard
errors of the estimates, t-values and significant levels.
Coefficients
Model
Un-standardized
Coefficients
Standardized
Coefficients
T
Sig. B Std. Error Beta
(Constant) 4.771 3.327 1.434 0.155
Regret
Aversion Bias 2.133 0.973 0.239 2.192 0.031
The R square shows the total variation of 5.7% in the Investors’ Decision
can be explained by Regret Aversion Bias. The regression equation will
be: Y (Investors’ Decision) =4.771 (Constant) + 2.133 (Regret Aversion
Bias). The coefficient for Regret Aversion Bias is statistically significant
because its p-value (0.031) is smaller than 0.05.
Regression Model Using R-Studio (Linear Regression Model-lm test)
Call: lm(formula = Returns ~ ., data = std Investors Decision)
Residuals:
Min 1Q Median 3Q Max
-0.15978 -0.06280 -0.01486 0.03448 0.31352
Coefficients:
Estimate Std. Error t value Pr (>|t|)
(Intercept) 0.015054 0.038439 0.392 0.6965
`Representative Bias ` 0.035773 0.013662 2.618 0.0108 *
‘Cognitive Dissonance Bi
as ’ -0.008426 0.011830 -0.712 0.4786
`Over- optimism Bias ` 0.012317 0.013365 0.922 0.3599
`Herd Instinct Bias ` 0.005167 0.015163 0.341 0.7343
`Illusion of Control Bias ` 0.001443 0.011616 0.124 0.9015
`Loss Aversion Bias ` -0.010201 0.012448 -0.819 0.4153
47
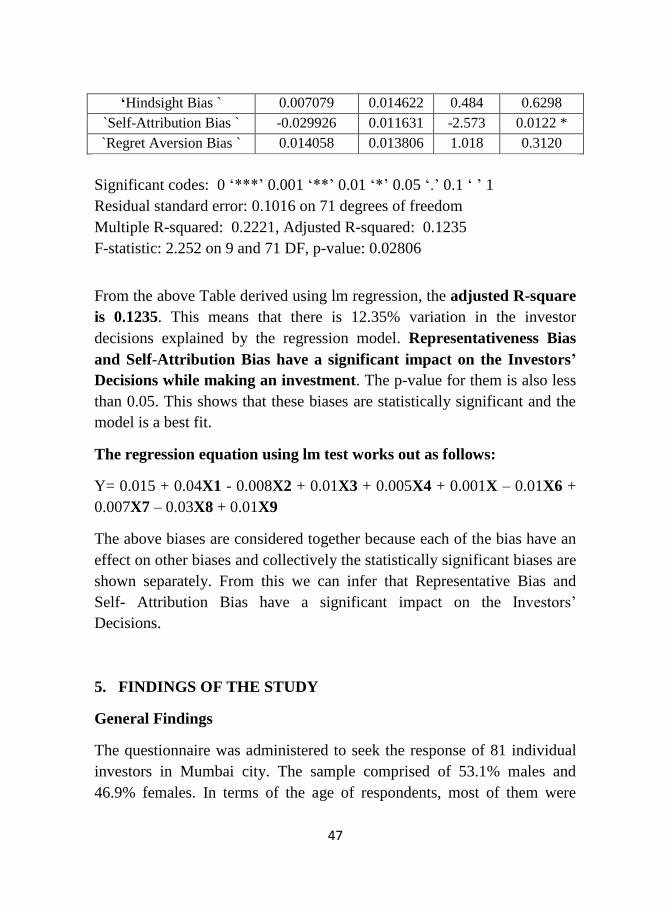
‘Hindsight Bias ` 0.007079 0.014622 0.484 0.6298
`Self-Attribution Bias ` -0.029926 0.011631 -2.573 0.0122 *
`Regret Aversion Bias ` 0.014058 0.013806 1.018 0.3120
Significant codes: 0 ‘***’ 0.001 ‘**’ 0.01 ‘*’ 0.05 ‘.’ 0.1 ‘ ’ 1
Residual standard error: 0.1016 on 71 degrees of freedom
Multiple R-squared: 0.2221, Adjusted R-squared: 0.1235
F-statistic: 2.252 on 9 and 71 DF, p-value: 0.02806
From the above Table derived using lm regression, the adjusted R-square
is 0.1235. This means that there is 12.35% variation in the investor
decisions explained by the regression model. Representativeness Bias
and Self-Attribution Bias have a significant impact on the Investors’
Decisions while making an investment. The p-value for them is also less
than 0.05. This shows that these biases are statistically significant and the
model is a best fit.
The regression equation using lm test works out as follows:
Y= 0.015 + 0.04X1 - 0.008X2 + 0.01X3 + 0.005X4 + 0.001X – 0.01X6 +
0.007X7 – 0.03X8 + 0.01X9
The above biases are considered together because each of the bias have an
effect on other biases and collectively the statistically significant biases are
shown separately. From this we can infer that Representative Bias and
Self- Attribution Bias have a significant impact on the Investors’
Decisions.
5. FINDINGS OF THE STUDY
General Findings
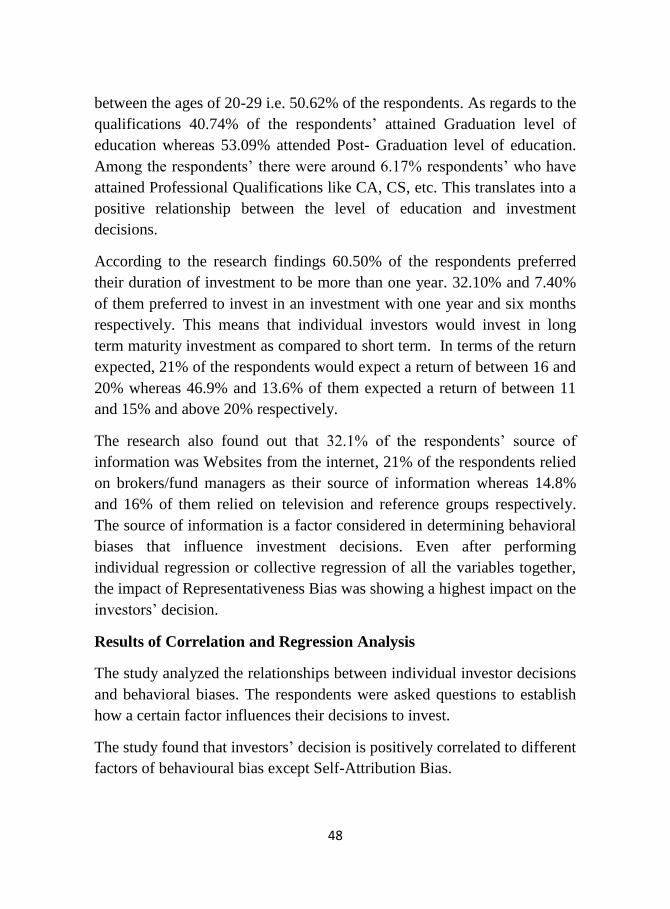
The questionnaire was administered to seek the response of 81 individual
investors in Mumbai city. The sample comprised of 53.1% males and
46.9% females. In terms of the age of respondents, most of them were
48
between the ages of 20-29 i.e. 50.62% of the respondents. As regards to the
qualifications 40.74% of the respondents’ attained Graduation level of
education whereas 53.09% attended Post- Graduation level of education.
Among the respondents’ there were around 6.17% respondents’ who have
attained Professional Qualifications like CA, CS, etc. This translates into a
positive relationship between the level of education and investment
decisions.
According to the research findings 60.50% of the respondents preferred
their duration of investment to be more than one year. 32.10% and 7.40%
of them preferred to invest in an investment with one year and six months
respectively. This means that individual investors would invest in long
term maturity investment as compared to short term. In terms of the return
expected, 21% of the respondents would expect a return of between 16 and
20% whereas 46.9% and 13.6% of them expected a return of between 11
and 15% and above 20% respectively.
The research also found out that 32.1% of the respondents’ source of
information was Websites from the internet, 21% of the respondents relied
on brokers/fund managers as their source of information whereas 14.8%
and 16% of them relied on television and reference groups respectively.
The source of information is a factor considered in determining behavioral
biases that influence investment decisions. Even after performing
individual regression or collective regression of all the variables together,
the impact of Representativeness Bias was showing a highest impact on the
investors’ decision.
Results of Correlation and Regression Analysis
The study analyzed the relationships between individual investor decisions
and behavioral biases. The respondents were asked questions to establish
how a certain factor influences their decisions to invest.
The study found that investors’ decision is positively correlated to different
factors of behavioural bias except Self-Attribution Bias.

49
Representativeness bias (r=0.341, p.= 0.001), Hindsight Bias (r=.226,
p.=0.021) and Regret Aversion Bias (r=.239, p.=0.016) have statistically
significant correlations with the Investors’ decisions. These dimensions
of behavioral factors had influence investor decisions.
CONCLUSION AND RECOMMENDATIONS
The study observed that when the relationship of each bias on the investors
decision is considered separately then the impact of Representativeness
bias, Hindsight bias and Regret Aversion bias were found statically
significant. However, when the regression is run for all the biases together
then the study shows that the impact of Representativeness bias and Self-
Attribution bias only were found statically significant. This is also
considered as a limitation of the study which may require the study to be
conducted on a larger sample to get consistent results.
Behavioral finance seeks to find how investor’s emotions and psychology
affect investment decisions. The study demonstrates how emotions and
cognitive errors influence investors in the decision making process.
Though only 3 behavioural biases have been found statistically significant
for taking investment decisions in this study, other behavioural biases
(except self-attribution bias) had also positive correlation which may play
important role in investment decision.
The study recommends that the investors should be educated towards
different type of biases and their impact on investment decisions. They
may take the advice of experts for minimizing behavioural biases which
may have different impact on different investors.
REFERENCES
Athur, A. D. (2014). Effect Of Behavioural Biases On Investment
Decisions Of Individual. Nairobi.

50
Chaudhary1, A. K. (N.D.). Impact Of Behavioral Finance In
Investment Decisions And Strategies – A Fresh Approach. Ranchi
University ,Jharkhand
(2017). Herding Effects, Over Confidence, Availability Bias and
Representativeness As Behavioral Determinants Of Perceived
Investment Performance.
Ip, M. K. (N.D.). An Exploratory Study Of Investment Behaviour
Of Investors. 2017.
Kanan Budhiraja, D. T. (June-2018). Impact Of Behavioral Finance
In Investment Decision- Making.
Kasilingam, A. A. (May 2016). “Impact Of Selected Behavioural
Bias Factors On Investment Decisions Of Equity Investors. Icctact
Journal on Management Studies.
Mathew, D. J. (June 2017). Impact Of Cognitive Biases In
Investment Decisions Of Individual Investors In Stock Market.
International Journal Of Engineering Technology, Management
And Applied Sciences.
Mishra, R. (2018). Financial Literacy, Risk Tolerance And Stock
Market Participation.
Prosad, J. M. (2014). “Impact Of Investors’ Behavioural Biases On
The Indian Equity Market And Implications On Stock Selection
Decisions: An Empirical Analysis”.
Ricchiardi, H. K. (March 2014). How Biases Affect Investor
Behaviour.
Ricciardi, H. K. (The European Financial Review : February -
March 2014). How Biases Affect Investor Behaviour .
Satish K Mittal, D. S. (December 2016). Investment Behavior &
Biases Of Investor: An Empirical Research Agenda In Indian
Perspective. Pune.
Sreeram Srivaramakrishnan, M. S. (July 2017). Financial Literacy,
Risk Tolerance And Stock Market Participation. International
Journal Of Bank Marketing.