A Study Of Dyslexia Among Primary School Students In ... · PDF file2009 A Study of Dyslexia...
19
250 School of Doctoral Studies (European Union) Journal - July, 2009 No. 1 School of Doctoral Studies (European Union) Journal July A Study Of Dyslexia Among Primary School Students In Sarawak, Malaysia Rosana Bin Awang Bolhasan Education Department Batu Lintang Teachers’ Training Institute Sarawak Malaysia Tel: 082 243501 Fax: 082 252382 E-mail: [email protected] Batu Lintang Teachers’ Training Institute College Road 93200 Kuching Sarawak, Malaysia Abstract The purpose of this study was to determine the degree of dyslexic reading problem among primary school students and the relationship between the degree of dyslexia and the demographic factors. Eight demographics factors, according to gender of age, class, parents’ income, parent education, parents’ occupation, students’ position in the family and the number of brothers and sisters in the family are chosen for the study. There are 32 characteristics of dyslexic student listed in the questionnaire “ Dyslexia Screening Instrument”. 250 dyslexic students from 7 primary schools in Petra Jaya area in Sarawak, who were early determined in the pilot study were the sample in the study. The analysis is done by using SPSS Windows 6.1. The result of the study shows the dyslexic students concerned really facing reading problem because 58-62% of them exhibit the 32 characteristic of dyslexia. However, the relationship between dyslexia and the demographics factors is weak, that is at the correlation of r=0.0 – 0.12 only. This shows that the dyslexic problem among the students are of no correlation with the demographic factors.
Transcript of A Study Of Dyslexia Among Primary School Students In ... · PDF file2009 A Study of Dyslexia...

250
School of Doctoral Studies (European Union) Journal - July, 2009 No. 1
School of Doctoral Studies (European Union) Journal July
A Study Of Dyslexia Among Primary School Students In Sarawak, Malaysia
Rosana Bin Awang Bolhasan
Education DepartmentBatu Lintang Teachers’ Training Institute
Sarawak MalaysiaTel: 082 243501Fax: 082 252382
E-mail: [email protected]
Batu Lintang Teachers’ Training InstituteCollege Road
93200 KuchingSarawak, Malaysia
Abstract
The purpose of this study was to determine the degree of dyslexic reading problem among primary school students and the relationship between the degree of dyslexia and the demographic factors. Eight demographics factors, according to gender of age, class, parents’ income, parent education, parents’ occupation, students’ position in the family and the number of brothers and sisters in the family are chosen for the study. There are 32 characteristics of dyslexic student listed in the questionnaire “ Dyslexia Screening Instrument”. 250 dyslexic students from 7 primary schools in Petra Jaya area in Sarawak, who were early determined in the pilot study were the sample in the study. The analysis is done by using SPSS Windows 6.1. The result of the study shows the dyslexic students concerned really facing reading problem because 58-62% of them exhibit the 32 characteristic of dyslexia. However, the relationship between dyslexia and the demographics factors is weak, that is at the correlation of r=0.0 – 0.12 only. This shows that the dyslexic problem among the students are of no correlation with the demographic factors.

251
Rosana Bin Awang Bolhasan - A Study of Dyslexia among Primary School Students in Sarawak, Malaysia
2009 A Study of Dyslexia among Primary School Students in Sarawak, Malaysia
Intoduction
Dyslexia is a language disability, affecting reading, writing, speaking and listening. It is a dysfunction or impairment in the use of words. Consequently, relation with others and performance in every subject in school can be affected by dyslexia. It can be found around the world principally among boys. It exists in learners of slow, average and superior intelligence. The dyslexic child can come from any background or any income level and dyslexia may occur in any child in a family regardless of order in which he is born.
Like other countries, in Malaysia, reading is one of the skills required in the study of language. It is the important skill in the hierarchy of the Malaysian Education syllabus. It is very essential and considered to be one way to evaluate the success of students in their learning in schools. In the integrated curriculum of Secondary Schools, reading ability is of prime importance besides the skills in arithmetic and writing. The ability to read is not only considered as basis to achieving success in other learning processes but including this skill this main skill of reading in the Education System is proven to be the factor of success from primary to higher institutional level.
Amir Awang (1995) quoted that students ability is one of the factors that contribute of their learning widely in the other areas of knowledge. Findings from research study on reading still persist until today that it has great bearing on achievement in various areas of acquiring knowledge. It is proven that students who are able to read usually have great potentiality in their studies.
According to Bond & Tinker (1987) reading ability considered to be of paramount importance which ties the bond of interaction which enables people to communicate with one another. Smith (1973) had dwelled in depth on “psycholinguistic communication” in correlation with reading process from the view of psycholinguistics. In general it has three views which have been supported by linguists and cognitive psychologists. Their views are:
a. There need to be only small portion of the information that requires understanding from printed text.
b. Understanding must proceed vocabularyc. Reading is not to decode written language
from that of oral.
Our nation’s educational experts have much effort in promoting and developing the skills of reading and interpreting, especially in the Malay Language subject. However, the adversity in reading ability amongst students in the primary and lower secondary school still prevails. According to Mohd. Fadzil Haji Hassan (1998) the problem of student disability in reading in schools has not been solved and so far cannot be overcome.
Students being unable to read and dislike reading is a topic of conversation that is often brought up by the various communities. Abdul Halim Yusuf (1995) quoted:
Recently questions about the increase in the number of studentswho cannot read and dislike reading news from the mediareveals that many students do not have the reading skill.
Lately, the media has reported that students
are not proficient in reading. Various authorities voiced their concern about the phenomenon of students having low reading proficiency. The Malaysian Ministry of Education, parents and teachers have voiced out their concern over the newspaper (Sofiah Hamid, 1999). According to the report from the Director General of The Malaysian Education Ministry, there are about 6,000 of primary 6 students who cannot read properly.
In view of the importance of reading skill which necessarily acquired as the basic skill as well as the unsolved problems about dyslexia, a thorough study needs to be carried.
According to Kamarudin Hj. Hussin (1980) cases on dyslexia are increasing. It happens in the primary school and lower secondary schools. To address this problem, the Ministry of Education has taken steps such as:
252
School of Doctoral Studies (European Union) Journal - July, 2009 No. 1
School of Doctoral Studies (European Union) Journal July
a. Conducting courses on reading for primary school teachers.
b. Introducing special project on remedial and incentive studies in 1975 by Centre
of Advanced Curriculum.c. Organizing and conducting workshops and
seminars ton address the problem.d. All projects being planned are in collaboration
with Faculty of Education University Malaya.e. Many education offices carry out remedial
program on the Malay language subject.f. Teachers Training College for special
education successfully organized courses on methodology for teacher trainees.
Although the Education Ministry has taken various steps to tackle the problem on dyslexia, it has not been able to overcome it successfully. The curriculum division has come up with a finding that primary six students in the school below have received certain percentage of success:
a. The Chinese National School 50.5%b. The Tamale National School 50.8%
(Hasmah Udin, 1998)
This phenomenon has a great set back. Due to that, the Ministry of Education introduces the new Curriculum for primary school, which focuses mainly on reading, writing and arithmetic (Kementerian Pendidikan Malaysia, 1998:1). It is hoped by the end of the primary school level, students are able to adapt themselves into developing thinking process.
Following the new primary school curriculum, the Cabinet Committee has come up with the new Education Policy or System formulated a new Curriculum of secondary school to replace the previous one. This has come up with the stress on speaking, reading and writing proficiently as well as being creative in handling situation.
Musa Jalil (1989) has found out that 40% of the primary 6 students in Pulau Pinang cannot read well. There are 15,728 students, 2573 cannot read, 2,105 can read but without the ability to
comprehend the text they read. His study has come up with a number, 6,668 out of 15,728 who cannot master the basic skill of reading and are almost illiterate.
This has been proven through the weaknesses of the new primary school curriculum. It has not encouraged the student to strive harder and proven to have no bearing at all to improve the situation. It means the student spend fruitless sessions in their schools for the whole 6 years in the primary education.
This situation has raised the level on anxiety amongst educationists, parents and the society. Being not able to possess a good proficiency in reading, students will not be able to refer and learn much from text books in order acquire other knowledge on other genre. It has been proven that students fail in their examinations just because they cannot understand or comprehend the questions. Due to this problem, in depth study is necessary to be carried out so that the real problem can be indentified. The details of the problems can be looked upon from the following points of view and this research objectives are mainly focused on the problem of dyslexia amongst students in the primary school Sarawak, Malaysia. The specification of this study are the highlighting of:
a. The frequent dyslexia characteristics exhibited by the dyslexic students.
b. The relationship between the degree of dyslexia faced by the student and their
demographics factors.c. The significant difference between male and
female dyslexic.
All these aspects are the focus of this case study with the hope that all can be solved, having come up with a guide to remedy the situation with systematic well-planned approaches.
Method
The data for this research was collected from the District of Petra Jaya, in the state of Sarawak, Malaysia. The district was selected because it

253
Rosana Bin Awang Bolhasan - A Study of Dyslexia among Primary School Students in Sarawak, Malaysia
2009 A Study of Dyslexia among Primary School Students in Sarawak, Malaysia
meets the requirement of the main focus of the study in terms of demographical features.
Further more, one pilot study had been made before the actual research was done. The pilot study is to certify the researched subject is being made through interview with the principal, the remedial teachers and other teachers who are teaching them, besides observation of the students who had been notified. This study involved 250 dyslexic students and this sample has been confirmed through the pilot study at the early stage of the research.
Besides using the students sample, the researcher also distributed questionnaire to the 25 teachers who are in charge of every subject, and the class teachers to find out about their perception toward the students. The age of those dyslexic students range 7 to 12 years and were from 7 primary schools.
The pilot study s carried out after interview with those teachers who teach them. Students that have been analyzed are been observed. In this observation, the students characteristic as set in Dyslexia Screening Instrument were detected. In the pilot study report from teachers and the students’ work are also included as criteria to ascertain if the students is suffering from dyslexia.
At first, the researcher distributed questionnaire to the dyslexic students and asked them to write their name in the questionnaire. Then, the researcher distributed the same questionnaire to the class teacher and asked them to evaluate the students. The teachers’ perception is important because according to Abang Ridzuan (1991), “Class teacher is one who knows well about the problems among the students besides their attitude”. In an indirect way, teacher’s perception can be used as a control for the students’ opinions.
The “Dyslexia Screening Instrument” by Kathryn B. Choon et al (1994) is a rating scale designed to describe the cluster of characteristics associated with dyslexia and to discriminate between students who display these characteristics and students who do not. This scale, for use in the school setting, is quick and non intrusive, and provides education professionals with a starting point for identifying students at risk for dyslexia.
The Dyslexia Screening Instrument is designed
to be used with students in grade 1 through 12 (ages 6 through 21). It can be used to screen entire population of students or students who exhibit reading, spelling, writing or language-processing difficulties. Rating and scoring should take 15 to 20 minutes per student.
A classroom teacher who has worked directly with the student for at least six weeks should complete the Rating Form. This will result in a rating that will be more accurate because the teacher has observed the student over a lengthy period of time and can compare the students’ performance to that of the students; classmate.
For an elementary student, the prefer rater is the teacher who instructs the student in a variety of subjects. For a middle school or high school student, the prefer rater a language teacher who generally has more opportunity to observe the behavior that is indicative of dyslexia.
The professional who is in charge of gathering information about the student should explain to the rater that the purpose of the Rating Form is to obtain an accurate picture of current student performance related to specific characteristics. The professional also should make sure the rater understand how to complete the Rating Form and what each statement describes.
The rater should complete the student information on the front of the Rating Form. Not all of the information is required for scoring, but it may be useful for record-keeping purposes.
Never exhibitsa. Seldom exhibitsb. Sometimes exhibitsc. Often exhibitsd. Always exhibitse.
Besides that, a questionnaire is used to recognize especially the Socio-economic status of the students family. The items are:
Gendera. Ageb. Level of studyc. Occupation of Parent/Guardiand. Education of Parent/Guardiane.

254
School of Doctoral Studies (European Union) Journal - July, 2009 No. 1
School of Doctoral Studies (European Union) Journal July
The number of brothersf. Family statusg.
Questions Management
The instrument that is used is a questionnaire, which was translated from its original instrument “Dyslexia Screening Instrument”. Both versions, English (original) and Malay Language (Translated are attached). The questionnaire is made into two groups which contain similar question. The first set is for the students and second set is for the teachers.
Evaluation
Evaluation is made according to evaluation procedure, especially the explanation for every statement which is written in the questionnaire. Both questionnaires need to be completed in 15 to 20 minutes only. The filling in the demographic questionnaire and the questionnaire for students who suffer from dyslexia must be carried out by the help from the teacher and the researcher. Detail explanation about their needs followed by the meaning of a statement must be carried out and it is students preference to choose their scale according to their own valuation. Teachers who are involved must have experience in teaching the students for at least 6 weeks. It can help the teacher to make an observation followed by comparing their potential with their friends. It makes two months to complete the questionnaire.
Data Analysis
The questionnaire that are filled in are collected for analysis. Both of the students and teachers valuation are put together for every respondent. Every respondent is evaluated according to every item in the questionnaire and written down in both valuation scales. One type of analysis from is modified to simplify the analysis. Here is the example of simple procedure by using the analysis form.
Table 1 Analysis Data Code
ITEM 1 ITEM 2 ITEM 3
A B A B A B
Respondent 1 2 1 3 4 2 2
Respondent 2 1 1 2 3 3 4
Respondent 3 1 2 3 2 2 2
There is data analysis from 250 respondents and the items are from 1 to 33. Teacher’s valuations are in (A) and the student’s valuations are in (B). The demographic questionnaire has been accomplished and analyzed. All data has been processed for frequency, correlation, regression followed by T-test by using SPSS Window 6.1.
Frequency analysis is a prepared list of quantitative data and this is done by listing, in rank order from high to low, all the scores to be summarized, with tallies to indicate the number of subjects receiving each score. The scores in a distribution are grouped into intervals. To further the understanding and interpretation of data, it will be presented in frequency polygon with frequency analysis. In this context, frequent act by the students who suffer from dyslexia can be detected easily and frequent analysis characteristics can be also recognized.
With correlation, researcher seeks to determine if relationship exists between two or more variables. By comparing the performance of different groups is the way to study relationships. Sometimes, such relationships are useful in prediction, but most often the eventual goal is to say something about causation (Jack R. Fraenkel and Norman E. Wallen, 1990:158).
Correlation coefficients can take on values from – 1.00 to + 1.00 inclusive; the greater the absolute value of the coefficient, the stronger the relationship. A correlation coefficient of zero indicates no relationship or independence of the variables. In the context of this study correlation is used to seek relationship between the demographic factor and the characteristics which have been shown by the dyslexia students.
Regression analysis allows the researcher to work out whether two variables are associated, whether people who vary on one variable also

255
Rosana Bin Awang Bolhasan - A Study of Dyslexia among Primary School Students in Sarawak, Malaysia
2009 A Study of Dyslexia among Primary School Students in Sarawak, Malaysia
vary systematically on the offer (D.A.de Vaus, 1995: 179). The researcher also can determine how strongly these variables are associated. It also enables the researcher to say how much impact each unit change in the independent variable has on the dependent variable.
In summary, the regression coefficient can be used to measure the amount of impact or change one variable produces in another. They are asymmetrical and will be different according to which variable id independent. In this study, regression will be used to see the most valuable changes or the main influence of dyslexia.
The t-test provides a method by which the means of the samples can be compared when it
is assumed that the samples have been randomly selected and the score are obtained from normally distributed population (Gajendra K. Verma and Kanka Mallick, 1999:205). Use of the test enables researcher to say whether the difference obtained is quite likely to occur by chance, or whether it is significant. In the latter case, the difference may be due to some underlying cause which deserves further investigation.
This is case study research. After pilot study, with interview and observation done, sets of questionnaires are produced for the actual research. The whole procedure of the research is as in Figure 1 below.
15
Pilot Study (Interview)
Pilot Study (Observation)
Pilot Analysis
Study
Constructing Instrument
According to validity and reliability
Applied in the study
Product of study
Figure 1: Research Graphic Procedure

256
School of Doctoral Studies (European Union) Journal - July, 2009 No. 1
School of Doctoral Studies (European Union) Journal July
ResultThe result of the research on dyslexia has
been experienced by the respondents in the primary school level. The question that is going to be answered is, ‘Are the demographic factors like the economic level of the parents influence all dyslexia characteristics?.
The main purpose of describing these variables was to provide some insight into the characteristic of dyslexia students pertaining to the study. All statistical analysis and other analyses on relationships between variables and variances within variables are also described.
From the questionnaire ‘Dyslexia Screening Instrument’, the researcher makes a decision to have a valuation with frequency analysis, correlation analysis, regression analysis and t-test. The researcher used the test result from every individual according to the analysis and finally differentiate them. Before the process, the researcher has to discuss the dyslexia characteristics openly with the students themselves without putting any of the influence factors.
Demographic Characteristics of RespondentsAge
Table 2 shows the distribution of respondents by age. The data indicates that only 19.2 percent of the respondents were 7 years; 68 percent of the respondents were between 8 to 11, and 12 percent wee 12 years of age. The mean age of the respondents was 9.24 years with a range of 7 to 12 years old.
Table 2
Breakdown of Respondents by Gender
(Gender) Number of Respondents Per Cent
Male 145 58Female 105 42
Total 250 100.0
Distribution of Respondents by Age
Age Number of Respondents Per Cent
7 Years 48 19.28 Years 45 189 Years 50 2010 Years 42 16.811 Years 35 1412 Years 30 12
Total 250 SD = 1.98
X = 9.24 SD = 1.98
Parent Income
The monthly income for all parents of the respondent is summarized in table 4. The mean income of the parents was RM325.84. However, the range of their income varied very widely from RM100.00 to RM1280.00. It was generally observed by the researcher that most of the parents of the respondents had understand their actual income.
Table 4
Distribution of Parent IncomeLevel of income
(RM)Number of
Respondents Per CentRM150 and less 70 28RM151 – RM300 90 36RM151 – RM300 52 20.8RM451 – and above 38 15.2
Total 20 100.0X 325.84
Parents Level of Education
Level of education referred to the actual number of years of formal schooling both secular and religious education. The mean number of years of education completed for all parents of respondents was 4.66 years while the range was from 0 to 11 years. Table 5 provides the breakdown of the sample of years of education completed. The data indicates that only 28.4 percent of the parents had education beyond the elementary level (6 years) and 54.4 percent of the parents had formal schooling between 1 to 6 years.
Table 3

257
Rosana Bin Awang Bolhasan - A Study of Dyslexia among Primary School Students in Sarawak, Malaysia
2009 A Study of Dyslexia among Primary School Students in Sarawak, Malaysia
Parent Level of Education
Level of Education Number of Respondents Per Cent
No Education 43 17.21-3 51 20.44-6 85 34.0
7 or more 71 28.4Total 250 100.0
X = 4.66
Hierarchy in the Family
Hierarchy in the family
Number of Respondents Per cent
First 27 10.8Second 35 14Third 25 10Forth 28 11.2
Firth 32 12.8
Sixth 50 20.0Seventh 27 10.8Eight 26 10.4
Total 250 100.0
X = 4.56 SD = 0.17
Hierarchy in the Family
Table 7 shows the distribution of respondents by hierarchy in the family. About 20 percent of the respondents are from the youngest and oldest kids in the family. As revealed from the data, 20 percent of the respondents are sixth in hierarchy of the family, while the second, third, forth and
Parents Occupation
As shown in table 6, of the 250 parents of respondents, about 8.8 percent did not have permanent jobs. 22.4 percent have their permanent jobs in the government sector as teachers, clerks, police, nurses and office workers. However, about 34 percent have their jobs in private sector and self employed with own small business. There were about 34.8 percent of the parents of the respondents involved themselves as labours.
Table 6
Parent Occupation
Occupation Number of Respondents Per cent
- No Permanent Jobs 22 88.8- Private firm 31 12.4- Self employed 54 21.6- Government Service 56 22.4- Labours 87 34.8
Total 250 100.0X = 4.66
While 17.2 percent had not received any formal education.
Table 5
seventh hierarchy revealed almost a similar percentage which range from 10 to 14 percent. The mean for all respondents was 4.56.
Table 7
Number of Siblings
The distribution of number of siblings in the respondents’ family is presented in table 8. The data reveals that the dyslexia students are from family of 3 to 5 siblings which range the percentage of 16.0.
Table 8
Number of Siblings in the FamilyNo. of
SiblingsNumber of
Respondents Per cent
1 15 62 25 103 42 16.84 40 165 42 16.86 40 167 21 8.48 25 10
Total 250 100.0X = 4.59 SD = 0.7

258
School of Doctoral Studies (European Union) Journal - July, 2009 No. 1
School of Doctoral Studies (European Union) Journal July
Items III. View Amount/Percentage
1. The writing vocabulary not stable with the oral vocabulary. (Item 15)
Teachers View 201 ( 80% )
Students View 179 ( 71% )
2. Not active in oral. (item 26)
Teachers View 201 ( 80% )
Students View 173 ( 69% )
3. Weak in arranging the important Point in writing. (Item 16)
Teachers View 200 ( 79.4% )
Students View 188 ( 74.6% )
4. Can remember in a short period (Item 8)
Teachers View 190 ( 75.4% )
Students View 158 ( 62.7% )
5. Less skill in spelling. (Item 17)
Teachers View 158 ( 62.7% )
Students View 176 ( 70% )
6. Understand while in class but Decrease in Test. (Item 9)
Teachers View 188 ( 75% )
Students View 177 ( 70% )
7. Not exact in oral reading. (Item 10)
Teachers View 183 ( 73% )
Students View 167 ( 66.2% )
8. No. PlanningTeachers View 189 ( 75% )
Students View 170 ( 68% )
Statistical Analyses
Frequency analysis
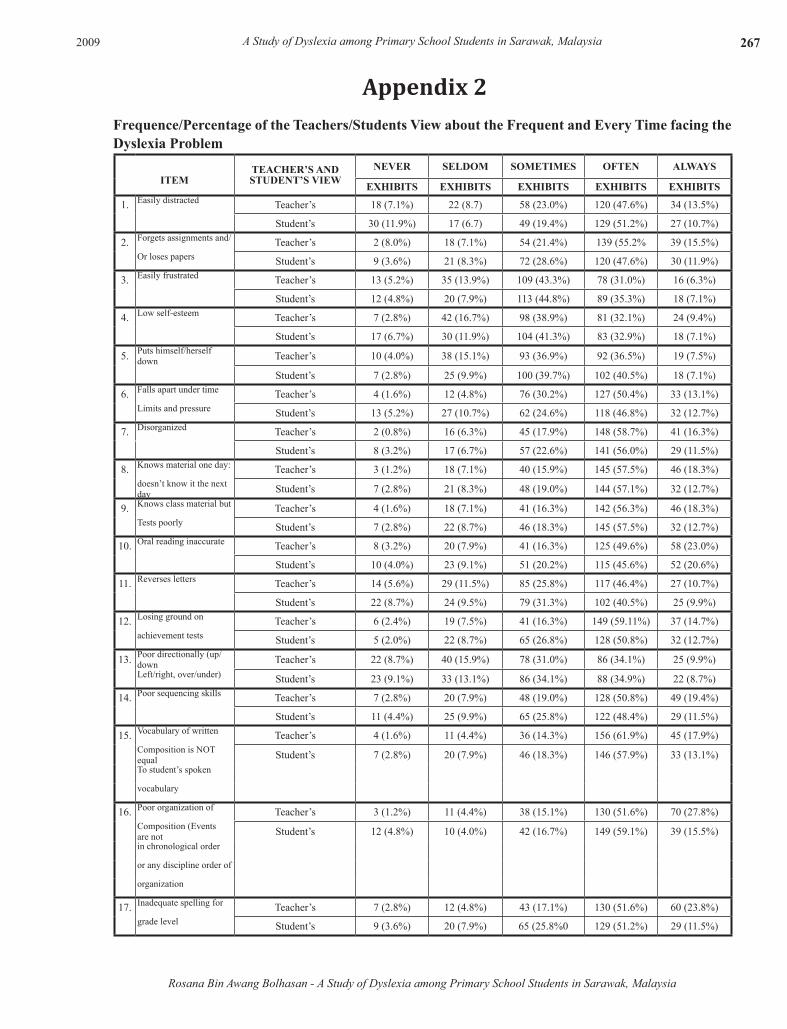
Based on the items in the questionnaire in ‘Dyslexia Screening Instrument’ there are 32 items which are the normal characteristics that have been shown by the students who suffered the dyslexia problem. The research points that the students very often show the 32 characteristics. Although the dyslexia level and status is different from each other, this is the view of the two sides which involved the teachers and the students themselves. Table 9 will show that 62% of the students are frequent and 58% are always showing the 32 characteristics. For more discussion, there are 8 high characteristics percentages from the respondents used in this research.
Table 9: Frequency / Percentages of the Teachers/Students View about the
Every Time facing the dyslexia problem
Table 9 proves that dyslexia’s students are very often showing good response in oral reading. The percentage of 49.6% is the proof of validity of weakness that exist in the students.
Besides that, the students have been detected that they had shown weakness in their writing which may have connection with the oral reading. According to the percentage, in item 20, 49.2% (Teachers view) and 47.6% (Students View).
The students are also showing forgettable characteristic because they understand or know for a short time and could not remember the next day. The figures 57.5% student view are the proof based on that characteristic. Besides that, the students are also weak in arranging words. Accordingly that weakness can be detected from item 14 that shows both view, the teacher’s view 50.8% and the students’ view 11.6%
The students also showed doubts in writing and oral, and it causes the students having problems in both writing skill and oral skill which has been explained in item 10 and 20. this unstable existence has been detected by item 15 that produces the percentage of 61.9% and 57.9% from the teachers and students respectively. Item 17 proves that the students have less skill in spelling at that level, which is supposed to be. This means that the student are really having a problem in spelling skills compared to normal students at the same level. The highest percentage is between 51.6% and 51.2% from the both views which is the proof of the situation.
The students also illustrated the weakness and being slow in making prediction. It may have originated from other weakness, in them. By item 27, this weakness is proved with the percentage of the teachers view (60.7%) and the students view (57.5%) which is quite high. The delay in making the prediction can cause difficulty in making plans. This problem can cause less creativity, ability and can cause problems in studying if there is no action taken to solve the problem. Concerning item 8, regarding students that always forget, this characteristic is supported by item 30. By item 30, the students always show their weakness in repeating the explanation, which have been explained to them. They are weak in

259
Rosana Bin Awang Bolhasan - A Study of Dyslexia among Primary School Students in Sarawak, Malaysia
2009 A Study of Dyslexia among Primary School Students in Sarawak, Malaysia
saying something that has been said to them. The views percentages from both sides on this matter are 57.5% and 56.3%.
There must be a possibility that the students understand what they been taught, but always show their weakness in the test. This matter has been proven because they can easily forget and could not repeat the fact or explanation, which has been given to them like it was stated in item 8 and item 31. The fall in this test id dominated by the percentage, of 56.3% and 57.6% from the view of both sides by item 9 in the questionnaire. The students also show their noisy emotion in making activities or work especially in pressured and limited time. This matter can be proven by item 6 with the percentage of 50.4% and 46.8%. Noisy emotion may be the cause of their less capability in planning their work properly. These students always could not plan their work that shows by the percentage 58.7% and 56%, which is high by item 7 in the questionnaire. The percentage of 47.6% and 51.2% the characteristics are easily disturbed and this is the factor that the students are weak in some aspect.
Item 16, proved that the students are weak in arranging the essay content. The percentage of 51.6% (the teachers view) and 59.1% (the students view) prove the presence of the weakness in the students themselves. This matter may have it’s connection with item 7, which says that the students always could not plan their work.
The correlation and domination is in item 8 and item 30 being interpreted above. Item 19 is also connected. The students are specified as a group that needs repeated explanation because they can easily forget and are already weak in repeating the explanation that has been given to them. By this item 19, the view of 54.0% from the teachers and 51.6% from the student themselves, prove the strong statement that the students need a repetition explanation or ‘drilling’ system.
It is clear that the students often and every time show the 32 characteristics, which an already analyzed by the ‘Dyslexia Screening Instrument’. The dyslexia level and status is detected by the research correlation, that is the percentage of views which have been collected. From the
analysis above, it can be proved that the students are in critical difficulties. In certain situation, their problem is not serious especially for items no. 3,4,5,13,28 and 31 which shows the frequency and every time it is lower than 50%. This shows that we do not agree about them being
Disappointed very easily (item 3)o Down to earth (item 4)o Lower down their status (item 5)o Weak in direction concept (item 13)o Misplace / lost their personal thing (item o 28)Very quick in thinking (item 31)o
Correlation Analysis
By the correlation analysis, there are a few obvious relation between the independent variable with the dyslexia characteristics. This was proven by the Pearson correlation. This analysis shows that there is a relation in weak level only between the dyslexia characteristics with the age factor is ( r = 0.13; p, 0.041 ). This mean that relation exist between the simple disturbed characteristics in the students with their age factor.
Based on the result from the questions 32 and question 8, the change factor has been identified because of the relation between both in the weak stages. That means from the questionnaires that have been given to the students, their characters are weak regarding education, occupation and their parents or guardians. Their characteristics are not influenced by their parents or guardians high education or their high salary. That also for the matter of factor-gender, age, the number of siblings, and their status in the family. All these factors have their own weakness for the dyslexia characteristics.
Because of the high percentage in the weak level ( below r – 0.4 ), we have to see how much is the amount that r = 0.12 to see the connection. From this result, we will divide them into two groups that is parents which influence the students and the students factor itself, which emerge in the dyslexia characteristics in the questionnaire.

260
School of Doctoral Studies (European Union) Journal - July, 2009 No. 1
School of Doctoral Studies (European Union) Journal July
The number of siblings factor for example only influences the students look which is forget easily (0.2), not right in oral reading (0.12) and inequality (0.04) on level p < 0.05.
There is less influence by parents or guidance in student’s dyslexia characteristic. This proves that with correlation obtained by Pearson which shows the it is not beyond 0.4 but only around r = 0.0 until r = 0.12 only.
Regression Analysis
In the regression analysis which has been carried out, researcher likes to know the main demographic factor, which influences dyslexia. For that, researcher has inserted all this which is occupation, income, and the parents education in the research for the purpose to find one or some factors that always influence the students. Also included are the five students demographic factors, which are age, gender, status in the family, number of siblings and the class that the students are in while the research is in progress.
Table 12: The Demographic Factors Which Influence Dyslexia
Table 10: Parents / Guardian with Dyslexia Characteristics
ITEM
FAC-TORS
Disap-pointedEasily
Feel Down
TO Earth
Feel Down
TO Earth
Explana-tion
To Be Repeated
Education 0.12 0.08 0.06 0.4
Income 0.04 0.10 0.04 0.04
Income 0.02 0.02 0.1 0.07
ITEM
FACTORS
Forget Easily Not right in oral reading
Unrelation oral
vocabulary with writing vocabulary
Number of siblings 0.02 0.12 0.04
Status in the family 0.02 0.12 0.1
Gender 0.05 0.06 0.09
Age 0.08 0.02 0.09
Primary Level 0.08 0.02 0.09
Mult R R2
RF
R Signifi-
cant
Occupation .367 .135 .124 .894 P < .001
Income .307 .094 .083 .894 P < .001Education .285 .082 .070 1.298 P < .001
Age .221 .049 .041 .848 P < .01Number of
siblings .158 .025 .021 .970 P < .05
Status of the family .157 .024 .021 .848 P < 0.5
Primary .386 .149 .135 .889 P < .001
Signify p > 0.05
Based on table 10 above, there is a relation between education, income and the student’s parent or guardians’ occupation with significant relation of being weak in disappointed easily, feel down to earth, noisy the pressure and explanation have to be repeated which the students have on level p< 0.05. For example, the connection of parents education factor concerning disappointed easily ( r = 0.12 ), down to earth ( r = 0.08 ). Noisy with pressure ( r = 0.06 ) and explanation to be repeated ( r = 0.04 ) on level p < 0.05.
The student’s factor that influences the dyslexia characteristic also shows a weak significant relation in table 11 The students factor is influenced by the dyslexia characteristics.
Table 11: Students factor that influence Dyslexia Characteristics
Significance p < 0.05From table 11 above, it can be seen that
student’s factor does not influence the look and the characteristics forget easily, not right in oral reading and inequality which is in the students.
This research shows that the outside influences and the factors in the student only give less effect to the students. The researcher found that the socio-economic status of the parents has less influence on their child’s dyslexia characteristics. The results obtained show that the parent’s occupation is one of the factors, which can influence ( R2 = .135 ). This means that the parents occupation contributes about 13.5% to the dyslexia problem.

261
Rosana Bin Awang Bolhasan - A Study of Dyslexia among Primary School Students in Sarawak, Malaysia
2009 A Study of Dyslexia among Primary School Students in Sarawak, Malaysia
Majority of the student’s parents work as labour. Because of that the parents have no time to pay attention to their children. The low education level, contributes 8.2% to the problem of not helping their children in reading. The income factor contributes 9.4%
( r 2 = 0.094 ) to this problem. With low income, the parents couldn’t manage to buy books for their children to read.
The researcher believes that the dyslexia is associated with the students age factor. Students in secondary school have no problem compared to those primary school students. This has been proved with the high percentage ( R 2 = .149 ) of influence on the student’s dyslexia. This means the dyslexia problem always happens in the early stage or in this context in first school level which is primary one, two, three and happens less in second stage which is primary four, five and six. This is because the first stage, the students understanding is less compared with the second stage where they learn a lot by revision studies process which are carried out by the school from time to time.
The meaning of comprehension is the student’s ability to understand something they read like theme, plot and teaching from academic books or story books. With less understanding, may be the reader gets less information. This results in the failure to collect information and to make use of the information when it is needed.
One more thing researcher believes that this dyslexia has connection with lack of interest in students in what they read. It is because of less concentration in their reading process or influence of other matters like thinking of playing, even negative influences from classmates. Like it was explained before, researcher also has an opinion that their interest in something that they read is important in dyslexia. The interest in a story book that is interesting, can bring back the curious feeling and high concentration to try and understand all the facts. This can improve their understanding in what they have read. This can be differentiated with the interest in academic books which may be less than the interest in story books. Here parents need to give motivation to their children to learn something that they are not interested in.
In the context of age and level, even though confirmed that the dyslexia characteristics bulge in the early stage of schooling which means age at a young, we get the different test result that is the class factor shows strong influence besides that the age factor is R2 = .049 or 4.9% only. This may be because of their mature age each student is different from the other. The age factor is not the main reason that contributes to dyslexia problem and it is believed that the dyslexia that the dyslexia problem will disappear when they grow older.
If the researcher touches on the status factor of the in the family and the number of siblings that is 2.5% and 2.4%. The researcher can view as that the factor of the number of the children in the family can influence dyslexia. This is because when the number of children is too high, the parent’s attention to the individual will be less.
t-Test
The t-test has been carried out to analysis whether there are any differences that are significant among the male students and female students in dyslexia problem.
Table 13: The Result of t-test for Gender Factor.
Item Gender N Min SP t-value Signifi-car
Forget Male 145 3.6 0.9Their 1.03 P = 0.01duty Female 106 3.4 1.0
Noisy Male 145 3.6 1.0
basis 1.14 P = 0.056
Pressure Female 106 3.4 1.1Lost Male 145 3.7 0.8
basic 0.39 P = 0.057
In test Female 106 3.6 1.0Weak Male 145 3.7 0.8
in 0.39 P = 0.023
Writing Female 106 3.6 0.8Slow to Male 145 3.8 0.8
Predict 0.68 P = 0.365
Female 106 3.6 1.0
Significant p = 0.05
By this t-test it can be found that there are 5 characteristics which show different significance among the male and female students. These
262
School of Doctoral Studies (European Union) Journal - July, 2009 No. 1
School of Doctoral Studies (European Union) Journal July
five characteristics are in between p = 0.008 to p = 0.057. Two characteristics which are very significant among the male and female students are slow in making prediction with the value of – t = 1.14 and p = 0.056. The significance is found in the forget easily characteristic with ( value – t = 1.03 p = 0.01 ) , lost basis in test 9 value – t = 0.39 p = 0.57 ) and weak in writing ( value – t = 0.39 p = 0.023 ).
The mean value also shows the student’s ratio of male and female who suffer from the dyslexia problem. All the mean ratio in these five characteristics show the male students mean ratio is higher than the female mean ratio. This mean that there are more male student facing the easily forget problem , noisy, and lost basis in test, weak in writing and slow in making prediction compared to the female students. This may be because of the male is not serious and slows and puts less concentration in doing thing.
From the analysis and test which nave been carried out, researcher can make an excuse by dividing the result into two parts that is socio-economic status of the parents of the students and the demographic factor itself.
The result of the analysis has proved that the socio-economic status factor which include education, occupation and the parent’s income influences the dyslexia characteristic. Parents, who have low education and low income can influence the students. The students should be given more encouragement in education and help them in their home work to solve the dyslexia problem.
About the student’s factor, researcher found out that there are two tests have come out with outstanding results of age factor, primary, number of siblings and status from the family also influence the students that suffer from dyslexia. This means from the primary one level until primary six, they will continue to show the same dyslexia characteristics. Besides that, the researcher found that the dyslexia characteristics are different in the male and female students in the easy forget, noisy with pressure, lost basis in test, weak in writing and slow in making prediction.
However, the incidence of dyslexia as reported varies a great deal from language to language.
There has been much speculation as to the reason for this variance. One assumption is that answer may lie in the inherent linguistic merits and scripts of the different languages. However, Macdonald Critchley et, al (1970:96) maintains that this is not credible and suggests the low incidence of dyslexia might be due to genetic reasons. At any rate, at the present time, this variance of dyslexia from language to language cannot be explained. What we do know is that dyslexia is likely to be found around the world (Janett W, Lerner, 1989:3)
There are sex differences in the incidence of dyslexia, just as there are in color blindness. The dyslexia child is referred to in most books as ‘he” for a good reason. While both boys and girls can have dyslexia, boys are far more likely to have it.
As with estimates on the incidence of dyslexia, so too, is there a lack of consensus on the ratio of dyslexia male to dyslexia females. The estimates vary from study to study: 2-to-1 (John Money, 1962:31), 3.5-to-1 or 4-to-1 (T.R.Miles and Elaine Miles, 1983:2), 4-to-1 (Critchley, OP, Cit:9), 5-to-1 (Sandhya Naidoo, 1972:25). The ratio of dyslexia males to dyslexia males to dyslexia females has been nearly 6-to-1 and the method of enrollment acceptance and pairing sex with like sex is likely to have contributed to this higher ratio.
The difference in the number of male dyslexia as compared to females is well founded and accepted. The reason has not yet been established, although there are numerous hypotheses: a greater occurrence of cerebral trauma in males, the hemispheric functioning of the sexes, a mutant at a single locus whose expression is modified by sex, or a polygenic expression that has a lower threshold for males than that for females.
Dyslexia has no favorites in regard to the wealthy or the poor, the cultured or the culturally disadvantaged. Any child from any background can have dyslexia but the socioeconomic backgrounds of dyslexia are varied.
Any child in the family can have dyslexia, whether he be the oldest, the youngest, or the in-between child. Research on birth order is sparse. In a study of five hundred dyslexia, 24.6 percent were the oldest in their families, while 36 percent were the youngest (Edith Klasen, 1950(60). There

263
Rosana Bin Awang Bolhasan - A Study of Dyslexia among Primary School Students in Sarawak, Malaysia
2009 A Study of Dyslexia among Primary School Students in Sarawak, Malaysia
In the aspect of correlation, students with dyslexia with educational and socio-economic factors, number in a family, class and gender had the correlated significance of r-0.4, P<0.05. That means those factors had the influence on dyslexia. It had been assessed from an aspect of regression, where by how much of the demographic influences were in involved in the whole situation. It is also found that demographic factor had contributed a little to the problem of dyslexia because it only reached to R2 = 0.135 i.e 13.5% of its contribution to the problem.
The validity according of this scenario cannot be argued upon for dyslexia does not take into consideration the background of the socio-economic background (Huston, 1987:9). According to him whoever they are and what background they have can be affected by dyslexia. In a family anyone can be affected whether they be old or young and the eldest or the youngest. Gender is of no exception. That had been stressed by him as “The dyslexia can come from any background, or any income level; and dyslexia may occur in any child in a family regardless of the order in which he or she is born.” (1987:10).
The above statement supported the findings which can associate a weak influence upon criteria that is shown by dyslexic pupils. It is not surprising that the demographic factor has another weak significance in both the genders. It is also a one way finding from the theory mentioned above.
From the discussion above it is clear enough that pupils with dyslexia have shown all the 32 criteria of dyslexia but 8 of the criteria have always shown. There has been weak connection and influence among the demographic factors with criteria which are exhibited by pupils od dyslexia (Huston: 1987).
This research has identified various finding and also elaboration on various questions which are relevant to the case. Therefore, the researcher wishes to put forward a few recommendations such as:
to propose a wide variety of samples to a. be used in the research. Experimental approach which uses the controlled group
is no difference in birth order in the incidence of dyslexia among brother and sisters were found in families with dyslexics.
DiscussionThrough observation on the aspect of writing,
students with dyslexia have great difficulties in writing. On the whole they are very poor in writing, having poor skill of spelling poor in oral and written vocabulary as well as poor in arranging content of compositions. The reliability of this observation had been proven by a few other researchers of the past. Henshelwood (1959) in Lerner (1985) quoted that the inability in reading of students with dyslexia is caused by the non-corresponding visualization of the right hemisphere with the collaboration area (angular gyrus) of the left hemisphere. The loss in this collaboration did not only cause gradual diminishing ability in reading but also the ability in writing as well as spelling (ographia). Orton (1980) had also agreed but with consideration of looking at the aspect of functional approach. According to him the relationship between the two hemispheres is very important concerning writing and reading skills.
Besides that students with dyslexia are usually poor in learning. They usually fall apart under time limits and pressure, often losing ground on achievement tests, having poor handwriting, inaccurate oral reading as well as having delay in verbal response.
With these criteria it had been proven from research made by Hinshelwood (1959) in Lerner (1985) with its structural and Orton (1980) with its functional. There had been other researchers such as Slobin (1991), Menyuk Wiig et. Al (1973) and Leong (1974). These researchers had stressed on the importance of the parts of the brain which are for remembering visually perceptions of letters and words. These researchers highlighted the
Important of a balance coordination between the hemispheres of brain which clearly demonstrated the weakness of the left hemisphere that caused alexia, graphia, aphasia, apraxia, slip of the tongues and poor listening skill.

264
School of Doctoral Studies (European Union) Journal - July, 2009 No. 1
School of Doctoral Studies (European Union) Journal July
helping dyslexics. Society recognizes the need to provide the dyslexic with opportunities for remediation opportunities to learn and to develop normally, and opportunities to become what he is capable of becoming.
The challenge of dyslexia must be met by all: all parents, schools, researchers, teachers-training institutions, the federal government, society as a whole – and the dyslexic himself. For it will take all of us working together to accomplish what must be accomplished – what can be done. We must make this challenge the focus of our efforts.
Acknowledgement
The author wishes to express his sincere appreciation to the following individuals on the involvement in preparation of this manuscript:
Director of Malaysia Education Planning and Research Section, and the State Education Director Of Sarawak, Malaysia for their sympathy and cooperation that made this manuscript a success. Director of Batu Lintang Teachers’ Training College, headmasters and teachers of the schools for being helpful and concern over the research made.
Reference
1. Abang Ahmad Ridzuan (1991), Factors Relating to Achievement of High School Students in Kuching City, Malaysia. Unpublished PhD. Thesis University of Hull, England.
2. Abdul Halim Yusuf (1995), “Sukatan Kurikulum Baru Sekolah Menengah”, Kuala Lumpur: Pusat Perancangan Kurikulum.
3. Amir Awang (1995), “Trenda Baru dalam Bidang Pendidikan Bahasa”, Kuala Lumpur. Utusan Publication and Distributor Sdn. Bhd.
should be used. In that case samples can be given continuous attention for a long period of time.Due to the in imbalance of the written and b. oral vocabulary it portrays the main criteria shown by the pupils. It is hoped that teaching can be more focused on interaction which is very open to teacher and pupils. That will encourage pupils to talk more openly. It also helps to built up their confidence in reading. However, writing can also be stressed in order to create a balanced skills in both oral and abnormally, it may be that sometime in the future CT scans will reveal will more specific finding in regard to dyslexia. (Martha B. Denckla: 1985)
The future is promising for the dyslexic, although progress toward fulfillment of the promise is slow. It will not be realized soon enough to help some already out there in the Dyslexia World of Frustration. But we are finding out more about the condition. We know that there is a genetic factor in the cause of dyslexia, and therefore we can be alert to the occurrence in some families and provide the immediate help as needed. We now know how to diagnose dyslexia accurately; the problem lies in disseminating and using this knowledge. Unfortunately, some people seem to be unwilling to give up pet theories or special tests that they have devised (which also bring a certain profit). We know that, because of maturational factors, an accurate diagnosis of dyslexia at the present time ordinarily cannot be made before a child has reached about the age of eight.
We know that dyslexia can be alleviated, and that the most appropriate time to begin remediation for a child is at about the age of eight. It is far easier to remediate the condition at this early age than at an older age, when certain behaviors and attitudes have been internalized. Of course the severity of the dyslexia condition will affect the success and length of remediation, (as will other factors).
More information is being distributed about dyslexia; and thus more people are aware of the condition and are becoming concerned about

265
Rosana Bin Awang Bolhasan - A Study of Dyslexia among Primary School Students in Sarawak, Malaysia
2009 A Study of Dyslexia among Primary School Students in Sarawak, Malaysia
4. Bertil Hallgren (1950) Specific Dyslexia (“Congenital Word-Blindness”); A Clinical and Genetic Study (Copenhagen : Ejnar Munksgaard, 1950); trans. By Erica Odelberg (Stockholm : Esselte Aktiebolag)
5. Bonds and Tinker. (1987), “Reading Difficulties.” The Diagnosis and Correction New York : Appleton-Century-Croft.
6. D.A. de Vaus (1991). Surveys In Social Research, London: Allen & Unwin.
7. Edith Klasen (19720) The syndrome of Specific Dyslexia (Baltimore: Unviersity Park.
8. Gajendra K. Verma and Kanka Mallick (1999) Researching Education, London: Falmer Press.
9. Hinshelwood J. (1959) Congenital Word-blindness. H.K. Lewis, London.
10. John Money (1962) “Dyslexia: A Post conference Review,” Reading Disability, Progress and Research Needs in Dyslexia, John Money, ed. (Baltimore: Johns Hopkins,
11. Kamarudin Hj. Husin, (1980). “Pedagogi Bahasa. Petaling Jaya : Longman Malaysia Sdn. Bhd.
12. Kathry B. Coon et al. (1994) Dyslexia Screening Instrument. United State of America: Harcourt Brace & Company.
13. Lerner, W. Janet (1985) Learning Disabilities. London: Open Book Publishing Ltd.
14. Macdonald Critchley (1970) The Dyslexia Child, Springfield, III: Charles C. Thomas.
15. Mohd. Fadzil Hj. Hassan. (1998). “Isu-Isu Perancangan Bahasa. Kuala Lumpur : Dewan Bahasa dan Pustaka.
16. Musa Jalili. (1989). “Falsafah Pendidikan negara” Kuala Lumpur : Pusat Perkembangan Kurikulum.
17. Sandhya Naidoo (1972). The Research Report of the ICAA Word Blind Centrenfor Dyslexia Children. New York : John Wiley.
18. Smith, D. Shelley (1986) Genetics and Correcting Reading Disabilities. London: Taylor and Francis.
19. Sofiah Hamid. (1991). “Pendidikan dalam Politik Di Malaysia. Kuala Lumpur : Dewan Bahasa dan Pustaka.
20. T.R. Miles and Elaine Miles (1983), Help for Dyslexia Children, London: Methuen.

266
School of Doctoral Studies (European Union) Journal - July, 2009 No. 1
School of Doctoral Studies (European Union) Journal July
Appendix 1
DYSLEXIA
SCREENING
INSTRUMENT
Kathryn B. Coon, Melissa M. Waguespack, Mary Jo PolkRespondent Name: ________________________________________________Date of Birth: ________________________________________________Age: ________________________________________________Gender: ________________________________________________Standard: ________________________________________________School: ________________________________________________--------------------------------------------------------------------------------------------------------Rater’s Name: ________________________________________________Rater’s Signature: ________________________________________________Date of Rating: ________________________________________________
RATER: To what extent does the students exhibit these characteristics?1 – never exhibits 2 – seldom exhibits 3 – sometimes exhibits 4–often exhibits5 – always exhibits (Please rate all statements)
__________ 1. Easily distracted__________ 2. Forgets assignment and/or loses papers__________ 3. Easily frustrated __________ 4. Low self-esteem__________ 5. Puts himself/herself down__________ 6. Falls apart under time limits and pressure__________ 7. Disorganized__________ 8. Knows material one day; doesn’t know it the next day__________ 9. Knows class material but tests poorly__________ 10. Oral reading inaccurate__________ 11. Reverses letters and/or numbers__________ 12. Losing ground on achievement tests__________ 13. Poor directionally (up/down, left/right, over/under)__________ 14. Poor sequencing skills__________ 15. Vocabulary of written composition in NOT equal to student’s spoken vocabulary__________ 16. Poor organization of composition (Events are not in chronological order or any discipline order organization__________ 17. Inadequate spelling for grade level__________ 18. Trouble following a series of directions__________ 19. Needs information repeated__________ 20. Poor handwriting__________ 21. Has trouble copying__________ 22. Unable to tell time, days of the week, months of the year__________ 23. Unable to tell time, days of the week, months of the year__________ 24. Cannot recall words, especially names__________ 25. Production of smudged papers (erasures, mark-over)__________ 26. Delay in verbal response__________ 27. Doesn’t anticipate consequence of behavior__________ 28. Misplaces and loses personal items__________ 29. Can’t stay on task__________ 30. Can’t repeat information__________ 31. Has trouble with the alphabet (learning and/or saying)__________ 32. Is very literal/concrete in thinkingRater’s Signiture _________________________________________________________
267
Rosana Bin Awang Bolhasan - A Study of Dyslexia among Primary School Students in Sarawak, Malaysia
2009 A Study of Dyslexia among Primary School Students in Sarawak, Malaysia
Appendix 2Frequence/Percentage of the Teachers/Students View about the Frequent and Every Time facing the Dyslexia Problem
ITEMTEACHER’S AND STUDENT’S VIEW
NEVER SELDOM SOMETIMES OFTEN ALWAYS
EXHIBITS EXHIBITS EXHIBITS EXHIBITS EXHIBITS
1. Easily distracted Teacher’s 18 (7.1%) 22 (8.7) 58 (23.0%) 120 (47.6%) 34 (13.5%)
Student’s 30 (11.9%) 17 (6.7) 49 (19.4%) 129 (51.2%) 27 (10.7%)
2. Forgets assignments and/ Teacher’s 2 (8.0%) 18 (7.1%) 54 (21.4%) 139 (55.2% 39 (15.5%)Or loses papers Student’s 9 (3.6%) 21 (8.3%) 72 (28.6%) 120 (47.6%) 30 (11.9%)
3. Easily frustrated Teacher’s 13 (5.2%) 35 (13.9%) 109 (43.3%) 78 (31.0%) 16 (6.3%)
Student’s 12 (4.8%) 20 (7.9%) 113 (44.8%) 89 (35.3%) 18 (7.1%)
4. Low self-esteem Teacher’s 7 (2.8%) 42 (16.7%) 98 (38.9%) 81 (32.1%) 24 (9.4%)
Student’s 17 (6.7%) 30 (11.9%) 104 (41.3%) 83 (32.9%) 18 (7.1%)
5. Puts himself/herself down Teacher’s 10 (4.0%) 38 (15.1%) 93 (36.9%) 92 (36.5%) 19 (7.5%)
Student’s 7 (2.8%) 25 (9.9%) 100 (39.7%) 102 (40.5%) 18 (7.1%)
6. Falls apart under time Teacher’s 4 (1.6%) 12 (4.8%) 76 (30.2%) 127 (50.4%) 33 (13.1%)Limits and pressure Student’s 13 (5.2%) 27 (10.7%) 62 (24.6%) 118 (46.8%) 32 (12.7%)
7. Disorganized Teacher’s 2 (0.8%) 16 (6.3%) 45 (17.9%) 148 (58.7%) 41 (16.3%)
Student’s 8 (3.2%) 17 (6.7%) 57 (22.6%) 141 (56.0%) 29 (11.5%)
8. Knows material one day: Teacher’s 3 (1.2%) 18 (7.1%) 40 (15.9%) 145 (57.5%) 46 (18.3%)doesn’t know it the next day Student’s 7 (2.8%) 21 (8.3%) 48 (19.0%) 144 (57.1%) 32 (12.7%)
9. Knows class material but Teacher’s 4 (1.6%) 18 (7.1%) 41 (16.3%) 142 (56.3%) 46 (18.3%)Tests poorly Student’s 7 (2.8%) 22 (8.7%) 46 (18.3%) 145 (57.5%) 32 (12.7%)
10. Oral reading inaccurate Teacher’s 8 (3.2%) 20 (7.9%) 41 (16.3%) 125 (49.6%) 58 (23.0%)
Student’s 10 (4.0%) 23 (9.1%) 51 (20.2%) 115 (45.6%) 52 (20.6%)
11. Reverses letters Teacher’s 14 (5.6%) 29 (11.5%) 85 (25.8%) 117 (46.4%) 27 (10.7%)
Student’s 22 (8.7%) 24 (9.5%) 79 (31.3%) 102 (40.5%) 25 (9.9%)
12. Losing ground on Teacher’s 6 (2.4%) 19 (7.5%) 41 (16.3%) 149 (59.11%) 37 (14.7%)achievement tests Student’s 5 (2.0%) 22 (8.7%) 65 (26.8%) 128 (50.8%) 32 (12.7%)
13. Poor directionally (up/down Teacher’s 22 (8.7%) 40 (15.9%) 78 (31.0%) 86 (34.1%) 25 (9.9%)Left/right, over/under) Student’s 23 (9.1%) 33 (13.1%) 86 (34.1%) 88 (34.9%) 22 (8.7%)
14. Poor sequencing skills Teacher’s 7 (2.8%) 20 (7.9%) 48 (19.0%) 128 (50.8%) 49 (19.4%)
Student’s 11 (4.4%) 25 (9.9%) 65 (25.8%) 122 (48.4%) 29 (11.5%)
15. Vocabulary of written Teacher’s 4 (1.6%) 11 (4.4%) 36 (14.3%) 156 (61.9%) 45 (17.9%)Composition is NOT equal Student’s 7 (2.8%) 20 (7.9%) 46 (18.3%) 146 (57.9%) 33 (13.1%)To student’s spoken
vocabulary
16. Poor organization of Teacher’s 3 (1.2%) 11 (4.4%) 38 (15.1%) 130 (51.6%) 70 (27.8%)Composition (Events are not Student’s 12 (4.8%) 10 (4.0%) 42 (16.7%) 149 (59.1%) 39 (15.5%)in chronological order
or any discipline order of
organization
17. Inadequate spelling for Teacher’s 7 (2.8%) 12 (4.8%) 43 (17.1%) 130 (51.6%) 60 (23.8%)grade level Student’s 9 (3.6%) 20 (7.9%) 65 (25.8%0 129 (51.2%) 29 (11.5%)

268
School of Doctoral Studies (European Union) Journal - July, 2009 No. 1
School of Doctoral Studies (European Union) Journal July
ITEMTEACHER’S AND STUDENT’S VIEW
NEVER SELDOM SOMETIMES OFTEN ALWAYS
EXHIBITS EXHIBITS EXHIBITS EXHIBITS EXHIBITS
18. Trouble following a series Teacher’s 6 (2.4%) 20 (7.9%) 55 (21.8%) 135 (53.6%) 36 (14.3%)of directions Student’s 4 (1.6%) 22 (8.7%) 80 (31.7%) 120 (47.6%) 26 (10.3%)
19. Needs information repeated Teacher’s 4 (1.6%) 18 (7.1%) 38 (15.1%) 136 (54.0%) 56 (22.2%)
Student’s 13 (5.2%) 13 (5.2%) 59 (23.4%) 130 (51.6%) 37 (22.2%)
20. Poor handwriting Teacher’s 5 (2.0%) 22 (8.7%) 53 (21.0%) 124 (49.2%) 48 (19.0%)
Student’s 8 (3.2%) 21 (8.3%) 71 (28.2%0 120 (47.2%) 32 (12.7%)
21. Has trouble copying Teacher’s 9 (3.6%) 24 (9.5%) 70 (27.8%) 113 (44.8%) 36(14.3%)
Student’s 9 (3.6%) 20 (7.9%) 94 (37.3%) 111 (44.0%) 18 (7.1%)
22. Unable to tell time, days of Teacher’s 18 (7.1%) 33 (13.1%) 54 (21.4%) 118 (46.8%) 29 (11.5%)the week, months of the year Student’s 14 (5.6%0 23 (9.1%) 65 (25.8%) 126 (50.0%) 24 (9.5%)
23. Unable to keep place on Teacher’s 15 (6.0%) 35 (13.9%) 62 (24.6%) 110 (43.7%) 30 (11.9%)page when reading Student’s 16 (6.3%) 28 (11.1%) 73 (29.0%) 116 (46.0%) 19 (7.5%)
24. Cannot recall word Teacher’s 8 (3.2%) 27 (10.7%) 65 (25.8%) 131 (52.0%) 21 (8.3%)Especially names Student’s 9 (3.6%) 28 (11.1%) 85 (33.7%) 114 (45.2%) 16 (6.3%)
25. Production of smudged Teacher’s 5 (2.0%) 33 (13.1%) 85 (33.7%) 108 (42.9%) 21 (8.3%)Paper (erasures, mark-over) Student’s 9 (3.6%) 21 (8.3%) 70 (27.8%) 124 (43.2%) 28 (11.1%)
26. Delay in verbal response Teacher’s 4 (1.6%) 15 (6.0%) 32 (12.7%) 157 (62.3%) 44 917.5%)
Student’s 10 (4.0%) 32 (12.7%) 45 (17.9%) 144 (57.1%) 21 (8.3%)
27. Doesn’t anticipate Teacher’s 1 (0.4%) 8 (3.2%) 42 (16.7%) 153 (60.7%) 48 (19.0%)Consequence of behavior Student’s 7 (2.0%) 16 (6.3%) 55 (21.8%) 145 (57.5%) 28 (11.1%)
28. Misplaces and loses Teacher’s 5 (2.0%) 45 (17.0%) 112 (44.4%) 66 (26.2%) 23 (9.1%)Personal items Student’s 14 (5.6%) 28 (11.1%) 114 (45.2%) 79 (31.3%) 17 (6.7%)
29. Can’t stay on task Teacher’s 5 (2.0%) 13 (5.2%) 55 (21.8%) 137 (54.4%) 42 (16.7%)
Student’s 5 (2.0%) 24 (9.5%) 60 (23.8%) 134 (56.7%) 20 (7.9%)
30. Can’t repeat information Teacher’s 4 (1.6%) 15 (6.0%) 47 (18.7%) 145 (57.5%) 41 (16.3%)
Student’s 9 (3.6%) 19 (7.5%) 55 (21.8%) 142 (56.3%) 27 (10.7%)
31. Has trouble with the alphabet Teacher’s 6 (2.4%) 13 (5.2%) 50 (19.8%) 136 (54.0%) 47 (18.7%)(learning and/or saying) Student’s 10 (4.0%) 23 (9.1%) 69 (27.4%) 129 (51.2%) 21 (8.3%)
32. Is very literal/concrete in Teacher’s 61 (24.2%) 57 (22.6%) 62 (24.6%) 54 (21.4%) 18 (7.1%)thinking Student’s 73 (29.0%) 32 (12.7%) 62 (24.6%) 62 (24.6%) 23 (9.1%)