
Energy use project and conversion efficiency analysis on biogas ...

A STUDY OF BIOGAS UTILIZATION EFFICIENCY HIGHLIGHTING
INTERNAL COMBUSTION ELECTRICAL GENERATOR UNITS
Undergraduate Honors Thesis
Presented in Partial Fulfillment of the Requirements for
Engineering Graduation with Distinction
Brian Herringshaw
College of Food, Agricultural, and Biological Engineering
The Ohio State University
2009
Thesis Committee:
Harold Keener, Phd.
Jay Martin, Phd.
1

Copyright by
Brian Herringshaw
2009
2
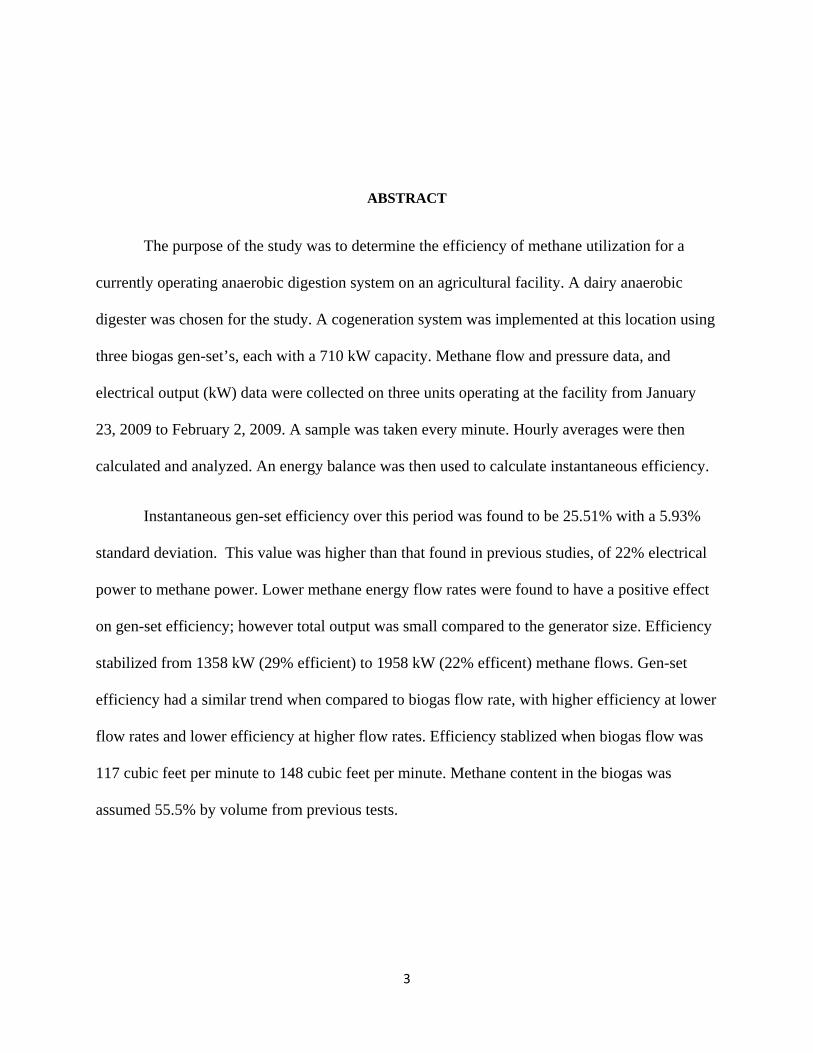
ABSTRACT
The purpose of the study was to determine the efficiency of methane utilization for a
currently operating anaerobic digestion system on an agricultural facility. A dairy anaerobic
digester was chosen for the study. A cogeneration system was implemented at this location using
three biogas gen-set’s, each with a 710 kW capacity. Methane flow and pressure data, and
electrical output (kW) data were collected on three units operating at the facility from January
23, 2009 to February 2, 2009. A sample was taken every minute. Hourly averages were then
calculated and analyzed. An energy balance was then used to calculate instantaneous efficiency.
Instantaneous gen-set efficiency over this period was found to be 25.51% with a 5.93%
standard deviation. This value was higher than that found in previous studies, of 22% electrical
power to methane power. Lower methane energy flow rates were found to have a positive effect
on gen-set efficiency; however total output was small compared to the generator size. Efficiency
stabilized from 1358 kW (29% efficient) to 1958 kW (22% efficent) methane flows. Gen-set
efficiency had a similar trend when compared to biogas flow rate, with higher efficiency at lower
flow rates and lower efficiency at higher flow rates. Efficiency stablized when biogas flow was
117 cubic feet per minute to 148 cubic feet per minute. Methane content in the biogas was
assumed 55.5% by volume from previous tests.
3

ACKOWLEDGMENTS
A special thanks is expressed to Dr. Harold Keener, my thesis advisor, and Dr. Michael
Lichtensteiger, academic honors advisor, for all of the guidance and encouragement they have given me
throughout this project. I also would like to thank Marcus Martin, of Martin Machinery for help in
gathering data for this project.
I would like to thank my sister Sarah, for her help throughout the project. And also many thanks
to my mother and father for their continued encouragement and support.
4

VITA
Brian Herringshaw
Bowling Green, OH 43402
The Ohio State University
Undergraduate, College of Food, Ag, and Biological Engineering Sept. 2005-Current
FIELDS OF STUDY
Major Field: Agricultural Engineering, Mechanical Systems
5
TABLE OF CONTENTS
Page
INTRODUCTION. ……………………………………………………………………. 1
Reason for the study…………………………………………………….…………1
Purpose of the study…………………………………………………….…………1
LITERATURE REVIEW……………………………………………………… .………1
History…………………………………………………………………….….……1
Anaerobic Digestion……………………………………………………...….…….1
Digester Operating Temperature…………………………………………………..4
Biogas Problems………………………………………………………….. ……….7
Flaring……………………………………………………………………. ……….8
Heating…………………………………………………………………………….9
Internal Combustion Engine Biogas Use………………………………… ………10
Gen-Set……………………………………………………………………………13
METHODS AND MATERIALS…………………………………………………….…14
Study location……………………………………………………………………..14
Data analysis………………………………………………………………………14
RESULTS AND DISCUSSION………………………………………………………..16
Results and Discussion…………………………………………………………….16
CONCLUSIONS………………………………………………………………. ………19
REFERENCES………………………………………………………………………….21
6

7
LIST OF TABLES
Table 1: Methane Content of Biogas by Source………………………………….6
Table 2a: Critical Point of Various Gases………………………………………...7
Table 2b: Energy Content of Various Gases……………………………………...7
Table 3: Flame Velocity of Various Gases……………………………………….10
Table 4: Comparison of Spark Ignition
and Compression Ignition Systems…………………………………11
Table 5: Results from Jan 23, 2009 to February 2, 2009…………………………17
LIST OF FIGURES
Figure 1: Anaerboic Molecuar Process……………………………………………3
Figure 2: Anaerobic Digestion Stages……………………………………………. 3
Figure 3: Methane Production of Bacteria in the Mesophillic
and Thermophillic Ranges…………………………………………...5
Figure 4: Biogas Carburetor Schematic…………………………………………. 12
Figure 5: Energy Flow Chart of a Gen-Set Cogeneration System………………..14
Figure 6: Riverview Farms Digester System Layout……………………………..15
Figure 5: Instantaneous Gen-Set Efficeny vs. Instantaneous
Methane Energy Rate……………………………………………….18
Figure 6: Instantaneous Gen-Set Efficiency vs. Instantaneous
Volumetric Biogas Flow Rate………………………………………19
INTRODUCTION As animal agricultural operations become increasingly consolidated, waste management
becomes a greater issue. One strategy to reduce, disinfect, and better utilize animal waste is to run
it through an anaerobic digester and from it harvest biogas, containing mostly methane. The
biogas collected is flammable and this provides several options for utilization. Some common
uses include flaring, heating (home, water, etc) and internal combustion (creating rotational
power). In many cases, internal combustion engines are attached to electrical generators which
produce electricity for on farm use or sale to an electric company.
In light of economic return on the installment and operation of anaerobic digesters,
efficiency is a major aspect. Additionally, increased energy demand worldwide and rural
development stress greater efficiency. Therefore, efficient biogas utilization is key to an
anaerobic digester’s economic return and practicality. The question is what efficiency does biogas
utilization systems actually attain? The purpose of this study was to determine the efficiency
of methane utilization for a currently operating anaerobic digestion system on an
agricultural facility.
LITERATURE REVIEW
The discovery of biogas can be first traced back to the 17th century when Van
Helmot noticed flickering lights beneath the surface of swamps and connected it to a
flammable gas produced by decaying organic matter. In the scientific world, Volta noted
as early as 1776 that biogas production is a function of the amount of decaying plant
material and that the biogas is flammable under certain conditions (Marchaim, 1992).
The chemical composition of methane was established by Henry and Davy Dalton
in 1810 via methane from coal mines. This was soon linked to the biogas involved in
1

Volta’s scientific discussion. By 1884, a student of Pasteur in France, Gayon, had
anaerobically produced biogas by suspending cattle manure in a water solution at 35
Celsius. At that time he was able to obtain 100 liters of biogas per meter cubed of
manure (Marchaim, 1992).
Anaerobic digestion has been studied thoroughly. The discovery and separation of
certain kinds of bacteria involved in the digestion process were begun as early as 1906 by
Sohngen. By the 1920’s Buswell was able to track and record the movement and uses of
nutrients such as nitrogen through the digestion process. Barker in the mid 20th century
was able to isolate and perform biochemical studies on a large number of the bacteria
involved in anaerobic digestion.
Today there is a desire for development of large scale bio digesters in numerous
applications. Four main reasons why bio digestion is being pursued currently are
(Marchaim, 1992):
1. Improvement of sanitation for treatment of high organic solid, high nutrient,
and high biological wastes and waste waters
2. Reduction in unpleasant aroma associated with animal waste
3. Production of energy
4. Production of high quality fertilizers
Anaerobic digestion is the degradation of organic materials by micro organisms
able to utilize molecules other than oxygen as hydrogen acceptors. More simplistically,
the bacteria must be in an environment without oxygen (Price & Cheremisinoff, 1981).
The process of anaerobic digestion on a molecular level involves many different kinds of
2

bacteria. The process in general however can be summed up in Figure 1 below (Price &
Cheremisinoff, 1981).
Figure 1: Anaerboic Molecuar Process (Price & Cheremisinoff, 1981)
The complex organics on the left of Figure 2 are organic wastes introduced as the
feedstock of the digester, such as dairy cattle manure. In the hydrolysis and fermentation
stage, bacteria break down the long chain organics into higher organic acids, hydrogen,
and acetic acid. In stage 2, the higher organic acids are further broken down into
hydrogen and acetic acid. In the final stage, methanogensis, bacteria utilize the hydrogen
and acetic acid to form methane, CH4. The bacteria involved in the digestion process
have many constraints for effective operation including temperature, pH and acidity,
moisture, and substrate nutrients. (Price & Cheremisinoff, 1981).
Figure 2: Anaerobic Digestion Stages (Marchaim, 1992)
3

Though there are many factors that affect the rate of biogas production in
anaerobic digesters, one of the most influential is operating temperature. Digestion can
occur in a temperature range from 4 to 60 degrees Celsius. However, certain temperature
ranges provide specific advantages. There are two temperature ranges that provide the
best advantages in anaerobic digestion: mesophilic and thermophilic (Constant &
Naveau, 1989). The mesophilic range (30-40 degrees Celsius) is known for providing a
more stable gas production, as the micro organisms that thrive in that range are less upset
by temperature fluctuations, which is a constant issue in digesters management (Constant
& Naveau, 1989). Also, the mesophilic range is fairly close to room temperature, which
leads to less energy input for temperature stability in the digester feedstock. The
thermophilic temperature ranges (45-55 degrees Celsius) has several advantages over
mesophilic, including shorter solid retention time, increased digestion efficiency, better
sludge dewatering characteristics, and increased destruction of pathogenic organisms
(Constant & Naveau, 1989). To make digesters economical to install and operate, fast
digestion times and easy waste processing characteristics make thermophilic operation
desirable. The most encouraging advantage to thermophilic operation is that the gas
production rate is twice that of mesophilic operation, which leads to lower digester
volumes, and consequently lower initial cost (Price & Cheremisinoff, 1981). There are
several disadvantages to thermophilic operation. The first is that maintaining a constant
temperature well above room temperature is more difficult and requires greater
management and energy inputs. Secondly, methanogenic bacteria that thrive in the
thermophilic region tend to be easily upset by temperature fluctuation (Price &
Cheremisinoff, 1981). In fact, one study from Marchaim shows that the acceptable
4
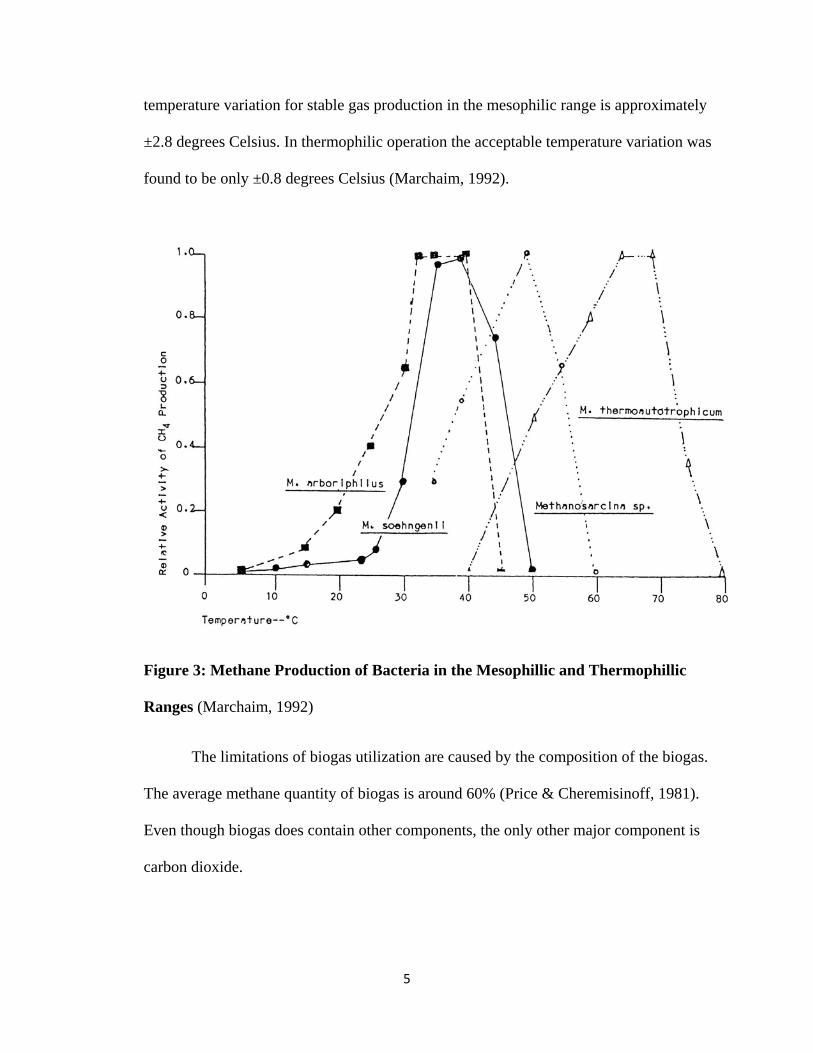
temperature variation for stable gas production in the mesophilic range is approximately
±2.8 degrees Celsius. In thermophilic operation the acceptable temperature variation was
found to be only ±0.8 degrees Celsius (Marchaim, 1992).
Figure 3: Methane Production of Bacteria in the Mesophillic and Thermophillic
Ranges (Marchaim, 1992)
The limitations of biogas utilization are caused by the composition of the biogas.
The average methane quantity of biogas is around 60% (Price & Cheremisinoff, 1981).
Even though biogas does contain other components, the only other major component is
carbon dioxide.
5

Table 1: Methane Content of Biogas by Source (Constant & Naveau, 1989)
Methane is the useful component of the biogas as it can be used as a fuel. Despite its high level
of methane, biogas does have some inherent problems. First, the critical point of biogas is very
low. The critical point of a gaseous substance is the thermodynamic state at which the liquid and
gas phases of a substance coexist in equilibrium (Price & Cheremisinoff, 1981). For example,
propane has an ideal critical point that allows for storage in the liquid phase, creating smaller
storage containers and easier gas handling. The critical point of methane is -82.5 degrees Celsius
and 46.7 bar. This means that biogas cannot be liquefied at a temperature above -82.5 degrees
Celsius, which is a major limitation in biogas utilization (Constant & Naveau, 1989).
6

Table 2a: Critical Point of Various Gases (Constant & Naveau, 1989)
H2 N2 NH3 O2 CH4 CO2 H2S C3H8 C4H10
Temperature -239.9 -147.1 132.4 -118.57 -82.5 31 100.4 96.6 152
(C°)
Pressure 13.1 34.2 113.9 50.8 46.7 73.85 90.1 42.5 37.9
(bar)
(According to Weast and Astle, 1980)
Table 2b: Energy Content of Various Gases (Constant & Naveau, 1989)
Combustible MJ kg-1 MJ m-3
Methane 50.0 35.9
Purified biogas (90%) 45.0 32.3
Mean biogas (60%) 30.0 21.5
Butane 45.7 118.5
Propane 46.4 90.9
Methanol 19.9 15.9 103
Ethanol 26.9 21.4 103
Gasoline 45.0 33.3 103
Diesel 42.1 34.5 103
*At 1 atm and 0°C
Another problem with biogas is that it contains three undesirable components – carbon
dioxide, water, and hydrogen sulfide. The problem with the high amounts of carbon dioxide is
7
dilution of methane. If the biogas is to be stored, a large amount of space would be wasted on
storing carbon dioxide. Similarly, if it was to be piped to another location, energy would be
wasted in pumping the carbon dioxide. In some cases, compression of carbon dioxide can lead to
the creation of carbonic acid which can deteriorate metering mechanisms and storage
components (Wise, 1983). Biogas also contains water, which has several detrimental effects.
First, the water tends to condense in a compressed state, therefore taking up space in the storage
containers. Most importantly, the water reacts with the hydrogen sulfide in the biogas, and
creates a very corrosive acid. When burned, the chemical reaction leads to the creation of sulfur
dioxide, which is also very corrosive and can lead to acid rain (Wise, 1983).
In some cases, purification of the biogas is not required, depending on its composition,
level of hydrogen sulfide, and utilization. However, for use in direct home heating,
transportation, and internal combustion engines, purification may be required (Hobson,
Bouslield, & Simmers, 1981). The use of scrubbers in a digestion system should only be used
when necessary as they add cost, management, and complexity to the system.
Methane utilization is an important piece of a bio digesters economic viability. Not only
must the system be efficient in time, cost, and management, it must be able to withstand the
problems that occur with biogas production. Biogas tends to be a non-constant flow, especially
on a small scale, resulting in the system requiring storage devices, and flow and pressure
regulators. Essentially there are two basic ways to utilize biogas methane – (1) open flame heat
and (2) internal combustion.
For open flame heat there are several easy applications. One option that has been
exercised is flaring. Flaring simply is burning the biogas into the atmosphere without any
8

intention for heat generation. Even though this seems counter intuitive, it does have some
benefits. First, flaring safely disposes of methane preventing any unsafe situation, as methane is
a deadly odorless gas. Also, by burning methane, CO2 and water are created. The current
potential global warming situation has led to support for burning methane as it is about 21 times
more powerful as a green house gas than CO2, by weight (EPA, 2006). In the United States, a
system of carbon credits is being created, that could also create cash flow for just flaring due to
the environmental implications stated above (EPA, 2006).
Another application of open flame methane utilization is heating. In many cases, a dairy
or animal operation can heat parlors, nurseries, and offices with methane. Due to the potential of
high carbon dioxide and hydrogen sulfide levels, the gas should not be directly burned in a
closed area (Hobson, Bouslield, & Simmers, 1981). With the heating costs of many colder
climate operations, the bio digester could have a decent return on investment. However, when
biogas production is large or in the summer time, not all of the biogas can be used. Therefore
another use for the biogas must be implemented. Another problem with using biogas for heat is
that in many heat exchanger and gas monitoring systems, vital components are susceptible to
corrosion by the hydrogen sulfide in the gas. This could increase maintenance cost, or cause
failure of the system (Price & Cheremisinoff, 1981).
Another potential problem of open flame burning is the flame velocity of methane. As
can be seen in the table below, many commonly used combustible gases burn significantly faster
than methane.
9
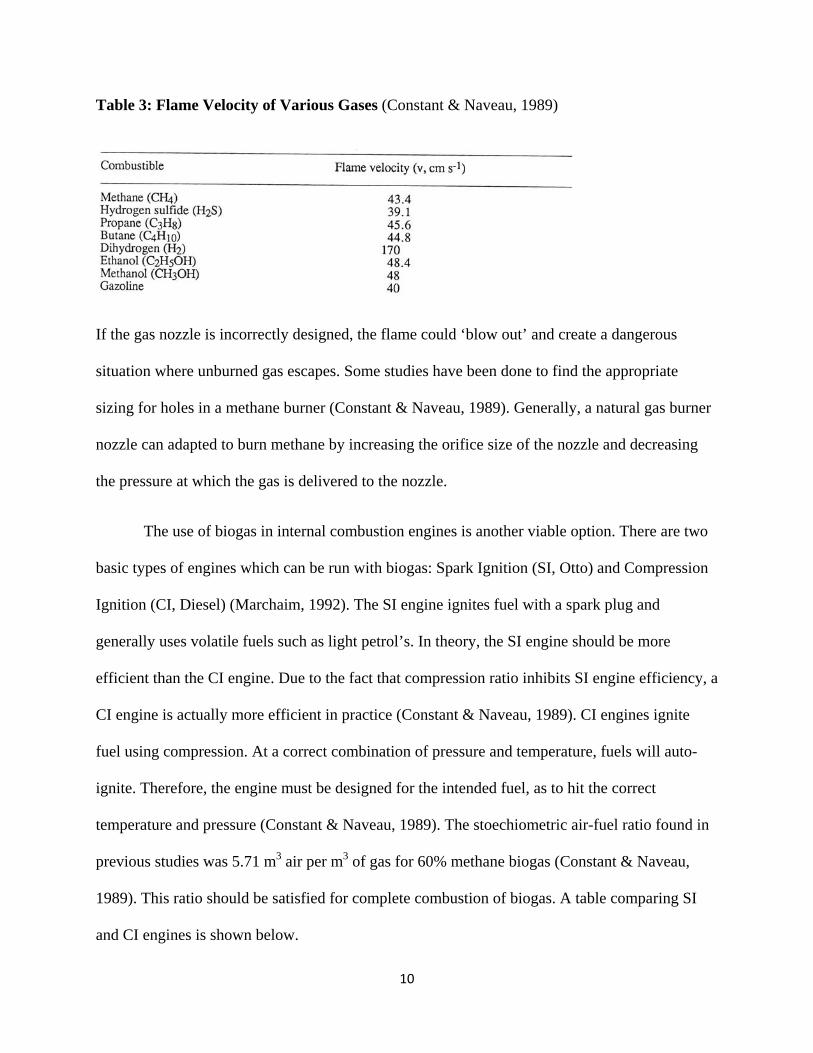
Table 3: Flame Velocity of Various Gases (Constant & Naveau, 1989)
If the gas nozzle is incorrectly designed, the flame could ‘blow out’ and create a dangerous
situation where unburned gas escapes. Some studies have been done to find the appropriate
sizing for holes in a methane burner (Constant & Naveau, 1989). Generally, a natural gas burner
nozzle can adapted to burn methane by increasing the orifice size of the nozzle and decreasing
the pressure at which the gas is delivered to the nozzle.
The use of biogas in internal combustion engines is another viable option. There are two
basic types of engines which can be run with biogas: Spark Ignition (SI, Otto) and Compression
Ignition (CI, Diesel) (Marchaim, 1992). The SI engine ignites fuel with a spark plug and
generally uses volatile fuels such as light petrol’s. In theory, the SI engine should be more
efficient than the CI engine. Due to the fact that compression ratio inhibits SI engine efficiency, a
CI engine is actually more efficient in practice (Constant & Naveau, 1989). CI engines ignite
fuel using compression. At a correct combination of pressure and temperature, fuels will auto-
ignite. Therefore, the engine must be designed for the intended fuel, as to hit the correct
temperature and pressure (Constant & Naveau, 1989). The stoechiometric air-fuel ratio found in
previous studies was 5.71 m3 air per m3 of gas for 60% methane biogas (Constant & Naveau,
1989). This ratio should be satisfied for complete combustion of biogas. A table comparing SI
and CI engines is shown below.
10
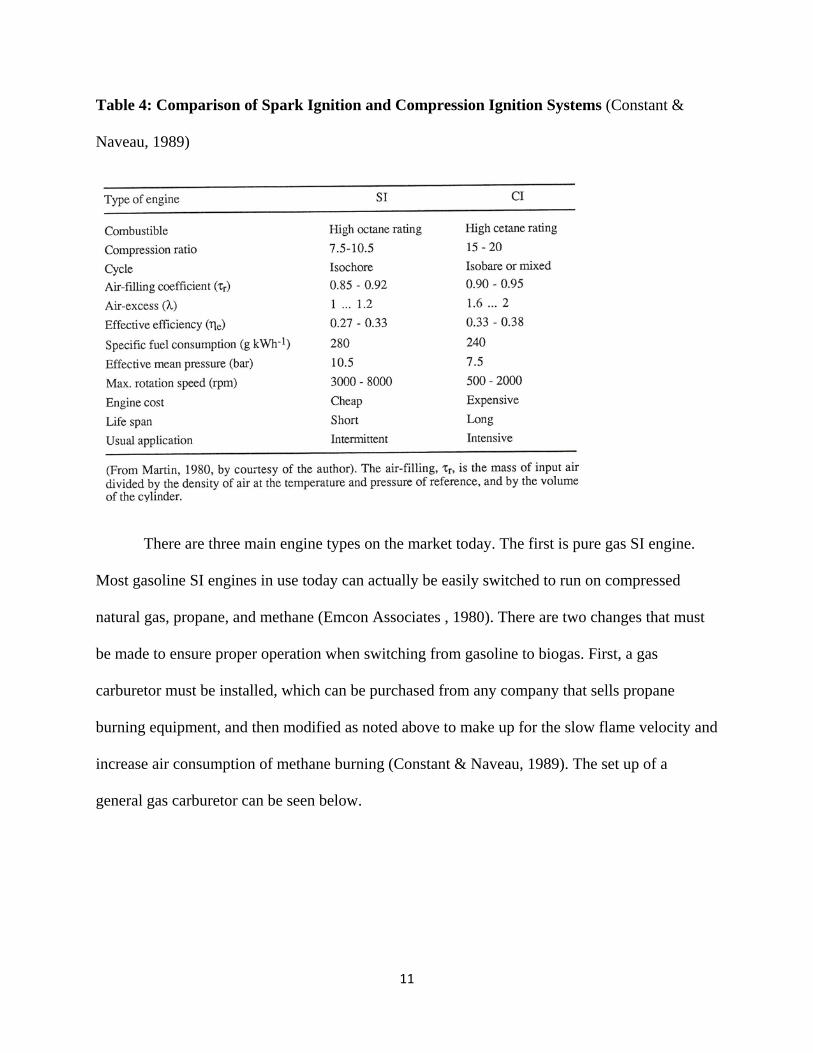
Table 4: Comparison of Spark Ignition and Compression Ignition Systems (Constant &
Naveau, 1989)
There are three main engine types on the market today. The first is pure gas SI engine.
Most gasoline SI engines in use today can actually be easily switched to run on compressed
natural gas, propane, and methane (Emcon Associates , 1980). There are two changes that must
be made to ensure proper operation when switching from gasoline to biogas. First, a gas
carburetor must be installed, which can be purchased from any company that sells propane
burning equipment, and then modified as noted above to make up for the slow flame velocity and
increase air consumption of methane burning (Constant & Naveau, 1989). The set up of a
general gas carburetor can be seen below.
11

Figure 4: Biogas Carburetor Schematic (Constant & Naveau, 1989)
Secondly, spark plugs with high temperatures must be installed to counter the high combustion
temperature of methane (Constant & Naveau, 1989).
A second type of engine that can utilize biogas is the dual fuel modified CI engine. Due
to the slow flame velocity of methane, low speed CI engines are more conducive to bio gas
utilization (Constant & Naveau, 1989). These systems are designed to burn diesel fuel while
burning biogas. This gives flexibility as to the source of the fuel and increases the efficiency of
biogas burning. However, this system requires that diesel fuel to be added regularly which
increase maintenance.
The last type of engine that can be used with biogas is the pure gas modified compression
engine. A diesel engine is modified and runs only on biogas. The major modifications to the
diesel engine include: removal of the injectors, addition of spark plugs, addition of a gas
carburetor, and decreasing of the compression ratio (Constant & Naveau, 1989). Even though
this is the most complicated way to make a biogas engine, it is the most suitable for biogas. The
12
pure biogas system is more efficient due to its lower speed, higher compression ratio, and
sturdier design (Constant & Naveau, 1989).
In any case where constant mechanical power can be utilized, an internal combustion
could be a good option. In many cases, the engines are stationary and can run at a constant rate.
This situation is ideal, as a generator system can easily be attached. One major advantage of an
internal combustion-generator set (gen-set) is that it produces electricity at a constant level.
Electricity is more easily used for different functions on an animal operation and can be sold to
the local electric utility. There are some technical changes that must be made to the power grid,
depending on the situation, to accommodate electricity feeding back into the grid.
Figure 5 shows historical efficiency of gen-set systems. In this particular figure, it
represents a unit with co-generation, which implements heat exchangers to capture unused heat
from the gen-set. The usable current is about 22% of the energy input, and mechanical energy to
the generator about 25%. With cogeneration, 58% of the input energy is used for heating, which
increases the overall efficiency to 80% which is much more desirable than the 22% from
electricity alone. Cogeneration has been applied to many digesters already due to its significant
advantage in energy efficiency (Wise, 1983).
13

Figure 5: Energy Flow Chart of a Gen-Set Cogeneration System (Wise, 1983)
MATERIALS AND METHODS
The research involved data collection from a gen-set cogeneration unit at Riverview Farm
in Minnesota. The biogas was from an anaerobic digestor operating the facility using dairy
manure. The data was collected and received by a system already implemented by Martin
Machinery, of Missouri. Three gen-sets, each with a 710 kW capacity, were used at this location.
The following is a system snap shot, showing the digestor, three gen-sets, pressure regulators,
flow meters, and a flare. As can be seen in the figure below, there is also a heat recovery system
for each gen-set that utilizes excess or waste heat. Even though this information was of interest
14

to the study, no data could be collected as a volumetric flow meter was not installed on any of
the heat exchanger units. Installing one was not within the scope of this study.
Figure 6: Riverview Farms Digester System Layout
The original farm of interest was a dairy operation in northwest Ohio, called Bridgewater
Dairy. Even though the digester and biogas gen-sets were operational at this time, many
measurement devices were not in place. Without established measuring devices, complexity and
cost of the project increased dramatically. This made Bridgewater Dairy impractical as a source
of study, resulting in the change of operations.
15
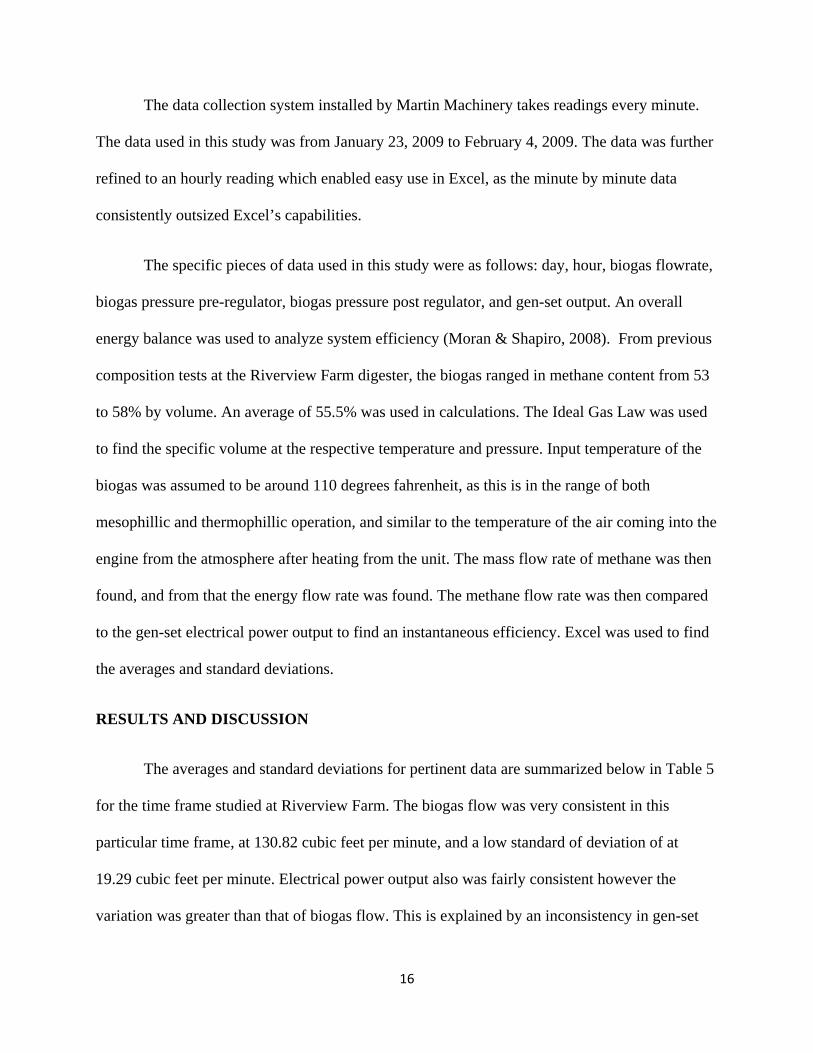
The data collection system installed by Martin Machinery takes readings every minute.
The data used in this study was from January 23, 2009 to February 4, 2009. The data was further
refined to an hourly reading which enabled easy use in Excel, as the minute by minute data
consistently outsized Excel’s capabilities.
The specific pieces of data used in this study were as follows: day, hour, biogas flowrate,
biogas pressure pre-regulator, biogas pressure post regulator, and gen-set output. An overall
energy balance was used to analyze system efficiency (Moran & Shapiro, 2008). From previous
composition tests at the Riverview Farm digester, the biogas ranged in methane content from 53
to 58% by volume. An average of 55.5% was used in calculations. The Ideal Gas Law was used
to find the specific volume at the respective temperature and pressure. Input temperature of the
biogas was assumed to be around 110 degrees fahrenheit, as this is in the range of both
mesophillic and thermophillic operation, and similar to the temperature of the air coming into the
engine from the atmosphere after heating from the unit. The mass flow rate of methane was then
found, and from that the energy flow rate was found. The methane flow rate was then compared
to the gen-set electrical power output to find an instantaneous efficiency. Excel was used to find
the averages and standard deviations.
RESULTS AND DISCUSSION
The averages and standard deviations for pertinent data are summarized below in Table 5
for the time frame studied at Riverview Farm. The biogas flow was very consistent in this
particular time frame, at 130.82 cubic feet per minute, and a low standard of deviation of at
19.29 cubic feet per minute. Electrical power output also was fairly consistent however the
variation was greater than that of biogas flow. This is explained by an inconsistency in gen-set
16
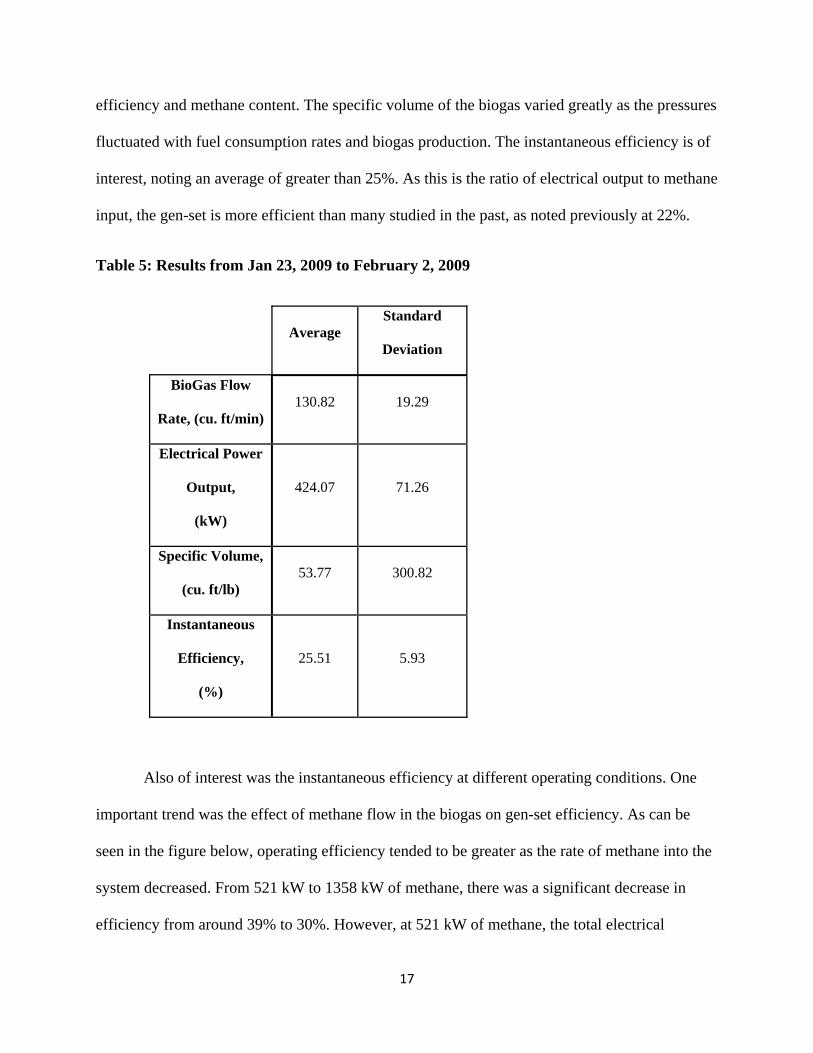
efficiency and methane content. The specific volume of the biogas varied greatly as the pressures
fluctuated with fuel consumption rates and biogas production. The instantaneous efficiency is of
interest, noting an average of greater than 25%. As this is the ratio of electrical output to methane
input, the gen-set is more efficient than many studied in the past, as noted previously at 22%.
Table 5: Results from Jan 23, 2009 to February 2, 2009
Average Standard
Deviation
BioGas Flow
Rate, (cu. ft/min) 130.82 19.29
Electrical Power
Output,
(kW)
424.07 71.26
Specific Volume,
(cu. ft/lb) 53.77 300.82
Instantaneous
Efficiency,
(%)
25.51 5.93
Also of interest was the instantaneous efficiency at different operating conditions. One
important trend was the effect of methane flow in the biogas on gen-set efficiency. As can be
seen in the figure below, operating efficiency tended to be greater as the rate of methane into the
system decreased. From 521 kW to 1358 kW of methane, there was a significant decrease in
efficiency from around 39% to 30%. However, at 521 kW of methane, the total electrical
17

production was 199 kW, well below the capacity of the gen-set, which makes operation at this
level impractical due to rate of return on investment. On the other end of the data, at 3030 kW of
methane, the electrical production was 501 kW, which is high, but inefficient at 16%. The
optimum range for this unit under its settings at the time of data collection was 1358 kW (29%
efficient) to 1958 kW (22% efficient). At lower methane flow rates, high gen-set efficiency can
most likely be attributed to a more complete combustion of the methane, due to potentially better
stoichiometric air to fuel ratios. Likewise, at a greater methane flow rate, less complete
combustion led to lower efficiency.
y = ‐2E‐11x5 + 3E‐08x4 ‐ 1E‐05x3 + 0.0023x2 ‐ 0.2375x + 38.075R² = 0.5294
0
10
20
30
40
50
60
70
521
1136
1278
1358
1440
1476
1525
1575
1612
1638
1676
1702
1769
1818
1897
1958
2069
2210
2427
3038
Instan
tane
ous Gen
Set E
fficiency, %
Instantaneous Methane Energy, kW
Instantaneous Gen‐Set Efficiency vs. Instantaneous Methane Energy Rate
Data
Poly. (Data)
Figure 7: Instantaneous Gen-Set Efficeny vs. Instantaneous Methane Energy Rate
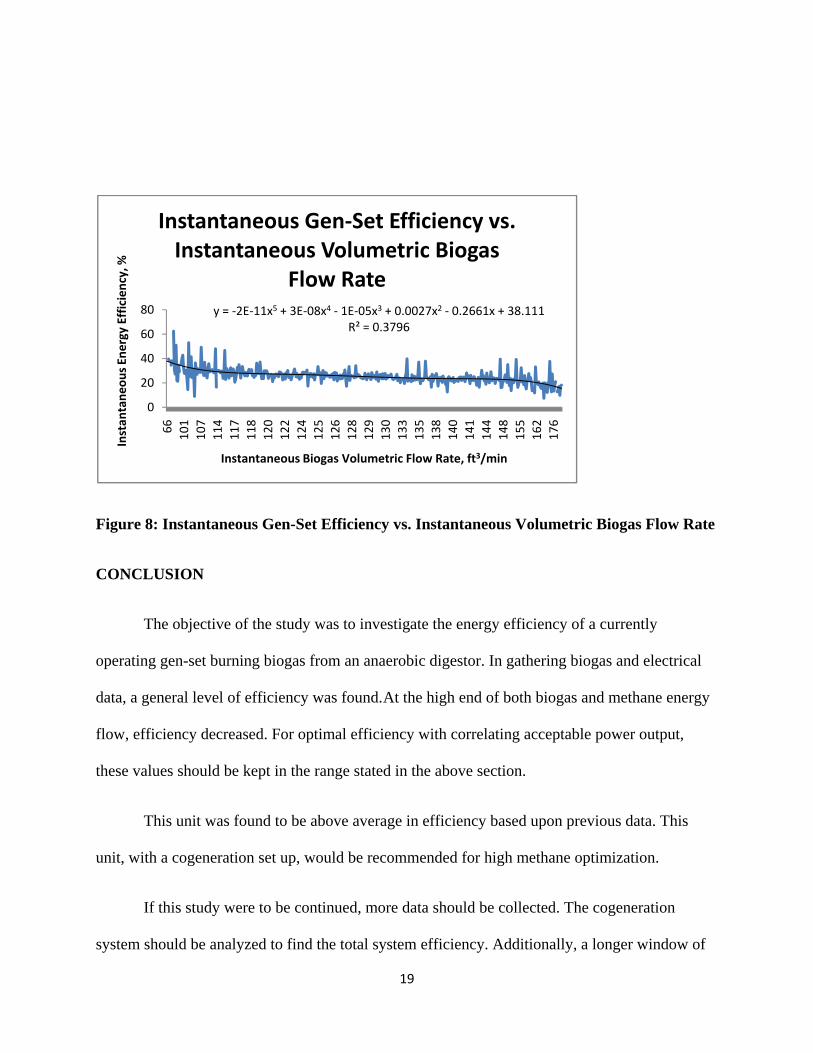
Gen-set efficiency trended similarly with different biogas flows. Even though methane
flow and biogas flow are linked, methane flow is also affected by pressure and methane content
in the biogas. As can be seen in the figure below, the optimum biogas flow rate for stable
electricity production is 117 cubic feet per minute to 148 cubic feet per minute. Even though
lower flow rates were more efficient, they did not produce adequate levels of electricity.
18
y = ‐2E‐11x5 + 3E‐08x4 ‐ 1E‐05x3 + 0.0027x2 ‐ 0.2661x + 38.111R² = 0.3796
0
20
40
60
80
66 101
107
114
117
118
120
122
124
125
126
128
129
130
133
135
138
140
141
144
148
155
162
176
Instan
tane
ous En
ergy Efficiency, %
Instantaneous Biogas Volumetric Flow Rate, ft3/min
Instantaneous Gen‐Set Efficiency vs. Instantaneous Volumetric Biogas
Flow Rate
Figure 8: Instantaneous Gen-Set Efficiency vs. Instantaneous Volumetric Biogas Flow Rate
CONCLUSION
The objective of the study was to investigate the energy efficiency of a currently
operating gen-set burning biogas from an anaerobic digestor. In gathering biogas and electrical
data, a general level of efficiency was found. At the high end of both biogas and methane energy
flow, efficiency decreased. For optimal efficiency with correlating acceptable power output,
these values should be kept in the range stated in the above section.
This unit was found to be above average in efficiency based upon previous data. This
unit, with a cogeneration set up, would be recommended for high methane optimization.
If this study were to be continued, more data should be collected. The cogeneration
system should be analyzed to find the total system efficiency. Additionally, a longer window of
19

data should be collected to discern seasonal and managerial effects on biogas output, providing
further insight into the versatility of the gen-set. Some conditions may arise during other parts of
the year or under different management practices that lead to reduced efficiency. If that were to
occur, a different gen-set may be suggested.
Data acquisition systems are also key to further study. When data is collected every
minute, half hour or hourly averages should be used to reduce the size and complexity of data
handling.
20

21
REFERENCES
Constant, M., & Naveau, H. ‐t. (1989). Biogas: End Use in the European Community. New York: Elsevier Science Publishing Co.
Emcon Associates ‐ td795.7E42. (1980). Methane Generation and Recovery from Landfills. Ann Arbor, MI: Ann Arbor Science Publishers.
Hobson, Bouslield, & Simmers‐tp762h62. (1981). Methane Production from Agricultural and Domestic Wastes. New York: Halsted Press, John & Wiley Sons, Inc.
Marchaim, U. (1992). Biogas Processes fopr Sustainable Development. Rome: FAO Ag Services Bulletin.
Moran, M., & Shapiro, H. (2008). Fundementals of Engineering Thermodynamics, 6th Edition. Hoboken, NJ: John Wiley & Sons, Inc.
Price, E., & Cheremisinoff, P.‐t. (1981). Biogas Production and Utilization. Ann Arbor: Ann Arbor Science Publishers.
Wise, D.‐t. (1983). Fuel Gas Systems. Boca Raton: CRC Press, Inc.