![programming by example · # lookup the AA for each codon in the DNA sequence for i in range(0, end, 3): codon = seq[i:i + 3] protein+= table[codon] ... • Single line translation](https://static.fdocuments.in/doc/165x107/61023b1c6ab2cd23ba167543/programming-by-example-lookup-the-aa-for-each-codon-in-the-dna-sequence-for-i.jpg)
A STUDY OF BACTERIAL TRANSLATION AT CODON RESOLUTION …
177
A STUDY OF BACTERIAL TRANSLATION AT CODON RESOLUTION USING RIBOSOME PROFILING By Fuad Mohammad A dissertation submitted to Johns Hopkins University in conformity with the requirements for the degree of Doctor of Philosophy Baltimore, Maryland December 2019 © 2019 Fuad Mohammad All rights reserved
Transcript of A STUDY OF BACTERIAL TRANSLATION AT CODON RESOLUTION …

A STUDY OF BACTERIAL TRANSLATION AT CODON
RESOLUTION USING RIBOSOME PROFILING
By
Fuad Mohammad
A dissertation submitted to Johns Hopkins University in conformity with the
requirements for the degree of Doctor of Philosophy
Baltimore, Maryland
December 2019
© 2019 Fuad Mohammad
All rights reserved

ii
Abstract
Ribosome profiling has pushed the boundary of how translation is studied by
illuminating every step of the translation cycle at the genome scale. First developed by
Nick Ingolia and Jonathan Weismann, ribosome profiling is now widely used in both
bacterial and eukaryotic studies. However, development of the method in bacteria has not
achieved the level of refinement seen in yeast and mammalian ribosome profiling. This
thesis focuses on analyzing the current methodology in bacteria to understand its
strengths and shortcomings and developing improvements in both how libraries are
prepared and how the data is analyzed. This thesis will also focus on implementing these
improvements to understand events that influence translation elongation as well as how
ribosome profiling can be used to identify new genes.
Rachel Green, Ph. D. (Sponsor and Reader)
Professor
Department of Molecular Biology and Genetics
Johns Hopkins University School of Medicine
Jeremy Nathans, Ph. D. (Reader)
Professor
Department of Molecular Biology and Genetics
Johns Hopkins University School of Medicine

iii
Acknowledgements
To Rachel, thank you for the opportunity to work in such an engaging and
rewarding environment. The cohesiveness and intellectual prowess of the lab is a
testament to your dedication to everyone around you, and I am humbled to be a part of
that group. Thank you for your support. To Allen, who was truly the best mentor. The
training and experiences I received under your guidance have been invaluable and I can
only hope some of your intellect and style has rubbed off onto me.
To the wonderful people in the lab who have made my graduate experience a
pleasure. To Kazuki and Chris for their engaging conversations and comradery within the
bacterial subgroup. To Boris, Jamie and Colin for help with ribosome profiling and data
analysis. To Julie, for all your help keeping the lab running smoothly and being patient
with all my silly questions. To Karole, Laura, Daniel and Anthony for their lively
conversation and endless appreciation of my baked goods. Everyone in the lab has truly
made my experience wonderful and contributed to making this thesis possible.
To my family and friends, whose support behind the scenes drove my passion for
science and provided avenues for the occasional break from graduate school. To my
parents Borhan and Fouzia who sacrificed so much and dedicated themselves to my
education and my happiness. To my wonderful and loving wife Catey, who has been my
support every single day and whose tenacity is my source of inspiration. And finally, to
my son Ruhan, born just as I was working on this thesis. Words cannot capture the love I
feel for you.

iv
Contents
Abstract .......................................................................................................................... ii
Acknowledgements ...................................................................................................... iii
Contents ........................................................................................................................ iv
List of Tables ............................................................................................................... vii
List of Figures ............................................................................................................. viii
Chapter 1: Introduction to translation and ribosome profiling ............................... 1
1.1 Translation in bacteria ................................................................................... 2
1.2 Regulation of translation elongation and ribosome pausing .......................... 4
1.3 A primer on ribosome profiling ..................................................................... 7
1.4 Translation measured by ribosome profiling ................................................. 8
1.5 Biases in Ribosome Profiling. ..................................................................... 11
1.6 References .................................................................................................... 13
Chapter 2: Clarifying the translational pausing landscape in bacteria by
ribosome profiling ....................................................................................................... 18
2.1 Abstract ........................................................................................................ 19
2.2 Background .................................................................................................. 19
2.3 Results: Two signals and two distinct phenomena ...................................... 21
2.4 Results: Apparent SD pauses arise from the preferential selection of long
mRNA fragments ......................................................................................... 24
2.5 Results: The ribosome protects RNA fragments that pair with the aSD ..... 25
v
2.6 Results: SD motifs make a minimal contribution to global translational
pausing ......................................................................................................... 27
2.7 Results: Pausing at SD motifs is not observed in vitro ................................ 30
2.8 Results: Gly codons appear to pause ribosomes when bound in the E site . 33
2.9 Discussion .................................................................................................... 36
2.10 Experimental Procedures ........................................................................... 40
2.11 References .................................................................................................. 42
2.12 Supplemental information.......................................................................... 45
Chapter 3: A systematically revised ribosome profiling method for bacteria
reveals pauses at single codon resolution .................................................................. 64
3.1 Abstract ........................................................................................................ 65
3.2 Background .................................................................................................. 65
3.3 Results: How to handle ribosomal footprints of various lengths ................. 68
3.4 Results: Inhibiting translation without inducing artifacts ............................ 80
3.5 Results: Preventing cellular stress during library preparation ..................... 94
3.6 Discussion .................................................................................................. 101
3.7 Materials and Methods............................................................................... 107
3.8 References .................................................................................................. 113
Chapter 4: Identifying small proteins by ribosome profiling with stalled
initiation complexes .................................................................................................. 119
4.1 Abstract ...................................................................................................... 120
4.2 Background ................................................................................................ 121

vi
4.3 Results: Onc112 traps ribosomes at start codons but does not interfere with
elongating ribosomes. ................................................................................ 125
4.4 Results: Ribosome profiling signals for Onc112 and retapamulin
are slightly different. .................................................................................. 126
4.5 Results: Onc112 and retapamulin can be used to identify putative
translated smORFs. .................................................................................... 128
4.6 Results: The majority of predicted small proteins are synthesized. .......... 133
4.7 Results: The levels of tagged small proteins span a wide range. ............... 135
4.8 Results: Some small proteins are encoded antisense to genes encoding
expressed proteins. ..................................................................................... 137
4.9 Results: YibX is translated as two isoforms. ............................................. 139
4.10 Results: Multiple smORFs are encoded by different, overlapping
frames......................................................................................................... 140
4.11 Results: smORFs overlap the 5´ ends of larger protein coding genes. .... 143
4.12 Results: Role of smORFs regulating expression of larger protein
encoded downstream................................................................................. 145
4.13 Discussion ................................................................................................ 146
4.14 Materials and Methods............................................................................. 151
4.15 Tables ....................................................................................................... 153
4.16 References ................................................................................................ 157
Cirriculum Vitae ....................................................................................................... 166
vii
List of Tables
2.S1 Linear fits for aSD affinity and ribosome density correlations…………………. 45
4.1 New small proteins detected ……………………………………………………. 154
4.S1 Ribosome profiling data for 80 previously identified small proteins
(16, 17, 68–86), excluding type I toxin-antitoxin small proteins. ……………. 154
4.S2 All predicted 160,995 candidate smORFs and their ribosome
density values………………………………………………………………….. 155
4.S3 171 top hits…………………………………………………………………….. 155
4.S4 Strains and primers used in this study………………………………………… 156

viii
List of Figures
2.1 High Ribosome Occupancy at Shine-Dalgarno Motifs Is Due to the
Isolation of Long mRNA Fragments………………………………………..….. 23
2.2 The Extent of SD Pausing Is Highly Variable in Different Ribosome
Profiling Data Sets……………………………………………………………… 27
2.3 Pauses at Shine-Dalgarno motifs are not detected in an in vitro translation
assay…………………………………………………………………………….. 31
2.4 Pauses at Gly codons………………………………………………....................... 37
2.S1 SD pauses as observed in center-assigned density, related to Figure 2.1……….. 47
2.S2 Quality control metrics for our libraries, related to Figure 2.1 and 2.2…………. 51
2.S3 Ser pauses do not explain the lack of SD pauses in our libraries,
related to Figure 2.1 and 2.2……………………………………………………. 54
2.S4 Gly and SD pauses on all ten G-rich codons, related to Figure 2.4…………….. 58
3.1 Comparison of ribosome profiling data from yeast and E.coli…………………… 71
3.2 Heat map of the distribution of read lengths in published E.coli
ribosome profiling libraries from several labs………………………………….. 78
3.3 Chloramphenicol (Cm) alters ribosome density at the gene and codon
level in published E.coli ribosome profiling libraries………………………….. 82
3.4 High salt buffers arrest translation after cell lysis better than Cm…………………88
3.5 Pausing is crystal clear in samples prepared with high salt buffers instead of Cm. 91

ix
3.6 Filtering cells leads to ribosome pausing at Ser codons due to reduced
levels of aminoacylated tRNASer……………………………………………….. 96
3.7 Samples harvested by direct freezing and lysed in high MgCl2 buffer
reveal subtle ribosome pauses that reflect known biology, pauses at
polyproline motifs and at rare codons…………………………………………... 98
3.S1 Preferential isolation of long RPFs increases ribosome density at
SD-like motifs within open reading frames…………………………………….. 72
3.S3 Treating cultures with Cm prior to harvesting skews estimates of
protein synthesis levels in different ways depending on the gene length………. 83
3.S5 Incorporating high salt lysis buffers into ribosome profiling…………………… 92
4.1 Onc112 and retapamulin similarly trap ribosomes at start codons……………… 127
4.2 Using ribosome profiling data to discover new smORFs……………………….. 129
4.3 Western analysis confirms synthesis of 95% of predicted small proteins………. 134
4.4 Observed small protein levels span several orders of magnitude……………….. 136
4.5 Novel smORFs (blue) are encoded antisense to known genes (gray)…………... 138
4.6 smORFs are found in complex gene arrangements……………………………... 142
4.7 smORFs regulate expression of downstream genes……………………………... 144
4.S1 Spearman rank correlation between the number of ribosome footprints
per gene for the untreated control samples……………………………………. 163
4.S2 Histogram of the predicted protein lengths for 68 candidate smORFs
listed in Table 4.S3…………………………………………………………….164
4.S3 Improved annotations of the start sites of three known smORFs as given
in Table 4.S1 compared to their current annotations in UniProt and EcoCyc… 165
1
Chapter 1
Introduction to translation and ribosome profiling
The translation of genetic information from mRNA into functional protein by the
ribosome is a fundamental process common to all living things. The regulation and
fidelity of translation is therefore critical in ensuring cell viability and has been the focus
of decades of research since the ribosome was first discovered in the mid-1950’s
(Robinson and Brown, 1953; Palade, 1955). Many of the mechanistic details of
translation have been elucidated using a combination of biochemistry and structural
biology. We now know that translation can be described by four distinct steps: initiation,
elongation, termination, and recycling. On top of this foundation lies layers of regulation
and quality control that continue to be parsed out to this day.
The emergence of next generation sequencing (NGS), has transformed how
translation is studied through the development of ribosome profiling, or ribo-seq (Ingolia
et al., 2009). This technique applies NGS to identify the location of ribosomes on
mRNAs transcriptome-wide, leading to unprecedented detail of each step of translation
on every mRNA within the cell. More importantly, by tracking ribosomes in vivo
ribosome profiling has provided a handle on studying translation in biological contexts
previously inaccessible through traditional techniques. This dissertation will focus on the
2
advancements made in our understanding of translation through ribosome profiling, with
a focus on using this method in bacteria.
1.1 Translation in bacteria
To appreciate the depth of information produced by ribosome profiling, it is helpful
to review the various steps of translation. With few exceptions, translation follows a
cycle of initiation, elongation, termination, and recycling. In bacteria, translation
initiation begins as the 30S small subunit of the ribosome identifies the start codon
(AUG, sometimes GUG) of an open reading frame (ORF) together with initiator fMet-
tRNA and initiation factors IF1, IF2, and IF3. Unlike eukaryotic mRNAs, which
generally contain only a single ORF, bacterial mRNAs often contain two or more genes
in an operon, meaning that initiation may occur anywhere along the length of a single
mRNA transcript. Various mRNA features help recruit 30S subunits to start codons to
promote initiation. One common feature used in most bacteria is the Shine-Dalgarno
(SD) motif with consensus sequence GGAGG 10-15 nt upstream of the start codon (Hui
and de Boer, 1987; Jacob et al. 1987; Shine and Dalgarno, 1974). The SD recruits the 30S
subunit through base pairing with a portion of the 16S ribosomal RNA designated as the
anti-Shine-Dalgarno sequence (ASD). Once the correct start codon is recognized, the 30S
rearranges to allow for the 50S large subunit to join, forming the 70S initiation complex,
and initiation factors dissociate.
During elongation, amino acids are incorporated into the nascent peptide as the
ribosome moves along the mRNA transcript. Ribosomes are fed amino acids through a
ternary complex composed of aminoacyl-tRNA, EF-Tu, and GTP, that bind the acceptor
site (A-site) of the ribosome. Faithful decoding of the mRNA is accomplished by base

3
pairing between three nucleotides (codon) of the mRNA in the A-site and the 3 nt anti-
codon of the tRNA. Proper base pairing at this step stimulates GTP hydrolysis by EF-Tu
and the release of the aminoacyl-tRNA into the A-site. The A-site aminoacyl-tRNA then
reacts with the peptidyl-tRNA in the peptidyl site (P-site), creating a peptide bond and
transferring the growing peptide to the A-site tRNA. Translocation of the A-site tRNA
into the P-site is catalyzed by EF-G, moving the mRNA in 3 nt steps so that a new codon
is presented in the A-site to be decoded by another round of elongation.
Elongation continues until the ribosome encounters one of three stop codons in its
A-site (UGA, UAA, and UAG) signaling the termination of translation. These codons are
read by one of two release factors, RF1 or RF2. Instead of transferring an amino acid to
the growing peptide, these release factors catalyze the hydrolysis of the final protein
product from the P-site tRNA. Following termination, RF3 removes the release factors
from the ribosome using energy from GTP hydrolysis, leaving an 70S ribosome attached
to the mRNA and deacylated P-site tRNA. The final step of the translation cycle,
recycling, involves the action of ribosome recycling factor (RRF) along with EF-G to
dissociate the large and small subunits from the mRNA so that they can be reused for
further translation.
Protein synthesis is achieved by the cycling of ribosomes through the phases of
translation but built on this are layers of regulation that interplay between other events in
the cell to determine which mRNAs will be translated and when. In eukaryotes, much of
the regulation occurs during initiation, which is considered the rate limiting step for
translation (Laursen et al., 2005; Shah et al., 2013). mRNAs that are not correctly
processed (lacking a 5’-cap or poly-A tail) do not support high levels of initiation, and
4
many signaling pathways inhibit initiation in response to cellular stress by
phosphorylating initiation factors or cap binding proteins (Roux et al., 2018). In bacteria,
translation occurs co-transcriptionally (Byrne, 1964; Miller 1970) and therefore excludes
translation regulation dependent on mRNA quality control. Examples of regulation at the
level of initiation are still observed, however, and many of these mechanisms involve the
occlusion of the ribosome binding site and Shine-Dalgarno sequence by mRNA
secondary structure or RNA binding proteins (Schlax and Worhunsky, 2003; Majdalani et
al., 2005).
1.2 Regulation of translation elongation and ribosome pausing
Bacterial elongation, when occurring at maximal efficiency, translates mRNA at a
rate of 15 - 20 amino acids per second. A gene of around 300 amino acids therefore takes
around 15 - 20 seconds to transverse by the ribosome, whereas initiation and termination
occur within a fraction of a second. As a result, most active ribosomes in the cell are in
the elongation phase; these constitute the majority of ribosome footprints obtained from a
ribosome profiling experiment and are targets of translation regulation. Outside of the
laboratory environment, translation elongation rates are rarely at maximal efficiency and
are highly tuned to the cellular environment. For example, suboptimal growing
conditions such as amino acid starvation can lead to decreased elongation rates. In some
instances, elongation can slow down or even stall due to mRNA sequence or protein
sequence. Understanding the mechanisms through which ribosomes elongate and stall
will help to understand how the cell regulates translating ribosomes in response to stress.
Generally, elongation rates reflect amino acid availability. In elongation, tRNA
accommodation into the A-site is rate-limiting and dependent on the availability of
5
aminoacyl-tRNA (Wohlgemuth et al., 2010; Varenne et al., 1984). In certain cases, cells
use this feature of elongation to regulate gene expression. The trp operon, for example,
uses elongation pausing when tryptophan levels are low to regulate the transcription of
genes synthesizing tryptophan. The operon contains a leader peptide sequence encoding
consecutive tryptophan codons. If the ribosome dwells on these codons for an extended
period, downstream mRNA hairpins form to prevent transcription termination (this
occurs in the first round of translation during transcription) (Turnbough, 2019). In
extreme cases, when ribosome dwell times due to starvation are sufficiently long,
uncharged tRNA and the protein factor RelA can bind to the A-site instead (Winther et
al., 2018; Wendrich et al., 2002). This leads to the generation of the alarmone (p)ppGpp
and the activation of the stringent response (Starosta et al., 2014; Goldman and
Jakubowski, 1990) which in turn downregulates transcription and a host of cellular
processes to adapt to starvation (Kanjee et al., 2012).
Even in optimal growing conditions tRNA abundance impacts the rate of
elongation. tRNAs that decode synonymous codons and have variable abundance in the
cell can cause differences in elongation rates depending on which codon is used. For this
reason, certain codons appear more frequently in the genome (Grantham 1980). Codon
usage in bacteria and other organisms generally reflect evolutionary pressure to utilize
codons with abundant cognate tRNA (Ikemura, 1981; Bennetzen and Hall, 1982). This
has led to an appreciation that certain genes, particularly those that are highly expressed,
are optimized to use optimized codons and avoid rare codons. Genes can therefore be
indexed based on codon adaptation (CAI) or tRNA adaptation (TAI) based on how
optimized they are (Sharp and Li ,1987; Reis et al., 2004). Codon adaptation has
6
implications for translation elongation speed. Genes with rare codons tend to translate at
slower efficiencies and result in reduced protein yield (Pedersen, 1984; Sorensen el al.,
1989). However, in certain specific cases, rare codons play a functional role in genes that
require slower elongation rates for either protein folding or to generally reduce protein
abundance (Chaney and Clark, 2015). In these cases, rare codons affect how proteins fold
by slowing down elongation between protein domains to promote proper folding (Kim et
al., 2015; Komar, 2009).
Another source of elongation pausing arises from interactions of the nascent peptide
with the ribosome. Due to the sterically constricted properties of proline, poly-proline
motifs regularly cause translation elongation pausing. This can be measured in vitro as
reduced peptide bond formation rates (Pavlov et al., 2009; Wohlgemuth et al., 2008). To
counteract this slow chemistry, a universally conserved elongation factor EF-P (eIF5a in
eukaryotes) specifically recognizes ribosomes translating poly-proline motifs and
enhances peptidyl-transfer rates (Doerfel et al., 2013; Gutierrez et al., 2013; Ude et al.,
2013). Post-translational modifications on EF-P reach into the peptidyl-transferase center
of the ribosome to force prolines to adopt the proper orientation for peptidyl-transfer
(Huter et al., 2017). Cells lacking EF-P therefore contain severe elongation stalls at these
poly-proline motifs, emphasizing the need for EF-P to maintain proper elongation at
these sites (Woolstenhulme et al., 2015).
Many ribosome pauses involving the nascent chain have regulatory roles. The RAGP
motif found in the C-terminus of SecM, for example, causes ribosome stalling through
steric clashes with the peptide exit tunnel of the ribosome (Zhang et al., 2015;
Nakatogawa and Ito, 2002). The strong ribosome stall induced by the SecM peptide
7
regulates the activity of the protein secretion pathway. Ribosome stalling on SecM
prevents the formation of an mRNA hairpin that blocks the ribosome binding site of the
downstream protein SecA, thereby upregulating SecA. In turn, SecA assists in
translocating proteins across the inner membrane, including SecM. The N-terminus of
SecM engages with secretory machinery, and the force of translocation by secretory
proteins relieves the stall. (Nakatogawa et al., 2004; Goldman et al., 2015). Other
functional pause events play similar roles in regulating gene expression. The TnaC
nascent chain is another example, where pausing is dependent on interactions between
the terminal three residues of TnaC and free cellular L-tryptophan. Pausing at tnaC
induces transcription attenuation of the tna operon on which it lies, preventing premature
transcription termination and expression of downstream genes tnaA and tnaB which
catabolize L-tryptophan.
1.3 A primer on ribosome profiling
The variety of circumstances a ribosome encounters when translating an mRNA is
as diverse as the number of mRNAs in the cell. In a rapidly dividing E. coli cell, about
7x10⁴ ribosomes cycle through the various phases of translation at one time (Bremer and
Dennis, 1996). Ribosome profiling, developed in 2009 (Ingolia et al., 2009), changed the
field by allowing detailed monitoring of every step in translation on every mRNA using
deep sequencing. The technique stems from an old observation that the ribosome can
protect a fragment of mRNA from nuclease digestion (Wolin and Walter, 1988; Steitz,
1969), creating a ribosome protected fragment (RPF). By deep sequencing RPFs, a
precise record of ribosome positions on every mRNA in the transcriptome can be
obtained. Furthermore, since every step of translation between the formation of the 70S
8
initiation complex to recycling is associated with mRNA, most of the translation cycle
can be captured using ribosome profiling.
The first application of ribosome profiling was in yeast (Ingolia et al., 2009). This
study detailed the general method to obtain RPFs that laid the foundation for ribosome
profiling in higher eukaryotes and in bacteria (Ingolia et al., 2011; Oh et al., 2011). It was
appreciated from the onset that nuclease resistant ribosome footprints represented
ribosome position at the time of digestion, and therefore only a proxy of ribosome
positions in vivo. To faithfully represent translation in vivo, cells were treated with
translation inhibitors (cycloheximide or CHX in eukaryotes and chloramphenicol or
CAM in bacteria) to preserve ribosomes in their natural position prior to cell lysis and
nuclease digestion. The nuclease of choice for eukaryotes was RNase I, which at low
concentrations effectively digests unprotected mRNA while leaving ribosomes and RPFs
intact. For bacteria, a different nuclease, Micrococcal Nuclease S7 (MNase) was used,
simply due to inhibition of RNase I by bacterial ribosomes (Oh et al., 2011). To ensure
that only ribosome protected mRNA fragments were sequenced, monosomes containing
RPFs were isolated from the digested lysates by sucrose gradient fractionation. The RPFs
are then purified by length, selecting for mRNAs that were thought to be the correct size
for a RPF (Ingolia et al., 2009; Oh et al., 2011). After cDNA synthesis from RPFs and
amplification following guidelines for Illumina sequencing, libraries containing RPFs can
be sequenced.
1.4 Translation measured by ribosome profiling
As a proxy for measuring translation in vivo, the data from initial studies using
ribosome profiling fell in line with what was known about translation. First, sequenced
9
RPFs generally fell between start and stop codons of well annotated genes; very few are
found in the 5’ and 3’ untranslated regions (UTRs). Second, a clear 3 nucleotide
periodicity can be observed within open reading frames. This reflected the 3 nt movement
of ribosomes when decoding mRNAs one codon at a time. Finally, RPFs can be
predictably altered using ribosome inhibitors. For example, harringtonine, which blocks
the first round of translation elongation, causes ribosomes to accumulate at the start
codon. In ribosome profiling data, this leads to a buildup of RPFs at the start codon and a
depletion downstream RPFs within the ORF (Ingolia et al., 2011). Similarly, treating
cells with 3-amino-1,2,4-triazole (3-AT) creates a shortage of histidyl-tRNA and leads to
higher ribosome density at histidine codons because ribosomes are paused during
decoding, as can be clearly observed through profiling (Lareau et al., 2014).
The observations above validated ribosome profiling as a method to study
translation in vivo with unprecedented detail. Since profiling captured regions of the
transcriptome that are translated, one of the first studies using ribosome profiling applied
it to identify new ORFs. Antibiotics such as harringtonine and tetracycline that inhibit
ribosomes on start codons assisted computational pipelines by clearly marking translation
initiation sites. (Meydan et al., 2019; Weaver et al., 2019; Nakahigashi et al., 2016;
Ingolia et al., 2011). These new ORFs not only represent new genes, but also regulatory
upstream ORFs (uORFs) and small ORFs (smORFs) that can modulate the translation of
adjacent ORFs. (Mankin et al., 2019; Weaver et al., 2019).
Alongside identifying ORFs, ribosome profiling provided an estimate of the relative
number or ribosomes translating an mRNA. With the assumption that every translating
ribosome synthesizes one protein, ribosome profiling in effect measures protein synthesis
10
levels. This assumption seems to hold true in bacteria because calculated synthesis rates
from profiling correlate well with proteomic measurements (Li et al., 2014). It was also
clear that genes within a single operon could have differences in their ribosome
occupancy, meaning that ribosome load was independent of mRNA abundance and that
some ORFs were translated better than others (Oh et al., 2011). Using total RNA
measurements from RNA sequencing (RNA-seq), translational efficiency (TE) can also
be calculated to describe how the number of peptides synthesized from a single transcript.
The translational efficiency of an ORF is dependent on a variety of factors including the
ribosome binding site, mRNA structure, and regulation by mRNA binding proteins.
Changes in TE can also be observed. For example, cold shock in E. coli causes selective
mRNA unfolding by cold shock proteins to increase translation efficiency of cold-
responsive genes (Zhang et al., 2018).
Using ribosome profiling, high resolution information from codon-level events
could be observed genome wide for the first time. Strong pausing events, such as
naturally occurring pauses in secM and tnaC simply stood out as increased ribosome
density on the pausing motif in those genes (Li et al., 2012; Woolstenhulme et al., 2015).
Others such as those on polyproline motifs can be induced through EF-P depletion. In
fact. pausing at polyprolines in cells lacking EF-P can cause ribosomes to collide and
alter the distribution of ribosomes on the message (Woolstenhulme 2015). Ribosomes
that collide with the paused ribosomes can cause a secondary pausing event observed as
increased ribosome density one footprint-length upstream of the polyproline motif and
pauses strong enough have multiple collision events. In most instances, ribosome density
downstream of the pause decreases, suggesting ribosomes that make it past the pause

11
continue to translate off the message (Woolstenhulme et al., 2015). Similar strong pause
events can be seen on specific amino acids after amino acid depletion or starvation
(Subramaniam et al., 2014). In most cases, inducing strong elongation pauses cause
reduction in growth and prolonged elongation pauses can cause physiological changes;
for example, in B. subtilis induced serine pauses have been shown to cause sporulation
(Subramaniam et al., 2013). In most bacteria, strong starvation induced elongation pauses
activate the stringent response to divert resources from cell growth to amino acid
synthesis. Ribosome profiling has enabled studies in these various conditions to probe
how the translational machinery contributes and adapts.
1.5 Biases in Ribosome Profiling.
The power of ribosome profiling came from the assumption that data collected
reflects translation in vivo and builds upon established principles of ribosome
biochemistry. However, newer studies began to question some of the assumptions made
in the first iteration of the method. First, the assumption that ribosome footprints were 28
nt in length was incomplete. In eukaryotes, the predominant footprint size is 28 nt, but a
secondary footprint size can also be observed 21 nt in length (Lareau et al., 2014). These
footprints were identified to represent a distinct conformation of the ribosome that lack
A-site tRNA during elongation and better represented ribosomes waiting for tRNA
accommodation (Wu et al., 2019). Studies that excluded these short footprints therefore
underrepresented the translating ribosome pool. In bacteria, the first ribosome profiling
studies assumed the same 28 nt footprint size as in yeast. However, the true footprint size
is closer to 24 nt in length and is much broader than the sharp 21 nt and 28 nt footprints
seen in yeast.
12
Another source of bias arose from the assumption that antibiotics properly froze
ribosomes in their biological context. Early studies in yeast relied on cycloheximide
(CHX) pre-treatment of cells to halt ribosomes prior to library preparation. Later studies,
however, revealed changes cycloheximide concentrations caused changes in ribosome
footprints due to slow uptake of the drug into cells (Ingolia et al., 2012; Gerashchenko
and Galdyshev, 2014). Using the first iteration of the method, inherent differences in
elongation rates that arise from codon adaptation and tRNA adaptation were not detected
(Hussmann et al., 2015; Weinberg et al., 2016). Alternative protocols that utilized rapid
filtering and freezing cells to trap translation in the absence of CHX showed improved
correlation of ribosome density with metrics such as codon adaptation in yeast
(Hussmann et al., 2015; Weinberg et al., 2016).
Identification of these biases in eukaryotic ribosome profiling has led to
improvements in data surpassing single nucleotide positional information: recent studies
have been able to determine ribosome conformations on individual codons during
elongation and termination (Wu et al., 2019). There are fewer studies in bacteria
investigating the biases in ribosome profiling, and the field has yet to come up with best
practices to ensure that ribosome profiling data properly represents biologically relevant
translation events. The focus of this thesis is to therefore investigate certain claims put
forth using ribosome profiling, and to improve the methodology to bring new clarity to
translation in bacteria.

13
1.6 References
Bennetzen JL, Hall BD. (1982). Codon selection in yeast. J. Biol. Chem. 257, 3026–
3031.
Bremer H, Dennis PP. (1996). Modulation of chemical composition and other parameters
of the cell by growth rate. In Escherichia coli and Salmonella: Cellular and Molecular
Biology, ed. FC Neidhardt, 1, 1553– 1569. Washington, DC: ASM Press
Byrne R, Levin JG, Bladen HA, and Nirenberg MW. (1964). The in vitro formation of a
DNA-ribosome complex. Proc. Natl. Acad. Sci. USA 52, 140–148.
Chaney JL, and Clark PL. (2015). Roles for synonymous codon usage in protein
biogenesis. Annu. Rev. Biophys. 44, 143–166.
Doerfel LK, Wohlgemuth I, Kothe C, Peske F, Urlaub H, Rodnina MV. (2013). EF-P is
essential for rapid synthesis of proteins containing consecutive proline residues. Science
339, 85–88
Gerashchenko MV, Gladyshev VN. (2014). Translation inhibitors cause abnormalities in
ribosome profiling experiments. Nucleic Acids Res. 42, e134
Goldman E, Jakubowski H. (1990). Uncharged tRNA, protein synthesis, and the bacterial
stringent response. Mol. Microbiol. 4, 2035–2040.
Goldman DH, Kaiser CM, Milin A, Righini M, Tinoco I Jr., Bustamante C. (2015).
Ribosome. Mechanical force releases nascent chain-mediated ribosome arrest in vitro and
in vivo. Science 348, 457–460.
Grantham R. (1980). Workings of the genetic code. Trends Biochem. Sci. 5, 327-331.
Gutierrez E, Shin BS, Woolstenhulme CJ, Kim JR, Saini P, et al. (2013). eIF5A promotes
translation of polyproline motifs. Mol. Cell 51, 35–45
Hui A, de Boer HA. (1987). Specialized ribosome system: preferential translation of a
single mRNA species by a subpopulation of mutated ribosomes in Escherichia coli.
PNAS 84, 4762-4766.
Hussmann JA, Patchett S, Johnson A, Sawyer S, Press WH. (2015). Understanding biases
in ribosome profiling experiments reveals signatures of translation dynamics in yeast.
PLOS Genet. 11, e1005732.
Huter P, Muller C, Beckert B, Arenz S, Berninghausen O, et al. (2017). Structural basis
for ArfA-RF2-mediated translation termination on mRNAs lacking stop codons. Nature
541, 546–49.
14
Ikemura T. (1981). Correlation between the abundance of Escherichia coli transfer RNAs
and the occurrence of the respective codons in its protein genes. Journal of Molecular
Biology 146, 1–21.
Ingolia NT, Ghaemmaghami S, Newman JR, and Weissman JS. (2009). Genome-wide
analysis in vivo of translation with nucleotide resolution using ribosome profiling.
Science 324, 218-223.
Ingolia NT, Lareau LF, Weissman JS. (2011). Ribosome profiling of mouse embryonic
stem cells reveals the complexity and dynamics of mammalian proteomes. Cell 147:789–
802.
Ingolia NT, Brar GA, Rouskin S, McGeachy AM, Weissman JS. (2012). The ribosome
profiling strategy for monitoring translation in vivo by deep sequencing of ribosome-
protected mRNA fragments. Nature Protoc. 7, 1534–1550.
Jacob WF, Santer M, Dahlberg AE. (1987). A single base change in the Shine-Dalgarno
region of 16S rRNA of Escherichia coli affects translation of many proteins. PNAS 84,
4757-4761.
Kanjee U, Ogata K, Houry WA. (2012). Direct binding targets of the stringent response
alarmone (p)ppGpp. Mol. Microbiol. 85, 1029–43
Kim SJ, Yoo JS, Shishido H, Yang Z, Rooney LA, Barral JM, Skach WR. (2015).
Translational tuning optimizes nascent protein folding in cells. Science 348, 444-448.
Komar AA. (2009). A pause for thought along the co-translational folding pathway.
Trends in Biochemical Sciences 34, 16–24.
Lareau LF, Hite DH, Hogan GJ, Brown PO. (2014). Distinct stages of the translation
elongation cycle revealed by sequencing ribosome-protected mRNA fragments. eLife 3,
e01257
Laursen BS, Sørensen HP, Mortensen KK, Sperling-Petersen HU. (2005). Initiation of
Protein Synthesis in Bacteria. Microbiol Mol Biol Rev. 69,101–123.
Li, G.W., Burkhardt, D., Gross, C., and Weissman, J.S. (2014). Quantifying absolute
protein synthesis rates reveals principles underlying allocation of cellular resources. Cell
157, 624-635.
Majdalani N, Vanderpool CK, Gottesman S. (2005). Bacterial small RNA regulators.
Crit. Rev. Biochem. Mol. Biol. 40, 93–113.
Meydan S, Marks J, Klepacki D, Sharma V, Baranov P, Firth A, Margus T, Kefi A,
Vázquez-Laslop N, Mankin AS. (2018). Retapamulin-assisted Ribo-seq revels the
alternative bacterial proteome. Mol Cell under review

15
Miller OL Jr., Hamkalo BA, and Thomas CA Jr. (1970). Visualization of bacterial genes
in action. Science 169, 392–395.
Nakahigashi K, Takai Y, Shiwa Y, Wada M, Honma M, Yoshikawa H, Tomita M, Kanai
A, Mori H. (2014). Effect of codon adaptation on codon-level and gene-level translation
efficiency in vivo. BMC Genomics 15, 1115.
Nakatogawa H, Ito K. (2002). The ribosomal exit tunnel functions as a discriminating
gate. Cell 108, 629–636.
Nakatogawa H, Murakami A, Ito K. (2004). Control of SecA and SecM translation by
protein secretion. Curr. Opin. Microbiol. 7, 145–150.
Oh E, Becker AH, Sandikci A, Huber D, Chaba R, Gloge F, Nichols RJ, Typas A, Gross
CA, Kramer G, Weissman JS, Bukau B. (2011). Selective ribosome profiling reveals the
cotranslational chaperone action of trigger factor in vivo. Cell 147, 1295–1308.
Palade GE. (1955). A small particulate component of the cytoplasm. J. Biophys.
Biochem. Cytol. 1, 59–68.
Pavlov MY, Watts RE, Tan Z, Cornish VW, Ehrenberg M, Forster AC. (2009). Slow
peptide bond formation by proline and other N-alkylamino acids in translation. PNAS
106, 50–54.
Pedersen S. (1984). Escherichia coli ribosomes translate in vivo with variable rate.
EMBO J. 3, 2895–2898.
dos Reis M, Savva R, Wernisch L. (2004). Solving the riddle of codon usage preferences:
a test for translational selection. Nucleic Acids Research 32, 5036–5044.
Robinson E, Brown R. (1953). Cytoplasmic particles in bean root cells. Nature 171, 313.
Roux PP, Topisirovic I. (2018). Signaling pathways involved in the regulation of mRNA
translation. Mol. Cell. Biol. 38.
Schlax PJ, Worhunsky DJ. (2003) Translational repression mechanisms in prokaryotes.
Mol. Microbiol. 48, 1157–1169.
Shah P, Ding Y, Niemczyk M, Kudla G, Plotkin JB. (2013). Rate-limiting steps in yeast
protein translation. Cell 153, 1589-601.
Sharp PM, Li WH. (1987). The codon Adaptation Index–a measure of directional
synonymous codon usage bias, and its potential applications. Nucleic Acids Research 15,
1281–1295.

16
Shine J, Dalgarno L. (1974). The 3′-terminal sequence of Escherichia coli 16S ribosomal
RNA: complementarity to nonsense triplets and ribosome binding sites. PNAS 71, 1342-
1346.
Sorensen MA, Kurland CG, and Pedersen S. (1989). Codon usage determines translation
rate in Escherichia. J. Mol. Biol. 207, 365–377.
Starosta AL, Lassak J, Jung K, Wilson DN. (2014). The bacterial translation stress
response. FEMS Microbiol. Rev. 38, 1172–201.
Steitz JA. (1969). Polypeptide chain initiation: nucleotide sequences of the three
ribosomal binding sites in bacteriophage R17 RNA. Nature 224, 957–964.
Subramaniam AR, Deloughery A, Bradshaw N, Chen Y, O’Shea E, Losick R, Chai Y.
(2013). A serine sensor for multicellularity in a bacterium. eLife 2, e01501.
Subramaniam AR, Zid BM, O’Shea EK. (2014). An integrated approach reveals
regulatory controls on bacterial translation elongation. Cell 159, 1200–1211.
Turnbough CL, Jr. (2019). Regulation of bacterial gene expression by transcription
attenuation. Microbiol Mol Biol Rev 83, e00019-19.
Ude S, Lassak J, Starosta AL, Kraxenberger T, Wilson DN, Jung K. (2013). Translation
elongation factor EF-P alleviates ribosome stalling at polyproline stretches. Science 339,
82–85.
Varenne S, Buc J, Llouber R, Lazdunski C. (1984). Translation is a non-uniform process:
effect of tRNA availability on the rate of elongation of nascent polypeptide chains. J.
Mol. Biol. 180, 549–576.
Weinberg DE, Shah P, Eichhorn SW, Hussmann JA, Plotkin JB, Bartel DP. (2016).
Improved ribosomefootprint and mRNA measurements provide insights into dynamics
and regulation of yeast translation. Cell Rep. 14:1787–99
Wendrich TM, Blaha G, Wilson DN, Marahiel MA, Nierhaus KH. (2002). Dissection of
the mechanism for the stringent factor RelA. Mol. Cell 10, 779-88.
Winther KS, Roghanian M, Gerdes K. (2018). Activation of the Stringent Response by
Loading of RelA-tRNA Complexes at the Ribosomal A-Site. Mol Cell 70, 95-105.
Wohlgemuth I, Brenner S, Beringer M, Rodnina MV. (2008). Modulation of the rate of
peptidyl transfer on the ribosome by the nature of substrates. Journal of Biological
Chemistry 283, 32229–32235.
Wohlgemuth I, Pohl C, Rodnina MV. (2010). Optimization of speed and accuracy of
decoding in translation. EMBO J. 29, 3701–3709.

17
Wolin SL, and Walter P. (1988). Ribosome pausing and stacking during translation of a
eukaryotic mRNA. EMBO J. 7, 3559–3569.
Woolstenhulme CJ, Guydosh NR, Green R, Buskirk AR. (2015). High-precision analysis
of translational pausing by ribosome profiling in bacteria lacking EFP. Cell Rep. 11, 13–
21.
Wu, CC-C, Zinshteyn B, Wehner KA, Green R. (2019). High-Resolution Ribosome
Profiling Defines Discrete Ribosome Elongation States and Translational Regulation
during Cellular Stress. Molecular Cell, 73, 959–970.
Zhang J, Pan X, Yan K, Sun S, Gao N, Sui SF. (2015). Mechanisms of ribosome stalling
by SecM at multiple elongation steps. eLife 4, e09684.
Zhang Y, Burkhardt DH, Rouskin S, Li GW, Weissman JS, Gross CA. (2018) A stress
response that monitors and regulates mRNA structure is central to cold shock adaptation.
Mol. Cell. 70, 274–286.

18
Chapter 2
Clarifying the translational pausing landscape in
bacteria by ribosome profiling
Fuad Mohammad1,3, Christopher J. Woolstenhulme1,3, Rachel Green1,2, Allen R. Buskirk1
1Department of Molecular Biology and Genetics and 2 Howard Hughes Medical Institute,
Johns Hopkins University School of Medicine, 725 N. Wolfe Street, Baltimore, MD,
21205, USA. 3Co-first author.
19
2.1 Abstract
The rate of protein synthesis varies according to the mRNA sequence in ways that
affect gene expression. Global analysis of translational pausing is now possible with
ribosome profiling. Here, we revisit an earlier report that Shine-Dalgarno sequences are
the major determinant of translational pausing in bacteria. Using refinements in the
profiling method as well as biochemical assays, we find that SD motifs have little (if any)
effect on elongation rates. We argue that earlier evidence of pausing arose from two
factors. First, in previous analyses, pauses at Gly codons were difficult to distinguish
from pauses at SD motifs. Second, and more importantly, the initial study preferentially
isolated long ribosome-protected mRNA fragments that are enriched in SD motifs. These
findings clarify the landscape of translational pausing in bacteria as observed by
ribosome profiling.
2.2 Background
The ribosome profiling method developed by Ingolia and Weissman is a powerful
tool for obtaining global information about protein synthesis (Ingolia et al., 2009). In this
approach, the positions of ribosomes on mRNAs are determined by sequencing ribosome-
protected mRNA fragments. Perhaps the most common use of this method is to compare
the number of ribosomes per gene under different conditions to monitor changes in gene
expression. But the ribosome profiling method is capable of providing more detailed
mechanistic insights as well: in the few short years since its development, profiling
studies have explored the interaction of the nascent chain with chaperones (Liu et al.,
2013; Oh et al., 2011) and observed non-canonical events like frameshifting (Michel et
20
al., 2012), stop-codon readthrough (Dunn et al., 2013), and termination/recycling defects
(Guydosh and Green, 2014; Young et al., 2015).
Because it has high resolution, ribosome profiling has the potential to reveal the
location and strength of translational pauses throughout the genome. Increased levels of
ribosome occupancy at specific sites provide evidence for slower elongation rates
(Ingolia et al., 2011). Ribosome pausing plays a critical role in the regulation of gene
expression in bacteria (Ito and Chiba, 2013) and in mRNA surveillance pathways in
eukaryotes (Doma and Parker, 2006). In addition, many studies argue that elongation
rates may be optimized to promote protein folding (Kim et al., 2015; Zhang and Ignatova,
2011). Ribosome profiling will continue to shed light on these important areas of research
by providing a clearer picture of translational pauses in living cells.
In a pioneering study applying the ribosome profiling method to bacteria,
ribosome occupancy was enriched at Shine-Dalgarno (SD) sequences (Li et al., 2012).
While SD sequences upstream of the start codon have a well-characterized role in
initiation, these data suggested that elongation is retarded by transient base-pairing
between SD motifs within open reading frames and the anti-Shine Dalgarno sequence
(aSD) in 16S rRNA. SD-associated pauses were reported to account for > 70% of strong
pauses genome-wide, leading the authors to conclude that pausing at SD motifs was the
primary determinant of translational pausing in bacteria (Li et al., 2012).
Here we revisit these observations using refinements in the method developed in
our work on ribosome pausing in bacteria lacking EFP (Woolstenhulme et al., 2015).
These refinements improved the resolution significantly. For technical reasons, the
bacterial protocol produces ribosome footprints that vary in length. Earlier studies
21
distributed information about the position of the ribosome over multiple nucleotides at
the center of reads, blurring the signal (Li et al., 2012; Oh et al., 2011). We and others
found that by assigning ribosome occupancy to the 3’-end of the reads, we obtain a more
precise measurement of ribosome position (Balakrishnan et al., 2014; Nakahigashi et al.,
2014; Woolstenhulme et al., 2015). With this higher resolution, we see that the
previously observed enrichment of ribosome occupancy at SD motifs can explained by
pauses at Gly codons and by failure to isolate the entire population of ribosome-protected
mRNA fragments. We conclude that SD motifs probably account for a small fraction of
translational pauses in vivo.
2.3 Results: Two signals and two distinct phenomena
We previously established that assigning ribosome occupancy to the 3’-end of
ribosome profiling reads gives higher resolution (Woolstenhulme et al., 2015). To
determine if these refinements might shed light on pauses at SD motifs, we re-analyzed
the data of Li et al. 2012 with both the center- and 3’-assignment strategies, observing the
extent to which ribosome occupancy correlates with affinity of the mRNA to the aSD in
the 16S rRNA. We employed a cross-correlation function to determine the optimal
displacement between maps of aSD affinity and ribosome occupancy (Figure 2.1A). The
small peak at zero reflects cloning bias (Figure 2.S1E) and can be ignored. In the center-
assigned data (black), a single broad peak was observed, as reported earlier. In the 3’-
assigned data (blue), however, the single peak resolves into two peaks; one at −15 and
another at −22. The peak at −22 corresponds to high ribosome density when the SD motif
is 22 nt upstream of the 3’-end of the reads (Figure 2.1A). In this position, the SD is 10 nt
upstream of the A-site codon as previously reported (Li et al., 2012), consistent with
22
known optimal spacing of the SD for participating in initiation (Chen et al., 1994). The
peak at −15, on the other hand, is not caused by SD:aSD pairing, as will be discussed
below. These correlation plots show that the center-assignment method conflates two
signals, one associated with SD pausing (−22), and one that is not (−15).

23
Figure 2.1: High Ribosome Occupancy at Shine-Dalgarno Motifs Is Due to the
Isolation of Long mRNA Fragments
A) The cross-correlation of aSD affinity and ribosome occupancy reveals the position of
the SD motif that is optimal for pausing the ribosome. Ribosome occupancy was assigned
to the center or 3’-end of the reads. B) Distribution of mapped read lengths. C) Cross-
correlation plots calculated with the entire libraries of Li et al. 2012 (blue) and 2014 (red)
or only the longer reads from the 2014 library (orange), resampled to match the 2012 read
length distribution. D) Cross-correlation plots from cells expressing orthogonal
ribosomes and a lacZ reporter with a complementary SD sequence (Li et al. 2012). Top
panels include all endogenous genes; bottom panels only the lacZ reporter. Correlations
were computed using the affinity for the wild-type (black) or orthogonal aSD sequence
(green). The right two panels were computed with either long (30 – 42 nt) or short (20 –
29 nt) reads; the red line indicates the peak at –22 associated with apparent SD pausing.
See also Figure 2.S1.
24
2.4 Results: Apparent SD pauses arise from the preferential selection of
long mRNA fragments
In our preparation of 19 ribosome profiling libraries from the same E. coli strain
grown under similar conditions, we observed little or no correlation between ribosome
occupancy and SD affinity at the −22 position, suggesting that SD pauses are absent in
our data (Figure 2.1A, grey). A thorough discussion of quality control for these libraries
is given in Figures 2.S2 and 2.S3. Systematically varying steps in the procedure that
might affect pausing, we tested the effect of antibiotics in the media, differences in
methods for harvesting and lysing cells, and treatments of the lysate intended to stabilize
ribosome complexes. The single factor that affected the correlation between SD motifs
and ribosome occupancy is the isolation of RNA fragments. While the initial bacterial
studies by Oh et al. 2011 and Li et al. 2012 selected 28 – 42 nt ribosome-protected
fragments by PAGE, we cut more broadly and isolated 15 – 45 nt fragments. This
difference is clearly reflected in the distribution of read lengths in the sequenced libraries
(Figure 2.1B, left). A later study by Li et al. (2014) cut more broadly and the size
distribution is similar to our studies (Figure 2.1B, left).
Differences in ribosome footprint lengths are relevant because RNA fragments
containing SD motifs are longer than those without them (O'Connor et al., 2013). This
phenomenon can be clearly seen in footprints from ribosomes with start codons in the P
site. These 70S ribosomes have completed initiation but have not yet begun elongating;
presumably strong SD-aSD pairing remains intact. These footprints are significantly
longer (30 – 40 nt) than footprints elsewhere in coding sequences (Figure 2.1B, right).
25
We speculate that SD-containing reads are longer at the 5’-end because the interaction
between the mRNA and the aSD protects the fragment from nuclease digestion.
We wondered whether by isolating fragments from the upper end of the length
distribution, the earlier study may have inadvertently enriched for SD-containing mRNA
fragments. To test this idea, we compared the data from the original study, where 28 – 42
nt fragments were isolated, with data from the same lab in which 15 – 45 nt fragments
were isolated (Li et al., 2014). With the newer data, the cross-correlation plots contain a
peak of similar intensity at −15 but a marked reduction in the peak at −22 that reflects SD
pausing (red and blue traces, Figure 2.1C). These data suggest that the intensity of the
−15 peak is independent of RNA fragment length, but that the relative proportion of
ribosomes found at SD motifs is reduced when a broader selection of mRNA fragments is
sequenced. Moreover, when we computationally remove shorter reads from the Li et al.
2014 library so that it has the same read length distribution as the earlier library, the
cross-correlation plots are nearly identical (yellow and blue traces, Figure 2.1C). Taken
together, these data indicate that the initial study over-estimated the strength of SD
pauses because the protocol failed to isolate the full range of ribosome-protected
footprints.
2.5 Results: The ribosome protects RNA fragments that pair with the
aSD
One of the most compelling experiments in the initial report of pausing at SD
motifs involved mutant ribosomes in which the sequence of the aSD had been altered.
These orthogonal ribosomes translate only a single mRNA species in the cell, a lacZ
reporter containing the complementary SD sequence. Within the lacZ coding sequence
26
translated by orthogonal ribosomes, ribosome density was enriched at mutant SD motifs
but not at wild-type SD motifs (Figure 2.1D, bottom left); conversely, ribosome density
across all other genes was enriched at wild-type SD motifs but not mutant SD motifs
(Figure 2.1D, top left). The observation that enrichment occurs at the type of SD motif in
the coding sequence that was used to initiate translation provides strong evidence that the
increased density arises from elongating ribosomes and not from initiation events within
coding sequences.
Although Li et al. (2012) interpreted the high ribosome density near SD motifs as
evidence of translational pausing, our findings suggest it arises from preferential selection
of long mRNA fragments that are protected against nuclease digestion by the SD-aSD
interaction. To test this hypothesis using the orthogonal ribosome data, we calculated the
cross-correlation between aSD affinity and ribosome occupancy using either short reads
(20 – 29 nt) or long reads (30 – 42 nt). As expected, long reads from cellular mRNAs
translated by normal ribosomes have a strong correlation at the –22 position with the
wild-type SD motif. In contrast, shorter reads had a much lower correlation at –22 but
had a strong peak at –15 (Figure 2.1D, top right); this peak is inconsistent with SD
pausing and arises from another source as detailed below. The same pattern was seen for
the orthogonal ribosomes translating lacZ: a strong correlation with the mutant aSD
sequence was observed at –22 for the long reads but not the short reads (Figure 2.1D,
bottom right). These data show that longer RNA fragments are enriched in SD motifs that
pair with rRNA, indicating that this enrichment arises from base-pairing of mRNA with
the ribosome and not from the SD sequence itself. These analyses support our hypothesis
that the SD-aSD interaction protects the 5’-end of RNA fragments from digestion.

27
2.6 Results: SD motifs make a minimal contribution to global
translational pausing
To compare the enrichment of ribosome density near SD motifs in different
profiling libraries, we used a different metric, calculating the average ribosome
occupancy and aSD affinity for all RNA hexamers. Plots of the Li et al. data and of our
own data are shown in Figure 2.2A with their linear fits. As expected, hexamers with
high affinity for the aSD sequence have high ribosome occupancy in the Li et al. 2012
data, as much as 3-fold higher than hexamers with low affinity. The slope of the linear fit
(0.28) reflects this strong dependence of ribosome occupancy on aSD affinity. In
contrast, there is a much weaker dependence in the Li et al. 2014 data (slope = 0.07), and
hexamers with the highest affinity have only about 1.5-fold more occupancy than those
with low affinity. In our data, there is essentially no dependence at all, with a slope of
−0.01 and no obvious enrichment of ribosomes on high affinity hexamers. These findings
are similar to those reported with the cross-correlation analysis in Figure 2.1 and are
independent of the method of assigning ribosome density (using the 3’-end, Figure 2.2A,
or center of reads, Figure 2.S1).
28
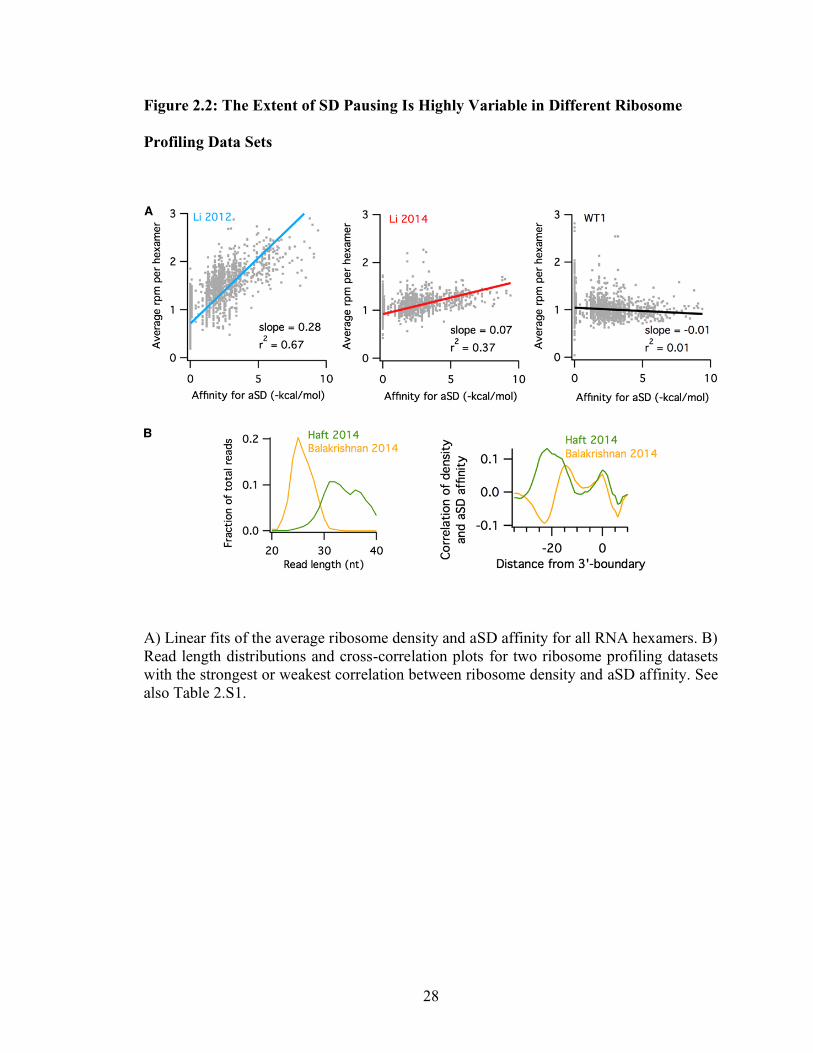
Figure 2.2: The Extent of SD Pausing Is Highly Variable in Different Ribosome
Profiling Data Sets
A) Linear fits of the average ribosome density and aSD affinity for all RNA hexamers. B)
Read length distributions and cross-correlation plots for two ribosome profiling datasets
with the strongest or weakest correlation between ribosome density and aSD affinity. See
also Table 2.S1.

29
Using the same metric, our analysis of 20 E. coli ribosome profiling datasets from
several labs reveals wide variations in levels of SD pausing (Table 2.S1). For the datasets
with the highest and lowest SD correlations, differences in the isolation of RNA
fragments account for the observed outcomes. Balakrishnan et al. (2014) report isolating
fragments 20 – 30 nt in length (Figure 2.2B, left), effectively discarding long reads that
contain SD motifs. In a cross-correlation analysis of these data, we see an anti-correlation
between aSD affinity and ribosome occupancy as evidenced by the dip at –22 in cross-
correlation plots (Figure 2.2B, right) and the negative slope (–0.10, Table 2.S1). In
contrast, Haft et al. (2014) enriched for SD-containing motifs by isolating long fragments
(Figure 2.2B, left). Their data exhibit a robust peak at –22 in the cross-correlation plots
and slopes of 0.21 – 0.25, nearly as high as Li et al. 2012. These findings further support
the conclusion that the correlation between aSD affinity and ribosome density strongly
depends on the length of the mRNA fragments isolated.
Differences in the isolation of RNA fragments do not explain all the variability
we observe, however. With the exception of Balakrishnan et al. 2014, all of the studies
reported isolating 28 – 42 nt fragments following the original protocol and thus might be
expected to show higher correlations of aSD affinity and ribosome density. In some
cases, this discrepancy can be explained by the fact that the actual length distribution is
substantially different than the reported range of isolated RNA fragments. Other steps in
the protocol may also have an effect. In the data of Oh et al. (2011), for example, cultures
treated with chloramphenicol and centrifuged showed lower levels of SD pausing (0.08)
than untreated cells that were filtered and flash frozen (0.15, Table 2.S1).

30
Isolating a broad distribution of RNA fragments (15 – 45 nt), we observe an
absence of a correlation between aSD affinity and ribosome density that is highly
reproducible. We systematically varied steps in the procedure, generating 19 libraries that
all have essentially no SD pausing, with slopes near zero (Table 2.S1). We conclude that
differences in the isolation of RNA fragments have the greatest impact on enrichment of
reads containing SD motifs.
2.7 Results: Pausing at SD motifs is not observed in vitro
Given the questions raised by our analyses of the profiling data, we set out to
determine the extent to which SD motifs impact elongation in vitro using a biochemical
assay. We selected three hexamers, GGUGGU, GGAGGU, and AGGAGG, based on
their high affinity for the aSD as well as their high pause scores in the original paper (Li
et al., 2012). We define pause scores as the ribosome occupancy at the motif of interest
divided by the mean occupancy for the gene, averaged over all instances of that motif
(Woolstenhulme et al., 2015). For these three hexamers, each of which has a pause score
of 2.7 or higher, we identified instances in endogenous genes with high occupancy
(Figure 2.3A). For comparison, we evaluated pausing at Pro-Pro-Met; this tripeptide
motif has an pause score of 3.0 in bacteria lacking EFP (Woolstenhulme et al., 2015),
roughly the same strength as the three SD hexamers of interest in the Li et al. 2012
dataset.
31
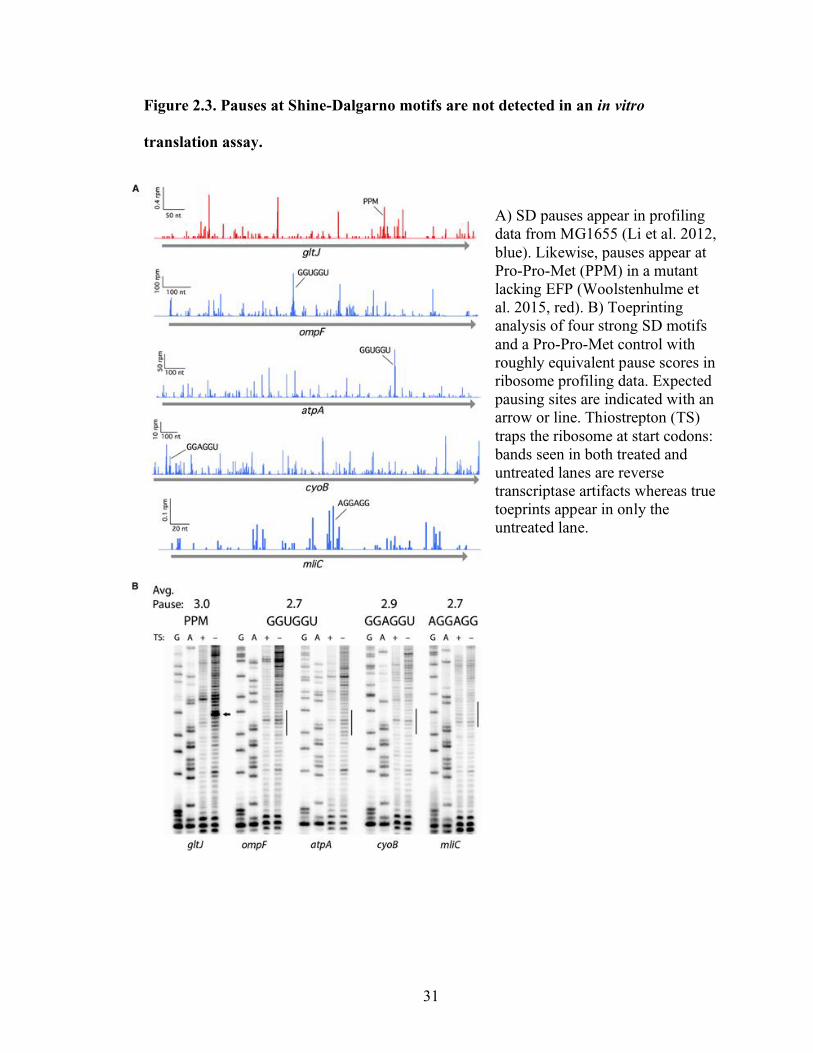
Figure 2.3. Pauses at Shine-Dalgarno motifs are not detected in an in vitro
translation assay.
A) SD pauses appear in profiling
data from MG1655 (Li et al. 2012,
blue). Likewise, pauses appear at
Pro-Pro-Met (PPM) in a mutant
lacking EFP (Woolstenhulme et
al. 2015, red). B) Toeprinting
analysis of four strong SD motifs
and a Pro-Pro-Met control with
roughly equivalent pause scores in
ribosome profiling data. Expected
pausing sites are indicated with an
arrow or line. Thiostrepton (TS)
traps the ribosome at start codons:
bands seen in both treated and
untreated lanes are reverse
transcriptase artifacts whereas true
toeprints appear in only the
untreated lane.

32
To determine if these motifs induce translational pauses, we employed
conventional toeprinting assays that have been widely used for decades to assess pause
strength (Hartz et al., 1989; Sachs et al., 2002; Vazquez-Laslop et al., 2008;
Woolstenhulme et al., 2013). mRNA constructs encoding the motifs within their
endogenous sequence context were translated in a reconstituted translation system and a
radiolabeled primer was annealed to the 3’-end of the transcripts and extended by reverse
transcriptase. When reverse transcriptase encounters a paused ribosome, it arrests 15 – 16
nt downstream of the first nucleotide in the P-site codon. Strong pauses elicit strong
cDNA bands on a PAGE gel. In control lanes, the general elongation inhibitor
thiostrepton is added to the reaction; primer extension products that appear both with and
without thiostrepton are ignored as they represent truncated cDNAs generated by reverse
transcriptase even in the absence of translation, perhaps due to sequence or secondary
structural elements that impede polymerization by RT.
The toeprinting data reveal a robust pause at Pro-Pro-Met (since there is no EFP
present in the translation reaction) but provide no evidence of pausing at SD motifs
(Figure 2.3B). The thiostrepton-sensitive band for the Pro-Pro-Met-containing gene gltJ
corresponds to pausing where the second Pro codon is positioned in the P site, consistent
with earlier biochemical data (Doerfel et al., 2013; Ude et al., 2013) and our previous
ribosome profiling study (Woolstenhulme et al., 2015). This shows that the toeprinting
assay is sensitive enough to detect pauses with an average pause score of 3. In contrast,
there are no thiostrepton-sensitive bands at the relevant positions with the four SD-
containing constructs that we assayed: ompF and atpA with GGUGGU, cyoB with
GGAGGU, and mliC with AGGAGG. The lack of observable pausing in this in vitro
33
experiment is consistent with our inability to observe pausing on such motifs in our
genomic analysis. Together, these data suggest that SD motifs are not a major source of
translational pausing in bacteria.
2.8 Results: Gly codons appear to pause ribosomes when bound in the E
site
As noted above, when we look at the cross-correlation using the 3’-assignment
method (Figure 2.1A), we observe two peaks. Initially, it was unclear why ribosome
occupancy and aSD affinity should be correlated at the −15 position, about 7 nt
downstream from the optimal distance for SD-aSD interactions. To explore the origins of
the −15 peak, we used the Li et al. 2014 data to calculate the average ribosome density on
G-rich codons, all of which have high affinity for the aSD. Plots of average density at
these codons display a signature typical of SD pauses. (Note that these plots appear to be
flipped compared to the cross-correlation plots; the codon starts at 0 and the signal
represents ribosome density shifted to line up with the P site). For example, ribosome
density is enhanced when the P site is 10 – 20 nt downstream of the UGG codon (Figure
2.4A) because UGG can interact strongly with the aSD. The intensity of the peak depends
on the length of the reads used in the calculation; the strongest signal is seen with reads
36 – 40 nt in length. The peaks are weaker when 31 – 35 or 26 – 30 nt reads are used and
are not detectable with 20 – 25 nt reads. This length dependence is consistent with what
we observed above (Figure 2.1C and 2.2B); SD motifs are enriched in long reads. Pauses
at AGG and CGG follow a similar pattern in their position and read length dependence
(Figure 2.S4). In each of these cases, the pausing signatures likely reflect interaction of
SD motifs with the aSD

34
Figure 2.4. Pauses at Gly codons.
A) The average ribosome density at
UGG codons was calculated for
subsets of the Li et al. 2014 library
containing reads of various lengths.
B) In the same dataset, ribosome
density surrounding GGG codons
shows an additional peak
corresponding to ribosome pausing
with Gly codons in the E site. Plots
for the other eight codons
containing two guanosines are
shown in Figure 2.S4. C) E-site
pause scores for all ten G-rich
codons. Gly codons are highlighted
in green. D) Cross-correlation plots
using data from Li et al. 2012,
before (black) or after (blue)
subtracting pauses due to Gly
codons in the E site. E) E-site pause
scores for all twenty amino acids
from samples treated with
chloramphenicol in the media or the
lysate.

35
In contrast, pausing at GGN codons has a more complex pattern that provides a
clue to the origins of the −15 peak seen in Figure 2.1A. In plots of the average ribosome
density on GGG codons, for example, there is a strong enhancement of ribosome density
when the GGG codon is positioned in the ribosomal E site (Figure 2.4B). These pauses
are significantly stronger for the four Gly codons (GGN) than other G-rich codons
(Figure 2.S4, quantified in Figure 2.4C). Gly pauses differ from SD pauses in that they
are not read-length dependent; strong pauses are seen for all read lengths when Gly
codons are positioned in the ribosomal E site. Gly pauses are also observed in our own
data (Figure 2.4C), consistent with the fact that our libraries exhibit a robust −15 peak in
the cross correlation analysis but not the −22 peak associated with SD pausing (Figure
2.1A). No pausing is evident in the RNAseq samples, indicating that the observed pauses
are not the result of cloning or sequencing artifacts. As a final evidence of its origin, the
−15 peak disappears when the pauses associated with in-frame Gly codons in the E site
are computationally subtracted (Figure 2.4D). Taken together, these data indicate that the
−15 peak arises from pausing on Gly codons and not from SD-aSD interactions.
Although the profiling data show that ribosomes pause with Gly codons in the E
site, the biochemical significance of this observation is less clear. Presumably having a
Gly residue at the −2 position in the nascent polypeptide inhibits ribosome function in
some way. However, we have been unable to detect pausing at Gly codons in toeprinting
assays, despite the fact that the pauses in the profiling data are roughly the same strength
as the Pro-Pro-Met control in Figure 2.3B. Indeed, the absence of toeprints at the atpA,
cyoB, and ompF SD motifs in Figure 2.3 argues against pausing at Gly codons, since
these motifs are translated as Gly-Gly. What might account for this discrepancy?

36
It may be that methods of arresting translation after cell lysis generate pauses that
do not reflect the in vivo translational landscape. Gly codons are not the only ones that
cause pausing when positioned in the ribosomal E site: pauses at Ser, Thr, Ala, and Cys
are observed as well (Figure 2.4E). These pauses are strikingly similar to those observed
when chloramphenicol is added to a culture to arrest translation prior to harvesting the
cells (Figure 2.4E). As shown previously by Mori and co-workers, chloramphenicol
arrests ribosomes in a sequence-specific manner, pausing ribosomes when the same five
amino acids are encoded in the E site (Nakahigashi et al., 2014). This sequence
specificity was also observed by Mankin and co-workers, who detected pauses with Gly,
Ser, Ala, and Thr codons in the E site using toeprinting assays, but only in the presence of
chloramphenicol (Orelle et al., 2013). Given that the activity of chloramphenicol depends
on the sequence being translated, and that the lysates are translationally active (the
method of preparing lysates resembles methods for preparing extracts for in vitro
translation), it makes sense that adding chloramphenicol to arrest translation leads to
pausing artifacts in ribosome profiling.
2.9 Discussion
Our findings raise questions about whether Shine-Dalgarno motifs are a major
determinant of translational pausing in bacteria. The earlier report of strong pauses (Li et
al., 2012) conflated two signals, one from true SD motifs and another from Gly codons.
With the higher resolution provided by 3’-assignment, we were able to resolve these two
signals. In retrospect, using either 3’-assignment or center-assignment (Figure 2.S1), we
clearly see that selection for longer RNA fragments in the initial paper artificially
enriched SD-containing reads in the library (O'Connor et al., 2013). These two factors

37
together explain the initial claims of SD pausing in the bacterial system, though they do
not explain it completely. In our own data, we fail to observe even modest enrichment in
ribosome occupancy at SD motifs. We have systematically varied every step of the
library preparation protocol but have not been able to reproduce the small enrichment at
SD-motifs that remains in Li et al. 2014.
We provide evidence for an absence of SD-pausing using standard toeprinting
assays (Figure 2.3). Pauses were not detected on SD motifs even though pauses of
equivalent strength at polyproline motifs were readily detected by this approach. Given
that the toeprinting assay is widely used to detect pausing during elongation, there is
every reason to expect that this method would similarly detect pauses induced by SD-
motifs with equivalent pause scores. Although there may be differences between
ribosome activity in vitro and in vivo, taken together, the lack of SD pausing in our
profiling data and the lack of observable pausing in vitro suggest that SD motifs are not a
major source of translational pausing in bacteria.
We note that two single-molecule studies indicate that internal SD motifs can
promote pausing during elongation. In the first (Wen et al., 2008), in an optical tweezers
experiment, ribosomes arrest at two internal SD motifs. We argue that the interpretation
of this observation is not straightforward: in the optical tweezers setup, ribosomes are
continually unwinding a very strong hairpin, only a small fraction complete the synthesis
of the 80-mer product, and the rate of translation is quite slow (0.5 codons/s). A second
single-molecule study using fluorescence approaches is potentially more convincing: in
their analysis, Puglisi and co-workers found that a strong SD motif was able to inhibit the
ribosome’s ability to exit the pre-translocation (hybrid) state by 3 – 4 fold (Chen et al.,

38
2014). Here again, however, translation is at least 100-fold slower than observed in vivo.
These caveats raise doubts about the relevance of these studies in understanding pausing
in vivo where processivity and translation rates are much higher.
A more compelling biochemical argument is put forward by Borg and Ehrenberg
(2015) who revisit the question in bulk translocation assays under in vivo-like conditions.
Over the years, Ehrenberg and co-workers have developed an in vitro translation system
in which the buffer and factor concentrations are carefully fine-tuned to achieve rates like
those observed in vivo (~20 codons/s). In this study, they examined three SD motifs of
varying affinities and found that they had no effects on the rate of translocation (Borg and
Ehrenberg, 2015). Noting the discrepancy with Puglisi’s single-molecule study, they
remark that their time scales are more than 100-fold shorter than those in the single-
molecule work. Perhaps SD motifs induce pausing if translation is sufficiently slow or
otherwise limited by the in vitro system.
Although our findings argue that SD motifs are not the primary source of
translational pausing in E. coli, they certainly do not rule out the possibility that SD
motifs may affect elongating ribosomes under specific circumstances that are biologically
important. SD motifs have well-characterized roles in frameshifting in bacteria: in the
dnaX gene, an internal SD motif contributes to −1 frameshifting at a slippery sequence
followed by an mRNA hairpin (Larsen et al., 1994). In vitro studies on this system have
shown that the downstream hairpin blocks translocation (Caliskan et al., 2014; Chen et
al., 2014), resulting in a kinetic pause; this in turn allows different codons and reading
frames to be sampled on the slippery sequence (Caliskan et al., 2015; Yan et al., 2015). In
39
the metastable state where the ribosome slips on the message, the SD motif stabilizes the
interaction with the mRNA in a new position.
Another well-characterized programmed frameshift in E. coli occurs in the prfB
gene where +1 frameshifting promotes synthesis of full-length RF2 protein by avoiding
termination at an in-frame stop codon. In this elegant genetic circuit, low levels of RF2
increase ribosome pausing on the UGA stop codon, triggering frameshifting. High levels
of frameshifting depend on a conserved SD motif positioned upstream of the UGA codon
(Weiss et al., 1988). Here again, the primary pausing event (i.e. the kinetic pause) is the
slow rate of peptide release due to the limiting amounts of RF2, and the SD motif
probably promotes mRNA movement on the slippery sequence.
Our improved methods allow us to detect pauses when Gly codons are positioned
in the E site. These pauses are not dependent on read length (unlike the SD-motif pauses)
and are observed with all four Gly codons (GGN). These observations suggest that these
pauses result from features related to the amino acid and not from interaction with the
mRNA. We have been unable to detect pauses at Gly codons in toeprinting assays,
suggesting that protein synthesis is different in the ribosome profiling workup and the in
vitro translation system we use for toeprinting. We note that using toeprinting assays,
others have reported pauses with codons for Gly and other small amino acids in the E site
when chloramphenicol is included in the reaction (Orelle et al., 2013). These pauses
match those observed when chloramphenicol is added to the culture prior to harvesting
cells (Nakahigashi et al., 2014). Chloramphenicol binds the peptidyl-transferase center
and has variable effects depending on the peptide and aminoacyl-tRNA sequence
(Wilson, 2009); presumably it arrests ribosomes more effectively with Gly, Ala, Ser, Cys,

40
or Thr in the second to last position of the nascent peptide. We are currently working to
understand how antibiotics and ongoing translation in the cell lysate affect the pausing
landscape in ribosome profiling data.
In conclusion, by analyzing ribosome profiling data at higher resolution, we have
obtained a more accurate view of translational pausing in bacteria. Although ribosome
profiling is a powerful tool for observing pauses at a global level, not all the potential
pitfalls are understood. It is difficult to know when the method is accurately portraying
what is happening in living cells given our uncertainty of how the pausing landscape
ought to look. We anticipate that as findings from profiling studies are corroborated by
genetic and biochemical methods, a more complete picture of ribosome pausing will
emerge.
2.10 Experimental Procedures
Ribosome profiling:
Libraries were prepared as described (Woolstenhulme et al., 2015) with a few
modifications: an overnight culture grown in MOPS media supplemented with 1%
glucose and other nutrients (Teknova) was diluted 1:100 into 400 mL fresh media and
grown at 37 °C to an OD600 of 0.25. Cell pellets were cryogenically pulverized using a
Spex 6870 freezer mill with 5 cycles of 1 min grinding at 5 Hz and 1 min cooling.
Ribosome footprints 15 – 45 nt were gel purified, cloned, and sequenced. RNAseq
libraries were created by mild alkaline hydrolysis of total RNA; fragments between 20 –
40 nt were cloned and sequenced.
Analyses of profiling data were performed with python scripts. Only genes with
an average of one or more reads per codon were included. To determine the cross-

41
correlation of ribosome occupancy and aSD affinity, we created an aSD-affinity profile
by scanning overlapping eight nt windows across all coding sequences. The free energy
of hybridization of the aSD sequence (CACCUCCU) and each octamer was predicted
using RNAsubopt in the Vienna RNA package (Lorenz et al., 2011). The affinity for each
octamer was assigned to its seventh position. The aSD-affinity profile and ribosome
profile were cross-correlated using the numpy correlate function as described (Li et al.,
2012). To quantify the relationship between aSD affinity and ribosome occupancy, we
first computed the lowest energy of hybridization of each RNA hexamer to the aSD
sequence. We then calculated the average ribosome occupancy 23 – 28 nt downstream of
the first nt in the hexamer.
Toeprinting analyses:
The in vitro translation constructs contain a constant region followed by a 33 nt
sequence from an E. coli gene containing an SD motif. Toeprinting assays were
performed using the PURExpress system (New England Biolabs) as described in detail in
the Supplemental Experimental Procedures.

42
2.11 References
Balakrishnan, R., Oman, K., Shoji, S., Bundschuh, R., and Fredrick, K. (2014). The
conserved GTPase LepA contributes mainly to translation initiation in Escherichia coli.
Nucleic Acids Res 42, 13370-13383.
Borg, A., and Ehrenberg, M. (2015). Determinants of the rate of mRNA translocation in
bacterial protein synthesis. J Mol Biol 427, 1835-1847.
Caliskan, N., Katunin, V.I., Belardinelli, R., Peske, F., and Rodnina, M.V. (2014).
Programmed -1 frameshifting by kinetic partitioning during impeded translocation. Cell
157, 1619-1631.
Caliskan, N., Peske, F., and Rodnina, M.V. (2015). Changed in translation: mRNA
recoding by -1 programmed ribosomal frameshifting. Trends Biochem Sci 40, 265-274.
Chen, H., Bjerknes, M., Kumar, R., and Jay, E. (1994). Determination of the optimal
aligned spacing between the Shine-Dalgarno sequence and the translation initiation codon
of Escherichia coli mRNAs. Nucleic Acids Res 22, 4953-4957.
Chen, J., Petrov, A., Johansson, M., Tsai, A., O'Leary, S.E., and Puglisi, J.D. (2014).
Dynamic pathways of -1 translational frameshifting. Nature 512, 328-332.
Doerfel, L.K., Wohlgemuth, I., Kothe, C., Peske, F., Urlaub, H., and Rodnina, M.V.
(2013). EF-P is essential for rapid synthesis of proteins containing consecutive proline
residues. Science 339, 85-88.
Doma, M.K., and Parker, R. (2006). Endonucleolytic cleavage of eukaryotic mRNAs
with stalls in translation elongation. Nature 440, 561-564.
Dunn, J.G., Foo, C.K., Belletier, N.G., Gavis, E.R., and Weissman, J.S. (2013).
Ribosome profiling reveals pervasive and regulated stop codon readthrough in
Drosophila melanogaster. eLife 2, e01179.
Guydosh, N.R., and Green, R. (2014). Dom34 rescues ribosomes in 3' untranslated
regions. Cell 156, 950-962.
Hartz, D., McPheeters, D.S., and Gold, L. (1989). Selection of the initiator tRNA by
Escherichia coli initiation factors. Genes & development 3, 1899-1912.
Ingolia, N.T., Ghaemmaghami, S., Newman, J.R., and Weissman, J.S. (2009). Genome-
wide analysis in vivo of translation with nucleotide resolution using ribosome profiling.
Science 324, 218-223.
Ingolia, N.T., Lareau, L.F., and Weissman, J.S. (2011). Ribosome profiling of mouse
embryonic stem cells reveals the complexity and dynamics of mammalian proteomes.
Cell 147, 789-802.
43
Ito, K., and Chiba, S. (2013). Arrest Peptides: Cis-Acting Modulators of Translation.
Annual Review of Biochemistry 82.
Kim, S.J., Yoon, J.S., Shishido, H., Yang, Z., Rooney, L.A., Barral, J.M., and Skach,
W.R. (2015). Translational tuning optimizes nascent protein folding in cells. Science 348,
444-448.
Larsen, B., Wills, N.M., Gesteland, R.F., and Atkins, J.F. (1994). rRNA-mRNA base
pairing stimulates a programmed -1 ribosomal frameshift. J Bacteriol 176, 6842-6851.
Li, G.W., Oh, E., and Weissman, J.S. (2012). The anti-Shine-Dalgarno sequence drives
translational pausing and codon choice in bacteria. Nature 484, 538-541.
Liu, B., Han, Y., and Qian, S.B. (2013). Cotranslational response to proteotoxic stress by
elongation pausing of ribosomes. Mol Cell 49, 453-463.
Lorenz, R., Bernhart, S.H., Honer Zu Siederdissen, C., Tafer, H., Flamm, C., Stadler,
P.F., and Hofacker, I.L. (2011). ViennaRNA Package 2.0. Algorithms for molecular
biology : AMB 6, 26.
Michel, A.M., Choudhury, K.R., Firth, A.E., Ingolia, N.T., Atkins, J.F., and Baranov,
P.V. (2012). Observation of dually decoded regions of the human genome using
ribosome profiling data. Genome Res 22, 2219-2229.
Nakahigashi, K., Takai, Y., Shiwa, Y., Wada, M., Honma, M., Yoshikawa, H., Tomita,
M., Kanai, A., and Mori, H. (2014). Effect of codon adaptation on codon-level and gene-
level translation efficiency in vivo. BMC genomics 15, 1115.
O'Connor, P.B., Li, G.W., Weissman, J.S., Atkins, J.F., and Baranov, P.V. (2013).
rRNA:mRNA pairing alters the length and the symmetry of mRNA-protected fragments
in ribosome profiling experiments. Bioinformatics 29, 1488-1491.
Oh, E., Becker, A.H., Sandikci, A., Huber, D., Chaba, R., Gloge, F., Nichols, R.J., Typas,
A., Gross, C.A., Kramer, G., et al. (2011). Selective ribosome profiling reveals the
cotranslational chaperone action of trigger factor in vivo. Cell 147, 1295-1308.
Orelle, C., Carlson, S., Kaushal, B., Almutairi, M.M., Liu, H., Ochabowicz, A., Quan, S.,
Pham, V.C., Squires, C.L., Murphy, B.T., et al. (2013). Tools for characterizing bacterial
protein synthesis inhibitors. Antimicrob Agents Chemother 57, 5994-6004.
Sachs, M.S., Wang, Z., Gaba, A., Fang, P., Belk, J., Ganesan, R., Amrani, N., and
Jacobson, A. (2002). Toeprint analysis of the positioning of translation apparatus
components at initiation and termination codons of fungal mRNAs. Methods (San Diego,
Calif 26, 105-114.
Ude, S., Lassak, J., Starosta, A.L., Kraxenberger, T., Wilson, D.N., and Jung, K. (2013).
Translation elongation factor EF-P alleviates ribosome stalling at polyproline stretches.
Science 339, 82-85.
44
Vazquez-Laslop, N., Thum, C., and Mankin, A.S. (2008). Molecular mechanism of drug-
dependent ribosome stalling. Mol Cell 30, 190-202.
Weiss, R.B., Dunn, D.M., Dahlberg, A.E., Atkins, J.F., and Gesteland, R.F. (1988).
Reading frame switch caused by base-pair formation between the 3' end of 16S rRNA
and the mRNA during elongation of protein synthesis in Escherichia coli. EMBO J 7,
1503-1507.
Wen, J.D., Lancaster, L., Hodges, C., Zeri, A.C., Yoshimura, S.H., Noller, H.F.,
Bustamante, C., and Tinoco, I. (2008). Following translation by single ribosomes one
codon at a time. Nature 452, 598-603.
Wilson, D.N. (2009). The A-Z of bacterial translation inhibitors. Critical reviews in
biochemistry and molecular biology 44, 393-433.
Woolstenhulme, C.J., Guydosh, N.R., Green, R., and Buskirk, A.R. (2015). High-
precision analysis of translational pausing by ribosome profiling in bacteria lacking EFP.
Cell reports 11, 13-21.
Woolstenhulme, C.J., Parajuli, S., Healey, D.W., Valverde, D.P., Petersen, E.N., Starosta,
A.L., Guydosh, N.R., Johnson, W.E., Wilson, D.N., and Buskirk, A.R. (2013). Nascent
peptides that block protein synthesis in bacteria. Proc Natl Acad Sci U S A 110, E878-
887.
Yan, S., Wen, J.D., Bustamante, C., and Tinoco, I., Jr. (2015). Ribosome excursions
during mRNA translocation mediate broad branching of frameshift pathways. Cell 160,
870-881.
Young, D.J., Guydosh, N.R., Zhang, F., Hinnebusch, A.G., and Green, R. (2015).
Rli1/ABCE1 Recycles Terminating Ribosomes and Controls Translation Reinitiation in
3'UTRs In Vivo. Cell 162, 872-884.
Zhang, G., and Ignatova, Z. (2011). Folding at the birth of the nascent chain: coordinating
translation with co-translational folding. Curr Opin Struct Biol 21, 25-31.

45
2.12 Supplemental information
Table 2.S1. Linear fits for aSD affinity and ribosome density correlations, related to
Figure 2.2.
In this table we show the parameters for the linear fits of aSD affinity and ribosome
density for mRNA hexamers as depicted in Figure 2.2A. On the right side are 19 libraries
created in this study; these reproducibly show no correlation between aSD affinity and
ribosome density. In contrast, on the left side, 20 E. coli profiling libraries from other
labs exhibit a high degree of variability. Although these libraries are nearly all from wild-
type controls, they were prepared in very different ways. Some labs collect cells with
filtering and others with centrifugation; some add chloramphenicol to the media and
others do not; some lyse by grinding cell pellets and others by freeze / thaw cycles.

46
Particularly relevant to our discussion is the fact that these studies all report isolating 28 –
42 nt fragments during the size selection step, following the Weissman protocol, except
for the Balakrishnan et al. 2014 study, which selected 20 – 30 nt fragments. The negative
correlation in Balakrishnan samples comes from 2 preferentially cloning shorter
fragments that lack SD motifs—the opposite of the enrichment in the Li et al. 2012 study.
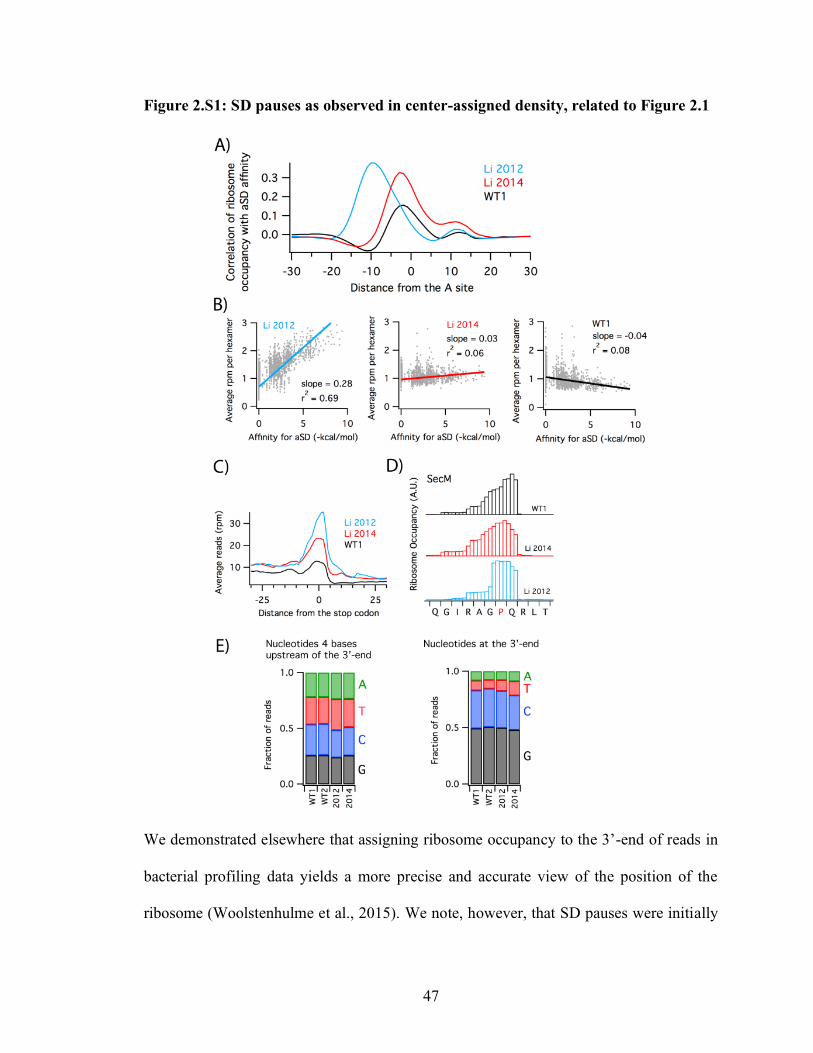
47
Figure 2.S1: SD pauses as observed in center-assigned density, related to Figure 2.1
We demonstrated elsewhere that assigning ribosome occupancy to the 3’-end of reads in
bacterial profiling data yields a more precise and accurate view of the position of the
ribosome (Woolstenhulme et al., 2015). We note, however, that SD pauses were initially
48
observed using center-assignment and it is possible that 3’-assignment interferes with our
ability to accurately detect SD pauses. Indeed, we see in Figure 2.1A that 3’-assignment
of the Li et al. 2012 data reduces the SD pausing signal in cross-correlation plots. This is
because SD motifs tend to be near the 5’-end of reads, where they vary in distance from
the 3’-end according to the caterpillar model of O’Connor et al. (2013). In spite of this
weaker signal, we find that our linear fits of the data from Li et al. 2012 using 3’-
assignment reproduce the strong correlation that was previously reported (Figure 2.2A).
In addition, we show here using centerassignment that the strong pausing signal reported
in Li et al. 2012 is lacking in the 2014 data and in our libraries. The 2012 data have a
maximal correlation between aSD affinity and ribosome density 8 – 11 nt upstream of the
A site codon (Figure 2.S1A). In contrast, the highest correlation in the 2014 and WT1
data occurs 3 nt upstream of the A site codon. Given that biochemical and structural
studies show that the A site codon is 12 nt upstream of the 3’-boundary of the ribosome,
these distances correspond exactly with the –22 and –15 peaks observed in Figure 2.1A
using 3’-assignment. We argue that given their different positions, these two peaks are
fundamentally distinct: the peak in the 2012 data arises from a true SD correlation
whereas the peak in the 2014 and WT1 data arises predominantly from pauses on Gly
codons. Using the center-assignment strategy, we calculated the average ribosome
density and aSD affinity for all RNA hexamers. The average ribosome density was
computed for the region 11 – 17 nt downstream of the first nt in the hexamer. As shown
in Figure 2.S1B, we see a strong correlation in the 2012 data, with the same slope and a
similar r2 value as was observed in Figure 2.2A using 3’-assignment. In contrast, little or
no correlation is seen for the 2014 and WT1 data. These findings show that our
49
conclusions are equivalent whether ribosome occupancy is assigned using the center or
3’-end strategies. A clear weakness of the center-assignment strategy is that the ribosome
density maps need to be shifted manually in order to line them up with the ribosomal A
site. In the 2012 5 paper, the Li et al. shifted the density maps 4 nt downstream so that the
observed density lines up with the A site at stop codons and known translational stalling
sites like SecM. The shift depends on the length distribution of mRNA fragments in the
library and has to be determined empirically for each individual library. Here we provide
three pieces of evidence that our center-assigned density maps are shifted properly. We
found that the 2014 and WT1 maps did not require shifting because they naturally line up
with the A site at stop codons (Figure 2.S1C) and the well-characterized arrest at SecM in
which the Pro codon is positioned in the A site (Figure 2.S1D). It makes sense that
density maps from these libraries do not require shifting: their mRNA fragments are
shorter than the 2012 library. Given that the RNA fragments differ in length almost
exclusively at the 5’-ends, fragments in these libraries do not have extra 5’- sequence that
pulls the distribution upstream. Finally, we note that there are small peaks in the cross-
correlation plots 12 nt downstream of the A site (Figure S1A). These peaks arise from
cloning bias at the 3’-end of the RNA fragments. Although neutral positions with the
fragments show no enrichment for specific nucleotides (Figure 2.S1E, left panel), the 3’-
end of cloned fragments is enriched in G (Figure 2.S1E, right panel). Since G-rich
sequences have high aSD affinity, this creates a peak in the cross-correlation plot. Given
that the distance between the 3’-end and the A site is known to be constant in ribosome
profiling reads (Woolstenhulme et al., 2015), the fact that these small peaks line up in all
three libraries in Figure 2.S1A means that the density maps are shifted correctly and

50
consistently. Proper alignment of the density maps is essential to calculating pausing at
the same position in the ribosome across different libraries using center-assignment.
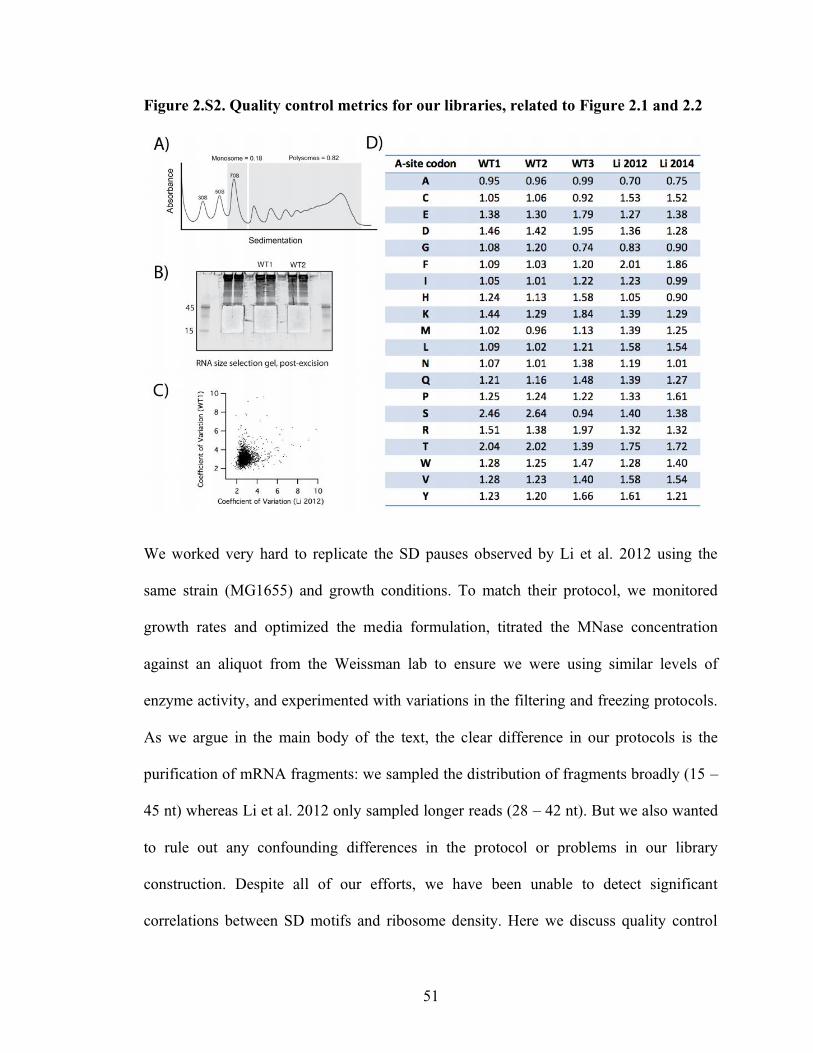
51
Figure 2.S2. Quality control metrics for our libraries, related to Figure 2.1 and 2.2
We worked very hard to replicate the SD pauses observed by Li et al. 2012 using the
same strain (MG1655) and growth conditions. To match their protocol, we monitored
growth rates and optimized the media formulation, titrated the MNase concentration
against an aliquot from the Weissman lab to ensure we were using similar levels of
enzyme activity, and experimented with variations in the filtering and freezing protocols.
As we argue in the main body of the text, the clear difference in our protocols is the
purification of mRNA fragments: we sampled the distribution of fragments broadly (15 –
45 nt) whereas Li et al. 2012 only sampled longer reads (28 – 42 nt). But we also wanted
to rule out any confounding differences in the protocol or problems in our library
construction. Despite all of our efforts, we have been unable to detect significant
correlations between SD motifs and ribosome density. Here we discuss quality control
52
metrics for steps that could conceivably be important to observe pausing in ribosome
profiling data. 7 First, we see robust polysome signals in sucrose gradients (Figure
2.S2A) showing that the cells are healthy and have high levels of translation at the point
of harvesting. The profile also indicates that we have not lost ribosomes or mRNA
integrity during the lysis process. After digestion with MNase, we recovered ribosomes
quantitatively as the polysome fraction collapsed into monosomes, indicating that we are
not losing mRNA fragments or biasing the library at this step (not shown). In our size
selection gels, fragments 15 – 45 nt in length were isolated using RNA markers as size
controls (Figure 2.S2B). This gel and the read length distributions in Figure 2.1B show
that we captured the relevant ribosome protected fragments and did not lose SD-
containing reads by selecting only shorter reads. It is conceivable that SD pauses occur in
our data but we cannot see them because they are masked by noise of greater intensity.
We computed the coefficient of variation for genes with more than one read per codon on
average in our WT1 library and the data from Li et al. 2012. The coefficient of variation
gives a rough idea of the variability in the ribosome density across each gene. As is clear
from the values for many genes that are plotted in Figure 2.S2C, the noise does not differ
greatly between the two datasets, refuting the suggestion that overall noise in our data
prevented us from observing SD pauses. Moving from the general to the specific, we
calculated pause scores for codons in the ribosomal A site grouped by the encoded amino
acid (Figure 2.S2D)—an estimate of pauses that occur as the ribosome waits for
incoming aminoacyl-tRNA. These were calculated by dividing the density at the first nt
of the A site codon by the mean for the entire gene and averaging the scores for every
relevant codon throughout the genome. We find that density at Ser and Thr codons is
53
elevated in our WT1 and WT2 samples compared to other amino acids. Although Thr
seems to also be high in the libraries of Li et al., Ser pauses appear to be a difference in
our samples. Potential implications are discussed below in Figure 2.S3. Importantly,
however, we note that the range of pause scores is not dramatically different in our WT1
(0.95 to 2.46) and the 2012 data (0.7 to 2.0).
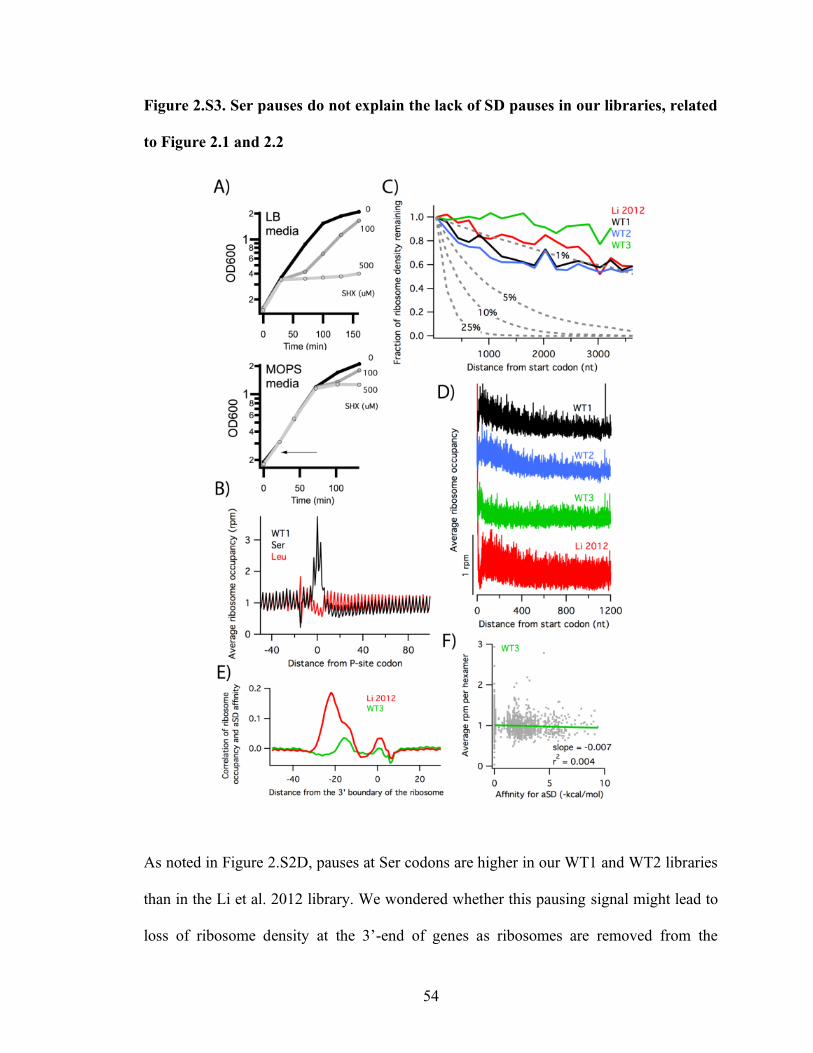
54
Figure 2.S3. Ser pauses do not explain the lack of SD pauses in our libraries, related
to Figure 2.1 and 2.2
As noted in Figure 2.S2D, pauses at Ser codons are higher in our WT1 and WT2 libraries
than in the Li et al. 2012 library. We wondered whether this pausing signal might lead to
loss of ribosome density at the 3’-end of genes as ribosomes are removed from the

55
message by rescue mechanisms such as the tmRNA pathway (Subramaniam et al., 2014).
If substantial loss of ribosome density occurs along genes, calculations of SD pause
strengths would be inaccurate because the signal would vary depending on the position of
the motif within the gene. Because we suspected that Ser pauses arose from starvation
due to problems with the media formulation or growth conditions, we harvested cells in
early log phase in a complete synthetic MOPS medium with high concentrations of Ser
and glucose. It is well documented that upon depletion of glucose in LB at around OD600
= 0.3, Ser becomes limiting for translation as it is metabolized (Li et al., 2012; Pruss et
al., 1994; Sezonov et al., 2007). We confirmed this by adding 500 μM serine
hydroxamate (SHX) to LB media and observing an arrest of cell growth (Figure 2.S3A).
In contrast, adding SHX to our MOPS media had no effect on growth until stationary
phase, indicating that there was abundant Ser present when our culture was harvested in
early log phase (OD600 = 0.25, indicated with an arrow). We conclude that the Ser
pauses are not the result of starvation during the growth of the culture. We also observed
that Ser pauses in our data have an unexpected effect on the ribosome density
downstream (Figure 2.S3B). Although there is a reduction of about 25% immediately
after Ser codons, ribosome density recovers to its original level by 80 nt downstream. The
fact that the pause is only locally rate-limiting suggests that we are observing a time-
dependent event, similar to the time-dependent run-off of ribosomes that occurs if
harringtonine is added to trap ribosomes at start codons (Ingolia et al., 2011). The dip in
density downstream of Ser pauses is consistent with continued elongation lengthening the
distance between the paused ribosome and downstream ribosomes. This may be evidence
of translation (and pausing) in the lysate. Another way to measure the decay of ribosome

56
density along genes is to compute the fraction of the density remaining in 200 nt
windows compared to the density at the 5’-end of the gene. Although we do not believe
that Ser pauses are a strong contributor, we do find that 10 there is less ribosome density
at the 3’-end of genes in our data compared with the 5’-end (Figure 2.S3C). For our WT1
and WT2 samples, we observe a 40% reduction of density by about 1200 nt after the start
codon. In comparison, there is a 20% reduction in density in the Li et al. 2012 data at this
position. These plots are not consistent with a loss of ribosomes from messages after Ser
codons. Simulations using the same set of genes reveal exponential decay as expected;
even a 5% loss of ribosomes after Ser codons leads to a far more rapid decay of density
than observed in our data (dotted lines, Figure 2.S3C). The simulations are perhaps
consistent with a 1% loss of ribosomes after Ser codons in the WT1 library, but the shape
of the plots provides additional clues that suggest another origin. For WT1 and WT2, the
density drops early in the gene and remains fairly constant at a plateau thereafter (Figure
2.S3C). Given that the decay curves are calculated by dividing the downstream density
by the density near the start codon, this could be explained by higher density at the 5’-end
of genes as observed in other profiling studies (Ingolia et al., 2009). The same
phenomenon can also be seen in plots of average density that include genes longer than
1200 nt aligned at the start codon (Figure 2.S3D). The 5’-ramp probably arises from
continuing initiation in the presence of imperfect elongation inhibitors (Gerashchenko
and Gladyshev, 2014). We argue that it is more likely that ribosomes continue to be
loaded at the 5’-end during the preparation of the samples (perhaps during filtering or
freezing) than it is that they are being lost from messages at strong pause sites. Most
importantly, our WT3 library has no detectable SD pauses despite the fact that it doesn’t
57
have these confounding factors. This library was prepared by a different procedure in
which we filtered the cells completely dry prior to freezing them in liquid nitrogen,
following the Weissman lab protocol, rather than scraping cells off of the filter before the
media runs dry (our usual protocol). We found that unlike the WT1 library, WT3 has no
Ser pauses (Figure 2.S2D) and no pauses that result in even a temporary loss of density
downstream. We also observed that the WT3 data showed very little decay in ribosome
density, even less than the Li 2012 data (Figure 2.S3C). The lack of apparent decay is
probably due to the fact that there is essentially no 5’-ramp (Figure 2.S3D). This may
indicate that with this cell harvesting protocol, there is less translation in the lysate.
Importantly, in this sample, even without these confounding factors, 11 we do not
observe pauses at SD motifs, whether at the –22 position in cross-correlation plots or in
the linear fit of SD affinity and ribosome density (Figures 2.S3E and 2.S3F). These
findings together refute the suggestion that we missed SD pausing due to quality issues
with our data (either from Ser pauses or loss of density along genes).
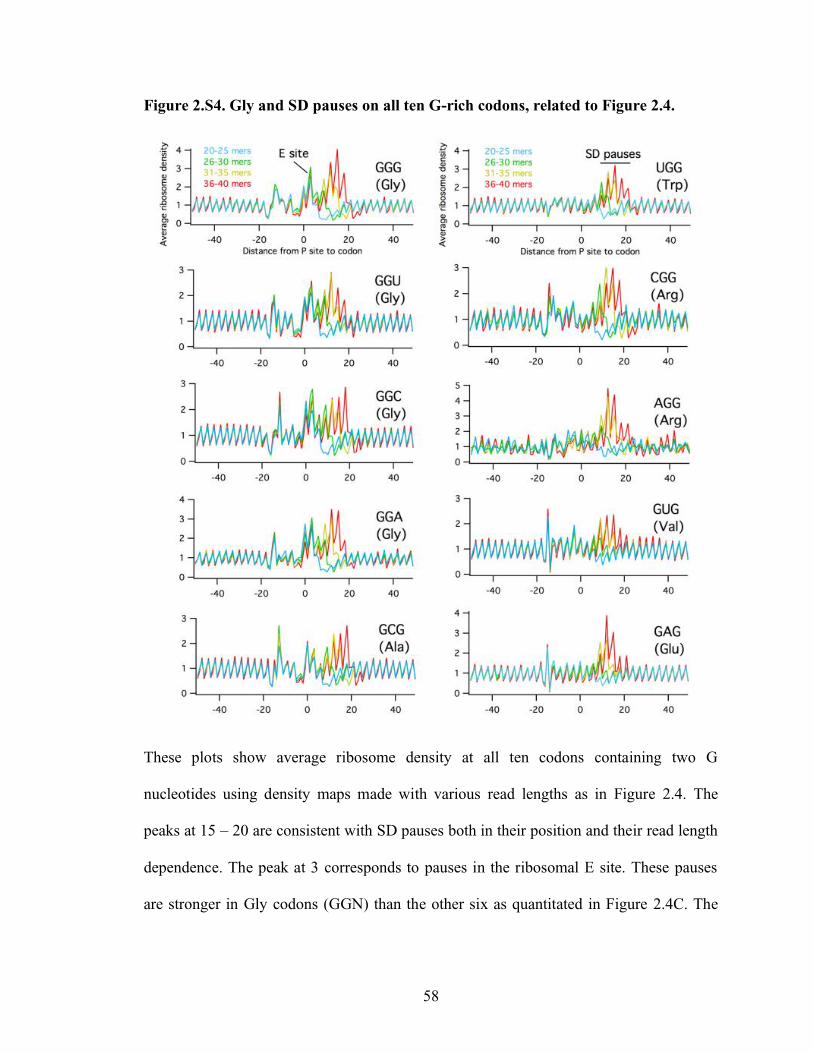
58
Figure 2.S4. Gly and SD pauses on all ten G-rich codons, related to Figure 2.4.
These plots show average ribosome density at all ten codons containing two G
nucleotides using density maps made with various read lengths as in Figure 2.4. The
peaks at 15 – 20 are consistent with SD pauses both in their position and their read length
dependence. The peak at 3 corresponds to pauses in the ribosomal E site. These pauses
are stronger in Gly codons (GGN) than the other six as quantitated in Figure 2.4C. The

59
peaks between –15 and –20 arise from cloning bias at the 3’-end of reads (see Figure
2.S1E and the peak at 0 in Figure 2.1A).
Supplemental Experimental Procedures
In vitro translation constructs: All toeprinting DNA templates start with the following 5ʹ
sequence that includes a T7 promoter, ribosome binding site, and start codon
(underlined):
CTGTACATTAATACGACTCACTATAGGGAGATTTTATAAGGAGGAAAAAATA
TG. The 3ʹ end of all templates includes a binding site for the NV1 primer,
GGTTATAATGAATTTTGCTTATTAAC. To characterize internal Shine-Dalgarno
sequences, four sites from endogenous E. coli genes were chosen, GGUGGU in both
ompF (at 420) and atpA (at 1131), GGAGGU in cyoB (at 78), and AGGAGG in mliC (at
151). In our constructs, 33 nt of the natural sequence was inserted in the correct reading
frame after a constant upstream region, with the SD-motif starting at position 13 in the 33
nt sequence. The final DNA constructs were as follows:
From ompF encoding MISVNGALPEFGGDTAYSIA-stop:
CTGTACATTAATACGACTCACTATAGGGAGATTTTATAAGGAGGAAAAAATA
TGATTTCCGTGAACGGCGCACTGCCAGAATTTGGTGGTGATACTGCATACAG
CATTGCCTAAGTAAGTAAAGATCTTAGGCGCGCC
GGATCTGCATCGTTAATAAGCAAAATTCATTATAACC
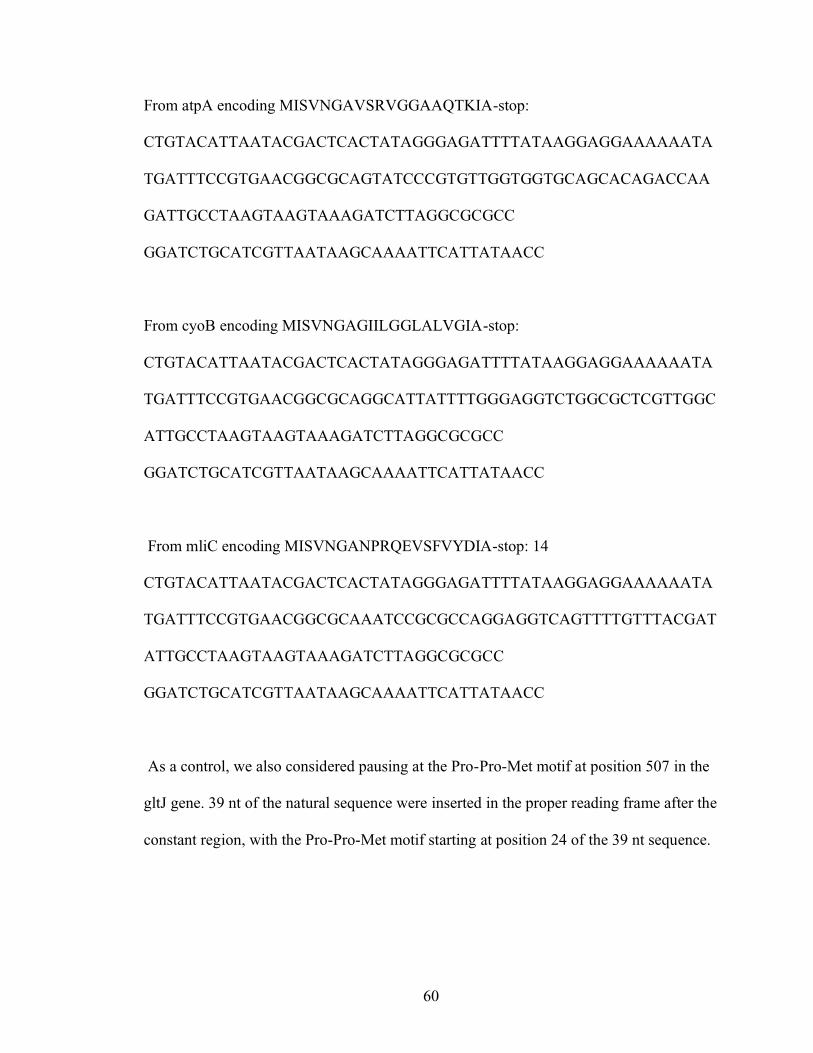
60
From atpA encoding MISVNGAVSRVGGAAQTKIA-stop:
CTGTACATTAATACGACTCACTATAGGGAGATTTTATAAGGAGGAAAAAATA
TGATTTCCGTGAACGGCGCAGTATCCCGTGTTGGTGGTGCAGCACAGACCAA
GATTGCCTAAGTAAGTAAAGATCTTAGGCGCGCC
GGATCTGCATCGTTAATAAGCAAAATTCATTATAACC
From cyoB encoding MISVNGAGIILGGLALVGIA-stop:
CTGTACATTAATACGACTCACTATAGGGAGATTTTATAAGGAGGAAAAAATA
TGATTTCCGTGAACGGCGCAGGCATTATTTTGGGAGGTCTGGCGCTCGTTGGC
ATTGCCTAAGTAAGTAAAGATCTTAGGCGCGCC
GGATCTGCATCGTTAATAAGCAAAATTCATTATAACC
From mliC encoding MISVNGANPRQEVSFVYDIA-stop: 14
CTGTACATTAATACGACTCACTATAGGGAGATTTTATAAGGAGGAAAAAATA
TGATTTCCGTGAACGGCGCAAATCCGCGCCAGGAGGTCAGTTTTGTTTACGAT
ATTGCCTAAGTAAGTAAAGATCTTAGGCGCGCC
GGATCTGCATCGTTAATAAGCAAAATTCATTATAACC
As a control, we also considered pausing at the Pro-Pro-Met motif at position 507 in the
gltJ gene. 39 nt of the natural sequence were inserted in the proper reading frame after the
constant region, with the Pro-Pro-Met motif starting at position 24 of the 39 nt sequence.

61
From gltJ encoding MISVNGAPNAYRVIVPPMTSIA-stop:
CTGTACATTAATACGACTCACTATAGGGAGATTTTATAAGGAGGAAAAAATA
TGATTTCCGTGAACGGCGCACCTAATGCTTATCGCGTTATCGTCCCGCCGATG
ACCTCAATTGCCTAAGTAAGTAAAGATCTTAGGCGCGCCGGATCTGCATCGTT
AATAAGCAAAATTCATTATAACC
Toeprinting analyses: The PURExpress system (New England Biolabs) was used for in
vitro translation. 0.2 pmol of template DNA was combined on ice with 2 μl of Solution A
and 1.5 μl of Solution B along with either 0.5 μl water or thiostrepton (0.5 mm in 5%
DMSO), then incubated at 37 °C for 30 min. 1 pmol of [32P]ATP-labeled NV1 primer
was added to each reaction along with 2 U of Ambion SUPERasin RNase Inhibitor (Life
Technologies). After incubation at 37 °C for 2 min, the samples were placed on ice for 5
min and at 25 °C for 5 min. Reverse transcription was performed by supplementing each
sample with a mixture of four dNTPs to a final concentration of 0.32 mM each, adding
2.4 U of AMV Reverse Transcriptase (Roche), and incubating at 37 °C for 15 min.
Reactions were stopped and the RNA hydrolyzed by addition of 1 μl 10 N NaOH,
incubation at 37 °C for 15 min, and neutralization with 0.8 μl 12 M HCl. Samples were
then diluted with 200 μl of extraction buffer (0.3 M Na-acetate, 0.5% SDS, 5 mM EDTA
pH 8.0) and extracted with phenol and chloroform. After ethanol precipitation, pellets
were resuspended in 6 ul of formamide-EDTA loading dye (90% formamide, 25 mM
EDTA, pH 8.0) and separated by 8% denaturing PAGE and visualized with a Typhoon
FLA 9500 (GE).
62
Supplemental References
Balakrishnan, R., Oman, K., Shoji, S., Bundschuh, R., and Fredrick, K. (2014). The
conserved GTPase LepA contributes mainly to translation initiation in Escherichia coli.
Nucleic Acids Res 42, 13370-13383.
Elgamal, S., Katz, A., Hersch, S.J., Newsom, D., White, P., Navarre, W.W., and Ibba, M.
(2014). EF-P dependent pauses integrate proximal and distal signals during translation.
PLoS Genet 10, e1004553.
Gerashchenko, M.V., and Gladyshev, V.N. (2014). Translation inhibitors cause
abnormalities in ribosome profiling experiments. Nucleic Acids Res 42, e134.
Guo, M.S., Updegrove, T.B., Gogol, E.B., Shabalina, S.A., Gross, C.A., and Storz, G.
(2014). MicL, a new sigmaE-dependent sRNA, combats envelope stress by repressing
synthesis of Lpp, the major outer membrane lipoprotein. Genes & development 28, 1620-
1634.
Haft, R.J., Keating, D.H., Schwaegler, T., Schwalbach, M.S., Vinokur, J., Tremaine, M.,
Peters, J.M., Kotlajich, M.V., Pohlmann, E.L., Ong, I.M., et al. (2014). Correcting direct
effects of ethanol on translation and transcription machinery confers ethanol tolerance in
bacteria. Proc Natl Acad Sci U S A 111, E2576-2585.
Ingolia, N.T., Ghaemmaghami, S., Newman, J.R., and Weissman, J.S. (2009). Genome-
wide analysis in vivo of translation with nucleotide resolution using ribosome profiling.
Science 324, 218-223.
Ingolia, N.T., Lareau, L.F., and Weissman, J.S. (2011). Ribosome profiling of mouse
embryonic stem cells reveals the complexity and dynamics of mammalian proteomes.
Cell 147, 789-802.
Kannan, K., Kanabar, P., Schryer, D., Florin, T., Oh, E., Bahroos, N., Tenson, T.,
Weissman, J.S., and Mankin, A.S. (2014). The general mode of translation inhibition by
macrolide antibiotics. Proc Natl Acad Sci U S A 111, 15958-15963.
Li, G.W., Burkhardt, D., Gross, C., and Weissman, J.S. (2014). Quantifying absolute
protein synthesis rates reveals principles underlying allocation of cellular resources. Cell
157, 624-635.
Li, G.W., Oh, E., and Weissman, J.S. (2012). The anti-Shine-Dalgarno sequence drives
translational pausing and codon choice in bacteria. Nature 484, 538-541.
Liu, X., Jiang, H., Gu, Z., and Roberts, J.W. (2013). High-resolution view of
bacteriophage lambda gene expression by ribosome profiling. Proc Natl Acad Sci U S A
110, 11928-11933. 16

63
Oh, E., Becker, A.H., Sandikci, A., Huber, D., Chaba, R., Gloge, F., Nichols, R.J., Typas,
A., Gross, C.A., Kramer, G., et al. (2011). Selective ribosome profiling reveals the
cotranslational chaperone action of trigger factor in vivo. Cell 147, 1295-1308.
Pruss, B.M., Nelms, J.M., Park, C., and Wolfe, A.J. (1994). Mutations in
NADH:ubiquinone oxidoreductase of Escherichia coli affect growth on mixed amino
acids. J Bacteriol 176, 2143- 2150.
Sezonov, G., Joseleau-Petit, D., and D'Ari, R. (2007). Escherichia coli physiology in
Luria-Bertani broth. J Bacteriol 189, 8746-8749.
Subramaniam, A.R., Zid, B.M., and O'Shea, E.K. (2014). An integrated approach reveals
regulatory controls on bacterial translation elongation. Cell 159, 1200-1211.
Woolstenhulme, C.J., Guydosh, N.R., Green, R., and Buskirk, A.R. (2015). High-
precision analysis of translational pausing by ribosome profiling in bacteria lacking EFP.
Cell reports 11, 13-21.
64
Chapter 3:
A systematically revised ribosome profiling
method for bacteria reveals pauses at single codon
resolution
Fuad Mohammad1 , Rachel Green1,2, Allen R. Buskirk1
1Department of Molecular Biology and Genetics and 2 Howard Hughes Medical Institute,
Johns Hopkins University School of Medicine, 725 N. Wolfe Street, Baltimore, MD,
21205, USA. .

65
3.1 Abstract
In eukaryotes, ribosome profiling provides insight into the mechanism of protein
synthesis at the codon level. In bacteria, however, the method has been more problematic
and no consensus has emerged for how to best prepare profiling samples. In this chapter,
we identify the sources of these problems and describe new solutions for arresting
translation and harvesting cells in order to overcome them. These improvements remove
confounding artifacts and improve the resolution to allow analyses of ribosome behavior
at the codon level. With a clearer view of the translational landscape in vivo, we observe
that filtering cultures leads to translational pauses at serine and glycine codons through
the reduction of tRNA aminoacylation levels. This observation illustrates how bacterial
ribosome profiling studies can yield insight into the mechanism of protein synthesis at the
codon level and how these mechanisms are regulated in response to changes in the
physiology of the cell.
3.2 Background
Local elongation rates vary considerably during protein synthesis depending on
the codon, amino acid sequence, and mRNA structure. These variations can have
dramatic effects on gene expression. Stretches of codons in leader peptides that are
translated slowly under starvation conditions, for example, regulate the transcription of
downstream biosynthesis genes (e.g. in the E. coli trp operon) (Yanofsky, 1981). In a
similar manner, rare codons in structural genes have been implicated in fine-tuning
translational rates in order to favor proper protein folding (Kim et al., 2015; Kimchi-
Sarfaty et al., 2007; Komar, 2009; Zhou et al., 2013). The amino acid sequence of the

66
nascent polypeptide can also alter elongation rates. Interactions between side chains and
the exit tunnel can rearrange nucleotides within the peptidyl-transferase center, locking
the ribosome in an inactive conformation (Ito and Chiba, 2013). For example, the E.
coli SecM peptide uses stalling as a key feature in an elegant genetic switch in which
stalling leads to changes in the local mRNA structure that promote translation of the
downstream secA gene (Nakatogawa and Ito, 2002). Just as elongation can reshape
mRNA structures, the converse is also true: strong mRNA structures can pause ribosomes
and trigger rescue pathways associated with ribosome stalling and arrest (Doma and
Parker, 2006). Although codon usage, amino acid sequence, and mRNA structure have
each been shown to affect local elongation rates, our current understanding of these
various features is insufficient to predict their effects on single genes, let alone across the
genome.
In principle, ribosome profiling has the capacity to reveal pausing sites throughout
the transcriptome with unprecedented clarity. In this approach, the positions of ribosomes
on mRNAs are determined by sequencing ribosome-protected mRNA fragments (RPFs)
(Ingolia et al., 2009); an increase in ribosome density at a site relative to its local context
is evidence of a slower elongation rate (Ingolia et al., 2011). In practice, however,
reliably detecting pauses in ribosome profiling data from bacterial samples has been
challenging because the methods used to arrest translation and harvest cells perturb the
position of ribosomes, thus obscuring the in vivo translational landscape. Although these
problems are not well characterized for the bacterial system, they have been carefully
documented in several important studies in yeast. In the earliest yeast protocols, the
eukaryotic elongation inhibitor cycloheximide (CHX) was added directly to cultures prior
67
to harvesting the cells by centrifugation. It soon became clear that this method introduces
several artifacts (Gerashchenko and Gladyshev, 2014). First, ribosome occupancy is
enriched at the 5’-end of coding sequences and within upstream open reading frames
because initiation continues during CHX treatment even though elongation is blocked.
Second, because cycloheximide binding is reversible, when it falls off, ribosomes restart
elongation only to be arrested again upon rebinding, blurring the position of the ribosome
at the codon level (Hussmann et al., 2015). Finally, and perhaps most importantly,
translational distress that is caused by cycloheximide may trigger a host of biological
changes during the growth period, further obscuring the biology of interest in the
samples. For these reasons, most researchers now prefer to harvest yeast by rapid
filtration, adding cycloheximide to the lysis buffer only, not directly to growing cultures.
Although it is difficult a priori to predict how ribosome density should look in vivo, the
fact that yeast studies now report a negative correlation between codon usage and
ribosome density (rare codons show higher levels of ribosome density consistent with the
idea that they are decoded more slowly) argues that these improvements capture
differences in elongation rates that were obscured by the earlier methods (Hussmann et
al., 2015; Weinberg et al., 2016). With the additional refinements we recently reported
for eukaryotic ribosome profiling, the negative correlation between codon usage and
ribosome density is even more pronounced (Wu et al., 2019).
Although these improvements have made it possible to observe translational
pauses with high resolution in yeast and other higher eukaryotes, these and other
problems persist in bacterial ribosome profiling studies, limiting them to low resolution
and masking the true in vivo translational landscape. To address these limitations, we
68
have systematically optimized the ribosome profiling protocol to improve resolution in
order to gain insights into the mechanism of protein synthesis in bacteria. Here, we report
that the methods used to arrest translation and harvest cells are generally more
problematic in bacteria than in yeast, blurring the signal and even inducing sequence-
specific pauses. We developed new techniques to flash-freeze cultures and arrest
translation robustly without the use of antibiotics. With these new methods, we obtain
robust single-codon resolution in profiling samples from bacteria for the first time: for
example, experimentally-induced pauses become crystal clear, appearing only in the
ribosomal A site when decoding for a particular tRNA is rate-limiting, rather than
blurring over several codons as before. We further found with this increased resolution
that filtering E. coli cultures induces pauses at Ser and Gly codons as the corresponding
tRNAs are no longer adequately aminoacylated. In describing our improvements to the
profiling protocol, we survey the wide variety of methods used to generate profiling
libraries from E. coli—unlike the case with yeast, no consensus has emerged to date—
and make a case for what we believe to be ‘best practices.’ By bringing together these
improvements in one place, we hope to help the bacterial research community to
capitalize on the potential of ribosome profiling to yield insight into the molecular
mechanisms of protein synthesis and the regulation of these mechanisms as a function of
changes in the physiology of the cell.
3.3 Results: How to handle ribosomal footprints of various lengths
The 3’-end of footprints gives the best information about ribosome position
Ribosome profiling libraries in S. cerevisiae routinely show single-codon
resolution and strong three nucleotide (nt) periodicity arising from the translocation of

69
ribosomes along the mRNA one codon at a time (Ingolia et al., 2009). These features of
the data are clearly evident in plots of average ribosome density across thousands of
genes aligned at their start codons (Figure 3.1A, blue). In stark contrast, an equivalent
plot with typical E. coli profiling data shows a diffuse peak at the start codon, roughly 20
nt wide, with no evidence of 3 nt periodicity arising from the reading frame of the
ribosome (Figure 3.1A, E. coli (center), grey). The primary reason that the E. coli data
are blurry is that bacterial ribosome protected mRNA fragments (RPFs) show a broad
distribution in length, from 15 to 40 nt, whereas the majority of yeast RPFs are 28 nt long
(Figure 3.1B). Because these 28 nt reads are fully trimmed by RNase I to the 5’ and 3’-
boundaries of the ribosome, the position of yeast ribosomes can be reliably determined
from either end of the read. Faced with the difficulties posed by RPFs of variable lengths,
the first bacterial profiling studies took an agnostic approach, distributing ribosome
density broadly across the center of the reads (Li et al., 2012; Oh et al., 2011). Following
this early protocol, most subsequent profiling studies in E. coli have used this center-
assignment strategy, immediately limiting the resolution of the data. There is a better
way: we and others found that the position of the ribosome can be more accurately
inferred from the 3’-end of bacterial RPFs (Balakrishnan et al., 2014; Nakahigashi et al.,
2014; Woolstenhulme et al., 2015). In data analyzed this way, the start codon peak is
only 1–2 nt wide (Figure 3.1A, black). This higher resolution allows us to identify the
codon positioned in the ribosomal A site so that analyses of pausing during starvation or
upon depletion of translation factors can be performed at the codon level with greater
precision (Woolstenhulme et al., 2015). Although it is tempting to interpret the three nt
periodicity in these data as evidence of reading frame, as observed in yeast (Figure 3.1A,
70
blue), this periodicity arises from the specificity of the nuclease used to generate RPFs,
and not from the ribosome, as discussed below.
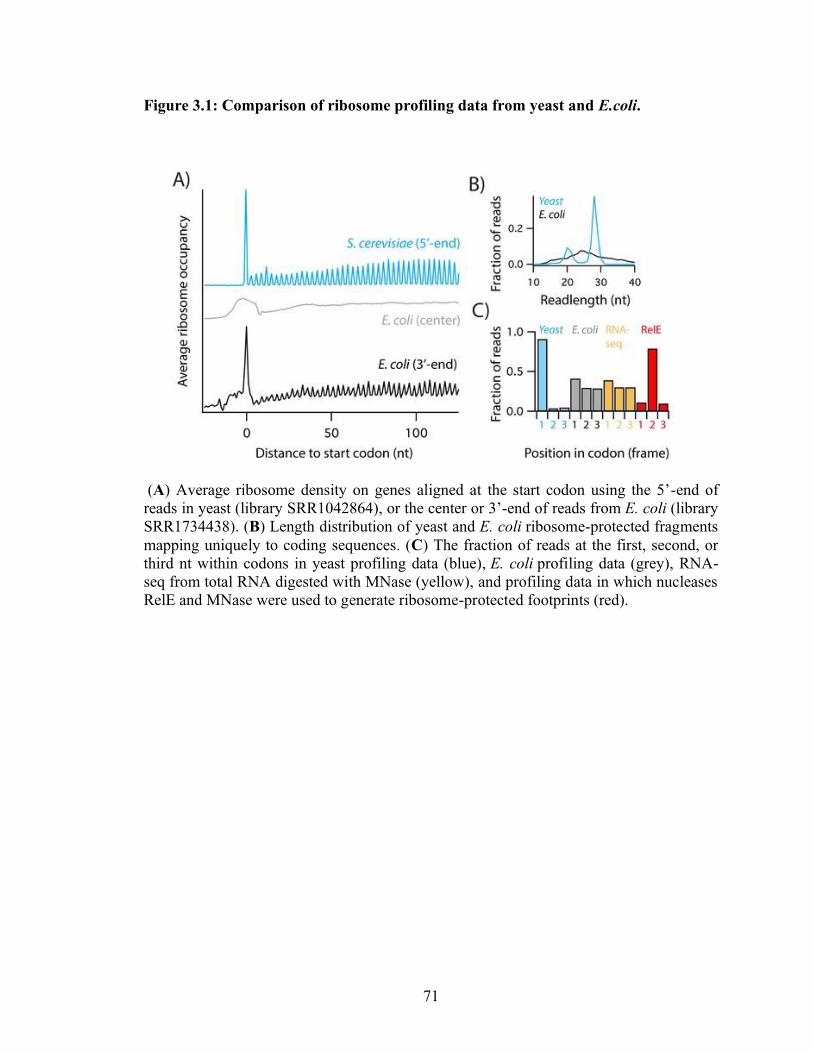
71
Figure 3.1: Comparison of ribosome profiling data from yeast and E.coli.
(A) Average ribosome density on genes aligned at the start codon using the 5’-end of
reads in yeast (library SRR1042864), or the center or 3’-end of reads from E. coli (library
SRR1734438). (B) Length distribution of yeast and E. coli ribosome-protected fragments
mapping uniquely to coding sequences. (C) The fraction of reads at the first, second, or
third nt within codons in yeast profiling data (blue), E. coli profiling data (grey), RNA-
seq from total RNA digested with MNase (yellow), and profiling data in which nucleases
RelE and MNase were used to generate ribosome-protected footprints (red).
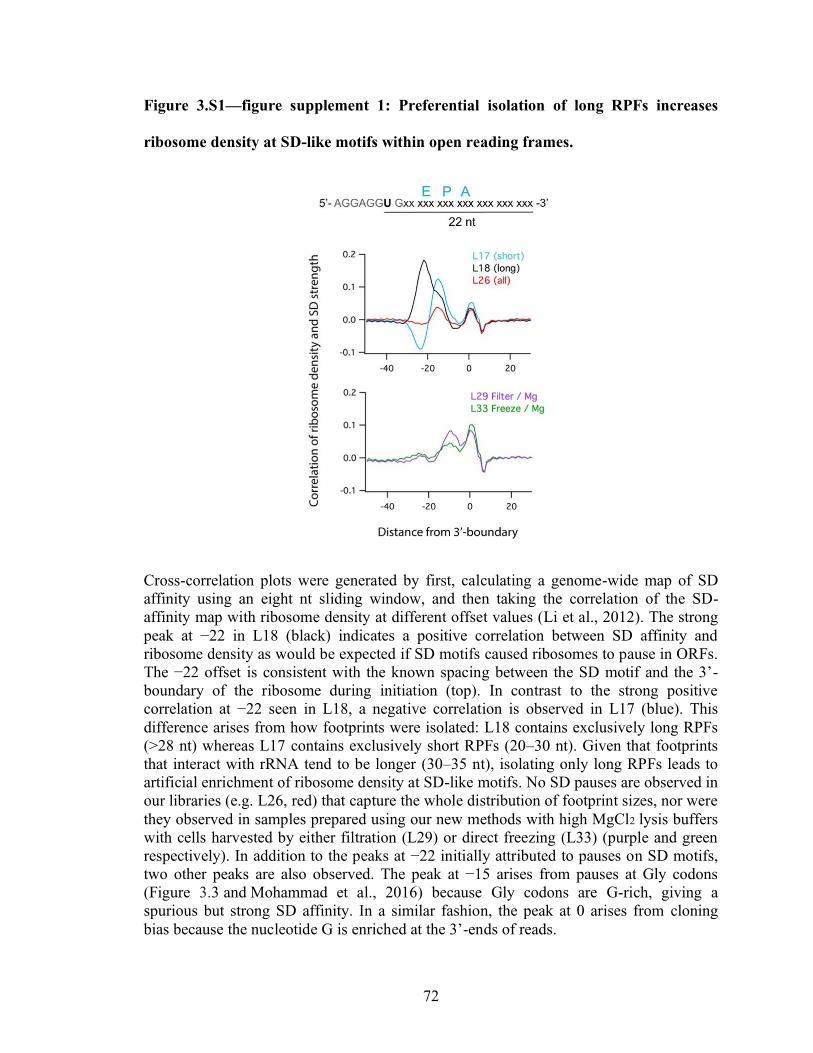
72
Figure 3.S1—figure supplement 1: Preferential isolation of long RPFs increases
ribosome density at SD-like motifs within open reading frames.
Cross-correlation plots were generated by first, calculating a genome-wide map of SD
affinity using an eight nt sliding window, and then taking the correlation of the SD-
affinity map with ribosome density at different offset values (Li et al., 2012). The strong
peak at −22 in L18 (black) indicates a positive correlation between SD affinity and
ribosome density as would be expected if SD motifs caused ribosomes to pause in ORFs.
The −22 offset is consistent with the known spacing between the SD motif and the 3’-
boundary of the ribosome during initiation (top). In contrast to the strong positive
correlation at −22 seen in L18, a negative correlation is observed in L17 (blue). This
difference arises from how footprints were isolated: L18 contains exclusively long RPFs
(>28 nt) whereas L17 contains exclusively short RPFs (20–30 nt). Given that footprints
that interact with rRNA tend to be longer (30–35 nt), isolating only long RPFs leads to
artificial enrichment of ribosome density at SD-like motifs. No SD pauses are observed in
our libraries (e.g. L26, red) that capture the whole distribution of footprint sizes, nor were
they observed in samples prepared using our new methods with high MgCl2 lysis buffers
with cells harvested by either filtration (L29) or direct freezing (L33) (purple and green
respectively). In addition to the peaks at −22 initially attributed to pauses on SD motifs,
two other peaks are also observed. The peak at −15 arises from pauses at Gly codons
(Figure 3.3 and Mohammad et al., 2016) because Gly codons are G-rich, giving a
spurious but strong SD affinity. In a similar fashion, the peak at 0 arises from cloning
bias because the nucleotide G is enriched at the 3’-ends of reads.
73
On the sequence specificity of nucleases
Bacterial studies (Li et al., 2012; Oh et al., 2011) use MNase to generate RPFs
because RNase I, the nuclease used in yeast and many higher organisms, is an E.
coli enzyme and is inhibited by E. coli ribosomes (Kitahara and Miyazaki, 2011). (In our
hands, even 10,000 units of RNase I, an entire tube, did not collapse E. colipolysomes to
monosomes on a sucrose gradient). Unfortunately, unlike RNase I, MNase shows
significant sequence specificity (Dingwall et al., 1981). Due to this specificity, and to a
lesser extent the ligases used in generating cDNA libraries, ribosome profiling data
exhibit a high level of noise. The peaks in ribosome density across a single gene may
vary in height by 1000-fold or more. For some datasets, nucleotide bias at the 5’- and 3’-
ends of RPFs accounts for more of this variation than the identity of the codon in the A
site of the ribosome (O'Connor et al., 2016). To minimize the effects of these artifacts, we
average ribosome density over thousands of instances of a site of interest (such as Pro
codons) (Woolstenhulme et al., 2015). We also routinely compare ribosome profiling
data to total RNA-seq samples prepared using the same protocol (Hwang and Buskirk,
2017; Mohammad et al., 2016). In addition, several sophisticated computational methods
have been developed to minimize the effects of cloning bias (O'Connor et al., 2016) and
adjust the ribosome density by taking into account the specificity of MNase (Zhao et al.,
2018). In analyzing ribosome profiling data, care must be taken to avoid mistaking
technical artifacts for real biology.
As an example of the problems that sequence bias can cause, consider the following: E.
coli data show a modest three nt periodicity (Figure 3.1A, black) that could easily be
misinterpreted as the movement of ribosomes along transcripts one codon at a time.
74
Unlike the yeast data, where > 90% of reads align to the first nt of codons (Figure 3.1C,
blue), however, the periodicity in E. coli is quite weak: 40% of reads align to the first nt,
30% to the second, and 30% to the third (Figure 3.1C, grey). In previous work, we
showed that the periodicity in the E. coli data primarily arises from artifacts of the
nuclease digestion and not from the reading frame of the ribosome (Hwang and Buskirk,
2017). MNase cleaves more efficiently before A and T. Because codons are used at
different frequencies, A and T occur more often than expected at the second nt of codons
in the E. coli genome. Together, this bias in the genome and the sequence specificity of
MNase yield the weak periodicity seen in ORFs in Figure 3.1A (black) and 1C (grey).
We verified this hypothesis in an earlier study (Hwang and Buskirk, 2017), finding that
total RNA-seq samples prepared by MNase digestion show the same weak periodicity
exclusively in ORFs even in the absence of intact ribosomes (Figure 3.1C, yellow).
For studies where the reading frame of the ribosome is essential, such as studies
of programmed frameshifting, we reported that generating RPFs with the endonuclease
RelE can reveal three nt periodicity in E. coli profiling samples (Hwang and Buskirk,
2017) (Figure 3.1C, red). This is because RelE only cleaves mRNA inside the ribosome,
precisely after the second nt of the A-site codon (Pedersen et al., 2003). On the other
hand, RelE also shows strong sequence specificity (Hwang and Buskirk, 2017), and
because we assign ribosome positions from the 3’-end of ribosome footprints, this
specificity introduces bias at the A-site codon that interferes with analyses of pausing. In
contrast, because MNase cleaves at the 3’-boundary of the ribosome, roughly 12 nt away
from the A site, its sequence selectivity creates little or no bias at the A site when
averaged over many instances of a codon of interest. In short, RelE yields excellent
75
reading frame, and so is useful for analyses of frameshifting and stop-codon readthrough,
but because it interferes with pausing analyses, we continue to use MNase in the studies
described below.
On the importance of isolating all ribosomal footprint lengths
Why do bacterial RPFs vary so much in length? Some have argued that the
sequence specificity of MNase prevents it from fully digesting back to the ribosome
boundaries. While MNase is partially responsible for the poor three nt periodicity of
bacterial ribosome profiling data, it cannot be blamed for the large differences in read
lengths. MNase does reliably degrade mRNA to within 1–2 nt of the 3’-boundary of the
ribosome; this is why 3’ alignment of RPFs is so good at revealing codon resolution.
While this small amount of variability does interfere with analyses of reading frame, it
does not provide an explanation for the broad distribution in RPF length observed in E.
coli samples (Figure 3.1B). Another finding exculpating MNase is that yeast profiling
libraries generated with MNase show a tight distribution of RPFs centered at 28 nt very
much like those generated with RNase I (Gerashchenko and Gladyshev, 2017). An
important clue to the heterogeneity of bacterial RPFs comes from our unpublished studies
in B. subtilis. There, we generated ribosome profiling libraries using RNase I, which is
not inhibited by B. subtilis ribosomes, and observed very broad read length distributions
similar to those obtained from E. coli (data not shown). These observations argue that the
factor responsible for the heterogeneity of RPF lengths in bacteria is not the nuclease, but
instead something inherent to bacterial ribosomes.
Eukaryotic ribosomes protect different lengths of mRNA from nuclease digestion
at different states in the translation cycle. For example, elongating ribosomes primarily
76
yield 28 nt RPFs when CHX is used to arrest translation whereas terminating ribosomes
(with stop codons in their A sites) yield RPFs one nt longer due to changes in the mRNA
conformation induced by release factors (Brown et al., 2015; Ingolia et al., 2011).
Ribosomes trapped at the end of truncated mRNA species (generated by nuclease activity
in the cell) yield 16 nt RPFs that have yielded much information about various mRNA
decay processes (Guydosh and Green, 2014; Guydosh et al., 2017; Guydosh and Green,
2017). In addition to the well-characterized 28 nt RPFs, elongating ribosomes also
generate 21 nt RPFs in eukaryotes (Figure 3.1B) (Lareau et al., 2014). Recent studies
indicate that 21 nt RPFs arise from mRNA cleavage by RNase I within the ribosome just
downstream of the A-site codon when the A site is devoid of tRNA (Wu et al., 2019). In
contrast, ribosomes in the hybrid or pre-translocation state still carry tRNA in the 40S A
site that blocks RNase I activity within the ribosome, yielding 28 nt RPFs trimmed to the
ribosome boundaries. These differences in footprint size in yeast will be powerful clues
that allow researchers to determine the specific functional state of the ribosome at a given
site.
Much less is known about the sources of variability in footprint length in bacterial
studies. Given that the distribution of RPF lengths is very wide and that we do not fully
understand why, it is troubling that there is no consensus in bacterial studies about the
size of RPFs that should be isolated and sequenced, as can be seen in 25 representative
libraries from different labs shown in Figure 3.2 (Baggett et al., 2017; Burkhardt et al.,
2017; Haft et al., 2014; Latif et al., 2015; Li et al., 2014; Li et al., 2012; Liu et al.,
2013; Marks et al., 2016; Oh et al., 2011; Subramaniam et al., 2014). The earliest
bacterial studies (Li et al., 2012; Oh et al., 2011) isolated RPFs 28–42 nt in length (e.g.
77
libraries L9-10, L18-19) and many later studies followed this early protocol,
preferentially isolating long RPFs (L21-L24), whereas others have preferentially isolated
shorter RPFs (L15-17). We argue that the best approach is to cast a wide net, isolating all
potentially relevant RPFs, 15–40 nt in length. In our hands and in others (Li et al., 2014),
such a preparation yields a broad distribution of RPFs with a peak at 24 nt (e.g. libraries
L1 and L20).

78
Figure 3.2: Heat map of the distribution of read lengths in
published E.coli ribosome profiling libraries from several labs.
Heatmap depicts distribution of read size, from 15 nt to 40 nt, of ribosome profiling
libraries sourced from previously published papers.

79
Casting a wide net to isolate the entire footprint distribution is essential to ensure
an accurate representation of ribosomes in various stages of the translational cycle. In an
earlier study, we showed, for example, that 70S ribosomes on start codons yield RPFs
that are significantly longer (30–35 nt) than RPFs from elongating ribosomes in open
reading frames (Mohammad et al., 2016). It is possible that the presence of initiation
factors in newly assembled 70S complexes results in longer RPFs, but we favor a model
in which direct mRNA-rRNA interactions protect additional mRNA from digestion by
MNase. As expected from such an interaction between the Shine-Dalgarno motif and the
anti-SD sequence in 16S rRNA, the extra length in RPFs at start codons is found at the
5’-end of the read. This explains why the 5’-ends of RPFs are more variable and why
assigning the ribosome position by the 3’-end of the read is more precise. Consistent with
this hypothesis, RPFs observed on SD-like motifs within open reading frames are also
longer on average (O'Connor et al., 2013). At these internal sites, far from start codons,
ribosomes should no longer be bound to initiation factors, thus arguing that the mRNA-
rRNA base-pairing is primarily responsible for protecting mRNA and yielding longer
RPFs, as discussed previously (Mohammad et al., 2016).
This effect of mRNA-rRNA base pairing on footprint length explains the early
observation that SD-like motifs in open reading frames induce ribosome pausing. In one
of the first bacterial ribosome profiling papers (Li et al., 2012), strong enrichment of
ribosome density led to the conclusion that SD-like motifs are the main source of
translational pauses in bacteria. We argued (Mohammad et al., 2016) that this observation
arose from a biased sampling of the relevant RPFs: long footprints were selectively
isolated in the original study (L18), yielding a positive correlation between ribosome

80
density and the strength of internal SD-like motifs (Li et al., 2012), but in other libraries
where short footprints were selectively isolated (e.g. L17), there is actually a negative
correlation (Figure 3.S1). Given that RPFs that base pair with rRNA tend to be longer
(30–35 nt) (O'Connor et al., 2013), isolating only longer RPFs leads to artificial
enrichment of ribosome density at SD-like motifs (Mohammad et al., 2016). Pauses at
SD-like motifs are not observed in our libraries, including new ones prepared with the
improvements described below (Figure 3.S1), nor were they detectable in various
biochemical assays (Borg and Ehrenberg, 2015; Chadani et al., 2016; Mohammad et al.,
2016). These data suggest that SD pauses are an artifact of the method, highlighting the
importance of isolating an unbiased population of RPFs.
3.4 Results: Inhibiting translation without inducing artifacts
Chloramphenicol in the media induces artifacts at the gene level
A critical consideration in the preparation of ribosome profiling libraries is how
ribosomes are trapped to most accurately preserve their position during harvesting, cell
lysis, and mRNA digestion. In the same way that CHX was initially added to yeast
cultures to arrest translation prior to harvesting cells by centrifugation (Ingolia et al.,
2009), some bacterial studies have followed a similar strategy, adding the elongation
inhibitor chloramphenicol (Cm) to the growing culture (L1-L10, Figure 3.3A). As was
observed (Gerashchenko and Gladyshev, 2014) in yeast grown in CHX, the addition of
Cm to bacterial cultures skews the translational profiles because initiation continues even
as the antibiotic arrests elongation, leading to an accumulation of ribosome density at the
5’-end of ORFs. This can be seen when we compute asymmetry scores for each gene by
taking the log2 of the ratio of ribosome density in the second half of the gene over the

81
density in the first half; using this metric, genes with more ribosomes in the first half
yield negative values. The distribution of asymmetry scores for thousands of genes
shown in Figure 3.3B reveals that ribosome density is strongly enriched in the first half of
the majority of genes in samples where Cm is added to the media (L1-L10). This artifact
affects genes differently depending on their length, artificially inflating the number of
reads per kilobase per million mapped reads (RPKM) for short genes and reducing
RPKM values for long genes (Figure 3.S3). It particularly complicates estimates of the
amount of translation of leader peptides and other non-canonical sites (Gerashchenko and
Gladyshev, 2014). Simply comparing experimental and control cultures that are both
treated with antibiotics does not resolve these issues. Control samples may be affected by
antibiotics differently from experimental samples harboring a mutation or growing under
different conditions, even if the antibiotic treatment and downstream sample handling
steps are identical.
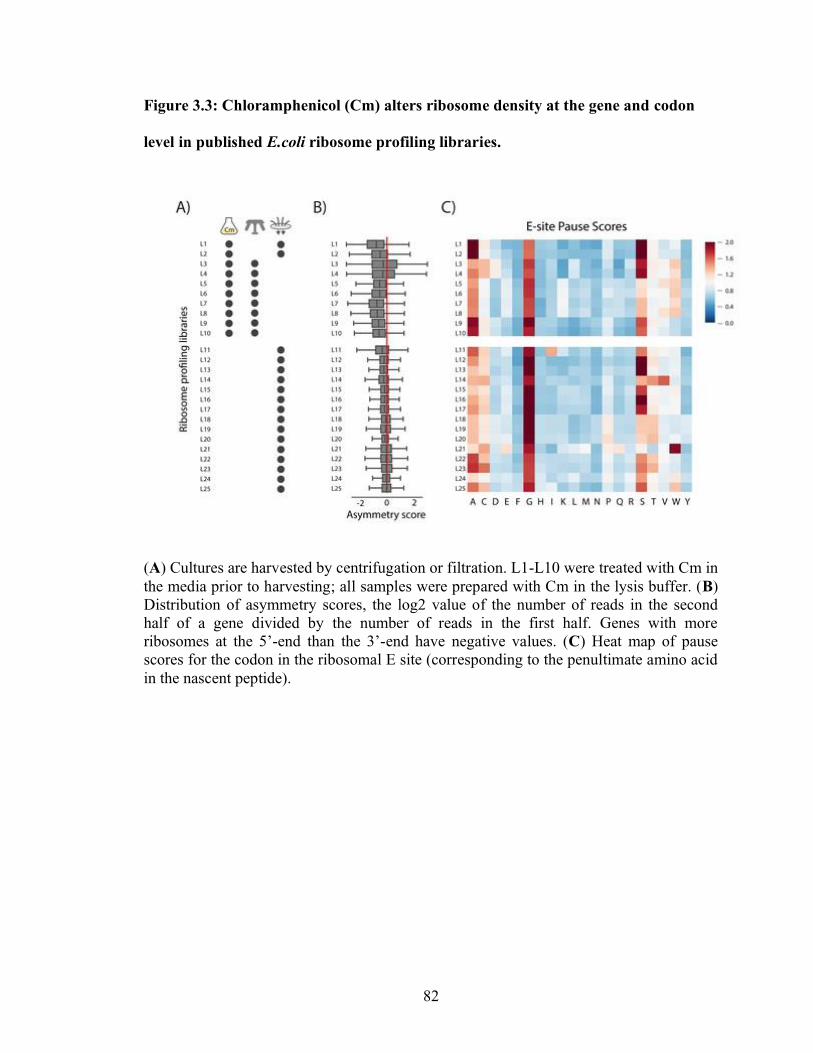
82
Figure 3.3: Chloramphenicol (Cm) alters ribosome density at the gene and codon
level in published E.coli ribosome profiling libraries.
(A) Cultures are harvested by centrifugation or filtration. L1-L10 were treated with Cm in
the media prior to harvesting; all samples were prepared with Cm in the lysis buffer. (B)
Distribution of asymmetry scores, the log2 value of the number of reads in the second
half of a gene divided by the number of reads in the first half. Genes with more
ribosomes at the 5’-end than the 3’-end have negative values. (C) Heat map of pause
scores for the codon in the ribosomal E site (corresponding to the penultimate amino acid
in the nascent peptide).

83
Figure 3.S3—figure supplement 1 Treating cultures with Cm prior to harvesting
skews estimates of protein synthesis levels in different ways depending on the gene
length.
(A) We ranked genes by length and divided them into six subsets with between 460–470
genes in each set. We took the ratio of footprints per gene (RPKM) for a sample treated
with Cm in the media (L1) compared with a similar sample without Cm treatment (L26).
Both samples were filtered and prepared using the standard protocol. (B) We performed
the same analysis using two samples without Cm in the media as a control.

84
To avoid these artifacts, protocols now recommend collecting cells by rapid
filtration and freezing in liquid nitrogen, thus arresting translation by freezing cells rather
than by adding antibiotics prior to centrifugation (L11-L25, Figure 3.3A) (Becker et al.,
2013). Even in the first bacterial ribosome profiling study (Oh et al., 2011), the authors
observed that filtration removed Cm-induced distortions in the data. Our standard
protocol has been to pour 200 mL of a culture that has reached OD600 = 0.3 into a vacuum
filtration apparatus; as the cells accumulate on the membrane, and before the media has
completely passed through, we scrape the cells off and plunge them into liquid nitrogen.
Because this procedure is quick (about 30 s of filtration), we have hoped that translation
is not disrupted prior to freezing. The rapidly frozen samples are then cryogenically lysed
in a cryo-mill together with frozen lysis buffer; the buffer contains Cm so that translation
will not resume in the lysate as the samples are thawed and processed. In libraries from
many labs prepared in this fashion (L11-L25), the asymmetry scores are close to zero
(Figure 3.3B), meaning that ribosome density is evenly distributed across each gene
rather than being enriched near the 5’-end. The mean asymmetry scores from these
libraries were significantly less skewed than those from the Cm pre-treated libraries L1-
L10 (two-tailed, independent t-test, p=1.7×10⁻⁷). As observed in yeast, rapid filtering and
freezing provides the means to harvest cultures without pre-treatment with antibiotics,
eliminating a host of associated problems.
Chloramphenicol also induces artifacts at the codon level
While rapid filtration and freezing allow Cm to be eliminated from growing
cultures, protocols still include Cm in the lysis buffer to prevent ongoing translation.
Although Cm has been widely assumed to be a general translation inhibitor, recent

85
ribosome profiling and toeprinting studies have revealed that Cm inhibits translation in a
sequence-specific manner that alters the pausing landscape at the codon level (Marks et
al., 2016; Mohammad et al., 2016; Nakahigashi et al., 2014; Orelle et al., 2013). These
studies have shown that the ability of Cm to inhibit the peptidyl-transfer reaction depends
on which amino acids are in the nascent chain, especially the identity of the penultimate
residue. In profiling data, Cm-dependent pauses are observed at the codon in the
ribosomal E site (which encodes the penultimate residue). These effects are quantitated as
pause scores for each amino acid in the E site, calculated by taking the ribosome density
at the appropriate codons divided by the average density on a given gene; as such, these
values reflect an average of individual pause scores for thousands of sites (an average or
‘meta’ analysis). As expected based on the earlier studies, in samples where Cm is added
to the media to arrest translation (L1-10), we observe strong pauses when Ala, Gly, and
Ser codons are positioned in the E site (Figure 3.3C). These pauses make sense
structurally because Cm binds within the active site of the ribosome, blocking peptidyl
transfer (Dunkle et al., 2010). Having small side chains in the residues of the nascent
chain near the active site likely facilitates Cm binding and activity.
We also calculated pause scores for libraries from several different labs to see
what effect Cm has when present only in the lysate to prevent ongoing translation (L11-
25). Although the intensity varies, these libraries all show E site pausing at the same
codons (Ala, Gly, and Ser) as observed in samples where Cm was added to the media
(L1-10). Despite the clear improvements that came with rapid filtration and freezing, we
were disappointed to find that even when Cm is only present in the lysis buffer, there
remained Cm signatures that seemed likely to obscure the visualization of naturally-
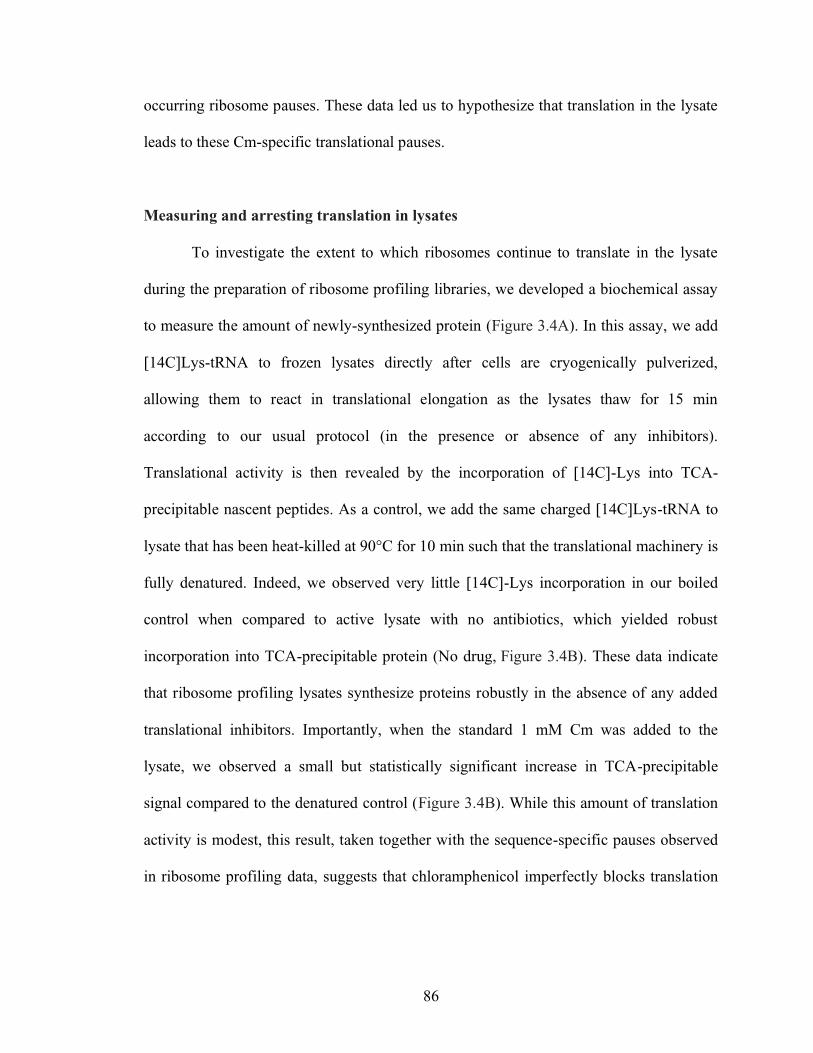
86
occurring ribosome pauses. These data led us to hypothesize that translation in the lysate
leads to these Cm-specific translational pauses.
Measuring and arresting translation in lysates
To investigate the extent to which ribosomes continue to translate in the lysate
during the preparation of ribosome profiling libraries, we developed a biochemical assay
to measure the amount of newly-synthesized protein (Figure 3.4A). In this assay, we add
[14C]Lys-tRNA to frozen lysates directly after cells are cryogenically pulverized,
allowing them to react in translational elongation as the lysates thaw for 15 min
according to our usual protocol (in the presence or absence of any inhibitors).
Translational activity is then revealed by the incorporation of [14C]-Lys into TCA-
precipitable nascent peptides. As a control, we add the same charged [14C]Lys-tRNA to
lysate that has been heat-killed at 90°C for 10 min such that the translational machinery is
fully denatured. Indeed, we observed very little [14C]-Lys incorporation in our boiled
control when compared to active lysate with no antibiotics, which yielded robust
incorporation into TCA-precipitable protein (No drug, Figure 3.4B). These data indicate
that ribosome profiling lysates synthesize proteins robustly in the absence of any added
translational inhibitors. Importantly, when the standard 1 mM Cm was added to the
lysate, we observed a small but statistically significant increase in TCA-precipitable
signal compared to the denatured control (Figure 3.4B). While this amount of translation
activity is modest, this result, taken together with the sequence-specific pauses observed
in ribosome profiling data, suggests that chloramphenicol imperfectly blocks translation
87
when added to the lysis buffer, leading to the sequence-specific pausing that we observe
in ribosome profiling libraries.
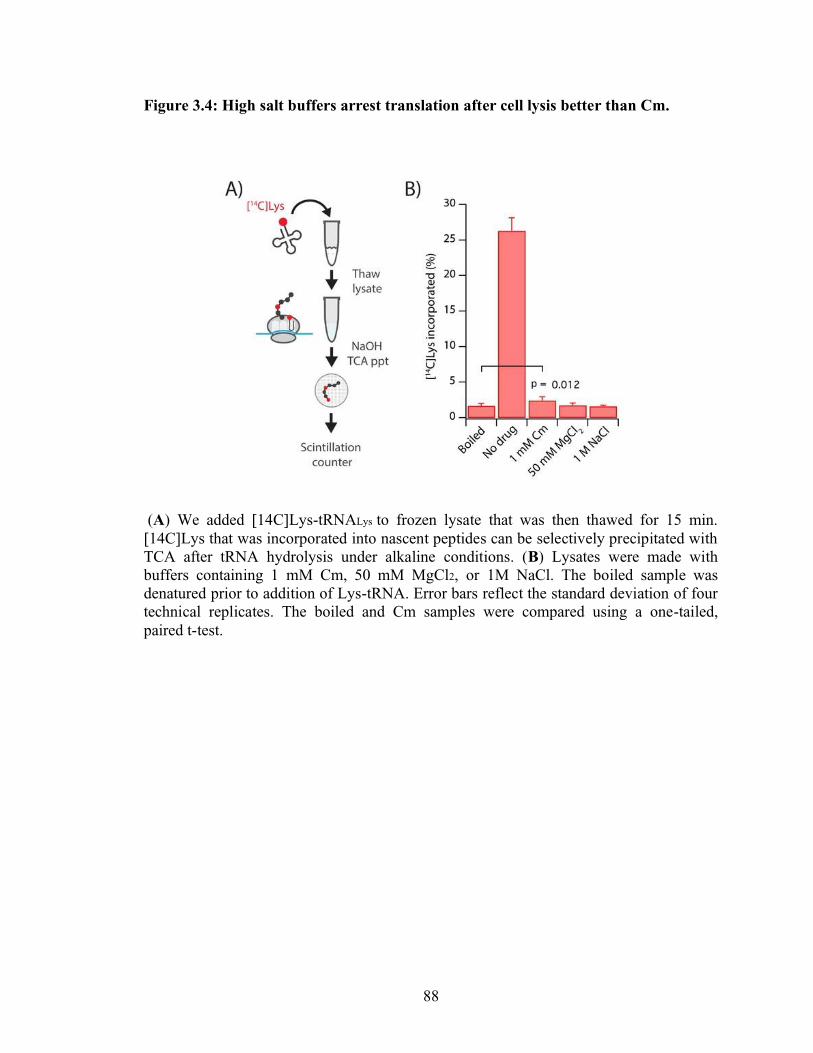
88
Figure 3.4: High salt buffers arrest translation after cell lysis better than Cm.
(A) We added [14C]Lys-tRNALys to frozen lysate that was then thawed for 15 min.
[14C]Lys that was incorporated into nascent peptides can be selectively precipitated with
TCA after tRNA hydrolysis under alkaline conditions. (B) Lysates were made with
buffers containing 1 mM Cm, 50 mM MgCl2, or 1M NaCl. The boiled sample was
denatured prior to addition of Lys-tRNA. Error bars reflect the standard deviation of four
technical replicates. The boiled and Cm samples were compared using a one-tailed,
paired t-test.
89
We next used the [14C]Lys-incorporation assay to identify alternatives to Cm that
might more effectively arrest translation in lysates. To avoid issues with antibiotic
specificity, we turned to observations made in the early days of in vitro ribosome
biochemistry characterizing the sensitivity of translation extracts to mono- and divalent
salts. We found that concentrations of MgCl2 higher than 50 mM inhibit the incorporation
of [14C]Lys, yielding a signal that is statistically indistinguishable from background levels
(Figure 3.4B). Similarly, we found that 1 M NaCl robustly inhibited translation in the
lysate. We suspect that these conditions hinder conformational changes essential for
ribosomes to undergo the various steps of elongation.
Ribosome profiling with high salt buffers improves the resolution of pauses
We next sought to incorporate these new lysis buffers into our ribosome profiling
protocol. We cryogenically lysed cells in buffers containing high MgCl2 or high NaCl and
then, because MNase is incompatible with these buffers, we pelleted ribosome complexes
over a sucrose cushion and resuspended them in the standard lysis buffer prior to
digestion (Figure 3.S5 A). By pelleting ribosome complexes, we effectively deplete
nucleotides and translation factors so that antibiotics or high salt concentrations are no
longer necessary to arrest translation. Before proceeding to the digestion step, we ran the
samples over a sucrose gradient to confirm that the combined steps of high salt lysis and
ribosome pelleting did not reduce the integrity of polysomes. For this analysis, we
quantitated the ratio of polysomes to monosomes and ribosome subunits for each sample;
a reduction in this ratio may be due to cleavage of the mRNA or subunit splitting. We
found that after pelleting, a sample with the standard Cm-containing buffer showed a
reduced ratio (2.2) compared to a non-pelleted sample (2.7, Figure 3.S5 B). After

90
pelleting, the 50S peak increased, suggesting that some ribosomes split into subunits,
while the 30S peak disappeared, as 30S subunits do not pellet through the cushion. The 1
M NaCl buffer appears to slightly worsen this effect; in pelleted samples, the polysome
ratio with the 1M NaCl buffer is 2.0 compared to 2.2 for the standard Cm-containing
buffer. In contrast, the high MgCl2 buffer (we now use 150 mM) promotes polysome
stability: it has the highest polysome ratio (2.9), showing the least amount of subunit
splitting after pelleting (Figure 3.S5 B). These results indicate that high MgCl2 buffer
may be optimal for ribosome profiling because of its ability to prevent translation in the
lysate while still maintaining polysome integrity.
We next prepared ribosome profiling libraries using both conditions (either 150
mM MgCl2 or 1 M NaCl in the lysis buffer) to arrest translation. As expected based on
the in vitro translation assays (Figure 3.4), in libraries prepared with these buffers, the
codon-specific pauses induced by Cm in the E site are no longer present. When Cm is
added only in the lysis buffer in library L26, E-site Gly and Ser pauses are observed
(Figure 3.5A, left, first column). Importantly, in libraries L27 and L28 prepared with the
high MgCl2 and NaCl buffers respectively, the Gly pauses in the E site are greatly
reduced and the Ser pauses completely disappear (Figure 3.5A, left, second and third
columns).
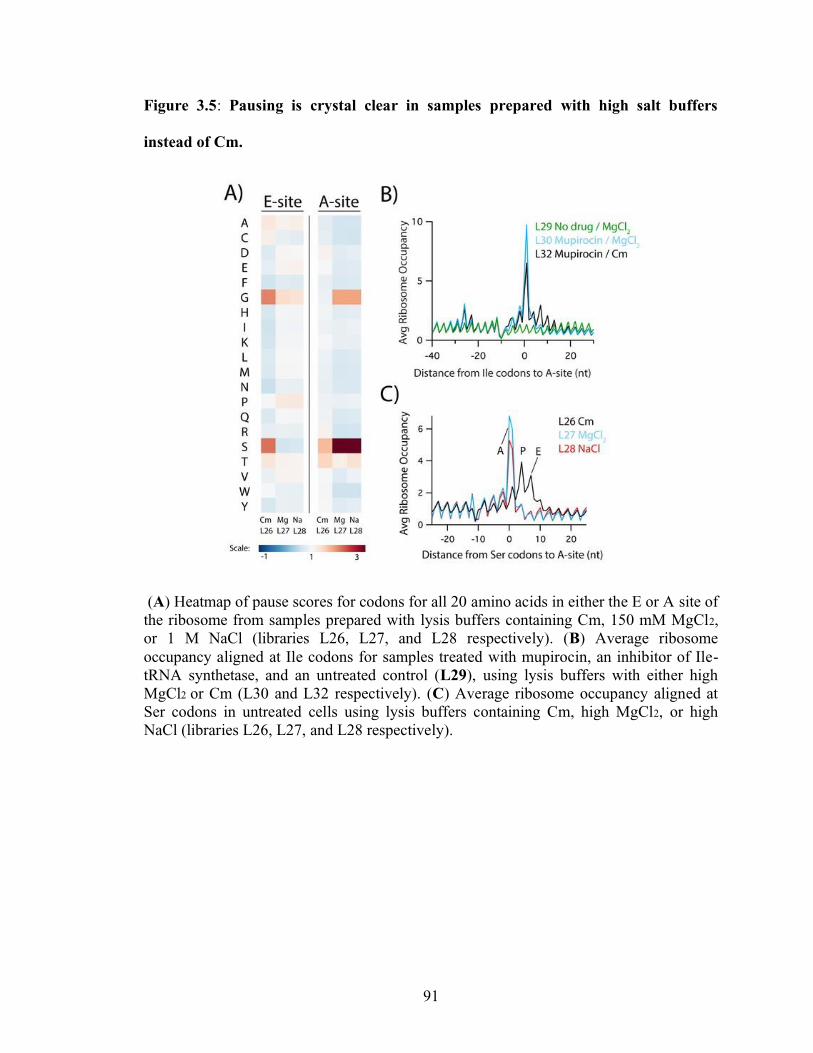
91
Figure 3.5: Pausing is crystal clear in samples prepared with high salt buffers
instead of Cm.
(A) Heatmap of pause scores for codons for all 20 amino acids in either the E or A site of
the ribosome from samples prepared with lysis buffers containing Cm, 150 mM MgCl2,
or 1 M NaCl (libraries L26, L27, and L28 respectively). (B) Average ribosome
occupancy aligned at Ile codons for samples treated with mupirocin, an inhibitor of Ile-
tRNA synthetase, and an untreated control (L29), using lysis buffers with either high
MgCl2 or Cm (L30 and L32 respectively). (C) Average ribosome occupancy aligned at
Ser codons in untreated cells using lysis buffers containing Cm, high MgCl2, or high
NaCl (libraries L26, L27, and L28 respectively).

92
Figure 3.S5—figure supplement 1: Incorporating high salt lysis buffers into
ribosome profiling.
(A) High salt buffers interfere with MNase activity; to exchange buffers, we pellet
ribosomes and resuspend them in the standard buffer (without Cm). (B) Polysome
profiles of samples pelleted over a sucrose cushion. The ratio of polysomes to
monosomes and subunits is also given. (C) Comparison of rpkm values for a sample
prepared with 1 M NaCl (L28) versus the standard protocol with Cm in the buffer (L31,
also pelleted). (D) Comparison of rpkm values for a sample prepared with 150 mM
MgCl2 (L29) versus the standard protocol with Cm in the buffer (L31, also pelleted). (E
and F) Top: average ribosome occupancy aligned at start codons (E) or Ser codons (F) in
library L27 prepared with 150 mM MgCl2 and pelleted prior to digestion. Bottom: heat-
map of RPF lengths at each position. In pelleted samples, nuclease cleavage of mRNA in
the ribosome yields shorter RPFs with shifted 3’-ends compared to RPFs that span the
whole ribosome.

93
With this methodology that effectively stops translation in lysates, we next
deliberately induced pauses at specific sites to see whether the resolution improves at
these known, biologically relevant pauses. First, we treated cells with mupirocin, an
inhibitor of isoleucyl-tRNA synthetase (Hughes and Mellows, 1978), anticipating that as
Ile-tRNA levels drop, ribosome density would increase specifically at Ile codons. In a
library prepared in the traditional manner using Cm in the lysate to arrest translation
(L32), in addition to the strong pause at Ile codons in the A site, we see that ribosome
density is enriched as far as three codons downstream (Figure 3.5B, black). This
observation is readily explained by ongoing translation in the lysate in the presence of
Cm that blurs the pausing signal at Ile codons. In contrast, in library L30 prepared using
the high MgCl2 buffer, the downstream pauses disappear and the pause at the A site is
higher because translation is truly arrested (Figure 3.5B, blue). In both libraries, density
is enriched about 25 nt upstream of the Ile codons as the next ribosome on the mRNA
stacks behind the ribosome paused at the Ile codon. Taken together, these data show that
the high MgCl2 buffer not only removes the pauses induced by the E-site specificity of
Cm in the lysate, it also sharpens resolution at genuine pauses by fully arresting
translation in the lysate.
Returning to libraries L27 and L28 prepared with the high MgCl2 and high NaCl
buffers from untreated cells, the clarity these buffers bring to our data also reveals pauses
that were missed in earlier studies. We observe strong pauses at Ser codons now in the
ribosomal A site and, to a lesser extent, pauses at Gly codons there as well (Figure 3.5A,
right). In plots of average ribosome occupancy at Ser codons, density is only enriched in
the A site (Figure 3.5C, red and blue). In libraries prepared traditionally using Cm in the
94
lysate (e.g. L26), the same pause is spread over the A, P, and E sites due to ongoing
translation in the lysate (Figure 3.5C, black). Note that the Ser and Gly pauses in the A
site shown here are distinct from the Ala, Ser, and Gly pauses observed in the E site in
samples pre-treated with Cm in the media (L1-L10, Figure 3.3C). A-site pauses are
usually the result of defects in decoding whereas E-site pauses (discussed above) arise
from the effects of the nascent chain on Cm’s ability to inhibit peptidyl transfer. In earlier
studies, both of these effects are in play: some combination of ongoing translation and the
sequence specificity of Cm generates the complex pausing landscapes seen in L11-L25
(Figure 3.3C).
3.5 Results: Preventing cellular stress during library preparation
Filtering cultures induces A-site Gly and Ser pauses
Initially we were puzzled by the observation of strong pauses at Gly and Ser
codons in the A site. These pauses suggest that Gly and Ser codons are decoded slowly as
the ribosome waits for the appropriate aminoacyl-tRNA to bind and react with the
nascent peptide chain. A-site pauses have been observed when cells are starved for
specific amino acids in yeast (Guydosh and Green, 2014; Lareau et al., 2014) and in E.
coli as shown with mupirocin above. However, it seemed unlikely that cells in our
samples were starving for Ser and Gly since the cultures were grown in a complete
MOPS media supplemented with all 20 amino acids, including 10 mM Ser, and were
harvested in early log phase (OD600 = 0.3) before nutrients are significantly depleted.
Moreover, Ser and Gly pauses in the A site were not reduced in libraries prepared using
other amino-acid-rich media formulations (data not shown). We wondered if the Ser and
95
Gly pauses we observe might be caused not by low levels of available nutrients, but from
the way that we harvest cells to prepare ribosome profiling libraries.
An important clue to the source of these pauses comes from the pattern of ribosome
occupancy downstream of Ser codons in these datasets. In heat maps of ribosome density
aligned at Ser codons, we observed strong pauses in the A site followed by a region of
reduced ribosome density, regardless of the lysis buffer used (Figure 3.6A). What is
striking is that the level dips for 10–15 codons after the pause but then returns to a higher
level further downstream. What explains this unusual pattern? Under optimal conditions,
there is a steady state level of ribosome density across messages as most of the ribosomes
elongate with roughly similar rates (Figure 3.6B). If a pause is induced that is strong
enough to become rate-limiting, it impedes the progress of upstream ribosomes while
downstream ribosomes continue elongating and are released at stop codons. The quality
control machinery likely removes paused ribosomes from the mRNA, further lowering
the density downstream of the pause site (Subramaniam et al., 2014). Eventually, the
system will come to a new steady state in which the ribosome density between the pause
site and stop codon will be lower than it was in the initial steady state, but relatively
constant across the downstream ORF. When cells are treated for 10 min with mupirocin
(L30), for example, ribosome density is depleted downstream of the strong pauses at Ile
codons compared to a control (L29, Figure 3.6C). Importantly, the level of ribosome
density downstream of Ile codons is uniformly lower (extending to the stop codon)
indicating that a new steady state has been reached.

96
Figure 3.6: Filtering cells leads to ribosome pausing at Ser codons due to reduced
levels of aminoacylated tRNASer.
(A) Heatmap of ribosome density downstream of Ser codons in samples harvested by
filtration using lysis buffers containing Cm, 150 mM MgCl2, or 1 M NaCl (L26, L27, and
L28, respectively). (B) Model of how pausing affects ribosome density. Downstream of a
pause site (shown in red), ribosomes continue elongation and are released at stop codons,
such that downstream density drops until a new steady state is reached. (C) Heatmap of
ribosome density downstream of Ile codons in untreated cells (L29) and after 10 min of
mupirocin treatment (L30). (D) Schematic of the method used for panels 6E and 6F: from
a single culture, samples were harvested by rapid filtration or by directly freezing the
culture. Ribosomes were then pelleted through a sucrose cushion. (E) Plots and heatmaps
of average ribosome density aligned at Ser codons in untreated cells that were filtered
(L29) or frozen (L33). (F) Northern blot of Ser, Gly, and Ile tRNAs after periodate
oxidation and β-elimination, a treatment that removes the final nt of tRNAs that are not
charged. As a negative control, an aliquot of tRNA from filtered or frozen samples were
pretreated in alkaline conditions to deacylate tRNA.
97
In contrast, the dip in ribosome density following Ser pauses extends for only 10–
15 codons (Figure 3.6A), suggesting that the system has not yet reached steady state, as
though a pause has been induced just prior to translational arrest and library preparation.
We reasoned that this might mean that Ser pauses in this case reflect an artifact of the
method and not a true depiction of the translational landscape in the exponentially-
growing culture. We wondered if acute Ser pauses arise as cells are harvested by
filtration just before translation is fully arrested when the cells are frozen in liquid
nitrogen.
While it is challenging to come up with a method of harvesting cells without
either filtration or centrifugation, we decided that rather than concentrating cells prior to
lysis, we would concentrate ribosomes after lysis by pelleting them over a sucrose
cushion. We developed a new approach in which we spray 50 mL of culture directly into
liquid nitrogen to form small, frozen drops that are then ground in a cryo-mill together
with 10X lysis buffer. To test this method, we harvested 50 mL of culture directly in
liquid nitrogen and 200 mL from the same culture with the standard filtering protocol.
Both samples were prepared using the high MgCl2 lysis buffer and pelleting over a
sucrose cushion to remove the high salt concentrations that preclude efficient MNase
digestion (Figure 3.6D). In plots of average ribosome density aligned at Ser codons, we
see a strong A-site pause in the standard filtered sample (L29), as described above, but a
complete loss of the Ser pause in the direct-freeze sample (L33, Figure 3.6E). The more
modest A-site Gly pauses also disappear (see Figure 3.7A below). We conclude that
filtration induces pausing at Ser and Gly codons.

98
Figure 3.7: Samples harvested by direct freezing and lysed in high MgCl2 buffer
reveal subtle ribosome pauses that reflect known biology, pauses at polyproline
motifs and at rare codons.
(A) Heatmap of pause scores in two biological replicates harvested by direct freezing
(L33 and L35). (B) Ranking of all tripeptide motifs by their pause scores with the motif
occupying the A, P and E sites of the ribosome in library L35. (C) Sequence logo of the
top 50 tripeptide motifs from 7B. (D) Spearman correlation between ribosome density at
each codon and the inverse value of its codon-adaptation index (CAI), a measure of
codon usage and optimality. The correlation was calculated for codons within the
ribosome (E, P, and A-site codons) and two codons on either side. The E. coli data are
from libraries L29 (filtered, MgCl2), L31 (filtered, Cm), and L33 (frozen, MgCl2) and
the S. cerevisiae data are from SRR1049521 (Subtelny et al., 2014).

99
Filtration lowers the levels of aminoacylation of tRNASer and tRNAGly
Why does rapid filtering lead to ribosome pausing? Given that Gly and Ser pauses
occur in the ribosomal A site and reflect reduced decoding rates, we asked if filtration
lowers the aminoacylation levels of tRNAs encoding Ser and Gly. We extracted total
tRNA from cells collected by either filtration or direct freezing. As a control, a fraction of
each tRNA sample was pre-treated with mild base to deacylate all the tRNAs. We used
periodate oxidation and β-elimination to distinguish between charged and uncharged
tRNAs in these four samples. As uncharged tRNAs are selectively oxidized by periodate,
after β-elimination they end up one nt shorter then charged tRNAs, allowing us to resolve
the two species by PAGE and northern blotting using tRNA-specific probes. For the
filtered sample, most of the tRNASer is uncharged, similar to the pre-treated, deacylated
control, whereas in the direct-freeze sample, most of the tRNASer is aminoacylated and
therefore one nt longer. These data show that filtering reduces the level of aminoacylation
of tRNASer. A similar effect, albeit more modest, is observed for tRNAGly; perhaps half of
the tRNAGly is uncharged in the filtered sample while it is fully charged in the direct-
freeze sample. The higher fraction of charged tRNAGly(compared to tRNASer) is consistent
with the observation that Gly pauses are generally weaker than Ser pauses in the
ribosome profiling data. Importantly, filtration did not have a discernible impact on the
charging levels of a control tRNA, tRNALeu, as expected, given that pauses were not
observed at Leu codons. Together, these northern blots provide a clear explanation for the
origins of pausing at Ser and Gly revealed in the ribosome profiling data; in cells
harvested by filtration, there is a reduction in the aminoacylation levels of tRNASer and
tRNAGly.
100
The pausing landscape in samples prepared by direct freezing reflects real biology
Compared to centrifugation and filtration, the direct freezing method that we have
developed yields libraries with a dramatically different translational pausing landscape.
Without the strong pauses at Gly and Ser codons that are induced by Cm in the E site or
by filtering in the A site, we now are able to see generally weak pauses at Pro, Asp, and
Gly codons (Figure 3.7A, L33 and L35). Pro exhibits the most significant pausing in all
three of the ribosomal tRNA-binding sites (A, P, and E). Pro is well known to inhibit
peptidyl transfer when found at the last two residues in nascent polypeptides
(corresponding to the pauses at the E and P site codons) (Doerfel et al., 2013; Tanner et
al., 2009; Wohlgemuth et al., 2008; Woolstenhulme et al., 2013). Pro also is a poor
peptidyl acceptor, likely explaining the pause in the A site as well (Pavlov et al., 2009).
Looking at all three codons in the E, P, and A sites together, we found that the tripeptides
with the highest pause scores contained permutations of Asp, Gly, and Pro (e.g. DPG,
PGG, PPG, Figure 3.7B); a sequence logo in Figure 3.7C showing the information
content in the top 50 motifs reveals enrichment of these amino acids in all three sites. The
fact that these pauses reflect known limitations of the translational machinery at Pro
codons suggests that we are at last looking at an in vivo pausing landscape that is no
longer masked by artifacts of the profiling method.
Another expectation is that rare codons will be decoded more slowly than
abundant codons and therefore have higher levels of ribosome density. Indeed, it has
been known for decades that highly expressed genes in E. coli tend to avoid rare codons
(Plotkin and Kudla, 2011; Sharp and Li, 1987), arguably because these codons are read
slowly by tRNAs that are present at low concentrations (Bulmer, 1991; Ikemura, 1981).

101
A variety of metrics have been developed to calculate the codon usage of genes (CAI)
(Sharp and Li, 1987) or its adaptation to the levels of tRNA (tAI) (dos Reis et al., 2004).
In early ribosome profiling papers in yeast (Charneski and Hurst, 2013; Qian et al., 2012)
and E. coli (Li et al., 2012), little correlation was observed between ribosome density and
these metrics. Recently, it was found that the addition of cycloheximide to the media
created artifacts that masked what was in fact a substantial correlation (Hussmann et al.,
2015). For example, in S. cerevisiae data prepared in the absence of cycloheximide
(Subtelny et al., 2014), there is a reasonable correlation between ribosome density and
1/CAI in the A site (Figure 3.7D) (Weinberg et al., 2016). Reassuringly, the correlation in
the E and P sites (and nearby codons) is lower. In E. coli data obtained with the standard
Cm buffer, the expected correlation is not observed in the A site (L31, black),
presumably because translation continues in the lysate. Importantly, however, in our new
samples prepared with the high MgCl2 buffer (L29 and L33), a significant correlation
with 1/CAI is observed (Spearman ρ = 0.36) and the correlation is highest in the A site,
where decoding takes place. Again, it is essential to fully arrest translation in order to
obtain the most physiologically relevant biological results.
3.6 Discussion
Unlike ribosome profiling in yeast, there has been little consensus regarding the
best practices for generating ribosome profiling libraries in bacteria. One of the
challenges in working with bacteria is the broad distribution in the length of ribosome-
protected footprints (RPFs). Although the majority of footprints are ~24 nt in length, we
observe RPFs ranging from 15 to 40 nt. We argue that the lengths of ribosome footprints
in bacteria are inherently more variable. In particular, unlike eukaryotic ribosomes,
102
bacterial ribosomes can base-pair directly with mRNA in an interaction that resembles
Shine-Dalgarno/rRNA pairing during initiation, effectively yielding longer footprints
wherever G-rich sequences are encountered. Although not demonstrated in bacteria, it
may also be true that classical/hybrid conformations of the ribosome will yield different
RPF lengths, as they do in yeast (Lareau et al., 2014; Wu et al., 2019). We recommend
isolating a broad range of footprints (15–40 nt) in order to capture the entire distribution
and to avoid introducing biases that may confound downstream analyses. And with this
broad distribution of read lengths, we find that assigning the position of the ribosome
using the 3’-end of footprints yields higher resolution than the center-assignment
strategy, because most of the length heterogeneity is found at the 5’-end of reads
(Woolstenhulme et al., 2015). For experiments where the reading frame of the ribosome
is critical, addition of the nuclease RelE to the digestion reaction generates precise 3’-
ends that yield strong three nt periodicity (Hwang and Buskirk, 2017), although this
comes at the cost of sequence bias that interferes with analyses of pausing. Taken
together, these insights and improvements make the broad distribution in footprint sizes
manageable and dramatically improve the resolution of profiling data.
A second challenge for ribosome profiling studies is to develop methods to
harvest cells and arrest translation without perturbing the in vivo translational landscape.
As reported in yeast, treatment of cultures with antibiotics prior to cell lysis can distort
calculations of the number of ribosomes per message and the signal from non-canonical
initiation sites (Gerashchenko and Gladyshev, 2014). Whenever possible, treatment of
cultures with antibiotics should be avoided. This limitation effectively rules out
centrifugation, which relies on antibiotics in the media to arrest translation during this

103
lengthy procedure. The more commonly used method of rapid filtration (without
antibiotics in the culture) can be a more effective strategy, especially when the primary
goal is to count the number of ribosomes per message to determine differences in protein
synthesis levels between two biological samples (Figure 3.S5 C and D).
For studies of mechanisms of protein synthesis and their regulation, however, the
rapid filtering method and the standard Cm-containing lysis buffer are inappropriate
because they impact ribosome density at the codon level. First, we found that because of
Cm specificities imposed on translation through the penultimate amino acid, there is
ongoing translation in the lysate during sample preparation leading to pauses at Ala, Gly,
and Ser codons in the E site (Marks et al., 2016); these pauses are observed in essentially
all published ribosomal profiling datasets (Figure 3.3C). We further discovered that
filtration is problematic because it introduces pauses at Ser and Gly codons in the A site.
To circumvent these issues, we made two substantive changes to the standard protocol
which effectively allow translation to be arrested without introducing sequence-specific
pauses: first, we directly freeze cultures in liquid nitrogen (avoiding the filtration step)
and we use lysis buffers with >50 mM Mg2+.
With these pausing artifacts removed, we capture a cleaner representation of
ribosome density at the codon level and begin to glimpse pausing that authentically
characterizes the in vivo translational landscape. First, we see subtle pauses with Pro
codons in the three active sites of the ribosome, similar to those seen in cells lacking EFP,
a elongation factor that promotes peptide-bond formation on these challenging substrates
(Doerfel et al., 2013; Peil et al., 2013; Ude et al., 2013; Woolstenhulme et al., 2015). This
observation suggests that even in wild-type E. coli, EFP may not be able to fully alleviate
104
pausing at Pro codons sequences. Asp and Gly residues also appear to be translated
slowly, particularly in combination with Pro residues, as previously seen in ribosome
profiling data from yeast cells in which eIF5A is depleted (Schuller et al., 2017). Like
EFP in bacteria, eIF5A alleviates pausing at polyproline stretches in eukaryotes
(Gutierrez et al., 2013). Pro and Asp codons are enriched at sites of ribosome pausing in
wild-type mammalian cells (Ingolia et al., 2011). These similarities suggest that all
ribosomes struggle with pauses at these codons, probably due to slow rates of peptidyl
transfer that result from the unusual limitations of the prolyl amino acid side chain.
Our new data also reveal a negative correlation between ribosome density and
codon-adaptation index (CAI), consistent with the expectation that rare codons will be
decoded by lower-abundance tRNAs more slowly than more abundant codons. Given the
strong evidence of natural selection acting on codon usage in E. coli and S. cerevisiae,
this result has long been expected, but this relationship was not revealed in early profiling
studies. We now know that using antibiotics to arrest translation skews the position of
ribosomes on messages to obscure the enrichment of ribosome density at non-optimal
codons (Hussmann et al., 2015). Interestingly, the correlation that we observe for E.
coli is not as strong as for S. cerevisiae (Weinberg et al., 2016). One reason may be that
the ribosomes are not all trapped at the same step in the translational cycle. Pauses on Pro
codons suggest that some ribosomes are trapped during peptidyl transfer, whereas pauses
on rare codons suggest that others are trapped with empty A sites during decoding. It is
even possible that certain amino acid combinations are problematic for translocation. The
signals from these different subsets of ribosomes interfere with each other. In yeast, it is
now possible to use multiple antibiotics targeting different steps to tease apart these
105
different states of elongating ribosomes. For example, analysis of populations of
ribosomes arrested in the decoding step only reveals very high correlations between
ribosome density and codon optimality metrics like CAI and tAI (Wu et al., 2019). A
similar strategy may also improve these correlations in bacteria in the future. The
methods described here are an important first step towards this goal, enabling for the first
time studies of local elongation rates and their effects on protein folding or gene
expression.
Already the clarity brought by our new methods has revealed a possible link
between physiological stress and local translational rates: filtering cultures for as little as
30 s leads to ribosome pausing during the decoding of Ser and Gly codons. We confirmed
that these pauses are caused by a sharp drop in the level of aminoacylation of these
tRNAs triggered by the filtration. Consistent with these findings, Ignatova and co-
workers reported A-site Ser pauses in E. coli profiling data and used tRNA microarrays
to show that tRNASer has very low charging levels even in cultures grown in rich media
(Avcilar-Kucukgoze et al., 2016). They found that these pauses do not resolve upon
addition of more glucose or serine to the media. Likewise, our data show that A-site Ser
and Gly pauses are induced by the methods used to harvest the cells, not by depletion of
nutrients from the media. The fact that some published profiling datasets show A-site Ser
pauses while others do not can probably be explained by subtle differences in harvesting
procedures.
The nature of the stress induced by filtering remains unclear. It is not the change
in temperature: strong Ser and Gly pauses are observed whether filtration is performed at
room temperature, as usual, or in a warm room at 37°C (data not shown). The trigger
106
could be the contact between a cell and the membrane, the contact between cells as they
accumulate over time, or the mechanical stress as they are scraped from the membrane.
We cannot rule out the possibility that as cells accumulate on the membrane, they are no
longer able to take up Ser and Gly that are otherwise available in the media.
Alternatively, Ser may be channeled away from protein synthesis for other purposes. Ser
is used in many biochemical reactions, primarily as a donor of one-carbon units (through
the folate cycle) for the biosynthesis of nucleotides and other amino acids (Gly, Thr, Met)
(Stauffer, 2004). Bacteria deplete extracellular Ser faster than any other amino acid
(Selvarasu et al., 2009), perhaps because they express Ser deaminases that convert Ser to
pyruvate and ammonia. It has been proposed that the reason for this apparently wasteful
reaction is that high levels of Ser are toxic to E. coli cells (Zhang and Newman, 2008).
Regulation of intracellular Ser concentrations is therefore essential to balance its many
roles in metabolism. Working out the mechanism for the reduction of charged
tRNASer and tRNAGly may yield insight into how cells regulate the flux of these important
molecules at the center of so many metabolic pathways.
We are intrigued by the possibility that other physiological stresses may impact
protein synthesis and vice versa. For example, when B. subtilis cells are cultured in media
that induces biofilm formation, ribosomes pause at Ser codons, leading to the reduction
of translation of an important transcription factor, SinR (Subramaniam et al., 2013). As
the level of SinR drops, biofilm-related genes are no longer repressed, and cells switch to
a program of matrix gene expression and biofilm formation. With the methods that we
report here, we will be able to observe the effects of stress on the local translation rates
107
across the genome, perhaps discovering similar phenomena relevant to other important
physiological stresses in bacteria.
3.7 Materials and Methods
Bacterial culture conditions and lysis
E. coli MG1655 cells were grown overnight at 37°C in MOPS EZ Rich Defined
media (Teknova) supplemented with 0.2% glucose and diluted 1:100 into 300 mL fresh
media and grown at 37°C to an optical density of 0.3. Cultures were treated with 200 µM
mupirocin (MPC, Sigma) or 1 mM chloramphenicol (Cm, Sigma) when indicated in the
text. Cells were harvested either by filtration or by direct freezing of the culture in liquid
nitrogen. Biological replicates consist of cultures from individual colonies grown on
separate days.
Filtration was performed using a Kontes 90 mm filtration apparatus with 0.45 µm
nitrocellulose filters (Whatman); cells were scraped from the filter before the media runs
dry and were then frozen in liquid nitrogen. 0.65 mL of frozen lysis buffer was added to
the pellets as indicated in the text. The standard lysis buffer is 20 mM Tris pH 8.0, 10
mM MgCl2, 100 mM NH4Cl, 5 mM CaCl2, 0.1% NP‐40, 0.4% TritonX‐100, and 100
U/mL DNase I (Roche). To this buffer, 1 mM chloramphenicol, 1 M NaCl or 150 mM
MgCl2 was added as indicated in the text. The cells were cryogenically pulverized using a
Spex 6870 freezer mill with 5 cycles of 1 min grinding at 5 Hz and 1 min cooling.
Lysates were thawed at room temperature and gently homogenized by passing through a
20 gauge syringe five times. Lysates were clarified by centrifugation at 20,000 g for 10
min at 4°C. For buffer exchange, 25 AU of RNA in the lysates was layered on top of a 1
mL sucrose cushion (20 mM Tris pH 7.5, 500 mM NH4Cl, 0.5 mM EDTA, 1.1 M
108
sucrose) and ribosomes were pelleted by centrifugation using a TLA 100.3 rotor at
65,000 rpm for 2 hr. Pellets containing ribosomes were re-suspended using resuspension
buffer (0.2 mL of 20 mM Tris pH 8.0, 10 mM MgCl2, 100 mM NH4Cl, 5 mM CaCl2,
0.1% NP‐40, 0.4% TritonX‐100) and used for subsequent experiments.
For samples harvested by direct freezing, 50 mL of culture at OD600 of 0.3 was
directly sprayed from a pipette into liquid nitrogen. The frozen culture was cryogenically
pulverized together with 5.6 mL 10x lysis buffer (1x concentrations listed above) with 10
cycles of 1 min grinding at 8 Hz and 1 min cooling. Lysates were thawed at room
temperature and pelleted over a 3 mL sucrose cushion (1.1 M sucrose, 20 mM Tris pH 8,
500 mM NH4Cl, 10 mM MgCl2, 0.5 mM EDTA) using a Ti-70 rotor at 70,000 rpm for 2
hr. Ribosome pellets were re-suspended in 200 µL resuspension buffer.
Ribosome profiling library preparation
Lysates were processed for Illumina high throughput sequencing as follows: 18
AU of RNA was digested with 1,500 U of MNase (Nuclease S7, Roche) for 1 hr at 25°C
and then quenched with EGTA at a final concentration of 6 mM. Samples were layered
on a 10–50% sucrose gradient buffered with 20 mM Tris pH 8.0, 10 mM MgCl2, 100
mM NH4Cl and 2 mM DTT. Monosomes were isolated from the gradient after
centrifugation in a SW41 rotor at 35,000 rpm for 2.5 hr at 4°C. 0.75 mL acid phenol pH
4.5 was added to 1 mL of the monosome fraction and incubated at 65°C for 5 min,
followed by a second extraction with 0.75 mL acid phenol and finally with 0.6 mL
chloroform before precipitating with isopropanol. 10 µg of RNA fragments were resolved
by running samples on a 15% TBE Urea gel alongside size markers and 15–45 nt
109
fragments were gel purified. Eluted RNA was then isopropanol precipitated and
subsequently treated with T4 polynucleotide kinase (NEB) to dephosphorylate 3’ ends.
After another round of isopropanol precipitation, the RNA fragments were ligated to the
linker 5′ rAppCTGTAGGCACCATCAAT–NH2 3′ (NEB Universal miRNA Cloning
Linker) using T4 RNA ligase (NEB) for 3 hr at 37°C. Ligated RNA fragments were
resolved on 10% TBE Urea gels and gel extracted. Following another precipitation,
rRNA fragments were subtracted using the Ribo-Zero rRNA removal kit for bacteria
(Illumina). Ligated fragments were then reverse transcribed using SuperScript III
(Invitrogen) at 48°C for 30 min, using the
primer/5Phos/AGATCGGAAGAGCGTCGTGTAGGGAAAGAGTGTAGATCTCGGT
GGTCGC/iSP18/CACTCA/iSp18/TTCAGACGTGTGCTCTTCCGATCTATTGATGG
TGCCTACAG. Template RNA was degraded by adding 180 mM NaOH and incubating
at 98°C for 20 min. Reverse transcribed products were resolved on 10% TBE Urea gels,
gel extracted, and isopropanol precipitated. Samples were then circularized using
CircLigase (Epicentre) at 60°C for 1 hr, and circularized product was used as template for
PCR amplification using primers AATGATACGGCGACCACCGAGATCTACAC and
CAAGCAGAAGACGGCATACGAGATNNNNNNGTGACTGGAGTTCAGACGTGT
GCTCTTCCG, where NNNNNN refers to a six nt barcode. PCR amplification was done
using 8–12 cycles using Phusion polymerase (NEB). PCR products were resolved on
10% TBE gels, gel extracted, and then precipitated using isopropanol. PCR products
were analyzed for size and concentration using a BioAnalyzer high sensitivity DNA kit
before sequencing on an Illumina HiSeq 2500.
TCA amino acid incorporation assay
110
Frozen cell pellets were cryogenically pulverized with the standard lysis buffer
with antibiotics or varying salt concentrations as indicated in the text. 20 g of the
resulting frozen lysate was thawed and precleared by centrifugation at 20,000 g for 10
min and quantified using the absorbance at A260. [14]C-Lys tRNA was prepared as
follows. 5 µM purified tRNA (Chemical Block, Russia) was incubated in 100 mM
HEPES-KOH pH 7.6, 10 mM ATP, 1 mM DTT, 10 mM KCl, 20 mM MgCl2, 50 µM
14C-amino-acid and 1 µM synthetase at 37°C for 30 min. 2 µL (0.5 µM) labeled tRNA
and 20 g frozen lysate were mixed and allowed to thaw for 15 min at room temperature.
100 µL 1 M NaOH was added to the reaction and incubated at RT for 20 min. Nascent
peptides were precipitated by adding 10% TCA +5% casamino acids and collected on
glass microfiber filters (Whatman). Membranes were washed on a vacuum apparatus with
5% TCA and 80% EtOH to remove any free labeled amino acids. [14C]-Lys
incorporation was determined with a scintillation counter for four technical replicates
from the same lysate.
tRNA northern blot analysis of tRNA aminoacylation levels
Cultures were either flash frozen or filtered as described above. From 30 g of
flash frozen culture, total RNA was extracted using 15 mL Trizol (Invitrogen), 3 mL 3 M
NaOAc pH 5.0 and 30 µL 1 M EDTA. The samples were then gently vortexed for 5 min
and centrifuged for 10 min at 8000 g. Following an additional wash with 10 mL acid
phenol pH 4.5, the aqueous layer was ethanol precipitated. From filtered cultures, total
RNA from the frozen pellet was extracted with 500 µL of 0.3 M NaOAc pH 5.0, 1 mM
EDTA, and 500 µL Trizol. Following an additional wash with 500 µL acid phenol pH
111
4.5, the aqueous layer was ethanol precipitated. From each samples, 1.5 µg RNA was
deacylated in 0.2 M Tris pH 9 at 37°C for 2 hr and ethanol precipitated. Untreated and
deacylated RNA were then oxidized using sodium periodate (5 mM NaIO4, 50 mM
NaOAc pH 5.0) for 60 min at 37°C; glucose was added to a final concentration of 50 mM
and the RNA was ethanol precipitated. 500 µL 1 M lysine pH 8.5 was added to promote
ß-elimination of oxidized 3’ RNA ends. Samples were then purified by an acid
phenol/chloroform extraction and ethanol precipitation. Samples were run on a 11% TBE
7 M Urea denaturing polyacrylamide gel. RNA was transferred using a semi-dry transfer
apparatus (Biorad) onto a Zeta-Probe nylon membrane. RNA was UV crosslinked to the
membrane using 3600 µJ UV light (UV Stratalinker 2400). Membranes were probed with
5’-32P GATTCGAACTCTGGAACCCTTTCGGGTCGCCGGTTTTC (tRNASer UGA),
5’-32P GAATCGAACCCGCATCATCAGCTTGG (tRNAGly UCC), or 5’-32P
GACTTGAACCCCCACGTCCGTAAGGACACTAACACCTG (tRNALeu CAG) and
signal was detected on a Typhoon phosphorimager.
Analysis of ribosome profiling data
Custom Python scripts were used to analyze sequencing data in iPython notebook
(Mohammad, 2018). Raw reads were filtered for quality and trimmed using Skewer
v0.2.2. Bowtie v0.12.7 was used to map reads uniquely to genome build NC_000913.2
(allowing two mismatches) after reads mapping to tRNA or rRNA were discarded.
Ribosome density was assigned to the 3’-end of reads using read sizes 10–40 nt in
Figures 3.1 and 3.3. We found that in libraries where the ribosomes were pelleted prior to
nuclease digestion, MNase cleaves mRNA within the ribosome, presumably because
112
tRNAs are depleted. As a result, the 3’-ends of short RPFs are shifted compared to RPFs
that span the whole ribosome, as shown for start codon peaks and Ser codons in L27 in
Figure 3.S5 E and F. In analyzing these libraries in Figures 3.5–3.7, we used RPFs > 23
nt to ensure that all the 3’-ends are properly aligned. Genes with fewer than 0.5 reads per
nucleotide on average were excluded from analysis. On each gene, codons close to the
ends of the gene were likewise excluded (27 nt downstream of the start codon and 12 nt
upstream of the stop codon).
To calculate pause scores we normalized the read count at each nt of a gene by
dividing by the mean read count for the gene. For each codon, we calculated the mean
value including reads from all three nt. Average pause scores were calculated using these
values from all instances of the codon or amino acid of interest. Pause scores calculated
for the A site used a −11 nt shift; P- and E-site pause scores used a shift of −14 and −17,
respectively. Tripeptide pause scores were calculated with the last of the three codons in
the A site. Asymmetry scores were calculated as the log2 value of the ratio of total
density on the second half of a gene over the total density on the first half.
113
3.8 References
Avcilar-Kucukgoze I, Bartholoma¨us A, Cordero Varela JA, Kaml RF, Neubauer P,
Budisa N, Ignatova Z. 2016. Discharging tRNAs: a tug of war between translation and
detoxification in Escherichia coli. Nucleic Acids Research 44:8324–8334.
Baggett NE, Zhang Y, Gross CA. 2017. Global analysis of translation termination in E.
coli. PLOS Genetics 13: e1006676.
Balakrishnan R, Oman K, Shoji S, Bundschuh R, Fredrick K. 2014. The conserved
GTPase LepA contributes mainly to translation initiation in Escherichia coli. Nucleic
Acids Research 42:13370–13383.
Becker AH, Oh E, Weissman JS, Kramer G, Bukau B. 2013. Selective ribosome profiling
as a tool for studying the interaction of chaperones and targeting factors with nascent
polypeptide chains and ribosomes. Nature Protocols 8:2212–2239.
Determinants of the rate of mRNA translocation in bacterial protein synthesis. Journal of
Molecular Biology 427:1835–1847.
Brown A, Shao S, Murray J, Hegde RS, Ramakrishnan V. 2015. Structural basis for stop
codon recognition in eukaryotes. Nature 524:493–496.
Bulmer M. 1991. The selection-mutation-drift theory of synonymous codon usage.
Genetics 129:897–907.
Burkhardt DH, Rouskin S, Zhang Y, Li GW, Weissman JS, Gross CA. 2017. Operon
mRNAs are organized into ORF-centric structures that predict translation efficiency.
eLife 6:e22037.
Chadani Y, Niwa T, Chiba S, Taguchi H, Ito K. 2016. Integrated in vivo and in vitro
nascent chain profiling reveals widespread translational pausing. PNAS 113:E829–E838.
Charneski CA, Hurst LD. 2013. Positively charged residues are the major determinants of
ribosomal velocity. PLoS Biology 11:e1001508.
Dingwall C, Lomonossoff GP, Laskey RA. 1981. High sequence specificity of
micrococcal nuclease. Nucleic Acids Research 9:2659–2674.
Doerfel LK, Wohlgemuth I, Kothe C, Peske F, Urlaub H, Rodnina MV. 2013. EF-P is
essential for rapid synthesis of proteins containing consecutive proline residues. Science
339:85–88.
Doma MK, Parker R. 2006. Endonucleolytic cleavage of eukaryotic mRNAs with stalls
in translation elongation. Nature 440:561–564.

114
dos Reis M, Savva R, Wernisch L. 2004. Solving the riddle of codon usage preferences: a
test for translational selection. Nucleic Acids Research 32:5036–5044.
Dunkle JA, Xiong L, Mankin AS, Cate JH. 2010. Structures of the Escherichia coli
ribosome with antibiotics bound near the peptidyl transferase center explain spectra of
drug action. PNAS 107:17152–17157.
Gerashchenko MV, Gladyshev VN. 2014. Translation inhibitors cause abnormalities in
ribosome profiling experiments. Nucleic Acids Research 42:e134.
Gerashchenko MV, Gladyshev VN. 2017. Ribonuclease selection for ribosome profiling.
Nucleic Acids Research 45:e6.
Gutierrez E, Shin BS, Woolstenhulme CJ, Kim JR, Saini P, Buskirk AR, Dever TE. 2013.
eIF5A promotes translation of polyproline motifs. Molecular Cell 51:35–45.
Guydosh NR, Kimmig P, Walter P, Green R. 2017. Regulated Ire1-dependent mRNA
decay requires no-go mRNA degradation to maintain endoplasmic reticulum homeostasis
in S. pombe. eLife 6:e29216.
Guydosh NR, Green R. 2014. Dom34 rescues ribosomes in 3’ untranslated regions. Cell
156:950–962.
Guydosh NR, Green R. 2017. Translation of poly(A) tails leads to precise mRNA
cleavage. RNA 23:749–761.
Haft RJ, Keating DH, Schwaegler T, Schwalbach MS, Vinokur J, Tremaine M, Peters
JM, Kotlajich MV, Pohlmann EL, Ong IM, Grass JA, Kiley PJ, Landick R. 2014.
Correcting direct effects of ethanol on translation and transcription machinery confers
ethanol tolerance in bacteria. PNAS 111:E2576–E2585.
Hughes J, Mellows G. 1978. Inhibition of isoleucyl-transfer ribonucleic acid synthetase
in Escherichia coli by pseudomonic acid. Biochemical Journal 176:305–318.
Hussmann JA, Patchett S, Johnson A, Sawyer S, Press WH. 2015. Understanding biases
in ribosome profiling experiments reveals signatures of translation dynamics in yeast.
PLOS Genetics 11:e1005732.
Hwang JY, Buskirk AR. 2017. A ribosome profiling study of mRNA cleavage by the
endonuclease RelE. Nucleic Acids Research 45:327–336.
Ikemura T. 1981. Correlation between the abundance of Escherichia coli transfer RNAs
and the occurrence of the respective codons in its protein genes. Journal of Molecular
Biology 146:1–21.
115
Ingolia NT, Ghaemmaghami S, Newman JR, Weissman JS. 2009. Genome-wide analysis
in vivo of translation with nucleotide resolution using ribosome profiling. Science
324:218–223.
Ingolia NT, Lareau LF, Weissman JS. 2011. Ribosome profiling of mouse embryonic
stem cells reveals the complexity and dynamics of mammalian proteomes. Cell 147:789–
802.
Ito K, Chiba S. 2013. Arrest peptides: cis-acting modulators of translation. Annual
Review of Biochemistry 82: 171–202.
Kim SJ, Yoon JS, Shishido H, Yang Z, Rooney LA, Barral JM, Skach WR. 2015. Protein
folding. Translational tuning optimizes nascent protein folding in cells. Science 348:444–
448.
Kimchi-Sarfaty C, Oh JM, Kim IW, Sauna ZE, Calcagno AM, Ambudkar SV, Gottesman
MM. 2007. A "silent" polymorphism in the MDR1 gene changes substrate specificity.
Science 315:525–528.
Kitahara K, Miyazaki K. 2011. Specific inhibition of bacterial RNase T2 by helix 41 of
16S ribosomal RNA. Nature Communications 2:549.
Komar AA. 2009. A pause for thought along the co-translational folding pathway. Trends
in Biochemical Sciences 34:16–24.
Lareau LF, Hite DH, Hogan GJ, Brown PO. 2014. Distinct stages of the translation
elongation cycle revealed by sequencing ribosome-protected mRNA fragments. eLife
3:e01257.
Latif H, Szubin R, Tan J, Brunk E, Lechner A, Zengler K, Palsson BO. 2015. A
streamlined ribosome profiling protocol for the characterization of microorganisms.
BioTechniques 58:329–332.
Li GW, Oh E, Weissman JS. 2012. The anti-Shine-Dalgarno sequence drives
translational pausing and codon choice in bacteria. Nature 484:538–541.
Li GW, Burkhardt D, Gross C, Weissman JS. 2014. Quantifying absolute protein
synthesis rates reveals principles underlying allocation of cellular resources. Cell
157:624–635.
Liu X, Jiang H, Gu Z, Roberts JW. 2013. High-resolution view of bacteriophage lambda
gene expression by ribosome profiling. PNAS 110:11928–11933
Marks J, Kannan K, Roncase EJ, Klepacki D, Kefi A, Orelle C, Va´ zquez-Laslop N,
Mankin AS. 2016. Contextspecific inhibition of translation by ribosomal antibiotics
targeting the peptidyl transferase center. PNAS 113: 12150–12155.
116
Mohammad F, Woolstenhulme CJ, Green R, Buskirk AR. 2016. Clarifying the
translational pausing landscape in bacteria by ribosome profiling. Cell Reports 14:686–
694.
Nakahigashi K, Takai Y, Shiwa Y, Wada M, Honma M, Yoshikawa H, Tomita M, Kanai
A, Mori H. 2014. Effect of codon adaptation on codon-level and gene-level translation
efficiency in vivo. BMC Genomics 15:1115.
Nakatogawa H, Ito K. 2002. The ribosomal exit tunnel functions as a discriminating gate.
Cell 108:629–636.
O’Connor PB, Li GW, Weissman JS, Atkins JF, Baranov PV. 2013. rRNA:mRNA
pairing alters the length and the symmetry of mRNA-protected fragments in ribosome
profiling experiments. Bioinformatics 29:1488–1491.
O’Connor PB, Andreev DE, Baranov PV. 2016. Comparative survey of the relative
impact of mRNA features on local ribosome profiling read density. Nature
Communications 7:12915
Oh E, Becker AH, Sandikci A, Huber D, Chaba R, Gloge F, Nichols RJ, Typas A, Gross
CA, Kramer G, Weissman JS, Bukau B. 2011. Selective ribosome profiling reveals the
cotranslational chaperone action of trigger factor in vivo. Cell 147:1295–1308.
Orelle C, Carlson S, Kaushal B, Almutairi MM, Liu H, Ochabowicz A, Quan S, Pham
VC, Squires CL, Murphy BT, Mankin AS. 2013. Tools for characterizing bacterial
protein synthesis inhibitors. Antimicrobial Agents and Chemotherapy 57:5994–6004.
Pavlov MY, Watts RE, Tan Z, Cornish VW, Ehrenberg M, Forster AC. 2009. Slow
peptide bond formation by proline and other N-alkylamino acids in translation. PNAS
106:50–54.
Pedersen K, Zavialov AV, Pavlov MY, Elf J, Gerdes K, Ehrenberg M. 2003. The
bacterial toxin RelE displays codon-specific cleavage of mRNAs in the ribosomal A site.
Cell 112:131–140.
Peil L, Starosta AL, Lassak J, Atkinson GC, Viruma¨e K, Spitzer M, Tenson T, Jung K,
Remme J, Wilson DN. 2013. Distinct XPPX sequence motifs induce ribosome stalling,
which is rescued by the translation elongation factor EF-P. PNAS 110:15265–15270.
Plotkin JB, Kudla G. 2011. Synonymous but not the same: the causes and consequences
of codon bias. Nature Reviews Genetics 12:32–42.
Qian W, Yang JR, Pearson NM, Maclean C, Zhang J. 2012. Balanced codon usage
optimizes eukaryotic translational efficiency. PLoS Genetics 8:e1002603.
117
Schuller AP, Wu CC, Dever TE, Buskirk AR, Green R. 2017. eIF5A functions globally
in translation elongation and termination. Molecular Cell 66:194–205.
Selvarasu S, Ow DS, Lee SY, Lee MM, Oh SK, Karimi IA, Lee DY. 2009.
Characterizing Escherichia coli DH5alpha growth and metabolism in a complex medium
using genome-scale flux analysis. Biotechnology and Bioengineering 102:923–934.
Sharp PM, Li WH. 1987. The codon Adaptation Index–a measure of directional
synonymous codon usage bias, and its potential applications. Nucleic Acids Research
15:1281–1295.
Stauffer GV. 2004. Regulation of serine, glycine, and One-Carbon biosynthesis. EcoSal
Plus 1.
Subramaniam AR, Deloughery A, Bradshaw N, Chen Y, O’Shea E, Losick R, Chai Y.
2013. A serine sensor for multicellularity in a bacterium. eLife 2:e01501.
Subramaniam AR, Zid BM, O’Shea EK. 2014. An integrated approach reveals regulatory
controls on bacterial translation elongation. Cell 159:1200–1211.
Subtelny AO, Eichhorn SW, Chen GR, Sive H, Bartel DP. 2014. Poly(A)-tail profiling
reveals an embryonic switch in translational control. Nature 508:66–71.
Tanner DR, Cariello DA, Woolstenhulme CJ, Broadbent MA, Buskirk AR. 2009. Genetic
identification of nascent peptides that induce ribosome stalling. Journal of Biological
Chemistry 284:34809–34818.
Ude S, Lassak J, Starosta AL, Kraxenberger T, Wilson DN, Jung K. 2013. Translation
elongation factor EF-P alleviates ribosome stalling at polyproline stretches. Science
339:82–85.
Weinberg DE, Shah P, Eichhorn SW, Hussmann JA, Plotkin JB, Bartel DP. 2016.
Improved Ribosome-Footprint and mRNA measurements provide insights into dynamics
and regulation of yeast translation. Cell Reports 14: 1787–1799.
Wohlgemuth I, Brenner S, Beringer M, Rodnina MV. 2008. Modulation of the rate of
peptidyl transfer on the ribosome by the nature of substrates. Journal of Biological
Chemistry 283:32229–32235.
Woolstenhulme CJ, Parajuli S, Healey DW, Valverde DP, Petersen EN, Starosta AL,
Guydosh NR, Johnson WE, Wilson DN, Buskirk AR. 2013. Nascent peptides that block
protein synthesis in bacteria. PNAS 110:E878–E887.
Woolstenhulme CJ, Guydosh NR, Green R, Buskirk AR. 2015. High-precision analysis
of translational pausing by ribosome profiling in bacteria lacking EFP. Cell Reports
11:13–21.

118
Wu CC, Zinshteyn B, Wehner KA, Green R. 2019. High-Resolution ribosome profiling
defines discrete ribosome elongation states and translational regulation during cellular
stress. Molecular Cell.
Yanofsky C. 1981. Attenuation in the control of expression of bacterial operons. Nature
289:751–758.
Zhang X, Newman E. 2008. Deficiency in l-serine deaminase results in abnormal growth
and cell division of Escherichia coli K-12. Molecular microbiology 69:870–881.
Zhao D, Baez W, Fredrick K, Bundschuh R. 2018. RiboProP: a probabilistic ribosome
positioning algorithm for ribosome profiling. Bioinformatics.
Zhou M, Guo J, Cha J, Chae M, Chen S, Barral JM, Sachs MS, Liu Y. 2013. Non-optimal
codon usage affects expression, structure and function of clock protein FRQ. Nature
495:111–115.
119
Chapter 4:
Identifying small proteins by ribosome profiling
with stalled initiation complexes
Jeremy Weaver,1 Fuad Mohammad,2 Allen R. Buskirk,2 Gisela Storz1
1Division of Molecular and Cellular Biology, Eunice Kennedy Shriver National Institute
of Child Health and Human Development, Bethesda, MD 20892-5430, USA
2Department of Molecular Biology and Genetics, Johns Hopkins School of Medicine,
Baltimore, MD 21205, USA
120
4.1 Abstract
Small proteins consisting of 50 or fewer amino acids have been identified as
regulators of larger proteins in bacteria and eukaryotes. Despite the importance of these
molecules, the true prevalence of small proteins remains unknown because conventional
annotation pipelines usually exclude small open reading frames (smORFs). We
previously identified several dozen small proteins in the model organism Escherichia coli
using theoretical bioinformatic approaches based on sequence conservation and matches
to canonical ribosome binding sites. Here, we present an empirical approach for
discovering new proteins, taking advantage of recent advances in ribosome profiling in
which antibiotics are used to trap newly-initiated 70S ribosomes at start codons. This
approach led to the identification of many novel initiation sites in intergenic regions in E.
coli. We tagged 41 smORFs on the chromosome and detected protein synthesis for all but
three. The corresponding genes are not only intergenic, but are also found antisense to
other genes, in operons, and overlapping other open reading frames (ORFs), some
impacting the translation of larger downstream genes. These results demonstrate the
utility of this method for identifying new genes, regardless of their genomic context.
Importance
Proteins comprised of 50 or fewer amino acids have been shown to interact with
and modulate the function of larger proteins in a range of organisms. Despite the possible
importance of small proteins, the true prevalence and capabilities of these regulators
remain unknown as the small size of the proteins places serious limitations on their
identification, purification and characterization. Here, we present a ribosome profiling

121
approach with stalled initiation complexes that led to the identification of 38 new small
proteins.
4.2 Background
Protein-protein interactions play an essential role in a variety of cellular
processes, such as signal transduction and gene regulation. Small proteins, here
considered to be 50 amino acids or fewer and encoded by small open reading frames
(smORFs), have been shown to interact with and modulate the function of larger proteins
(Storz et al., 2014; Andrews et al., 2014; Saghatelian et al., 2015). These regulators have
been identified in organisms spanning the phylogenetic tree of life, and important roles
have been characterized for small proteins in bacteria and eukaryotes. In Escherichia coli,
for example, the absence of the 49 amino acid protein AcrZ renders cells more
susceptible to specific antibiotics (Hobbs el al., 2012), and cells lacking the 31 amino
acid protein MgtS are sensitive to low magnesium concentrations (Wang et al., 2017; Yin
et al., 2018). In humans and other mammals, the small proteins myoregulin, sarcolipin,
and phospholamban regulate muscle activity by affecting calcium transport (Bal et al.,
2012; Andereson et al., 2015).
Despite the possible importance of small proteins, the true numbers of these
regulators remain unknown as their small size limits their identification. ORF-finding
algorithms traditionally employ a size limit for the scoring of genes (Goffeau et al., 1996)
and apply a penalty for overlapping other ORFs (Burge and Karlin, 1998). Their small
size also often prevents these proteins from being accurately detected with protein gels,
as they may run in the dye front and be poorly bound by SDS or protein dye (Congdon et
al., 1993). Traditional methods of purification are also biased against small proteins

122
(Scopes, 1994; Burgess and Deuscher, 2009), which have insufficient charge to bind ion-
exchange columns and insufficient size to interact with non-reverse phase hydrophobic
columns or be retained during dialysis. Additionally, small membrane proteins can bind
nonspecifically to many column matrices due to their hydrophobicity. Finally, the few
peptide fragments generated by proteolysis of small proteins limit detection by shot-gun
proteomics (Slavoff et al., 2013). These challenges have stifled the detection of this class
of proteins by standard methods.
As the importance of small proteins is being recognized, more focused searches
for these proteins are being carried out (Pueyo et al., 2016). Early genome-wide studies in
E. coli utilized conservation of intergenic DNA sequences and the strength of ribosome-
binding sites as a starting point for finding new small genes (Hemm et al., 2008;
VanOrsdel et al., 2018). Similar approaches have been applied in eukaryotic organisms
(Ladoukakis et al., 2011; Kessler et al., 2003), though the computational methods are
more difficult, as both the increased size of the genome and the use of alternative splicing
can mask small protein genes. In addition to the smORFs found in intergenic regions,
there is growing recognition that transcripts can encode proteins in more than one ORF in
the same region (Landry et al., 2015; Mouilleron et al., 2016); these alternative ORFs
(altORFs) generally code for smaller proteins than the originally annotated ORF, with
some reported altORF-encoded proteins as small as 14 amino acids (Vanderperre et al.,
2013). Despite the success of computational methods in identifying new smORFs, it is
likely that many small proteins have been missed (false negatives). Conversely it is
critical that the synthesis of predicted small proteins be verified to avoid false positives.
123
Integration of data from large transcriptome analyses can improve the success of
computational searches for smORFs. Ribosome profiling, a method that involves deep
sequencing of ribosome-protected mRNA fragments, reveals the position of ribosomes
throughout the transcriptome, clarifying which smORFs are translated under the
conditions examined (Hellens et al., 2016). This approach has led to the identification of
several small proteins (Neuhaus et al., 2017; Bazzin et al., 2014; Aspden et al., 2014;
baek et al., 2017), but again, there are limitations. Signals corresponding to altORFs
encoded inside the confines of other genes can be swamped by the signal of the annotated
gene. Another issue is that ribosome binding to an RNA does not prove that it leads to the
production of a polypeptide (Guttman et al., 2013). In eukaryotes, several signatures of
profiling data that argue for translation are the presence of strong start and stop codon
peaks as well as three nucleotide periodicity arising from the translocation of ribosomes
one codon at a time. In bacteria, however, these signatures are weaker and more variable
due to the lower resolution of the method, further complicating the discrimination of
which transcripts are translated and which are merely ribosome-bound.
Although peaks in ribosome density at start and stop codons are the most useful in
identifying new ORFs, the vast majority of ribosome-protected footprints in profiling
data correspond to elongating ribosomes. In eukaryotes, the antibiotics harringtonine and
lactimidomycin have been used to trap newly initiated 80S ribosomes at start codons and
identify initiation sites (Ingolia et al., 2011; Lee et al., 2012); elongating ribosomes are
not inhibited by these antibiotics and continue elongation, terminating normally at stop
codons. However, these compounds do not work in bacteria. Mori and co-workers found
that treating E. coli cultures with tetracycline, an antibiotic that blocks tRNA binding in

124
the ribosomal A site, leads to the accumulation of ribosome density at start codons. Using
ribosome profiling of tetracycline-treated cells, they were able to re-annotate the N-
termini of many known ORFs and discover candidate smORFs in intergenic regions
(Nakahigashi et al., 2016). However, tetracycline traps ribosomes imperfectly at start
codons. Only half the ribosomes on genes map to their start sites, blurring the signal. One
promising alternative, Onc112, prevents initiation complexes from entering into the
elongation phase (Seefeldt et al., 2015; Gagnon et al., 2016). Another promising
substitute, retapamulin, a small molecule member of the pleuromutilin class, was
previously shown to have a similar ability to specifically inhibit the first steps of
elongation (Dornhelm and Högenauer 1978). The recent application of retapamulin in
profiling experiments showed strong ribosome density at known start codons and little
density attributable to elongating ribosomes; these data allowed the identification of start
codons of altORFs within the coding sequences of other genes (Meydan et al., 2018).
Here we present a strategy for identifying small protein genes in E. coli by
combining traditional ribosome elongation data with information about initiation sites
gleaned from profiling experiments conducted with retapamulin and Onc112. We sought
to verify the synthesis of a subset of the predicted small proteins by assays to detect
tagged derivatives and observed expression of 38 of the 41 genes tested. These results
demonstrate that ribosome profiling with stalled initiation complexes provides a high
confidence prediction of new small proteins in bacteria. Finally, the presence and location
of these new smORFs reveals the density of information encoded by bacterial genomes.

125
4.3 Results: Onc112 traps ribosomes at start codons but does not
interfere with elongating ribosomes.
The identification of initiation sites in eukaryotes has been aided by the use of
antibiotics that enrich ribosome density at start codons in ribosome profiling experiments.
Since such antibiotics have not been available for bacteria, we tested a promising
candidate, Onc112, a proline-rich antimicrobial peptide (PrAMP) that binds in the exit
tunnel and blocks aminoacyl-tRNA binding in the ribosomal A site (Seefeldt et al., 2015;
Roy et al., 2015). Toeprinting analyses showed that Onc112 traps ribosomes at start
codons, blocking elongation (Gagnon et al., 2016). We hypothesized that Onc112 should
be selective for newly initiated 70S complexes because elongating ribosomes contain a
nascent polypeptide that should prevent antibiotic binding. To test this possibility, we
performed ribosome profiling on an untreated E. coli culture as well as one treated with
50 μM Onc112 for 10 min. As shown in Fig. 4.1a, ribosome density on the highly-
expressed lpp gene is spread across the coding sequence in the untreated sample but is
found almost exclusively at the start codon in the Onc112-treated sample. This effect
holds genome-wide; in plots of ribosome density averaged over thousands of genes
aligned at their start codons, a strong peak appears at the start codon while there is little
or no density attributable to elongating ribosomes within coding sequences (Fig. 4.1b).
These data show that like harringtonine and lactimidomycin in eukaryotes, Onc112
specifically traps ribosomes at start codons, while allowing elongating ribosomes to
complete protein synthesis and terminate normally.
126
4.4 Results: Ribosome profiling signals for Onc112 and retapamulin are
slightly different.
A recent study used retapamulin and ribosome profiling to identify sites of non-
canonical initiation within annotated ORFs (Meydan et al., 2018). Like Onc112,
retapamulin traps newly initiated 70S ribosomes at start codons while allowing
elongating ribosomes to complete protein synthesis, such that ribosome density is
strongly enriched at start codons (Fig. 4.1a). To compare the effects of Onc112 and
retapamulin treatment, we calculated the intensity of start codon peaks on annotated
ORFs, finding 3020 genes with any detectable ribosome density in the start codon region
in both samples. There is a strong correlation between start peak intensity in these two
antibiotic-treated samples (Spearman’s r = 0.83), arguing that both methods capture
initiating ribosomes in a reproducible way (Fig. 4.1c).
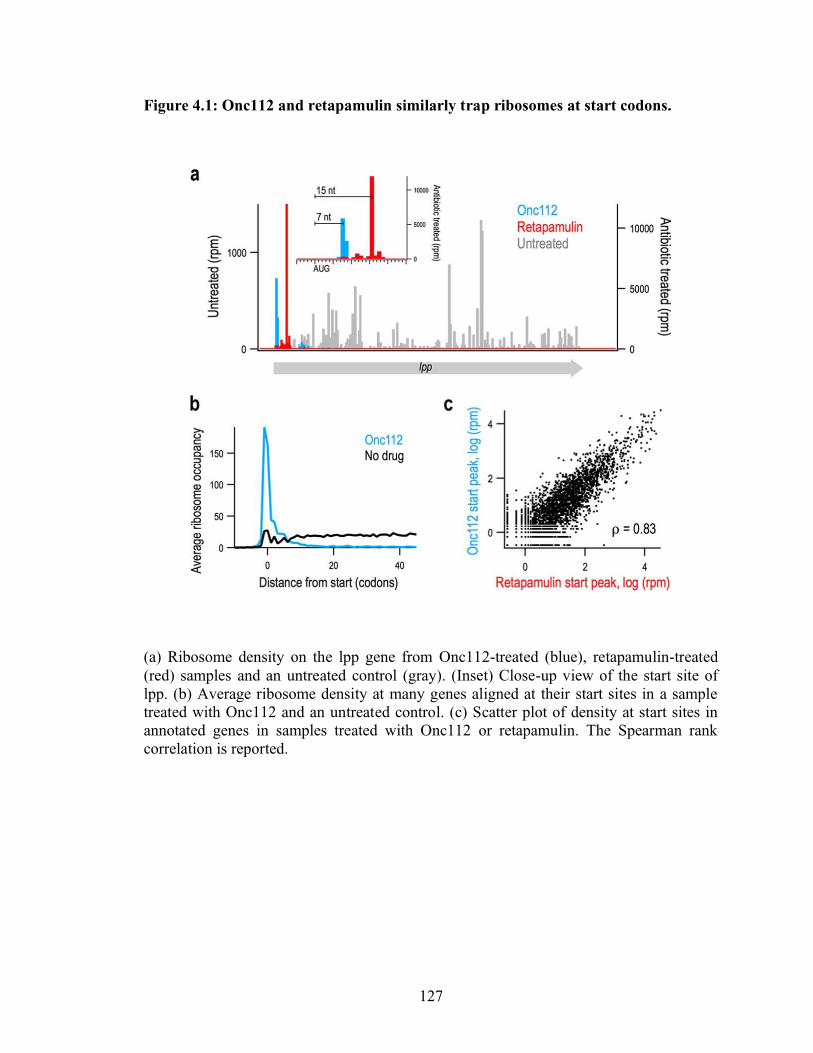
127
Figure 4.1: Onc112 and retapamulin similarly trap ribosomes at start codons.
(a) Ribosome density on the lpp gene from Onc112-treated (blue), retapamulin-treated
(red) samples and an untreated control (gray). (Inset) Close-up view of the start site of
lpp. (b) Average ribosome density at many genes aligned at their start sites in a sample
treated with Onc112 and an untreated control. (c) Scatter plot of density at start sites in
annotated genes in samples treated with Onc112 or retapamulin. The Spearman rank
correlation is reported.
128
Subtle differences may arise from variations in gene expression due to the
different culture conditions; the retapamulin-treated sample was cultured in LB media
whereas the Onc112-treated sample was obtained from a culture in complete synthetic
MOPS media (Fig. 4.S1). Another relevant difference in the sample preparation is that
our protocol with Onc112 includes pelleting the sample over a sucrose cushion prior to
nuclease treatment. This additional step depletes tRNAs from the ribosomal A site,
allowing nucleases to cleave within the ribosome, thus shortening ribosome footprints.
As a result, although the distance from the P-site codon to the 3’-boundary of the
ribosome is reliably 15 nt in the retapamulin-treated library, it is more variable in our
Onc112-treated library. Most often the peak is 6-10 nt downstream of the start codon; 7
nt in the lpp example (Fig. 4.1a). This difference is useful in annotating novel initiation
sites: an AUG codon 6-10 nt upstream of density in the Onc112 data and 15 nt upstream
of density in the retapamulin data has a high chance of being a bona fide start site and not
a sequencing artifact.
4.5 Results: Onc112 and retapamulin can be used to identify putative
translated smORFs.
Given the ability of Onc112 and retapamulin to trap ribosomes at start codons at
most annotated ORFs, we combined the information from these datasets to create a high-
fidelity screening method for identifying new smORFs likely to be translated (Fig. 4.2a).
We first generated a list of 160,995 smORFs of eight codons or longer whose start
codons (AUG, GUG, or UUG) are 18 nt or more away from annotated coding regions
(either protein coding sequences or functional RNA genes).

129
Figure 4.2: Using ribosome profiling data to discover new smORFs.
(a) Flow chart showing the criteria used to identify smORFs in intergenic regions. (b)
CDF plot showing the percentage of known, annotated smORFs (n = 44) (right y axis,
black and gray) on the y axis less than or equal to the ribosome density near the start site
(x axis) compared with candidate smORFs (n = 160,995) (left y axis, red and orange).
Candidates with an average of >5 rpm were selected for further screening (broken line).
(c) The proper spacing of ribosome density at start codons in treated samples helps to
identify bona fide small protein-coding genes such as ORF22/yqgH. (d) In cases where
several start codons could explain the ribosome density, spacing helps determine the
correct site. ORF9/yhiY likely initiates with the second AUG codon of the three shown.
(e) Many candidates were rejected because the start site does not align properly with the
density observed.

130
We computed the ribosome density associated with each start site, including
ribosome footprints 0-18 nt downstream of the first nt in the start codon. A CDF plot of
these data are shown in Fig. 4.2b (left axis); the y-value reflects the percentage of
predicted smORFs that have a start peak less than or equal to the x-value. This plot shows
that ~ 96% of the putative smORFs have no associated density at their start sites (x = 0).
This means that ~ 4% have start peaks greater than zero. Only 0.25% of the predicted
smORFs had more than 5 reads per million mapped reads (rpm), as delineated by the
dotted line in Fig. 4.2b. Thus, the vast majority of the putative smORFs likely are not
translated.
To calibrate our method for identifying new candidate smORFs, we examined the
ribosome density on the start codons of smORFs previously shown to encode proteins.
The test set included two different groups. The first group was comprised of 44 small
proteins annotated initially together with small proteins identified by sequence
conservation and strong matches to ribosome binding site models (Hemm et al., 2008).
The ribosome density after retapamulin or Onc112 treatment varied by four orders of
magnitude (Table 4.S1, see in https://mbio.asm.org/content/mbio/10/2/e02819-
18/DC2/embed/inline-supplementary-material-2.xlsx?download=true): ~80% of this
group had detectable signal at start sites and ~60% of known smORFs had start peaks
above 5 rpm (Fig. 4.2b, right axis). The second group of proteins had less conservation
and weaker matches to ribosome binding site models but were shown to be synthesized as
tagged derivatives in a recent study (VanOrsdel et al., 2018). Of the 36 proteins in the
second set, ~70% showed signal but only 20% had Onc112 or retapamulin reads above 5
rpm at the start site (Table 4.S1), possibly due to the lower level of expression of these
131
smORFs. Given that the majority of the small proteins in the first set of annotated
smORFs have start peaks 5 rpm or higher (Fig 4.2b), we used this threshold to eliminate
false positives in our list of putative smORFs; 412 novel smORFs above this threshold
were selected for further consideration.
An important caveat in treating cells with Onc112 and retapamulin is that these
antibiotics could enhance ribosome density on some initiation sites that are not normally
used. The antibiotics dramatically increase the concentration of free 30S and 50S
subunits given that they allow elongating ribosomes to complete protein synthesis and be
recycled but block entry into the elongation cycle. The recycled subunits are free to
initiate at less optimal start codons, where they will be trapped by the antibiotics. To
remove these false positives, we used traditional ribosome profiling data (from untreated
cells) to capture elongating ribosomes along the entire ORF. Of the 412 smORFs with
strong start codon peaks, 116 had traditional ribosome profiling density above 8 reads per
kilobase per million mapped reads (rpkm).
We next examined the 116 most promising candidates on a genome browser. In
our screen for ribosome density at initiation sites (Fig. 4.2a), we summed the reads from
0-18 nt downstream of the first nucleotide in the start codon, an intentionally broad range.
In our visual inspection, we searched for retapamulin peaks ~15 nt and Onc112 peaks 6-
10 nt downstream of the first nt in the start codon as seen for lpp (Fig. 4.1a). The same
spacing is observed for the most promising candidates (e.g. ORF22/yqgH in Fig. 4.2c). In
some cases of multiple possible start codons, we were able to readily predict the correct
start based on distance (e.g. ORF9/yhiY, Fig. 4.2d). For most of the candidates that were
rejected, the predicted start site did not align with the Onc112 or retapamulin ribosome
132
density (Fig. 4.2e). Another source of false positives were smORFs close to highly-
translated genes, such as ribosomal proteins, where the noise is high enough to pass the
cutoff for start peaks and normal profiling density (data not shown). Based on these
criteria, 67 candidates were rejected, leaving 49 candidates. Visual inspection proved
helpful in refining the data, but in the future, our algorithms can be further developed to
incorporate additional criteria for large-scale screens for candidate smORFs.
We also inspected 50 additional smORFs with strong start peaks (>5 rpm) for
which we were unable to calculate rpkm values for elongating ribosomes because the
smORFs overlap an annotated gene and the ribosome density cannot be assigned to one
gene or the other. Upon inspection, 36 of these were rejected due to incorrect start site
selection or high levels of noise due to adjacent highly-translated genes, leaving 14 of
interest. In addition to these 14 candidates and the 49 discussed above, another three were
discovered as the correct start sites for candidates that were rejected, and two more were
discovered in a preliminary screen using similar cutoffs but a different collection of
traditional ribosome profiling data.
Together, this workflow yielded 68 candidate smORFs with high start codon
peaks and some level of traditional ribosome profiling data, including both independent
genes and altORFs (Table 4.S3, see in https://mbio.asm.org/content/mbio/10/2/e02819-
18/DC6/embed/inline-supplementary-material-6.xlsx?download=true). Initially, the
smORFs were assigned numbers, but were renamed if we obtained evidence of small
protein synthesis (see below). As expected, the majority of these candidates start with
AUG codons (50), although GUG (9) and UUG (9) codons were also observed. A
histogram of the predicted protein lengths is shown in Fig. 4.S2: the majority of the
133
predicted small proteins are 40 amino acids or shorter, although the analysis also
identified seven candidates that were longer than 50 residues. A few of the candidates are
overlapping in that they correspond to different possible start codons in the same frame.
4.6 Results: The majority of predicted small proteins are synthesized.
To validate that the corresponding small proteins are synthesized, an SPA tag was
integrated into the chromosome upstream of the stop codon of the 38 putative smORF
genes with the highest ribosome density in the presence of the inhibitors and deemed the
strongest candidates by the visual inspection. The tag allowed immunoblot analysis on
the basis of the 3X FLAG epitope (Fig. 4.3). While the exposure needed to detect the
small proteins varied significantly (as reflected in different levels of the background
bands), 36 of the 38 tagged small proteins were detected in cells grown to exponential or
stationary phase in LB at 37˚C, conditions comparable to those used in the ribosome
profiling experiments. The inability to detect the remaining two chromosomally-tagged
smORFs (ORF24 and ORF56) could stem from these smORFs being false positives in
the screen or from the degradation of the tagged derivatives. We have nonetheless
observed the expression the majority of the predicted genes, validating the predictive
capability of utilizing multiple ribosome profiling datasets.
Several previously detected small proteins are only expressed under very specific
growth conditions (17, 37). As shown in Fig. 4.3, we observe that 10 newly-detected
small proteins are present at >2-fold higher levels in exponential phase and four are
present at >2-fold higher levels in stationary phase. The majority of the small proteins
appear at roughly-equal levels during both of these growth phases but may be induced
under other conditions.
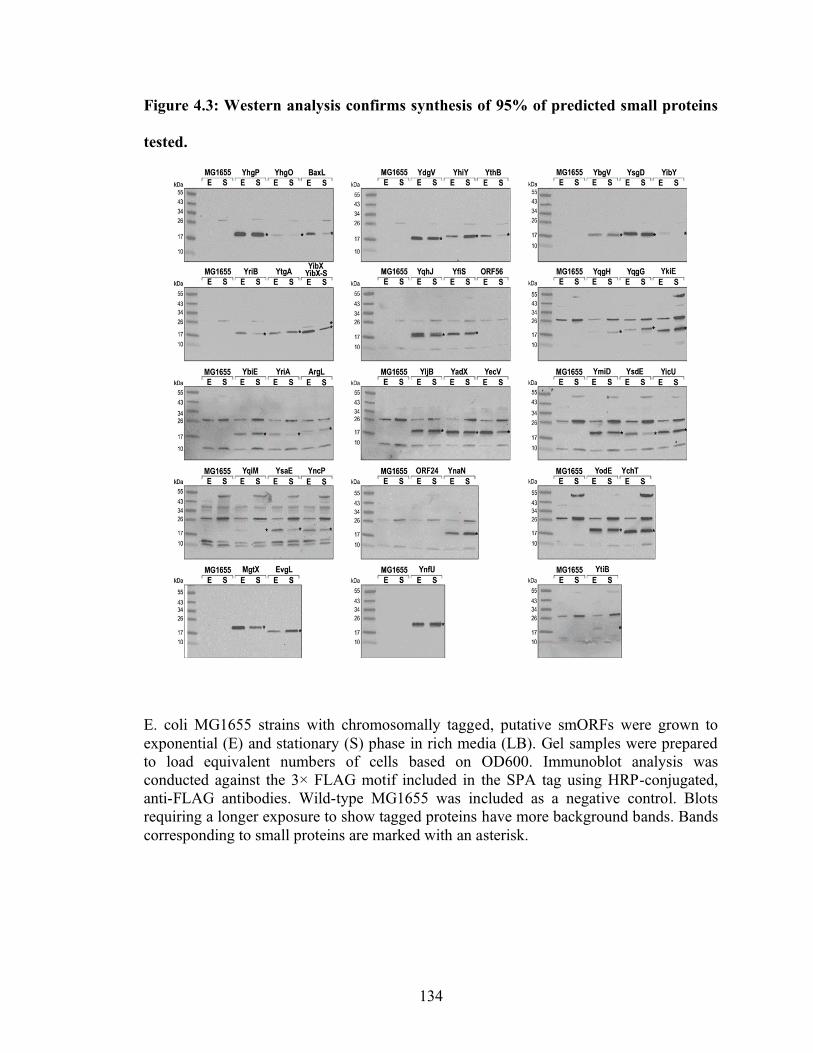
134
Figure 4.3: Western analysis confirms synthesis of 95% of predicted small proteins
tested.
E. coli MG1655 strains with chromosomally tagged, putative smORFs were grown to
exponential (E) and stationary (S) phase in rich media (LB). Gel samples were prepared
to load equivalent numbers of cells based on OD600. Immunoblot analysis was
conducted against the 3× FLAG motif included in the SPA tag using HRP-conjugated,
anti-FLAG antibodies. Wild-type MG1655 was included as a negative control. Blots
requiring a longer exposure to show tagged proteins have more background bands. Bands
corresponding to small proteins are marked with an asterisk.

135
4.7 Results: The levels of tagged small proteins span a wide range.
As indicated above, the ability to detect the small proteins varied. To directly
compare the overall levels of the proteins, both among themselves and with previously
identified small proteins, we analyzed stationary phase samples of several examples of
each group of proteins (Fig. 4.4). Among the newly-identified proteins, the levels of
YnfU are highest, but these levels fall between the characterized multi-drug efflux pump
regulator AcrZ (diluted 5-fold in Fig. 4.4) and uncharacterized protein YoaK, which,
respectively, are among the better- and worse-expressed small proteins identified initially
(Hemm et al., 2008). The levels of the remaining small proteins cover a wide range, as is
seen when comparing the samples (YsgD and YthB) loaded on two different gels as a
reference. These blots also show that most of the other newly-identified small proteins
are expressed at levels below YoaK under the conditions tested.
We also compared the levels of the new small proteins to five (YnaM, YnfS,
YgbU, YddY and YmjE) of the 36 small proteins identified more recently (VanOrsdel et
al., 2018). Three of the tested proteins (YnaM, YnfS and YbgU) are observed at levels
comparable to most of the newly-identified small proteins, while two (YddY and YmjE)
are more comparable to the least-abundant small proteins identified in this study (Fig.
4.4). It is interesting to note that YnaM, which had no ribosome density at start codons in
the presence of retapamulin or Onc112, was detected at higher levels than most of the
newly-detected small proteins, while YnfS, which has strong start peaks in both
antibiotic-treated samples, was detected at lower levels.

136
Figure 4.4: Observed small protein levels span several orders of magnitude
Stationary-phase samples grown in LB from Fig. 4.3 (black) were compared to each other
and to similarly prepared samples of previously detected small proteins (gray) with the
same chromosomal tag. Immunoblot analysis for cells grown to stationary phase was
conducted as described in the legend to Fig. 4.3 with E. coli MG1655 as a negative
control. All samples are in the MG1655 background and equally loaded, except for AcrZ,
where the sample was diluted 1:5. Ponceau S staining for the same region is shown below
each immunoblot.

137
4.8 Results: Some small proteins are encoded antisense to genes
encoding expressed proteins.
Given that antisense transcription in bacteria frequently is a means of gene
silencing (Sesto et al., 2013; Georg and Hess, 2018), we were surprised to note that eight
of the newly detected proteins are encoded antisense to annotated protein-coding genes
(Table 4.1, see in https://mbio.asm.org/content/10/2/e02819-18/figures-only, Table 1).
Additionally, one predicted smORF, yoaM, could not be tagged as it is found antisense to
the operon of the essential nrdA and nrdB genes (encoding ribonucleoside-diphosphate
reductase 1) (Fig. 4.5a). To test for expression of YoaM, we generated a translational
fusion at the lacZ locus. Consistent with translation of this antisense-encoded small
protein, we detect higher -galactosidase expression for the yoaM-lacZ fusion than for an
out-of-frame control fusion (Fig. 4.5e). Given that a clear transcriptional start was noted
174 nucleotides upstream of the YoaM start codon (Thomason et al., 2015), it is possible
that the synthesis of this protein is under post-transcriptional regulation.

138
Figure 4.5: Novel smORFs (blue) are encoded antisense to known genes (gray).
(a to d) Gene organization for the nrdB-yoaM (a), yqgC-yqgG (b), yghE-yqhJ (c), and
waaL-yibX-yibY (d) loci. β-Galactosidase activity was assayed for cells carrying
chromosomal fusions of the 5′ UTR and initial codons of yoaM fused to lacZ as well as
out-of-frame control fusion (e), which were grown in rich media (LB) with 0.2%
arabinose. (f to h) Protein levels for chromosomally SPA-tagged yqgC and yqgG (f),
yghE and yqhJ (g) and waaL and yibX (h) genes. Gel samples were prepared from
MG1655 strains grown to exponential (E) and stationary (S) phase in LB. Immunoblot
analysis was conducted as described in the legend to Fig. 4.3 with MG1655 as a negative
control. Bands corresponding to small proteins are marked with an asterisk, and bands
corresponding to antisense-encoded larger proteins are marked with two asterisks.
139
We wanted to determine whether annotated proteins and the newly-identified
small proteins encoded by transcripts on opposing strands are both synthesized. We
therefore introduced chromosomal tags upstream of the stop codons of the previously-
annotated genes yqgC (antisense to yqgG) (Fig. 4.5b), yghE (antisense to yqhJ) (Fig.
4.5c) and waaL (antisense to yibX and yibY) (Fig. 4.5d). The yqgC gene (a protein of
unknown function) does not have any associated ribosome density in either treated or
untreated cells and the corresponding tagged protein is not observed under these
conditions (Fig. 4.5f). YghE (another protein of unknown function), while detected,
appears to be present at lower levels than YqhJ (Fig. 4.5g), consistent with its low levels
of normal ribosome density (not visible at the scale used in Fig. 4.5c). WaaL (an O-
antigen ligase) was clearly detected under the same growth conditions as YibX and
YibX-S (Fig. 4.5h). We suggest the appearance of a smear for WaaL may be due to
bound oligosaccharide substrates. In general, our results confirm that proteins can be
encoded by both strands of the same region of DNA and expressed under the same
growth conditions.
4.9 Results: YibX is translated as two isoforms.
The yibX gene was also interesting as the profiling data suggested translation
could initiate from two different start codons. While most bacterial ORFs encode a single
protein, there are some examples where different isoforms of the same protein are
generated by different translation starts in the same frame, as has been found for the E.
coli proteins ClpB, IF-2, and MrcB (Squires et al., 1991; Sacerdot et al., 1984; Ross et al.,
1989). Frequently, the longer polypeptide is expressed at higher levels than the shorter
isoform. A broad peak near the start codon for the ribosome profiling data suggests that
140
several small proteins are potentially translated as different isoforms. Although most of
the potential isoforms vary by only a few codons and would be indistinguishable on
immunoblots, the YibX alternative start sites lead to proteins of substantially different
sizes. The stronger signal corresponds to the 24-aa YibX-S protein, while a second signal
at a GTG codon upstream and in frame with YibX-S yields an 80-aa protein adding ~6.1
kDa (Fig. 4.5h). Both bands are detected in Fig. 4.3 and Fig. 4.5, but contrary to other
known primary isoforms, the 80-amino acid protein is detected at lower levels than the
shorter isoform. A second example of possible isoforms is YqhJ, which shows two bands
in Fig 4.5g. YqhJ initiates at a GTG codon and is 19 residues long; initiation at a
downstream TTG codon would yield a 13-residue protein (Table 4.S3, see in
https://mbio.asm.org/content/mbio/10/2/e02819-18/DC6/embed/inline-supplementary-
material-6.xlsx?download=true). Ribosome density in retapamulin and Onc112 treated
samples is consistent with both of these initiation sites being used (data not shown).
4.10 Results: Multiple smORFs are encoded by different, overlapping
frames.
There are a growing number of bacterial examples where more than one protein is
encoded in the same region in different frames, as has been found for rzoD encoded
within rzpD, which are homologous to the rz/rz1 lysis cassette of bacteriophage (Zang
and Young, 1999; Toba et al., 2011). A similar gene arrangement of nested start codons
and substantial overlap is also found for two sets of newly-identified small proteins:
YhgO/YhgP (Fig. 4.6a) and YriA/YriB (Fig. 4.6b). Additionally, the smORFs encoding
two other new proteins, YbgV and MgtT, overlap the 3’-ends of the previously identified
smORFs ybgU (Fig. 4.6c) and mgtS (Fig. 4.6d), respectively. We sought to compare the

141
levels of the paired small proteins under the same conditions by assaying cells with one
or the other smORF tagged (Fig. 4.6e-h). Although there generally appears to be limited
correlation between ribosome density and observed protein levels, for each of these pairs,
the small protein corresponding to the smORF with the higher ribosome density with
either retapamulin or Onc112 treatment (YhgP, YriB, YbgV and MgtS) was present at
higher levels. Perhaps there is a better correlation between ribosome density and
observed protein levels for co-transcribed genes.
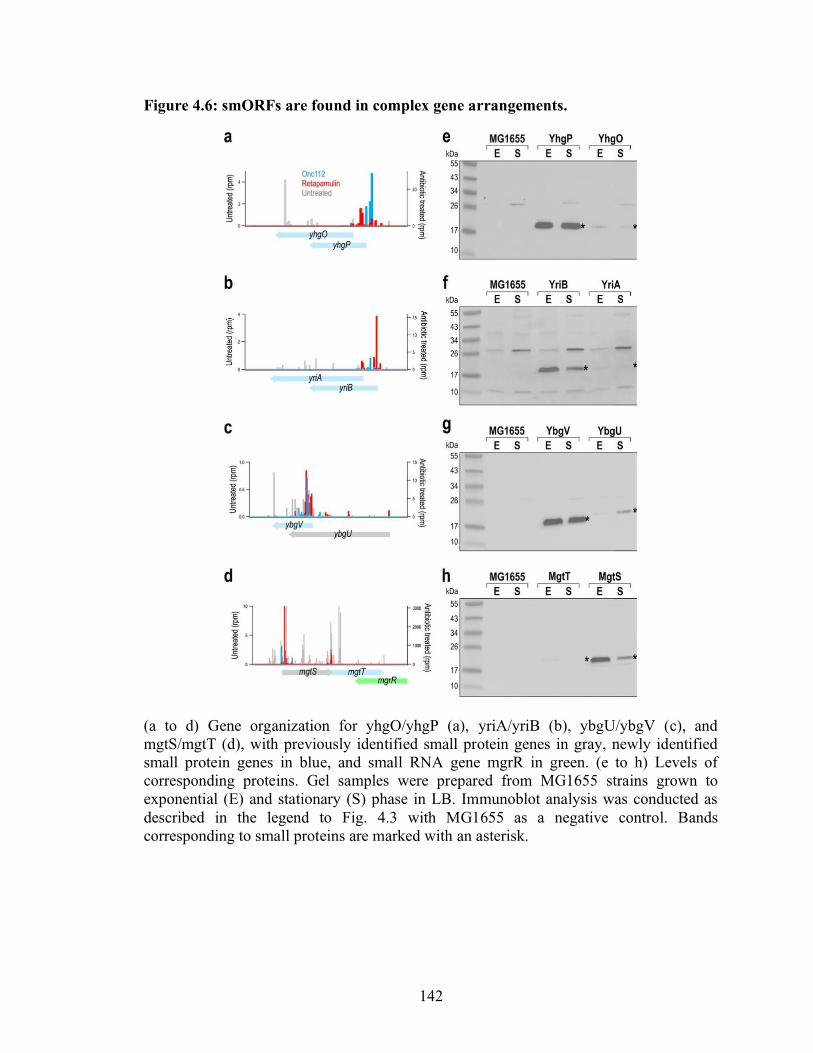
142
Figure 4.6: smORFs are found in complex gene arrangements.
(a to d) Gene organization for yhgO/yhgP (a), yriA/yriB (b), ybgU/ybgV (c), and
mgtS/mgtT (d), with previously identified small protein genes in gray, newly identified
small protein genes in blue, and small RNA gene mgrR in green. (e to h) Levels of
corresponding proteins. Gel samples were prepared from MG1655 strains grown to
exponential (E) and stationary (S) phase in LB. Immunoblot analysis was conducted as
described in the legend to Fig. 4.3 with MG1655 as a negative control. Bands
corresponding to small proteins are marked with an asterisk.
143
4.11 Results: smORFs overlap the 5´ ends of larger protein coding
genes.
The genes of three new small proteins detected by immunoblot analysis (Fig. 4.3)
were found to overlap the 5´end of annotated larger genes in a different frame: baxL-
baxA, evgL-evgA, and argL-argF. Two additional smORFs predicted by ribosome
profiling, ORF33 and pssL, also overlap the 5´ end of the neighboring gene in a different
frame, but we were unable to SPA-tag these predicted proteins given the downstream
genes, accD (acetyl-CoA carboxyltransferase subunit ) (Fig. 4.7a) and pssA
(phosphatidylserine synthase) (Fig. 4.7b), are essential. To investigate the expression of
ORF33 and PssL, the 5’-UTR and the first few codons of the smORFs were
translationally fused to lacZ on the chromosome (Mandin and Gottesman, 2009). While
there was no measurable -galactosidase activity for the ORF33-lacZ fusion (Fig. 4.7f),
there was clear expression of the pssL-lacZ fusion, which was diminished by the
introduction of a stop codon at the start codon position (Fig. 4.7g). These results indicate
that although we could not construct a pssL-SPA fusion at the endogenous location of the
genome, the protein is translated.
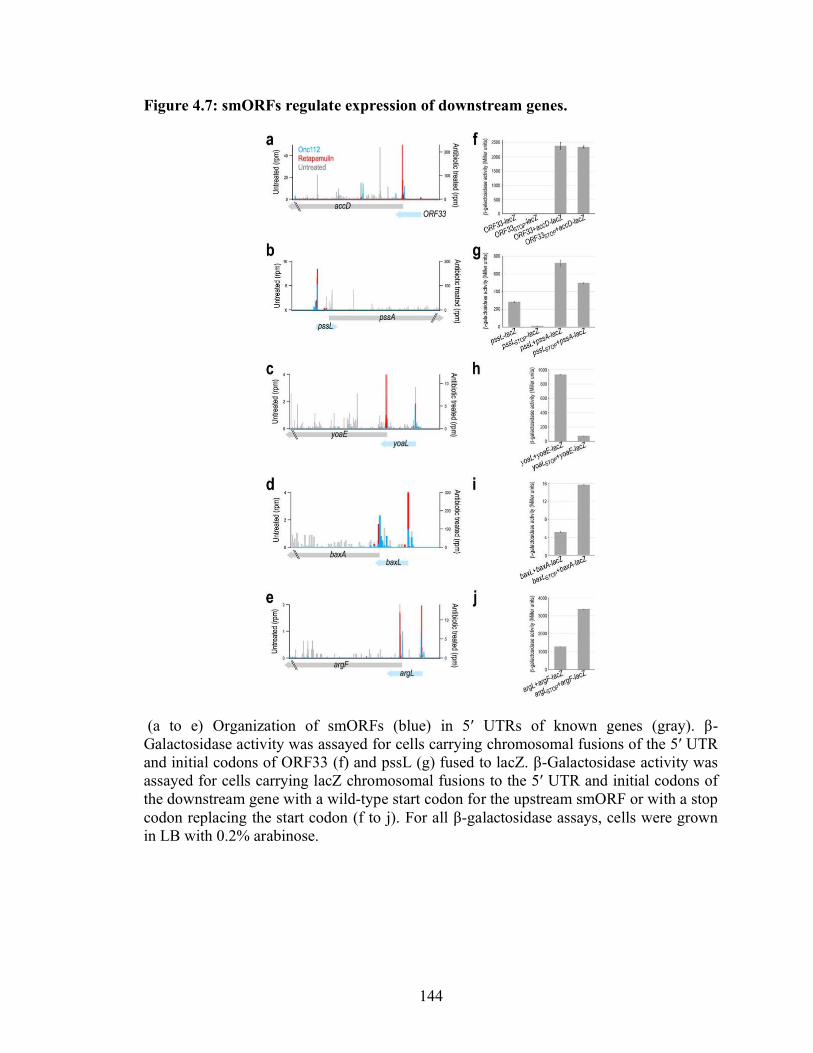
144
Figure 4.7: smORFs regulate expression of downstream genes.
(a to e) Organization of smORFs (blue) in 5′ UTRs of known genes (gray). β-
Galactosidase activity was assayed for cells carrying chromosomal fusions of the 5′ UTR
and initial codons of ORF33 (f) and pssL (g) fused to lacZ. β-Galactosidase activity was
assayed for cells carrying lacZ chromosomal fusions to the 5′ UTR and initial codons of
the downstream gene with a wild-type start codon for the upstream smORF or with a stop
codon replacing the start codon (f to j). For all β-galactosidase assays, cells were grown
in LB with 0.2% arabinose.

145
4.12 Results: Role of smORFs regulating expression of larger protein
encoded downstream.
Given other examples where smORFs overlapping downstream genes serve as
leader peptides involved in modulating the translation of the larger gene (Park et al.,
2017; Gollnick and Babitzke, 2002), we next sought to investigate whether translation of
the smORFs overlapping larger ORFs described above affects translation of the
downstream ORF. To test this, the entire 5´ UTR including the smORF together with the
first codons of the downstream gene was fused to lacZ at the endogenous lacZ locus. We
also generated a second version of these constructs by introducing amber or ochre stop
codons into the smORF as a replacement for the start codon. If translation of the two
ORFs is coupled, the stop codon, which blocks the expression of the upstream smORF,
should impact translation of the downstream gene. In the case of the ORF33-accD pair,
for which we did not see any expression of ORF33, the stop codon had no impact on
accD-lacZ expression (Fig. 4.7f). In contrast, introduction of a stop codon into pssL led to
a 30% decrease in the expression of the pssA-lacZ fusion (Fig. 4.7g), while introduction
of a stop codon into yoaL, a recently identified smORF (VanOrsdel et al., 2018), led to
strongly decreased expression of yoaE-lacZ (Fig. 4.7h). An increase in the expression of
the downstream gene is observed when stop codons are introduced into baxL (Fig. 4.7i)
and argL (Fig. 4.7j). Together these results indicate that translation of these upstream
smORFs may be playing a regulatory role.

146
4.13 Discussion
Fundamentally, the challenge of identifying expressed small proteins stems from
the great number of putative smORFs, with ~161,000 possible smORFs in intergenic
regions of E. coli alone. The key question is how to best identify and validate candidate
smORFs in a manner that prevents the annotation of uncorroborated genes. Rather than
relying solely on bioinformatics approaches, as has been done previously, we
demonstrated that an approach that utilizes multiple ribosome profiling datasets can
identify translated smORFs with a high degree of accuracy. The expression of 36 of these
smORFs was verified by immunoblot analysis of the chromosomally-tagged genes, and
the expression of two other genes that could not be tagged at the endogenous loci was
observed as chromosomal lacZ fusions. We noted a number of interesting gene
arrangements including small proteins encoded on the strand opposite larger, annotated
proteins, as well as smORFs in the 5´-UTR of known genes.
Limitations of approach. While we were able to identify many new small
proteins, we are cognizant of some limitations. One important caveat is that start codon
peak intensity in profiling experiments is not a truly quantitative measure of initiation
rates, given that reads at a single site are prone to sequence-specific artifacts (Gao et al.,
2015). Examination of the profiling data of previously-identified smORFs illustrates this
limitation, as there is not a strong correlation between ribosome density in the presence of
the initiation complex inhibitors and the band intensity observed by immunoblot analysis.
While the degradation of some tagged small proteins may explain ribosome density
without corresponding protein bands, other smORFs yield strong bands without any
sequencing reads in the profiling experiments. Determining the factors that contribute to
147
the perceived mismatch between ribosome density and observed protein levels would
allow for a more accurate prediction of expression. It also must be considered that,
although only occurring for a short duration, treatment with retapamulin or Onc112
represents a stress upon the bacteria that can cause changes in the expression profile.
One other major limitation regarding the general application of this approach is
that the microbes must be susceptible to these initiation complex inhibitors. Retapamulin
is a member of the pleuromutilin class of antibiotics that show activity against a broad
spectrum of gram-positive bacteria, though some derivatives show activity against gram-
negative bacteria as well (Goeth et al., 2018; Novak, 2011). To increase susceptibility to
retapamulin, the group of Vázquez-Laslop and Mankin (Meydan et al., 2018) used a tolC
mutant strain of E. coli, an approach that may need to be employed in other bacteria.
Onc112, a member of the PrAMP family of peptide antibiotics, is actively transported
into gram-negative bacteria by proteins such as the SbmA transporter (Mattiuzzo et al.,
2007). It may be possible to extend the range of compounds like Onc112 by exogenous
expression of transporters such as SbmA in bacteria that otherwise lack them.
Advantages of approach. Despite the possible limitations, the ability to identify
start codons through ribosome profiling with inhibitors is a powerful approach with broad
applications. As shown here, translated smORFs are more prevalent than previously
believed and are found in contexts that would be difficult to distinguish by other
methods, including bioinformatics approaches that have been successfully employed
previously (Hemm et al., 2008, VanOrsdel et al., 2018). While traditional ribosome
profiling can guide the prediction ( Hücker et al., 2017; Friedman et al., 2017) or, in
conjunction with experiments to verify protein synthesis, even support the annotation of

148
intergenic smORFs in bacteria (Baek et al., 2017), ribosome profiling with stalled
initiation complexes allows for new ORFs to be located in contexts that are generally-
ignored, including within or overlapping other genes as shown here and by the group of
Vázquez-Laslop and Mankin (Meydan et al., 2018). These new, internal altORFs may
represent a new class of functional and regulatory proteins that comprise an ever-
expanding proteome.
Interestingly, we noted relatively poor overlap between our predicted smORFs
and those reported in the other ribosome profiling studies (Baek et al., 2017; Nakahigashi
et al., 2016) suggesting that many small proteins remain to be discovered. Of the 328
smORFs predicted by Mori and co-workers in intergenic regions in E. coli based on
ribosome enrichment at start codons after treatment with tetracycline, only 20 overlap
with our list of 68 likely candidates (Table 4.S3). The fact that retapamulin and Onc112
are more specific than tetracycline for newly initiated ribosomes, providing higher
resolution for start codon identification, may partially explain the limited overlap with
our predicted smORFs. We also looked for overlap between our 68 likely candidates and
the 130 smORFs predicted in Salmonella enterica in a recent study using traditional
ribosome profiling (Baek et al., 2017). Only one exact match and three close matches
were found between these closely related species.
In addition to facilitating the identification of new smORFs, the profiling data
with inhibitors provide valuable information about known ORFs and suggest the need to
reannotate some genes (Table 4.S1). One example is the smORF ymiA, which is
annotated both as beginning with MLISDGDYMRLAMPSGNQEP (Consortium, 2015)
and as beginning with the third methionine at MPSGNQEP (Hemm et al., 2008), but
149
likely initiates with MRLAMP (Fig. 4.S3). Another example is the ymdG protein.
Although it is annotated as 40 residues, our data show that a later start codon is used and
that the smORF is only eight codons long (Fig. 4.S3). Finally, yoaL, which was herein
examined for function as a leader peptide (Fig. 4.7), was originally annotated as initiating
on a methionine 13 codons upstream of its likely start site (VanOrsdel et al., 2018) (Fig.
4.S3).
Small protein function. Many of the small proteins are expected to have
functions that involve the binding to other, larger proteins. However, the primary
structures of the small proteins are often too short for bioinformatics tools to identify
motifs or domains that may offer insights into their functions in the cell. Of the newly-
identified small proteins, only YnfU, which is encoded within the Qin prophage region of
the E. coli genome, had an identifiable motif. The protein contains a pair of zinc
knuckles, a motif with two copies of the CPXC sequence that together chelate a zinc ion
(Krishna et al., 2003). Homology modelling of YnfU using PSIPRED (Lobley et al.,
2009) also revealed a moderate match to the zinc-binding domain of PA0128, a protein of
unknown function from Pseudomonas aeruginosa.
Although motif identification is often not available for smORFs, multiple
previously-identified proteins were predicted to contain transmembrane helices and were
later experimentally verified to localize to the cellular membrane (Hemm et al., 2008).
When we examined the sequences of the new smORFs using the Phobius or ExPASy
TMpred algorithms (Ikeda et al., 2003; Kall et al., 2004), none of the newly-identified
proteins were predicted to contain transmembrane helices. This analysis shows that the
skew toward hydrophobic -helices overall is not as strong as observed for the first small
150
E. coli proteins identified Hemm et al., 2008). In general, the next challenge will be to
determine functions for the large numbers of newly-identified proteins.
Four new smORFs and one previously annotated smORF were examined for
possible roles as leader peptides, as these small protein genes overlap the downstream
coding sequences of larger proteins in alternate frames (Fig. 4.7). For each of the
expressed genes, either an increase or decrease in the translation of the downstream gene
was observed when the upstream smORF was not translated. For genes where expression
decreases, this drop may stem from a loss of translational coupling from the upstream
gene, while for genes with improved expression, translation of the smORF may impede
translation of the downstream gene. It is interesting to note that a mutation (pssR1) that
leads to increased expression of pssA mapped to the anti-Shine-Dalgarno sequence of the
16S rRNA encoded by rrnC (Bartoli et al., 2017). Further characterization will be
required to distinguish smORFs that are simply translated in operons versus those that
specifically serve to control the translation of downstream genes as well as to elucidate
the regulatory mechanisms.
Complex gene organization. Beyond the expanded presence of smORFs as
possible upstream leaders of other genes, our analysis also pointed to other forms of
complex gene organization. We found several smORFs that overlap other new or known
smORFs. We also discovered small proteins encoded antisense to larger proteins, as well
as at least one small protein that is translated as two isoforms. We hypothesize the pairs
of bacterial genes encoded in overlapping regions have related functions.
Since we think we have not yet identified the complete set of small protein genes,
we suggest that antisense genes and translational regulation by upstream smORFs may be

151
far more prevalent than currently thought. Full annotation of translated regions of the
chromosome will be required to obtain a more comprehensive picture of cellular
regulation. Additionally, more complete annotation will provide a better understanding of
the roles of the many seemingly orphan transcription start sites observed in transcriptome
data (Thomason et al., 2015). The use of ribosome profiling with initiation complex
inhibitors revealed 38 new protein-coding genes in E. coli, an organism already known to
express nearly 100 small proteins. For less well characterized bacteria, the ability to
define the small proteome accurately and in an unbiased manner opens new doors to
uncovering the regulation that allows the growth and survival of these organisms.
4.14 Materials and Methods
Onc112 ribosome profiling. A culture of E. coli MG1655 was grown overnight
at 37˚C in MOPS EZ Rich Defined media (Teknova) with 0.2% glucose, diluted 1:100
into 150 mL of fresh media, and grown to OD600 = 0.3. The culture was treated with 50
µM Onc112 for 10 min and harvested by rapid filtration and freezing in liquid nitrogen.
Ribosome profiling libraries were prepared and sequenced as described (Woolstenhulme
et al., 2015) except that the lysis buffer contained 1 M NaCl to arrest translation instead
of chloramphenicol. Following lysis and clarification, 25 AU of RNA in the lysate was
pelleted over a 1 mL sucrose cushion (20 mM Tris pH 7.5, 500 mM NH4Cl, 0.5 mM
EDTA, 1.1 M sucrose) using a TLA 100.3 rotor at 65,000 rpm for 2 h. Pellets were
resuspended in 200 µL of the standard lysis buffer and the RNA was digested with
MNase following the standard protocol.
Analysis of ribosome profiling data. Raw reads were filtered and trimmed using
Skewer v0.2.2. Reads were mapped uniquely to the MG1655 genome NC_000913.3

152
(allowing two mismatches) using Bowtie v 0.12.7 after reads mapping to tRNA and
rRNA were discarded. Ribosome density was assigned to the 3’-end of reads. We
identified novel open reading frames 8 sense codons or longer starting with ATG, GTG,
or TTG codons at least 18 nt away (on either side) from any annotated genes. For each
candidate, the ribosome density in retapamulin or Onc112 treated samples was summed
0-18 nt downstream of the first nt in the start codon to calculate the initiation peak
intensity. We also calculated rpkm values for normal ribosome profiling data for each
candidate smORF unless any part of it comes within 15 nt of an annotated gene. Each of
these candidates and their scores are reported in Table 4.S2,
(https://mbio.asm.org/content/mbio/10/2/e02819-18/DC5/embed/inline-supplementary-
material-5.xlsx?download=true). The retapamulin data can be found at GSE122129 and
the Onc112 data can be found at GSE123675.
Strain construction. All strains generated for this study are listed in Table 4.S4
(https://mbio.asm.org/content/mbio/10/2/e02819-18/DC7/embed/inline-supplementary-
material-7.xlsx?download=true) together with the sequences of the oligonucleotides used
to construct the strains. smORFs were tagged on the chromosome following published
procedures (Yu et al., 2000). In short, an SPA-kan cassette was inserted at the C-terminal
end of each ORF using the Red recombination system in E. coli NM400 and moved
into E. coli MG1655 by P1 transduction. All insertions were verified by sequencing.
Construction of the lacZ reporter strains followed published procedure (Mandin
and Gottesman, 2009). In brief, DNA including the 5’-UTR and several codons of each
ORF, along with flanking homology regions, were transformed into E. coli PM1205,
153
which utilizes the Red-mediated recombination system, and selected for sucrose
resistance. All insertions were verified by sequencing.
Immunoblot analysis. For all expression experiments, Luria broth (LB) was
inoculated 1:200 with overnight culture of various strains and grown at 37˚C. One mL of
culture was taken during exponential growth (two h post inoculation, OD600 = 0.5-0.7)
and during stationary phase (3.5 h post inoculation, OD600 = 2.5-3). To normalize for
total cell (number/density/count), the cell pellet collected for each sample was
resuspended according to the OD600. Samples were analyzed on SDS-PAGE, transferred
to nitrocellulose membranes, and blotted using anti-FLAG(M2)-HRP (Sigma).
Assays of -galactosidase activity. For all experiments, LB with 0.2% arabinose
was inoculated 1:200 with overnight culture of PM1205 strains carrying various lacZ-
fusions. These cultures were grown at 37˚C for 2.25 h (OD600 = 0.75-1.0). Culture was
added directly to Z-buffer in 1.5 ml microcentrifuge tubes. SDS (0.00184%) and
chloroform (3.5% v/v) were added, and samples were vortexed for 30 seconds. The
samples were incubated at 28˚C for 15 min before the addition of ortho-nitrophenyl-β-
galactoside (ONPG, 0.875 mg/ml). Incubation at 28˚C continued until a visible color
change occurred, at which time sodium carbonate (353 mM) was added to quench the
reaction. All reactions were quenched by 75 min, even if no color change was observed.
Samples were centrifuged at maximum speed in a table-top microcentrifuge (~21000 x g)
for 2 min. 1 ml of supernatant was used to measure the absorbance at 550 nm and 420
nm. Miller Units were calculated using the established formula (Miller, 1992).
4.15 Tables

154
Table 4.1: New small proteins detected
See in : https://mbio.asm.org/content/10/2/e02819-18/figures-only (Table 1)
For each gene, we list the genomic coordinates (left and right in E. coli MG1655
genome NC_000913.3), sense strand (+, plus; −, minus), minute position on the genome,
systematic gene name, start peak intensity in retapamulin (Reta)- or Onc112-treated
samples (in rpm), start and stop codons, peptide sequence and length, level of normal
ribosome profiling density in untreated controls matched with the retapamulin (R)- and
Onc112 (O)-treated samples (in rpkm), candidate ORF number, and the names and
orientation of neighboring genes (parentheses indicate overlap with the adjacent gene).
The levels of normal ribosome profiling in untreated controls cannot be determined if the
smORF overlaps an annotated gene; in these cases, the name of the overlapping gene is
given instead of an rpkm value. MgtT was discovered by visual inspection of a genome
browser.
Table 4.S1 Ribosome profiling data for 80 previously identified small proteins (16,
17, 68–86), excluding type I toxin-antitoxin small proteins.
See in : https://mbio.asm.org/content/10/2/e02819-18/figures-only (Table S1)
The sheet lists the gene name, EcoCyc numbers where available, the genomic coordinates
(left and right), the sense strand, the direction and names of neighboring genes, the start
peak intensity in retapamulin- or Onc112-treated samples (in rpm), level of normal
ribosome profiling density in untreated controls matched with the retapamulin (R)- and
Onc112 (O)-treated samples (in rpkm), the length in amino acids, start codon, peptide
sequence, and reference for the initial report of the small protein. The levels of normal

155
ribosome profiling in untreated controls cannot be determined if the smORF overlaps an
annotated gene; in these cases, the name of the overlapping gene is given instead of an
rpkm value. Note that two genes are reannotated here with different start sites than the
original annotation; these genes are labeled in blue. Download Table S1, XLSX file, 0.02
MB.
Table 4.S2: All predicted 160,995 candidate smORFs and their ribosome density
values.
See in : https://mbio.asm.org/content/10/2/e02819-18/figures-only (Table S2)
These smORFs are eight residues or longer and start at AUG, GUG, or UUG codons that
are 18 nt or farther from annotated coding genes. The sheet shows the genomic
coordinates (left and right), the start peak intensity in retapamulin- or Onc112-treated
samples (in rpm), the first and last codons, the peptide sequence, the sense strand, and
level of normal ribosome profiling density in untreated controls matched with the
retapamulin (R)- and Onc112 (O)-treated samples (in rpkm). The levels of normal
ribosome profiling in untreated controls cannot be determined if the smORF overlaps an
annotated gene; in these cases, the name of the overlapping gene is given instead of an
rpkm value.
Table 4.S3: 171 top hits
See in : https://mbio.asm.org/content/10/2/e02819-18/figures-only (Table S3)
Top 171 hits with >5 rpm at start codon peaks and either >8 rpkm in normal ribosome
density in untreated samples or a neighboring ORF so close that it prevents this value

156
from being reliably determined. Two spreadsheets are shown, one with 68 selected
candidates and the other with 103 rejected candidates. The sheets give the genomic
coordinates (left and right), the start peak intensity in retapamulin- or Onc112-treated
samples (in rpm), the first and last codons, the peptide sequence and length, the sense
strand, and the level of normal ribosome profiling density in untreated controls matched
with the retapamulin (R)- and Onc112 (O)-treated samples (in rpkm). The levels of
normal ribosome profiling in untreated controls cannot be determined if the smORF
overlaps an annotated gene; in these cases, the name of the overlapping gene is given
instead of an rpkm value. Candidate ORF number and the names and orientation of
neighboring genes (parentheses indicate overlap with the adjacent gene) are also given.
The final column (Notes) gives our subjective impression of the ribosome density at the
start codon in antibiotic-treated samples upon inspection of each candidate in a genome
browser. For selected smORFs, the number of the candidate ORF together with the
names and directions of neighboring genes are also given, as well as references to
previous studies that also identified the same potential smORFs in E. coli or Salmonella
enterica Rows are shown in green if the smORFs were confirmed by detection of fusion
proteins, or yellow if the fusion protein was not detected.
Table 4.S4: Strains and primers used in this study.
See in : https://mbio.asm.org/content/10/2/e02819-18/figures-only (Table S4)
157
4.16 References
Anderson DM, Anderson KM, Chang CL, Makarewich CA, Nelson BR, McAnally JR,
Kasaragod P, Shelton JM, Liou J, Bassel-Duby R, Olson EN. 2015. A micropeptide
encoded by a putative long noncoding RNA regulates muscle performance. Cell 160:595-
606.
Andrews SJ, Rothnagel JA. 2014. Emerging evidence for functional peptides encoded by
short open reading frames. Nat Rev Genet 15:193-204.
Aspden JL, Eyre-Walker YC, Phillips RJ, Amin U, Mumtaz MA, Brocard M, Couso JP.
2014. Extensive translation of small Open Reading Frames revealed by Poly-Ribo-Seq.
eLife 3:e03528.
Baek J, Lee J, Yoon K, Lee H. 2017. Identification of unannotated small genes in
Salmonella. G3 7:983-989.
Bal NC, Maurya SK, Sopariwala DH, Sahoo SK, Gupta SC, Shaikh SA, Pant M,
Rowland LA, Bombardier E, Goonasekera SA, Tupling AR, Molkentin JD, Periasamy M.
2012. Sarcolipin is a newly identified regulator of muscle-based thermogenesis in
mammals. Nat Med 18:1575-1579.
Bartoli J, My L, Belmudes L, Couté Y, Viala JP, Bouveret E. 2017. The long hunt for
pssR-looking for a phospholipid synthesis transcriptional regulator, finding the ribosome.
J Bacteriol 199:e00202-17.
Bazzini AA, Johnstone TG, Christiano R, Mackowiak SD, Obermayer B, Fleming ES,
Vejnar CE, Lee MT, Rajewsky N, Walther TC, Giraldez AJ. 2014. Identification of small
ORFs in vertebrates using ribosome footprinting and evolutionary conservation. EMBO J
33:981-993.
Burge CB, Karlin S. 1998. Finding the genes in genomic DNA. Curr Opin Struct Biol
8:346-354.
Burgess R, Deutscher M (ed). 2009. Guide to Protein Purification. Academic Press, San
Diego, CA.
Congdon RW, Muth GW, Splittgerber AG. 1993. The binding interaction of Coomassie
blue with proteins. Anal Biochem 213:407-413.
Consortium. U. 2015. UniProt: a hub for protein information. Nucleic Acids Res
43:D204-212.
Dornhelm P, Högenauer G. 1978. The effects of tiamulin, a semisynthetic pleuromutilin
derivative, on bacterial polypeptide chain initiation. Eur J Biochem 91:465-473.
158
Friedman RC, Kalkhof S, Doppelt-Azeroual O, Mueller SA, Chovancová M, von Bergen
M, Schwikowski B. 2017. Common and phylogenetically widespread coding for peptides
by bacterial small RNAs. BMC Genomics 18:553.
Gagnon MG, Roy RN, Lomakin IB, Florin T, Mankin AS, Steitz TA. 2016. Structures of
proline-rich peptides bound to the ribosome reveal a common mechanism of protein
synthesis inhibition. Nucleic Acids Res 44:2439-2450.
Gao X, Wan J, Liu B, Ma M, Shen B, Qian SB. 2015. Quantitative profiling of initiating
ribosomes in vivo. Nat Methods 12:147-153.
Georg J, Hess WR. 2018. Widespread antisense transcription in prokaryotes. Microbiol
Spectr 6:RWR-0029-2018.
Goethe O, Heuer A, Ma X, Wang Z, Herzon SB. 2018. Antibacterial properties and
clinical potential of pleuromutilins. Nat Prod Rep In Press.
Goffeau A, Barrell BG, Bussey H, Davis RW, Dujon B, Feldmann H, Galibert F,
Hoheisel JD, Jacq C, Johnston M, Louis EJ, Mewes HW, Murakami Y, Philippsen P,
Tettelin H, Oliver SG. 1996. Life with 6000 genes. Science 274:546-567.
10.
Gollnick P, Babitzke P. 2002. Transcription attenuation. Biochim Biophys Acta
1577:240-250.
Guttman M, Russell P, Ingolia NT, Weissman JS, Lander ES. 2013. Ribosome profiling
provides evidence that large noncoding RNAs do not encode proteins. Cell 154:240-251.
Hellens RP, Brown CM, Chisnall MA, Waterhouse PM, Macknight RC. 2016. The
emerging world of small ORFs. Trends Plant Sci 21:317-328.
Hemm MR, Paul BJ, Schneider TD, Storz G, Rudd KE. 2008. Small membrane proteins
found by comparative genomics and ribosome binding site models. Mol Microbiol
70:1487-501.
Hemm MR, Paul BJ, Miranda-Rios J, Zhang A, Soltanzad N, Storz G. 2010. Small stress
response proteins in Escherichia coli: proteins missed by classical proteomic studies. J
Bacteriol 192:46-58.
Hobbs EC, Yin X, Paul BJ, Astarita JL, Storz G. 2012. Conserved small protein
associates with the multidrug efflux pump AcrB and differentially affects antibiotic
resistance. Proc Natl Acad Sci USA 109:16696-16701.
Hücker SM, Ardern Z, Goldberg T, Schafferhans A, Bernhofer M, Vestergaard G, Nelson
CW, Schloter M, Rost B, Scherer S, Neuhaus K. 2017. Discovery of numerous novel

159
small genes in the intergenic regions of the Escherichia coli O157:H7 Sakai genome.
PLoS One 12:e0184119.
Ikeda M, Arai M, Okuno T, Shimizu T. 2003. TMPDB: a database of experimentally-
characterized transmembrane topologies. Nucleic Acids Res 31:406-409.
Ingolia NT, Lareau LF, Weissman JS. 2011. Ribosome profiling of mouse embryonic
stem cells reveals the complexity and dynamics of mammalian proteomes. Cell 47:789-
802.
Kall L, Krogh A, Sonnhammer EL. 2004. A combined transmembrane topology and
signal peptide prediction method. J Mol Biol 338:1027-36.
Kessler MM, Zeng Q, Hogan S, Cook R, Morales AJ, Cottarel G. 2003. Systematic
discovery of new genes in the Saccharomyces cerevisiae genome. Genome Res 13:264-
271.
Krishna SS, Majumdar I, Grishin NV. 2003. Structural classification of zinc fingers:
survey and summary. Nucleic Acids Res 31:532-550.
Ladoukakis E, Pereira V, Magny EG, Eyre-Walker A, Couso JP. 2011. Hundreds of
putatively functional small open reading frames in Drosophila. Genome Biol 12:R118.
Landry CR, Zhong X, Nielly-Thibault L, Roucou X. 2015. Found in translation:
functions and evolution of a recently discovered alternative proteome. Curr Opin
Microbiol 32:74-80.
Lee S, Liu B, Lee S, Huang SX, Shen B, Qian SB. 2012. Global mapping of translation
initiation sites in mammalian cells at single-nucleotide resolution. Proc Natl Acad Sci
USA 109:E2424-E2432.
Lobley A, Sadowski MI, Jones DT. 2009. pGenTHREADER and pDomTHREADER:
new methods for improved protein fold recognition and superfamily discrimination.
Bioinformatics 25:1761-1767.
Mandin P, Gottesman S. 2009. A genetic approach for finding small RNAs regulators of
genes of interest identifies RybC as regulating the DpiA/DpiB two-component system.
Mol Microbiol 72:551-565.
Mattiuzzo M, Bandiera A, Gennaro R, Benincasa M, Pacor S, Antcheva N, Scocchi M.
2007. Role of the Escherichia coli SbmA in the antimicrobial activity of proline-rich
peptides. Mol Microbiol 66:151-163.
Meydan S, Marks J, Klepacki D, Sharma V, Baranov P, Firth A, Margus T, Kefi A,
Vázquez-Laslop N, Mankin AS. 2018. Retapamulin-assisted Ribo-seq revels the
alternative bacterial proteome. Mol Cell under review.

160
Miller JH. 1992. A Short Course in Bacterial Genetics: A Laboratory Manual and
Handbook for Escherichia coli and Related Bacteria. Cold Spring Harbor Laboratory
Press, Plainview, NY.
Mouilleron H, Delcourt V, Roucou X. 2016. Death of a dogma: eukaryotic mRNAs can
code for more than one protein. Nucleic Acids Res 44:14-23.
Nakahigashi K, Takai Y, Kimura M, Abe N, Nakayashiki T, Shiwa Y, Yoshikawa H,
Wanner BL, Ishihama Y, Mori H. 2016. Comprehensive identification of translation start
sites by tetracycline-inhibited ribosome profiling. DNA Res 23:193-201.
Neuhaus K, Landstorfer R, Simon S, Schober S, Wright PR, Smith C, Backofen R,
Wecko R, Keim DA, Scherer S. 2017. Differentiation of ncRNAs from small mRNAs in
Escherichia coli O157:H7 EDL933 (EHEC) by combined RNAseq and RIBOseq - ryhB
encodes the regulatory RNA RyhB and a peptide, RyhP. BMC Genomics 18:216.
Novak R. 2011. Are pleuromutilin antibiotics finally fit for human use? Ann N Y Acad
Sci 1241:71-81.
Park H, McGibbon LC, Potts AH, Yakhnin H, Romeo T, Babitzke P. 2017. Translational
repression of the RpoS antiadapter IraD by CsrA is mediated via translational coupling to
a short upstream open reading frame. mBio 8:e01355-17.
48.
Pueyo JI, Magny EG, Couso JP. 2016. New peptides under the s(ORF)ace of the genome.
Trends Biochem Sci 41:665-678.
Ross TK, Achberger EC, Braymer HD. 1989. Nucleotide sequence of the McrB region of
Escherichia coli K-12 and evidence for two independent translational initiation sites at
the mcrB locus. J Bacteriol 171:1974-1981.
Roy RN, Lomakin IB, Gagnon MG, Steitz TA. 2015. The mechanism of inhibition of
protein synthesis by the proline-rich peptide oncocin. Nat Struct Mol Biol 22:466-469.
Sacerdot C, Dessen P, Hershey JW, Plumbridge JA, Grunberg-Manago M. 1984.
Sequence of the initiation factor IF2 gene: unusual protein features and homologies with
elongation factors. Proc Natl Acad Sci USA 81:7787-7791.
Saghatelian A, Couso JP. 2015. Discovery and characterization of smORF-encoded
bioactive polypeptides. Nat Chem Biol 11:909-916.
Scopes RK. 1994. Protein Purification Principles and Practice, 3 ed. Springer-Verlag,
New York, NY.
161
Seefeldt AC, Nguyen F, Antunes S, Pérébaskine N, Graf M, Arenz S, Inampudi KK,
Douat C, Guichard G, Wilson DN, Innis CA. 2015. The proline-rich antimicrobial
peptide Onc112 inhibits translation by blocking and destabilizing the initiation complex.
Nat Struct Mol Biol 22:470-475.
Sesto N, Wurtzel O, Archambaud C, Sorek R, Cossart P. 2013. The excludon: a new
concept in bacterial antisense RNA-mediated gene regulation. Nat Rev Microbiol 11:75-
82.
Slavoff SA, Mitchell AJ, Schwaid AG, Cabili MN, Ma J, Levin JZ, Karger AD, Budnik
BA, Rinn JL, Saghatelian A. 2013. Peptidomic discovery of short open reading frame-
encoded peptides in human cells. Nat Chem Biol 9:59-64.
Squires CL, Pedersen S, Ross BM, Squires C. 1991. ClpB is the Escherichia coli heat
shock protein F84.1. J Bacteriol 173:4254-4262.
Storz G, Wolf YI, Ramamurthi KS. 2014. Small proteins can no longer be ignored. Annu
Rev Biochem 83:753-777.
Thomason MK, Bischler T, Eisenbart SK, Förstner KU, Zhang A, Herbig A, Nieselt K,
Sharma CM, Storz G. 2015. Global transcriptional start site mapping using differential
RNA sequencing reveals novel antisense RNAs in Escherichia coli. J Bacteriol 197:18-
28.
Toba FA, Thompson MG, Campbell BR, Junker LM, Rueggeberg KG, Hay AG. 2011.
Role of DLP12 lysis genes in Escherichia coli biofilm formation. Microbiology
157:1640-1650.
Vanderperre B, Lucier JF, Bissonnette C, Motard J, Tremblay G, Vanderperre S,
Wisztorski M, Salzet M, Boisvert FM, Roucou X. 2013. Direct detection of alternative
open reading frames translation products in human significantly expands the proteome.
PLoS ONE 8:e70698.
VanOrsdel CE, Kelly JP, Burke BN, Lein CD, Oufiero CE, Sanchez JF, Wimmers LE,
Hearn DJ, Abuikhdair FJ, Barnhart KR, Duley ML, Ernst SEG, Kenerson BA, Serafin
AJ, Hemm MR. 2018. Identifying new small proteins in Escherichia coli. Proteomics
18:e1700064.
Wang H, Yin X, Wu Orr M, Dambach M, Curtis R, Storz G. 2017. Increasing
intracellular magnesium levels with the 31-amino acid MgtS protein. Proc Natl Acad Sci
USA 114:5689-5694.
Woolstenhulme CJ, Guydosh NR, Green R, Buskirk AR. 2015. High-precision analysis
of translational pausing by ribosome profiling in bacteria lacking EFP. Cell Rep 11:13-
21.

162
Yin X, Wu Orr M, Wang H, Hobbs EC, Shabalina SA, Storz G. 2018. The small protein
MgtS and small RNA MgrR modulate the PitA phosphate symporter to boost intracellular
magnesium levels. Mol Microbiol In press.
Yu D, Ellis HM, Lee EC, Jenkins NA, Copeland NG, Court DL. 2000. An efficient
recombination system for chromosome engineering in Escherichia coli. Proc Natl Acad
Sci USA 97:5978-5983.
Zhang N, Young R. 1999. Complementation and characterization of the nested Rz and
Rz1 reading frames in the genome of bacteriophage lambda. Mol Gen Genet 262:659-
667.
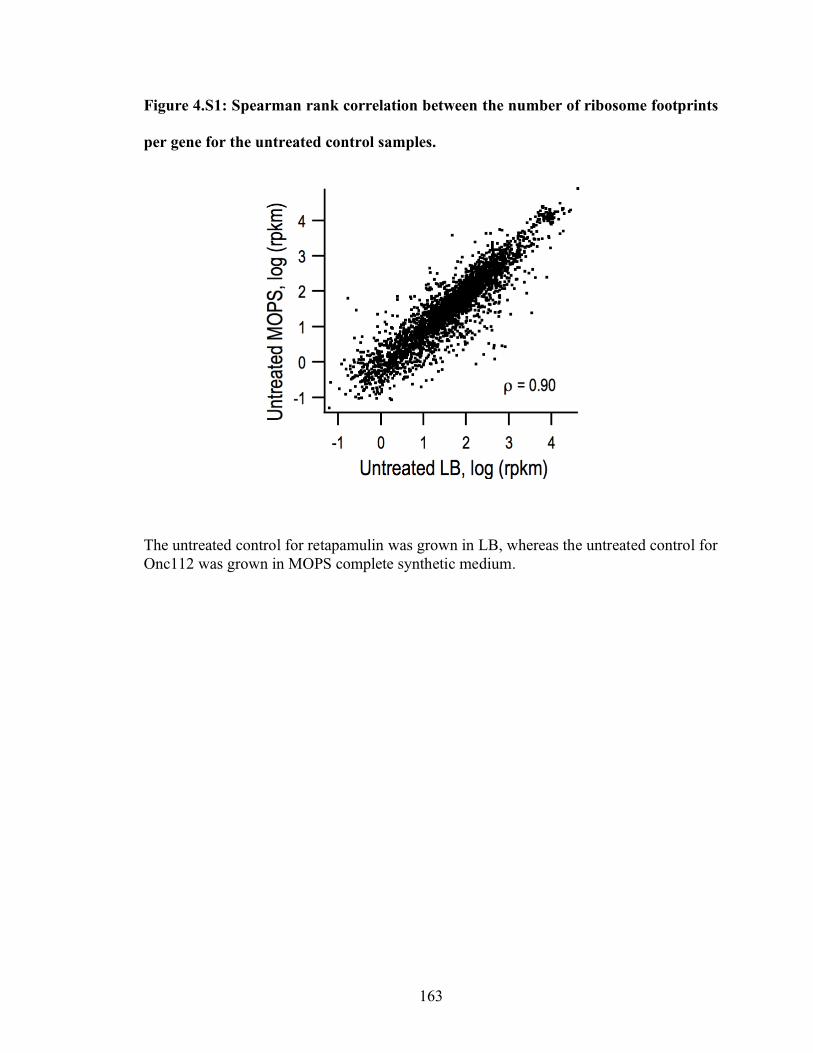
163
Figure 4.S1: Spearman rank correlation between the number of ribosome footprints
per gene for the untreated control samples.
The untreated control for retapamulin was grown in LB, whereas the untreated control for
Onc112 was grown in MOPS complete synthetic medium.

164
Figure 4.S2 Histogram of the predicted protein lengths for 68 candidate smORFs
listed in Table S3.
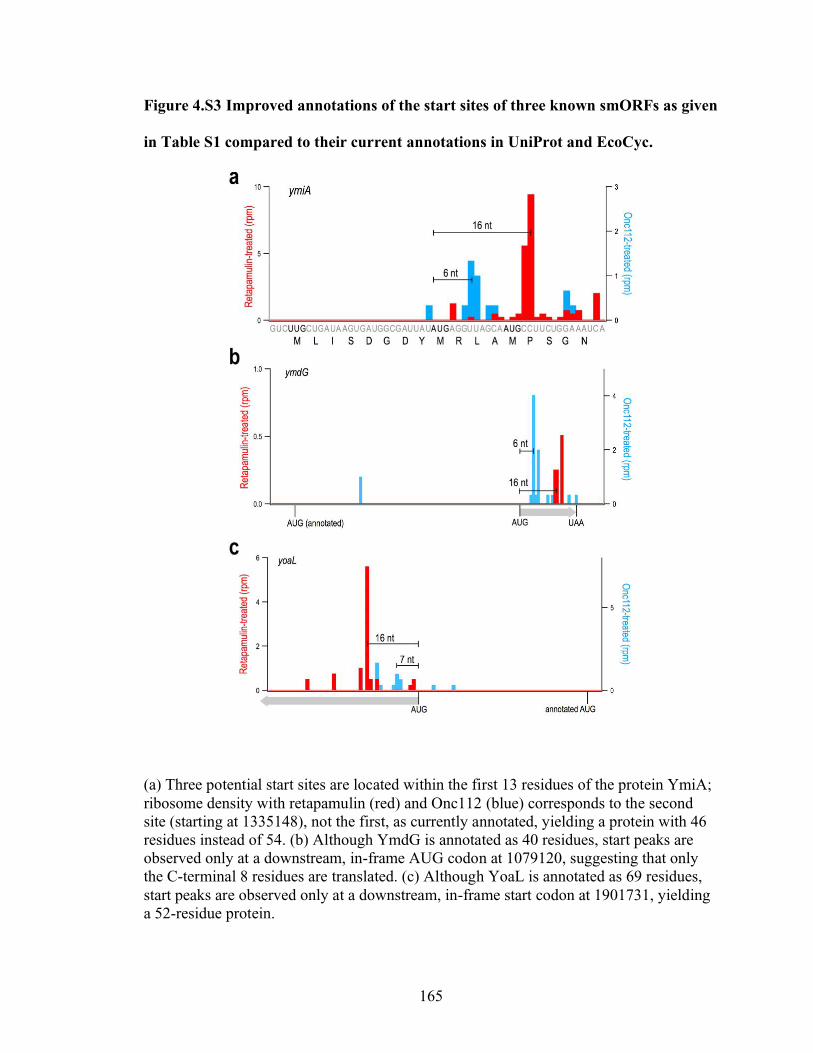
165
Figure 4.S3 Improved annotations of the start sites of three known smORFs as given
in Table S1 compared to their current annotations in UniProt and EcoCyc.
(a) Three potential start sites are located within the first 13 residues of the protein YmiA;
ribosome density with retapamulin (red) and Onc112 (blue) corresponds to the second
site (starting at 1335148), not the first, as currently annotated, yielding a protein with 46
residues instead of 54. (b) Although YmdG is annotated as 40 residues, start peaks are
observed only at a downstream, in-frame AUG codon at 1079120, suggesting that only
the C-terminal 8 residues are translated. (c) Although YoaL is annotated as 69 residues,
start peaks are observed only at a downstream, in-frame start codon at 1901731, yielding
a 52-residue protein.
166
CURRICULUM VITAE
FUAD MOHAMMAD
Profile PhD student with 9+ years of experience in life science research. Skilled in biochemistry,
bacterial genetics, and computational biology. Proficient in interpreting scientific literature,
generating testable ideas, and presenting findings clearly. Highly motivated with a desire to learn
new skills and develop professional relationships.
Education
PhD Johns Hopkins School of Medicine December 2019 Biochemistry, Cellular and Molecular Biology
BS The Ohio State University June 2012 Biochemistry, Cum laude with Honors Research Distinction
Relevant Skills
Research: Genomics, Molecular Biology, RNA biology, Cancer Biology Computation:
Python, R, Pandas, Jupyter Communication: Scientific Writing, Poster/Oral Presentations
Data: Mining, Statistical Analysis, Visualization
Relevant Experience
Johns Hopkins School of Medicine, Baltimore, MD
August 2014 - current
Graduate Research Assistant – 5 yrs, 60 hrs/week Advisor: Dr. Rachel Green, Dr. Allen Buskirk, (410)-614-4928
Committee: Jeremy Nathans (chair), Geraldine Seydoux, Seth Margolis
• Designed and conducted research to study protein synthesis and the ribosome in bacteria
o Adapted primary data from scientific literature to design projects
o Skilled in biochemistry and molecular biology techniques
▪ Developed biochemical assays to detect translational activity
▪ Skilled in RNA, DNA, and protein extraction and downstream analysis
o Created bacterial cell lines and plasmid-based reporters to study ribosome
activity
o Established new methods study protein synthesis at the genomic level
▪ Implemented new methods to trap ribosomes in vivo to study ribosomes
translating mRNAs and identify translational pausing
• Created a detailed computational pipeline to analyze next generation sequencing datasets.
o Streamlined analysis to allow for easier implementation and reproducibility
▪ Created custom Python based bioinformatics tools to analyze large
genomic datasets
• Genome wide analysis of ribosome position on genes, translation
efficiency calculations, ribosome pausing and codon occupancy
analysis
▪ Used statistical tools from SciPy and R
▪ Implemented Jupyter notebook and matplotlib/bokeh data visualization
tools

167
▪ Streamlined older pipelines by applying multiprocessing capabilities,
reducing memory usage and modifying data structures to reduce
computational time and increase productivity
o Analyzed Ribo-seq and RNA-seq data using custom pipeline, including data
mined from online databases
• Collaborated with other labs to train individuals, implement computational programs and
generate data leading to publication
• Communicated my projects to the scientific community at local and international
conferences
• Published two first author papers, and one second author paper
• Worked with Seth Margolis for one year to study the ribosome in the nervous system
o Skilled in isolating primary cortical neurons and radiolabeling proteins to analyze
translation activity
Nationwide Children’s Hospital, Columbus, OH
2012 to 2014
Research Assistant – 2 yrs, 50 hrs/week Advisor: Dr. Dawn Chandler, (614)-722-5598
• Initiated a collaborative project to study mRNA splicing of BRD2 mRNA and its role in
juvenile myoclonic epilepsy
o Constructed mini-gene reporters to study alternative splicing of BRD2 exon 2a
o Characterized epileptic phenotype in mouse models.
• Implemented RNA therapeutic approaches to modulate mRNA splicing in the context of
cancer in mice and in mammalian tissue culture
o Studied the p53 pathway and the contribution of MDM2 alternative splicing
during stress and its contribution to tumorigenesis.
• Published research in peer-reviewed journals
The Ohio State University, Columbus, OH
2009 to 2012
Undergraduate Research Assistant – 3 yrs, 20 hrs/week Advisor: Dr. Jane Jackman, (614)-247-8097
• Biochemically and genetically characterized the function of tRNA modifying enzymes
o Biochemically characterized Thg1-like proteins for 3’-5’ RNA polymerase
activity.
o Identified biological role of Thg1-like proteins in A. castellani to repair tRNA 5’
ends.
• Published data in peer-reviewed journals and wrote an undergraduate thesis dissertation
Publications
Weaver J, Mohammad F, Buskirk AR, Storz G, (2019) "Identifying Small Proteins by
Ribosome Profiling with Stalled Initiation Complexes." MBio, 10(2). pii: e02819-18.
Mohammad F, Green R, Buskirk AR, (2019) "A systematically-revised ribosome
profiling method for bacteria reveals pauses at single codon resolution." Elife. pii:
e42591.
Mohammad F*, Woolstenhulme CJ*, Green R, and Buskirk AR, (2015) "Clarifying the
Translational Pausing Landscape in Bacteria by Ribosome Profiling." Cell Rep. pii:
168
S2211-1247(15)01529-6. *(co-first author)
Jacob AG, Singh RK, Comiskey DF Jr, Rouhier MF, Mohammad F, Bebee TW,
Chandler DS, (2014) “Stress-induced alternative splice forms of MDM2 and MDMX
modulate the p53-pathway in distinct ways.” PLoS One. 9(8) pii: e104444..
Jacob AG, Singh RK, Mohammad F, Bebee TW, Chandler DS, (2014) “The Splicing
Factor FUBP1 Is Required for the Efficient Splicing of Oncogene MDM2 Pre-mRNA”. J
Biol Chem. 289(25), 17350-64
Jacob AG, O'Brien D, Singh RK, Comiskey DF, Littleton RM, Mohammad F, . . .
Chandler DS, (2013) “Stress-induced isoforms of MDM2 and MDM4 correlate with
high-grade disease and an altered splicing network in pediatric rhabdomyosarcoma”.
Neoplasia, 15(9), 1049-1063.
Rao BS*, Mohammad F*, Gray MW, & Jackman JE, (2013) “Absence of a universal
element for tRNAHis identity in Acanthamoeba castellanii.” Nucleic Acids Research,
41(3), 1885-1894. *(co-first author)
Websites
LinkedIn: https://www.linkedin.com/in/fuad-mohammad
ResearchGate: https://www.researchgate.net/profile/Fuad_Mohammad