A study into the hazard of pyroclastic flows and surges emanating from the Soufriere Hills Volcano,...
39
1 A study into the hazard of pyroclastic flows and surges emanating from the Soufriere Hills Volcano, their cause, their effects, and monitoring in place to provide mitigation to the population. John Standing
-
Upload
john-standing -
Category
Documents
-
view
96 -
download
1
Transcript of A study into the hazard of pyroclastic flows and surges emanating from the Soufriere Hills Volcano,...
1
A study into the hazard of pyroclastic flows and
surges emanating from the Soufriere Hills Volcano, their cause, their effects, and monitoring in place
to provide mitigation to the population.
John Standing

2
Abstract
Soufrière Hills Volcano (SHV) is located on the Eastern Caribbean island of Montserrat. In 1995 the volcano erupted after almost 300 years of inactivity. The erupted andesitic magma formed lava domes; to date over 1 km3 of magma has been erupted. Such lava domes become gravitationally unstable as they grow in height and collapse.
Pyroclastic flows consist of a high-density mixture of hot gases and dry hot rocks, the low particle ash cloud that accompanies the flow can detach to form pyroclastic surges.
In May 1997 dome growth switched to the NE of the dome with rockfalls threatening the NW of Montserrat for the first time. On 25 June 1997, after nine inflation-deflation cycles a major, partial collapse of the dome occurred in three pulses in 25 minutes transporting a combined total of 6.4 x 10⁶ m3 of debris down the volcano’s northern flanks. The speed, temperature and runout increased with each successive flow, and the deposits filled the valleys generating overspill and pyroclastic surge detachment at bends in the drainage channels. This enabled debris from the volcano to reach areas of the island that had not been evacuated. The flows caused destruction of property and infrastructure plus 19 fatalities.
The number of fatalities was reduced due to the hazard mitigation and risk assessments made by officials on Montserrat based on the observations of SHV recorded by the Montserrat Volcano Observatory. The volcano is monitored in a number of ways including seismic measurements, gas emission, and visual observations.
Due to inactivity at SHV, the current risk level is low, however a large dome remains in place. Should lava extrusion commence there is a concern that it could destabilize the dome generating a major dome collapse that has the capacity to reach the populated areas of NW Montserrat.

3
List of Abbreviations
A.S.L. – Above Sea Level
BP – Before Present
DFID – Department For International Development
DMCA – Disaster Management Coordinating Agency
DRE – Dense Rock Equivalent
EDM – Electronic Distance Measurements
FTIR – Fourier Transform Infrared Spectometer
GPS – Global Positioning System
HCl – Hydrogen Chloride
KA – Thousand Years
MA – Million Years
MVO – Montserrat Volcano Observatory
NDPRAC – National Disaster Preparedness and Response Advisory Committee
PF – Pyroclastic Flow
SAC – Scientific Advisory Committee
SHV – Soufrière Hills Volcano
SO2 – Sulphur Dioxide
UV – Ultraviolet

4
Table of Contents Page
Abstract ................................................................................................................... 2 List of Abbreviations .............................................................................................. 3 List of tables and figures ...................................................................................... 5 Chapter 1 – Introduction ........................................................................................ 7 Chapter 2 – Eruption history .............................................................................. 10 2.1 - Eruption history up to 1995
2.2 - Eruption history 1995 to present
Chapter 3 – The Pyroclastic threat ..................................................................... 11 3.1 – Definition of Pyroclastic flows and surges
3.2 – Types of Pyroclastic flow
3.3 – Causes of Pyroclastic Flow
Chapter 4 – Case Study – Pyroclastic flows and surges generated on 25th June 1997 .............................................................................................................. 13 4.1 - About the event 4.2 - Precursory activity
5.3 - What was the cause of the 25 June 1997 event?
5.4 - Effects of the flows and surges
Chapter 5 – Monitoring and hazard mitigation of Soufrière Hills Volcano ..... 20 5.1 - Importance of Monitoring
5.2 - Types of Monitoring
5.3 - Hazard Mitigation
Chapter 6 – Conclusion: Recent and future activity ........................................ 34 6.1 - Current activity and alert level
6.2 - Future Worst Case Scenarios
References ............................................................................................................ 37

5
List of figures and tables Cover image – Incandescent Pyroclastic flow on Soufrière Hills Volcano. (www.bayourenaissanceman.co.uk,) .............................................................................................. 1
Table 1 – Characteristics of the episodes of extrusions and pauses. ....................................... 10
Figure 1 – Tectonic and geographical setting of Montserrat ........................................................ 7
Figure 2 – Eastern Caribbean Subduction and Volcanic-Arc Mechanism .................................. 7
Figure 3 – Map of Montserrat showing topography and main geographical locations. ......................................................................................................................................... 8
Figure 4 – Map of Soufrière Hills main drainage ............................................................................ 9
Figure 5 – Diagram of a pyroclastic flow ..................................................................................... 11
Figure 6 – Pyroclastic flow and surge cloud, SHV April 1996. ................................................... 12
Figure 7 – Schematic diagram illustrating the switch in dome growth activity in mid-May
1997. ................................................................................................................................................. 14
Figure 8 – Comparison of a) Real-Time seismic amplitude measurement (RSAM) with b)
cyclic tilt records and c) total number of triggered earth quakes for
period 18-22 May 1997). ................................................................................................................. 15
Figure 9 – Seismogram from seismometer at Windy Hill site ................................................... 16
Figure 10 – Configuration of the lava dome a) before and b) after 25 June 1997 partial dome
collapse. ......................................................................................................................................... 16 Figure 11 – Map showing the extent of the 25 June 1997 pyroclastic flow deposits ............... 17
Figure 12 – Aerial photograph showing several lobes of the block and ash flow
advancing through Spanish Point ................................................................................................ 18
Figure 13 – House damaged and partially buried by block and ash deposits .......................... 18
Figure 14 – Schematic cross section through a valley partly filled by a pyroclastic flow to
illustrate the changing topography and surface roughness ..................................................... 19
Figure 15 – Airbourne view of SHV’s gas and aerosol plume drifting over Plymouth February
1999 .................................................................................................................................................. 21 Figure 16 - TSX-derived topography ............................................................................................. 22
Figure 17 - Topographic map of the island of Montserrat and Soufrière Hills Volcano with the
locations of seismic stations. ........................................................................................................ 23
Figure 18 - Common types of volcanic events as classified at the MVO .................................. 24
Figure 19 – G. Ryan and R. Syers from the MVO carrying out EDM survey of SHV ................. 24
Figure 20 – a) Installing a tiltmeter on Montserrat in 1995, b) diagram of the inner working of a tiltmeter ......................................................................................................................................... 25
Figure 21 – Positions and orbital planes of GPS Satellites ....................................................... 26
Figure 22 - a) Diagram of the working of a tipping bucket gauge, b) Map of Montserrat
showing the location of the tipping bucket and DFID gauges ................................................... 27 Figure 23 – Safe and Unsafe areas, demarcated by an imaginary line ..................................... 28
Figure 24(a) Page 1 of the Hazard Level System poster issued November 2011 ..................... 29
Figure 24(b) Page 2 of the Hazard Level System poster issued November 2011 ..................... 30
Figure 25 - Hazard Level System poster, showing different hazard levels, issued November
2011 .................................................................................................................................................. 31

6
Figure 26 – Cross section through English’s Crater illustrating the dimensions and geometry
of a dome with the potential to send PF’s to the north of SHV ................................................. 32
Figure 27 – Photographic record of 8th January 2007 events at SHV ........................................ 33
Figure 28 – Deposits map produced during 3 December 2008 to 3 January 2009 eruptive phase. ............................................................................................................................................... 33
Figure 29 – Current Hazard Level ................................................................................................. 34
Figure 30 – simulated inundations of block and ash PF’s of selected volume for the Belham
River Drainage ................................................................................................................................. 35
Figure 31 – Limits of a 20 million m3 pyroclastic flow simulations on the northern side of
Belham Valley ................................................................................................................................. 36
7
Chapter 1 – Introduction In this report the geo-hazard of pyroclastic flows (PF) from the Soufrière Hills Volcano (SHV), on the
island of Montserrat, is discussed.
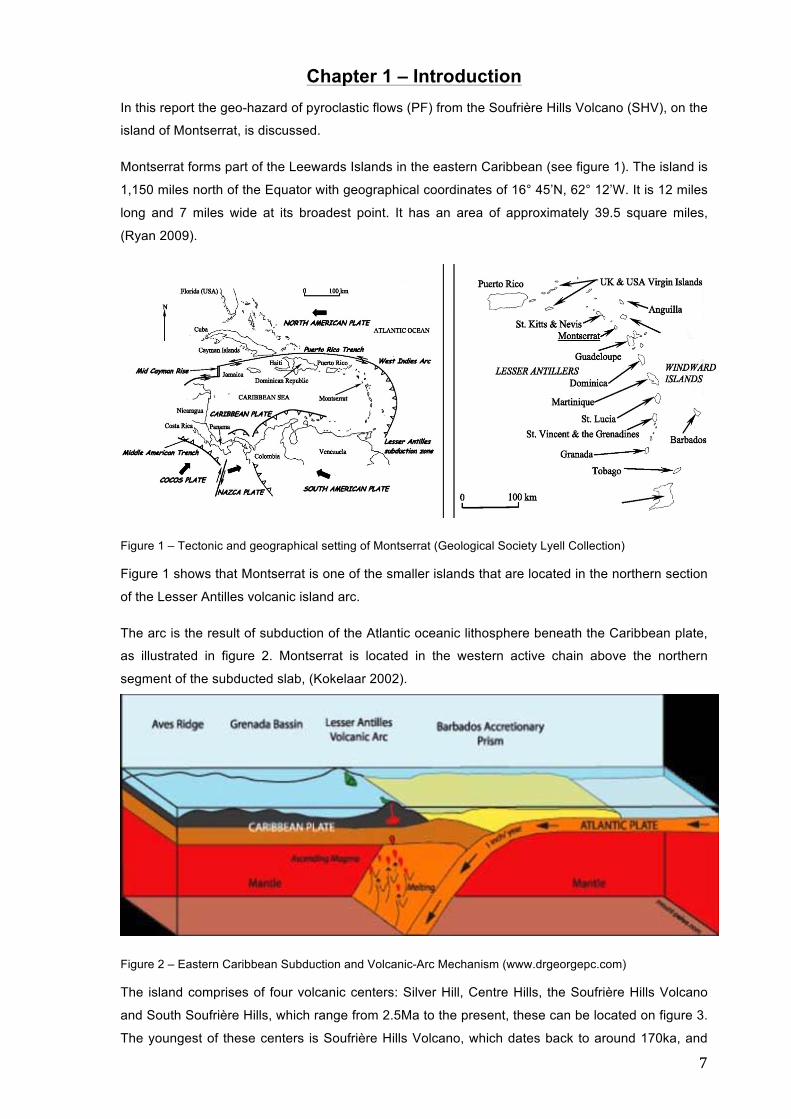
Montserrat forms part of the Leewards Islands in the eastern Caribbean (see figure 1). The island is
1,150 miles north of the Equator with geographical coordinates of 16° 45’N, 62° 12’W. It is 12 miles
long and 7 miles wide at its broadest point. It has an area of approximately 39.5 square miles,
(Ryan 2009).
Figure 1 – Tectonic and geographical setting of Montserrat (Geological Society Lyell Collection)
Figure 1 shows that Montserrat is one of the smaller islands that are located in the northern section
of the Lesser Antilles volcanic island arc.
The arc is the result of subduction of the Atlantic oceanic lithosphere beneath the Caribbean plate,
as illustrated in figure 2. Montserrat is located in the western active chain above the northern
segment of the subducted slab, (Kokelaar 2002).
Figure 2 – Eastern Caribbean Subduction and Volcanic-Arc Mechanism (www.drgeorgepc.com)
The island comprises of four volcanic centers: Silver Hill, Centre Hills, the Soufrière Hills Volcano
and South Soufrière Hills, which range from 2.5Ma to the present, these can be located on figure 3.
The youngest of these centers is Soufrière Hills Volcano, which dates back to around 170ka, and

8
consists of five andesitic lava domes: Gages Mountain, Chances Peak, Galway’s Mountain,
Perches Mountain and Castle Peak, the latter is the youngest and occupies the horseshoe-shaped
English’s Crater, which is 1km in diameter, has 100-150 m high walls and, (as can be seen on
figure 3), is open to the east (Sparks & Young, 2002).
After the start of the current eruption in 1995 the majority of the island’s remaining population and
administration centers moved north of Centre Hills as it was thought that this would provide
protection from PFs and all but the largest volcanic eruptions (Kokelaar, 2002).
Figure 3 – Map of Montserrat showing topography and main geographical locations (Sparks and Young, 2002)
SHV, like all the other volcanic massifs on the island has many valleys and ridges radiating towards
the coastline. These have been created through erosion, and function as the volcano’s drainage
channels, see figure 4, (Kokelaar, 2002).

9
Figure 4 – Map of Soufrière Hills main drainage (www.mvo.ms)
It is via these drainage channels that PFs are funneled; this causes them to be altered via erosion
and deposition leading to future flows being less predictable (Calder et al., 2002).
By examining the causes of previous large-scale pyroclastic events, which destroyed almost two
thirds of the island including the seaport, airport, and capital Plymouth, and led to the displacement
of around 62 percent of the population, this report discusses how a pyroclastic flow or surge, could
be generated which would be large enough to pose a threat to the remaining population in Northern
Montserrat, especially those located in the North West of the island near the Belham river valley.
This report also looks at what monitoring techniques are in place to provide advance warning to
those living in the most vulnerable locations. Finally the report concludes by examining the worst-
case scenarios of future events related to the threat of PFs emanating from SHV.

10
Chapter 2 – Eruption history of Soufrière Hills Volcano 2.1 – Eruption History up to 1995
Radiocarbon data for the southern part of Montserrat show the last period of major activity was
between 16 – 24ka. However, activity at Castle Peak dome is more recent. Radiocarbon data for
these deposits give a date of 750-200 B.P. Although fumarolic volcanic activity has been detected
during the past 100 years, phreatic eruptive activity did not commence until July 1995 (Hooper and
Mattioli, 2001).
2.2 – Current Eruption 1995 – Present
Since 1995 SHV has erupted over 1 km3 of andesitic magma, which has formed andesitic domes,
as detailed in Table 1 below, this has been in five stages separated by various lengths of non-
extrusive periods, (Komorowski et al., 2010).
* DRE – Dense Rock Equivalent
(Table 1 –Wadge et al 2010)

11
Chapter 3 – The Pyroclastic Threat 3.1 – Definition of Pyroclastic flow and surge
A PF consists of a high-density mixture of hot gases and dry hot rocks that emanates from the
volcano, as illustrated in figure 5. It can be identified by a turbulent, and convecting cloud of fine ash
that rises above a coarser material of blocks and ash known as the basal flow. (De Angelis et al.,
2007). The front of the flow consists of an ash cloud that has a wedge shape, the nose of which
hugs the ground. This ash cloud is often disrupted by large blocks from the basal avalanche ejected
forwards (Cole el al., 1998).
Figure 5 – Diagram of a pyroclastic flow (www.arch.virginia.edu)
Whilst the basal units of the flow are controlled by the topography (Cole et al., 1998), the low
particle pyroclastic surge that overlies the basal units are influenced by high gas pressure of
fragmental material emanating from deep within the dome. It is the violence associated with
fragmentation and gas expansion that energises the surge allowing it to traverse the topography
(Loughlin et al.,2002) and decouple from the pyroclastic flow increasing the area affected
(Widiwijayanti et al., 2008). Figure 6 is a photograph showing the size and scale of a PF from the
northern side of SHV dated April 1996.

12
Figure 6 – Pyroclastic flow and surge cloud, SHV April 1996 (Kokelaar, 2002)
3.2 – Types of Pyroclastic flow
There are two general mechanisms for the generation of PFs from lava domes these are:
• Gravitational collapse, described as Merapi-type, which is the result of blocks falling from a
collapsing dome.
• Explosive collapse, described as Peléan-type, caused by an explosion from the side of the
dome.
It is the Merapi type that is the primary mechanism at SHV. (Hooper and Mattioli, 2001)
3.3 – Causes of Pyroclastic Flow
The mechanisms behind the gravitational instability that lead to dome collapse and PFs are poorly
understood (Calder et al., 2002). However a number of causes of dome collapse have been
identified. A list of those that have generated PFs on Montserrat is provided below.
• Inflation and deflation of the dome due to episodic intrusion of volatile rich magma (Loughlin
et al., 2002)
• Rockfalls (Cole et al., 1998)
• Earthquakes (Calder et al., 2002)
• Degassing (Calder et al., 2002)
• Structural failure of the old edifice (Sparks and Young, 2002)
• Heavy Rainfall (Matthews et al.,2002)
As it is beyond the scope of this project to discuss all the PFs generated at SHV due to the causes
listed above, (and the effects that resulted from them), the next chapter looks at one event that took
place on 25 June 1997.

13
Chapter 4 – Case Study – Pyroclastic flows and surges generated on 25 June 1997
This case study has been selected over others as it was the most deadly and one of the largest
dome collapses of the current eruption that have affected the area of northwest Montserrat. This
area remains populated.
4.1 - About the event The partial dome collapse on the 25 June 1997 saw a DRE volume of approximately 6.4 x 10⁶ m3 of
debris. This was one of the largest collapses of the current eruption; it flowed down the northern
flanks of SHV destroying villages, and caused 19 fatalities (Loughlin et al., 2002, Sparks and Young,
2002).
4.2 - Precursory activity Although PFs had already occurred to the east and south of SHV before May 1997, they now
threatened the northern side of SHV. This was due to a switch in dome growth from the SW to NE
side of the dome, due to the collapse of a 50m high vertical spine that had grown in the central area
of the dome and then collapsed within two days, causing lava extrusion to be directed to the north,
as illustrated in figure 7.
At this time the dome volume was 65 x 106 m3 DRE and was growing at a rate of up to 5 m3 s-1.
Lava emplacement was taking place through sub-horizontal shear lobes and not vertically as was
the case previously in the eruption. Rockfall activity continued steadily for a number of weeks
causing broadening of the dome flanks against the northern walls of English Crater. By June 1997
the talus was level with Farrell’s Wall on the northern rim and rockfalls began spilling over the NW
side of SHV for the first time, (Watts et al., 2002, Loughlin et al., 2002).
As the dome grew, swarms of hybrid earthquakes, (a mixture of volcano–tectonic earthquakes
caused by magma intrusion and long-period events which these are monochromatic signals related
to pressurization of the plumbing system), accompanied the growth generating rockfalls. As the
dome increased these rockfalls grew into small pyroclastic flows, which by the 24 June 1997 had
travelled over 4km down Mosquito Ghant and to the upper reaches of Ford Ghaut, see figure 4,
(Loughlin et al., 2002).

14
Figure 7 – Schematic diagram illustrating the switch in dome growth activity in mid-May 1997. Sketches on the
left represent a N-S cross section through the dome whilst sketches on the right represent plan vies of the
dome at the same time. (Watts et al.,2002)
During this period tiltmeters were displaying a stronger rhythmic pattern of repetitive inflation-
deflation cycles, caused by the episodic intrusion of volatile rich magma into the dome, with the
deflationary parts occurring more rapidly. As the dome inflated there was an increase in hybrid
earthquakes, becoming a continuous tremor as inflation peaked. All this activity resulted in the rapid
destabilization of the entire 17 May 1997 lobe. Rockfalls and PFs followed the onset of deflation
accompanying the waning of the hybrid swarm. Figure 8 shows this correlation with tilt cycles,
earthquakes and seismic readings (Watts et al., 2002, Calder et al., 2002). In concert with the
increased intensity of inflation and earthquakes, SO2 emission readings also increased (Kokelaar,
2002). Towards the end of May 1997 however, cyclic activity declined (Calder et al., 2002).

15
Figure 8 – Comparison of a) Real-Time seismic amplitude measurement (RSAM) with b) cyclic tilt records and c) total number of triggered earth quakes for period 18-22 May 1997) (Calder et al., 2002) 4.3 - What was the cause of the 25 June 1997 event? The pause in activity at the end of May 1997 was brief, at 05:30 local time 22 June 1997 cyclic
activity resumed with an abrupt inflation of the dome followed by the subsequent sharp deflation.
This sent pyroclastic flows to 1km to the east of the dome.
This was the start of nine inflation-deflation cycles. The periodicity of the cycles reduced whilst the
intensity increased. The number of hybrid earthquake swarms rose as did their duration, and every
period of inflation and its accompanying seismic swarm was due to an increase in magma pressure
in the upper conduit caused by the supply of gas rich magma from deep within the volcano.
Deflation of the dome only occurred when the pressure in the conduit was relaxed following the
injection of a plug of viscous magma into the dome.
This series of cycles finally culminated in the major dome collapse on 25 June 1997, as seen in
figure 9, the hybrid earthquakes merged into one tremor. The deflation cycle that coincided with the
collapse of the dome was reported as being far more pronounced than the preceeding cycles
(Loughlin et al., 2002, Calder et al., 2002, Voight et al., 1999).

16
Figure 9 – Seismogram from seismometer at Windy Hill site showing precursory hybrid earthquakes merged into a tremor the onset of the tree pyroclastic flows associated with the dome collapse of 25 June 1997 are also indicated. (Loughlin et al., 2002) So, why did the dome collapse? This was a Merapi-type flow, generated from the gravitational
collapse of unstable dome material. Calder et. al. ,2002, states that instability was caused by
extrusion of lava from the central vent focusing on one part of the dome creating asymmetrical
extrusion. Figures 7 and 10 highlight the changes in configuration of the lava dome before and after
the event. Lava broke the old dome carapace forming a lobe with a blocky steep sided headwall.
This over-steepening combined with large extrusion rates meant that these lobe fronts became
unstable. Cole et. al. 1998, suggests that the shaking of the dome due to the frequency and
increased intensity of hybrid earthquakes generated on and prior to 25 June 1997, was also
responsible for the dome collapse that generated the pyroclastic flows and surges.
Figure 10 – Configuration of the lava dome a) before and b) after 25 June 1997 partial dome collapse. (Loughlin et al., 2002)

17
4.4 - Effects of the flows and surges The devastating PFs and surges of 25 June 1997 came in three pulses:
Flow pulse 1 was confined to Mosquito Ghaut and reached Paradise River, the flow travelled 4.7km
at an average velocity of 15 m s-1 (Loughlin et al., 2002, Eyewitness accounts).
Two minutes later the second flow pulse travelled 6.8km. This had an average velocity of 16.1 m s-1,
with velocity of 20 m s-1 between the dome and Bramble village, and travelled a total distance of 6.7
km. The increase in speed and runout distance indicated that flow pulse 2 was more energetic than
pulse 1. Figure 11 shows that the block and ash deposits remained confined to Mosquito Ghaut,
Paradise River and Pea Ghaut, affecting all the villages and infrastructure in its path. However the
accompanying pyroclastic surge, detached at bends along Mosquito Ghant and travelled towards
the northwest (see figure 11) losing momentum in Rileys Yard (Loughlin et al., 2002). Eyewitnesses
described the surge as being confined to the road “moving round bends like a vehicle’. The surge
caused wide spread damage north of the lava dome including the destruction a filling station which
eyewitnesses heard explode as they scrambled for safety up Windy Hill (Loughlin et al., 2002,
Eyewitness accounts).
Figure 11 – Map showing the extent of the 25 June 1997 pyroclastic flow deposits (Druitt et al., 2002)
The third flow pulse, initiated eight minutes after the first, was the fastest and most energetic of the
flows with an average velocity of 21.9 m s-1 and a runout distance of almost 7km from the lava
dome. The block and ash flow was again confined to the same valleys as pulse 2, spilling out only
at a bend near Bramble Village, inundating parts of Bethel and Spanish Point, as seen in the in
figure 12.

18
Figure 12 – Aerial photograph showing several lobes of the block and ash flow advancing through Spanish Point (Kokelaar, 2002) As with pulse 2, pyroclastic surges detached at a bend in Mosquito Ghaut and moved to the
northwest over Farrell’s Yard. It was this surge which caused the fatalities, seven of which occurred
during the destruction of Streatham village (Loughlin et al., 2002, Eyewitness accounts, Loughlin et
al., 2002). The surge decelerated when it was blocked by an opposing hillside. This resulted in
rapid sedimentation, which transformed the surge into a dense pyroclastic flow that drained 3km
down Belham River valley reaching the outskirts of a still populated village (Sparks & Young 2002).
Many people stated that they were not aware of the approach of the flows until they heard nearby
explosions or noticed the sudden darkness; this shows that the flows and surges were quite
noiseless (Loughlin et al., 2002, Eyewitness accounts).
Direct measurements of the flows were recorded using industrial temperature patches attached to
posts, these yielded temperatures between 99 and 250°C, the difference being attributed to
differing temperatures of source material on the dome. However, the temperature of deposits in
Dyer’s River valley, five days after the events, registered 410°C. This would have been the
minimum temperature of the surge indicating a far greater maximum temperature (Druitt et al. 2002).
Figure 13 – House damaged and partially buried by block and ash deposits (Loughlin et al., 2002)

19
The erosive capability of the flows and surges was particularly striking, stripping vegetation and
topsoil in the valleys, destroying houses, (such as that in figure 13), and infrastructure (Cole et al.,
1998). This erosion coupled with the deposition of pyroclastic flows and deposits modified the
topography and the flow path of future flows, reducing the channel cross-section area, (see figure
14), and enhancing the prospect of overspill of succeeding flows, and particularly surges, making
them less predictable and increasing the potential hazard (Calder et al., 2002).
Figure 14 – Schematic cross section through a valley partly filled by a pyroclastic flow to illustrate the changing topography and surface roughness, (a) pre-emplacement, (b) post-emplacement with the rougher block-and-ash valley deposit and smoother valley flanks (Wadge et. al. 2011).

20
Chapter 5 – Monitoring and hazard mitigation of Soufrière Hills Volcano
5.1 - Importance of Monitoring
The number of fatalities that resulted from the 25th June 1997 pyroclastic events may seem low
when comparing SHV with similar events from other volcanoes in the same Caribbean island arc.
For example, pyroclastic flows on Mount Pelée in 1902 killed approximately 30,000 inhabitants
(www.usgs.gov). Other major and minor collapses on Montserrat have yielded no fatalities at all.
How can this be?
The reason is that as soon as SHV began erupting it was monitored using a variety of techniques.
The Montserrat Volcano Observatory (MVO), which comprises of multi-disciplined experienced
volcanologists (Donovan et al, 2012), was created in 1995 originally located in the old capital
Plymouth, before moving to Old Towne in north Montserrat (www.mvo.ms).
As the eruption progressed and became more violent information from the monitoring techniques
showed that the main hazards lay towards the east and to the south. These areas were fully
evacuated by April 1996 (Kokelaar 2002), no doubt saving thousands of lives on Montserrat.
5.2 Types of Monitoring
Integrated monitoring techniques are used and tested at SHV. In this section the five most
commonly used techniques (Donovan et.al. 2012), will be described. These have been in place
since the early stages of the eruption and continue to provide an effective method of monitoring the
volcano.
1. Gas Monitoring – Gas emissions have been measured throughout the eruption. Obtaining details
about the role and character of the gases provides indicators of dome growth and periods of repose
and can be used to evaluate changes in eruption rate. The information obtained is a crucial element
in risk assessment (Oppenheimer et al., 2002).
Sulphur dioxide (SO2) – is measured using three miniature ultraviolet (UV) spectrometers in fixed
positions. The data is then telemetered by the MVO.
Hydrogen chloride (HCl) – is measured indirectly using Fourier Transform Infrared spectrometer
(FTIR) measurements to obtain HCl: SO2 mass ratios in the plume allowing the HCl emission rates
to be calculated from SO2 flux rates obtained using UV spectrometers (www.mvo.ms).
Using measurements of HCl: SO2 mass ratios in the gas plume that is emitted by SHV, as seen in
figure 15, it has been possible to interpret long-term and short-term fluctuations in the deep (magma
reservoir) and shallow (conduit and dome) degassing regimes of the volcano (Oppenheimer et al.,
2002).

21
Figure 15 – Airbourne view of SHV’s gas and aerosol plume drifting over Plymouth February 1999 (Oppenheimer et al., 2002)
2. Visual Monitoring & Surveying
This is a vital technique as it allows the MVO to monitor developing volcanic events and track dome
growth. Different techniques are used including:
• Visual observations
• Ground and areal photography
• Remote digital cameras
• Topographic surveying
(www.mvo.ms, Loughlin et al., 2010)
Another technique that has been recently deployed uses satellite-borne radar. This allows eruptive
behavior to be captured that would have been missed due to e.g. poor viewpoints, darkness and
obscuration by clouds, gas and ash. Using the TerraSAR-X (TSX) radar, four main types of
information can be determined: location of eruptive vents, areal distribution of pyroclastic flow
deposits, thickness of new valley infill and topography, see figure 16 (Wadge et al., 2011)

22
Figure 16- TSX-derived topography created from a 20/4/10 – 1/5/2010 interferogram on a change difference image from 2/2/10 – 13/2/10. Contours are at 10m intervals, bold every 100m. Grid is the British West Indies Grid, values in meters. The inset box (location outlined in black) shows the Farrells Plain area north of the lava dome, with the two black arrows indication the direction of the flows to the NE and NW (Wadge et.al., 2011)

23
3. Seismic Monitoring
The recording and analyzing of volcanic earthquakes is possibly the most important and commonly
used monitoring tool. Seismology is generally regarded as the most reliable monitoring technique
and has been used throughout the SHV eruption, (www.mvo.ms, 2012, Donovan et.al. 2012). The
locations of the seismic stations can be seen on figure 17. The seismicity of an active volcano is a
useful indicator of current and future activity. For example a dome collapse is preceeded by hybrid
swarms. This makes seismic monitoring the main tool for monitoring short term activity and
sounding alarms.
Figure 17 - Topographic map of the island of Montserrat and Soufrière Hills Volcano. The locations of MVO seismic stations are shown (black triangles, broad-band; black squares, short-period). (De Angelis et al., 2007)
Four event types are used in seismic monitoring on Montserrat, their recorded waveforms can be
seen on figure 18, these are:
• Volcano–tectonic earthquakes – caused by magma intrusion.
• Long-period events – these are monochromatic signals related to pressurization of the
plumbing system.
• Hybrid earthquakes – these are a mixture of the previous two event types.
• Rockfall events – these are often visually correlated with rockfalls or pyroclastic flows from
the dome. (Luckett et al., 2007).

24
Figure 18 - Common types of volcanic events as classified at the MVO. All recorded at MBLG in September 2006 (Luckett et al., 2007)
As the nature of the seismicity of the volcano changes, the data collected continues to be vital to
the understanding of SHV (De Angelis et al., 2007).
4. Monitoring of Ground Deformation
Ground deformation can be defined as changes in the shape of the volcano that can occur prior to,
during or after an eruption. On Montserrat ground deformation has been attributed to pressure
changes in the magma chamber related to the movement of magma. An influx of magma causes an
inflation of the dome and an outflux creates a deflation (Sparks & Young, 2002, Turner, 2009).
At SHV ground deformation has been monitored using tiltmeters, electronic distance measurements
(EDM), and global positioning system (GPS) data (Sparks & Young, 2002).
• Electronic Distance Measurements (EDM)
This involves the measuring of the difference between two benchmarks placed on the volcano
thousands of meters apart. As the magma rises in one part of the volcano the overlying rocks
are moved and alterations can be detected (www.volcanoes.usgs.gov). Figure 19 shows two
MVO members carrying out an EDM survey.
Figure 19 – G. Ryan and R. Syers from the MVO carrying out EDM survey of SHV (Loughlin et.al., 2009)

25
• Tiltmeters
Tiltmeters are installed in the ground of the volcano, as seen in figure 20(a). They operate like a
spirit level. Electrodes detect minute movements of the bubble and this information is relayed
back to the scientists monitoring the volcano. A diagram of a tiltmeter can be seen in figure 20(b)
(Turner 2009).
(a) (b)
Figure 20 – a) Installing a tiltmeter on Montserrat in 1995, diagram of the inner working of a tiltmeter (Turner 2009)
Tiltmeters were initially installed in Montserrat in 1995, at a distance of around 1.5km from the
vent. They soon displayed strong rhythmic patterns of inflation and deflation (Voight et.al.,1998,
Sparks and Young, 2002).
The main problem with tiltmeters was that they were regularly destroyed by PFs. Due to this
factor no tiltmeters have been installed on SHV since 2003 (Voight et.al.,1998 De Angelis et.al.,
2007).
• Global Positioning System (GPS) data
This ground deformation monitoring tool has been used since the beginning of the eruption in
1995. Since that time it has evolved, improved and expanded to become an essential tool due to
its high precision, relatively low cost and ease of use in challenging environments on SHV
(Mattioli et.al. 2010).
GPS geodesy can measure ground deformation to the nearest millimetre by using satellites as
fixed reference frame as shown in figure 21 (Turner, 2009).

26
Figure 21 – Positions and orbital planes of GPS Satellites (Turner 2009).
• Weather and rainfall monitoring
Montserrat’s tropical location of 16° 45’N, 62° 12’W means that the island is prone to high
intensity precipitation from hurricanes and localized storms. Dome collapses on SHV and the
PF’s that followed in 1998, 2000, 2001, 2003, and 2006 were all associated with periods of
heavy rainfall, (Matthews et.al., 2004, Alexander et.al., 2010).
To monitor the rainfall on Montserrat a dense network of ‘tipping-bucket’ rain gauges, such as
the one in figure 22a, have been deployed on the island at the locations shown on figure 22b.
These supplement the four existing rain gauges operated by the Department For International
Development (DFID). This combined with data from the UK Met Office provides a monitoring
system for the threat of rainfall induced PFs (Matthews et. al., 2002).

27
Figure 22 - a) Diagram of the working of a tipping bucket gauge (www.usatoday.com), b) Map of Montserrat showing the location of the tipping bucket and DFID gauges (Matthews et al., 2002).

28
5.3 – Hazard Mitigation
As a PF cannot be stopped, the island has been divided into two main zones: a safe area and an
unsafe area as shown in figure 23 (Ryan, 2009).
As figure 23 shows the safe area covers the north of the island and is an area that is considered at
minimal risk of volcanic activities. The unsafe are covers the south of the island, which is closer to
SHV and is therefore considered to be of high risk. This is the exclusion zone (Ryan 2009).
Figure 23 – Safe and Unsafe areas, demarcated by an imaginary line (Ryan, 2009)
In 2008 the National Disaster Preparedness and Response Advisory Committee (NDPRAC)
comprising of; the Government of Montserrat, the Disaster Management Coordinating Agency
(DMCA) and the MVO, adopted a Hazard Level System the sole purpose of which was to improve
the management of the ongoing eruption and provide important information to the residents of the
island.
Using the main monitoring techniques described above the MVO advises members of the NDPRAC
on changes in SHV’s volcanic activity. The NDPFAC then uses this information to determine the
Hazard Level, which is then communicated to the population via the DMCA (www.mvo.ms, 2012).

29
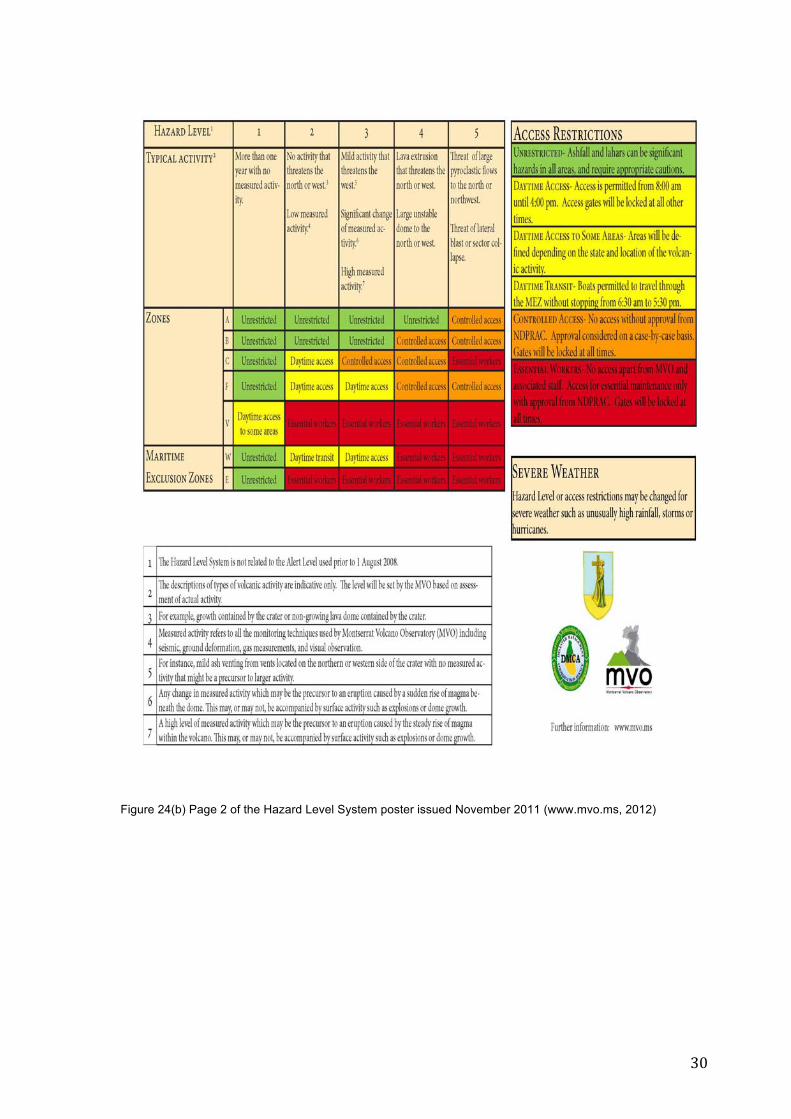
The Hazard Level System is displayed on posters around the island, such as the one in figure 24 a
and b, it divides the “unsafe” south of Montserrat into five further zones, with two maritime exclusion
zones (www.mvo.ms 2012).
Figure 24(a) Page 1 of the Hazard Level System poster issued November 2011 (www.mvo.ms, 2012).
30
Figure 24(b) Page 2 of the Hazard Level System poster issued November 2011 (www.mvo.ms, 2012)
31
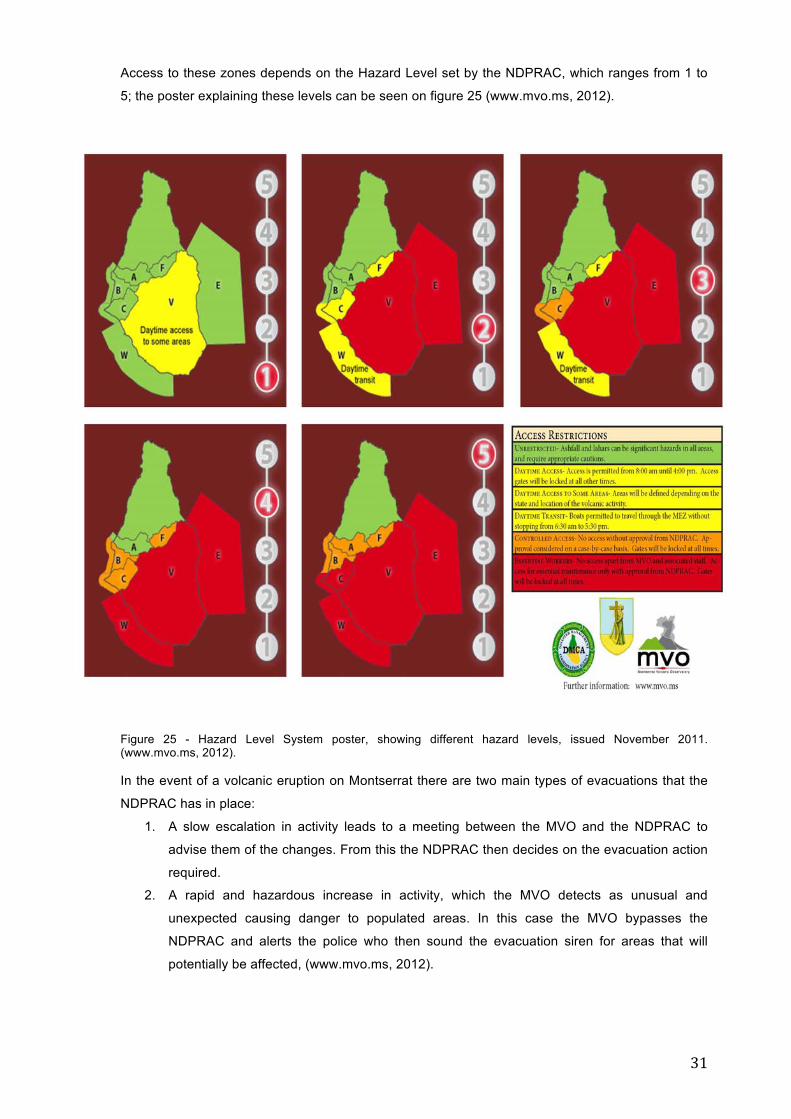
Access to these zones depends on the Hazard Level set by the NDPRAC, which ranges from 1 to
5; the poster explaining these levels can be seen on figure 25 (www.mvo.ms, 2012).
Figure 25 - Hazard Level System poster, showing different hazard levels, issued November 2011. (www.mvo.ms, 2012).
In the event of a volcanic eruption on Montserrat there are two main types of evacuations that the
NDPRAC has in place:
1. A slow escalation in activity leads to a meeting between the MVO and the NDPRAC to
advise them of the changes. From this the NDPRAC then decides on the evacuation action
required.
2. A rapid and hazardous increase in activity, which the MVO detects as unusual and
unexpected causing danger to populated areas. In this case the MVO bypasses the
NDPRAC and alerts the police who then sound the evacuation siren for areas that will
potentially be affected, (www.mvo.ms, 2012).
32
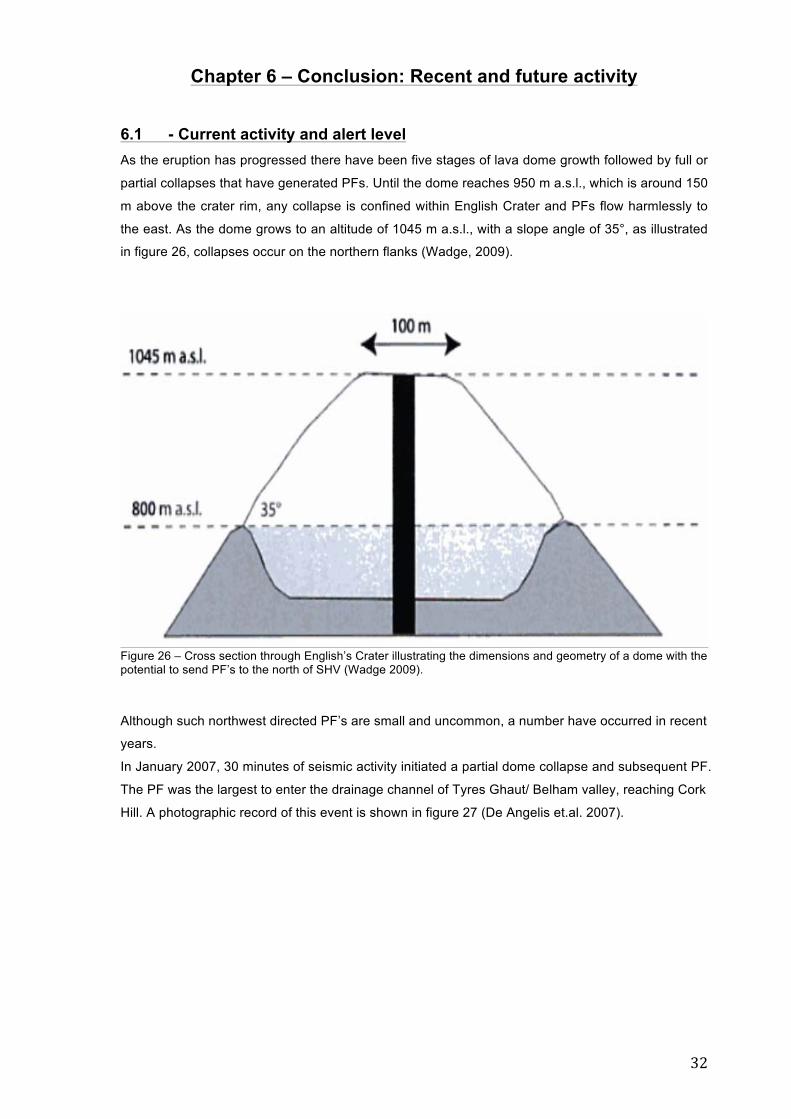
Chapter 6 – Conclusion: Recent and future activity 6.1 - Current activity and alert level As the eruption has progressed there have been five stages of lava dome growth followed by full or
partial collapses that have generated PFs. Until the dome reaches 950 m a.s.l., which is around 150
m above the crater rim, any collapse is confined within English Crater and PFs flow harmlessly to
the east. As the dome grows to an altitude of 1045 m a.s.l., with a slope angle of 35°, as illustrated
in figure 26, collapses occur on the northern flanks (Wadge, 2009).
Figure 26 – Cross section through English’s Crater illustrating the dimensions and geometry of a dome with the potential to send PF’s to the north of SHV (Wadge 2009).
Although such northwest directed PF’s are small and uncommon, a number have occurred in recent
years.
In January 2007, 30 minutes of seismic activity initiated a partial dome collapse and subsequent PF.
The PF was the largest to enter the drainage channel of Tyres Ghaut/ Belham valley, reaching Cork
Hill. A photographic record of this event is shown in figure 27 (De Angelis et.al. 2007).

33
Figure 27 – Photographic record of 8th January 2007 events at SHV: (a) PF as seen from MVO, (b) collapse scar cutting through the old crater rim, (c) NW flanks of SHV, (d) western view of Tyres Ghaut, (e) and (f), flow deposits along the Belham River and reaching the lower Belham Valley (De Angelis et.al. 2007)
Partial dome collapses generated by vulcanian explosions, which occurred in two short bursts on
the 29th July 2008 and 3 January 2009, saw the Belham valley and Tyres Ghaut again affected by
PFs. Pumice and ashfall deposits also affected the area close to SHV. A map showing the deposits
produced can be seen in figure 28 (Komorowski et.at. 2010).
Figure 28 – Deposits map produced during 3 December 2008 to 3 January 2009 eruptive phase. (Komorowski et.at. 2010)

34
During Phase 5 of lava extrusion, which began in October 2009, the dome reached its highest level
to date at 1170 m a.s.l. On 8 January 2010 the largest vulcanian explosion by volume to date,
approximately 6 million cubic meters produced a PF that travelled 6km down Belham Valley,
reaching within 1 km of Happy Hill. This was followed on 11 February 2010 by the largest dome
collapse to affect the northern side of SHV to date between 40 and 50 million cubic metres.
Fortunately this travelled to the northeast (SAC, 14, 2010).
Since the collapse of 11 February 2010 there has been a pause in lava extrusion and surface
activity has been minimal with no explosions or major dome collapses. Only minor collapses have
been generated from the steeper parts of the dome but these have travelled to the east and no
more than 2km from the dome. Even these collapses have diminished in number over the past year
(SAC, 16, 2011).
Due to the lack of activity at SHV the current hazard level set by the NDPRAC, as seen in figure 29,
is set at Level 2 (www.mvo.ms, 2012).
Figure 29 – Current Hazard Level (www.mvo.ms, 2012)

35
6.2 - Future Worst Case Scenarios
Although SHV has shown no signs of major activity since February 2010 the large dome is still
concerning. The reason being that should lava extrusion resume it would most probably start in the
11 February 2010 collapse scar, which could destablise the dome causing PFs to enter Belham
Valley. The entry into the Belham catchment and the mobility of PF would also be faster due to the
burial of Tyres Ghaut and the alteration of the valleys shape by previous PFs. Events that have a
high volume of material would most probably overtop valley walls at locations such as Cork Hill and
Richmond Hill (SAC, 15, 2011).
However it remains very difficult to know what a volcano is going to do next and its capabilities. Nor
can one predict how PFs will behave as it not possible, as yet, to observe the physical mechanisms
within PFs as a cloud of fine ash shrouds them. It is possible to infer some information by studying
the deposits. Add to this the understanding of what is possible based of information from past PFs,
the knowledge of current valley conditions with regards to vegetation and infill. A forecast of likely
behavior can then be made using computer models.
Simulations generally focus on how PFs would affect the populated regions of NW Montserrat,
Figure 30 shows the results of a computer simulation of PF’s of various volumes and the areas that
would be affected by their inundations (Widiwijayanti et.al., 2008).
Figure 30 – simulated inundations of block and ash PF’s of selected volume for the Belham River Drainage (Widiwijayanti et.al., 2008)

36
The pyroclastic surge limit is shown on figure 30 as the pale blue line. As can be seen, a pyroclastic
surge has the ability to travel beyond the limits of the basal avalanche and advance further beyond
the exclusion zone boundary, (shown on figure 30 as the black line), inundating more of the
populated areas, shaded pink, completely engulfing Old Towne (Widiwijayanti et.al., 2008).
More recent simulations have considered the possibility of a dome larger than that which currently
exists. Should the summit elevation rise to over 1200m a.s.l. then a larger collapse volume would
need to be considered. Using three different computer simulations; PFz, Pyroflow, and Titan 2D,
figure 31 shows the results of a potential 50 million m3 collapse at SHV, with 20 million m3 entering
the Belham Valley, from three different computer simulations, PFz, Pyroflow, and Titan2D. The flow
limits show that such a collapse has the potential to reach into the populated regions of Zone A and
B (SAC, 15, 2011).
Figure 31 – Limits of a 20 million m3 pyroclastic flow simulations on the northern side of Belham Valley (SAC, 15, 2011).
However, the main threat to the population of Montserrat may not be the size of the collapse but
the nature of the eruption. As the volcano has a tendency to show a gradual build up of activity,
and because the eruption has lasted so long, SAC 16 states that SHV has the potential to last a
further 22 years. The familiarity leads people to use their own experiences when making decisions
rather than taking the official advice. This was what led to the fatalities on 25 June 1997 and could
lead to fatalities in the future, especially if SHV develops a new type of behavior (SAC,16, 2011,
Loughlin et al., 2002, Eyewitness accounts). In some ways the shape of Montserrat also adds to
the risk from SHV. If it was bigger the population would be moved further north, if it was smaller the
whole island would have been evacuated. As it is people in Montserrat need all the land they can
get and live on the edge of the danger zone. This places a heavy burden on the shoulders of the
scientists of the MVO who cannot afford to let their guard down (Stone, 2003).

37
References Alexander, J. J. Barclay, J. Sušnik, S. C. Loughlin, R. A. Herd, A. Darnell, S. Crosweller, (2010),
Sediment-Charges flash floods on Montserrat: The influence of synchronous tephra fall and varying extent of vegetation damage. Journal of Volcanology and Geothermal Research 194, 127-138.
Bayou Reconnaissance Man Website (2012) - www.bayourenaissanceman.co.uk
Calder, E. S., R. Luckett, R. S. J. Sparks, and B. Voight (2002), Mechanisms of lava dome instability and generation of rockfalls and pyroclastic flows at Soufriere Hills Volcano, Montserrat. In: The eruption of the Soufriere Hills Volcano, Montserrat from 1995 to 1999. Edited by Druitt TH & Kokelaar, B P. Geological Society London, Memoir No. 21, 173 - 190.
Cole, P. D., E. S. Calder, T.H. Druitt, R. Hoblitt, R. Robertson, R.S.J. Sparks,
and S.R. Young (1998), Pyroclastic flows generated by gravitational instability of the 1996-1997 lava dome of Soufriere Hills Volcano, Montserrat. Geophysical Research Letters, 25, No. 18, 3425- 3428.
De Angelis, S., V. Bass, V. Hards, G. Ryan (2007), Seismic characterization of pyroclastic flow
activity at Soufriere Hills Volcano, Montserrat, 8 January. Natural Hazards and Earth System Sciences 7(4), 467-472.
Donovan. A., C. Oppenheimer, M. Bravo (2012), Science at the policy interface: volcano-monitoring
technologies and volcanic hazard management. Bulletin of Volcanology, vol. 74, no. 5, 1005-1022.
Druitt, T. H., E. S. Calder, P. D. Cole, R. P. Hoblitt, S. C. Loughlin, G. E. Norton, L. J. Ritchie, R. S.
J. Sparks, and B. Voight (2002), Small-volume, highly mobile pyroclastic flows formed by rapid sedimentation from pyroclastic surges at Soufriere Hills Volcano Montserrat: an important volcanic hazard. In: The eruption of the Soufriere Hills Volcano, Montserrat from 1995 to 1999. Edited by Druitt TH & Kokelaar, B P. Geological Society London, Memoir No. 21, 263-279
Herd, R. A., M. Edmonds, V.A. Bass, (2005), Catastrophic lava dome failure at Soufriere Hills
Volcano, Montserrat, 12-13 July 2003. Journal of Volcanology and Geothermal Research 148, 234–252.
Hooper, D. M., and G. S. Mattioli, (2001), Kinematic Modeling of Pyroclastic Flows Produced by
Gravitational Dome Collapse at Soufriere Hills Volcano, Montserrat. Natural Hazards 23: 65–86.
Geological Society Website (2012) Lyell Collection, www.geolsoc.org.uk Kokelaar, B P. (2002) Setting, chronology and consequences of the eruption of Soufriere Hills
Volcano, Montserrat (1995-1999). In: The eruption of the Soufriere Hills Volcano, Montserrat from 1995 to 1999. Edited by Druitt TH & Kokelaar, B P. Geological Society London, Memoir No. 21, 1 - 43
Komorowski J. C., Y. Legendre, T. Christopher, M. Bernstein, R. Stewart,
E. Joseph, N. Fournier, L. Chardot, A. Finizola, G. Wadge, R. Syers, C. Williams, and V. Bass (2010), Insights into processes and deposits of hazardous vulcanian explosions at Soufrière Hills Volcano during 2008 and 2009 (Montserrat, West Indies), Geophysical Research Letters, 37, L00E19, doi:10.1029/2010GL042558
Loughlin, S. C., B. Baptie and B. McCourt, (2009), Explosive research, Monitoring Montserrat’s
volcano – past, present and future. Planet Earth, Summer 2009, 30 – 31. Loughlin, S. C., E. S. Calder, A. B. Clarke, P. D. Cole, R. Luckett, M. Mangan, D. Pyle, R. S. J.
Sparks, B. Voight, and R. Watts, (2002), Pyroclastic flows generated by the 25 June 1997 dome collapse, Soufriere Hills Volcano, Montserrat. In: The eruption of the Soufriere Hills Volcano, Montserrat from 1995 to 1999. Edited by Druitt TH & Kokelaar, B P. Geological Society London, Memoir No. 21, 191 - 209.
Loughlin, S. C, P. J. Baxter, W. P. Aspinall, B. Darroux, C. L. Harford, and A. D.Miller, (2002).
Eyewitness accounts of the 25 June 1997 pyroclastic flows at Soufriere Hills Volcano,

38
Montserrat, and implications for disaster mitigation. In: The eruption of the Soufriere Hills Volcano, Montserrat from 1995 to 1999. Edited by Druitt TH & Kokelaar, B P. Geological Society London, Memoir No. 21, 211 - 230.
Loughlin, S. C., R. Luckett, G. Ryan, T. Christopher, V. Hards, S. De Angelis, L. Jones, and M. Strutt (2010), An overview of lava dome evolution, dome collapse and cyclicity at Soufrière Hills Volcano, Montserrat, 2005–2007, Geophysical Research Letters, 37, L00E16, doi:10.1029/ 2010GL042547.
Luckett, R., B. Baptie, L. Ottemoller, G. Thompson, G (2007), Seismic monitoring of the Soufriere
Hills Volcano, Montserrat, Seismological Research Letters Volume 78, Number 2. Mattioli, G. S., R. A. Herd, M. H. Strutt, G. Ryan, C. Widiwijayanti, B. Voight, (2010), Long term
surface deformation of Soufiere Hills Volcano, Montserrat from GPS geodesy: Inferences from simple elastic models. Geophysical Research Letters, 37, L00E13, doi:10.1029/2009GL042268.
Matthews, A. J., J. Barclay, S. Carn, R. A. Herd, G. Thompson, (2002), Rainfall-induced volcanic
activity on Montserrat. Geophysical Research Letters, 29, 13, 1644, 10.1029/2002GL014863 Matthews, A. J., and J. Barclay (2004), A thermodynamical model for rainfall-triggered volcanic
dome collapse, Geophysical Research Letters, 31, L05614, doi:10.1029/ 2003GL019310. Melnik, O., and R. S. J. Sparks, (2002), Dynamics of magma ascent and lava extrusion at the
Soufriere Hills volcano, Montserrat In: The eruption of the Soufriere Hills Volcano, Montserrat from 1995 to 1999. Edited by Druitt TH & Kokelaar, B P. Geological Society London, Memoir No.21, 153 - 171.
Montserrat Volcano Observatory, (2012), www.mvo.ms
Oppenheimer, C., M. Edmonds, P. Francis and M. Burton (2002), The eruption of Soufrière Hills Volcano Montserrat (1995–1999): Overview of scientific results, in The Eruption of Soufrière Hills Volcano, Montserrat From 1995 to 1999, edited by T. H. Druitt and R. Kokelaar, Geological Society London, Memoir No. 21, 621–639.
Parraras-Carayannis, G. website (2012) Disaster pages of Dr. George Pararas-Carayannis,
www.drgeorgepc.com Ryan L. (2009), GIS in Hazard Mapping and Vulnerability Assessment on Montserrat, URISA
Journal • Vol. 21, No. 1 SAC, 14 (2010), Assessment of the hazards and risks associated with the Soufrière Hills Volcano,
Montserrat. Fourteenth Report of the Scientific Advisory Committee on Montserrat Volcanic Activity. www.mvo.ms.
SAC, 15, (2011), Assessment of the hazards and risks associated with the Soufrière Hills Volcano,
Montserrat. Fifteenth Report of the Scientific Advisory Committee on Montserrat Volcanic Activity. www.mvo.ms.
SAC, 16, (2011), Assessment of the hazards and risks associated with the Soufrière Hills Volcano,
Montserrat. Sixteenth Report of the Scientific Advisory Committee on Montserrat Volcanic Activity. www.mvo.ms.
Sparks, R. S. J., and S. R. Young (2002), The eruption of Soufrière Hills Volcano Montserrat (1995–
1999): Overview of scientific results, in The Eruption of Soufrière Hills Volcano, Montserrat From 1995 to 1999, edited by T. H. Druitt and R. Kokelaar, Geological Society London, Memoir No. 21, 45–69.
Stone, R. (2003), Bracing for the big one on Montserrat, Science, Vol 299, 2027-2030. Turner, H. L. (2009), GEOL 4553/5553 Volcanology,
www.uta.edu/faculty/mattioli/geol_4553/lect_10_volcanic_def_HLT_09.pdf University of Virginia – School of architecture website (2012) - www.arch.virginia.edu

39
U.S. Geological Survey website (2012), - www.usgs.cov USA today website (2012) – www.usatoday.com Voight, B., R. S. J. Sparks, A. D. Miller. (1999). Magma flow instability and cyclic activity at
Soufrière Hills Volcano Montserrat, British West Indies, Science, 283, 1138-1142. Voight, B., R. P. Hoblitt, A. B. Clarke, A. B. Lockhart, A. D. Miller, L. Lynch, J. McMahon (1998),
Remarkable cyclic ground deformation monitored in real-time on Montserrat, and its use in eruption forecasting, Geophysical Research Letters, 25, No.18, 3405 -3408.
Wadge, G. (2009), assessing the pyroclastic flow hazards from dome collapse at Soufrière Hills
Volcano, Montserrat, Studies in Volcanoology: The Legacy of George Walker. Special publication of IAVCEI, 2. 211-224
Wadge, G., R. Herd, G. Ryan, E. S. Calder, and J. ‐C. Komorowski (2010), Lava production at
Soufrière Hills Volcano, Montserrat: 1995–2009, Geophysical Research Letters, 37, L00E03, doi: 10.1029/2009GL041466.
Wadge, G, P., Cole, A. Stinton, J.-C. Komorowski, R. Stewart, A.C. Toombs, Y. Legendre (2011),
Rapid topographic change measured by high-resolution satellite radar at Soufriere Hills Volcano, Montserrat, 2008–2010, Journal of Volcanology and Geothermal Research 199, 142–152.
Watts, R. B., R. A. Herd, R. S. J. Sparks and S. R. Young (2002), The eruption of Soufrière Hills
Volcano Montserrat (1995–1999): Overview of scientific results, in The Eruption of Soufrière Hills Volcano, Montserrat From 1995 to 1999, edited by T. H. Druitt and R. Kokelaar, Geological Society London, Memoir No. 21, 115–152.
Widiwijayanti, C., B. Voight, D. Hidayat, (2008) Objective rapid delineation of areas at risk from
block-and-ash pyroclastic flows and surges. Bull Volcanol 71: 687–703, DOI 10.1007/s00445-008-0254-6.


![Transport properties of pyroclastic rocks from … · canmodifytheiroriginalpetrophysicalcharacteristics[Fisher, 1998; Flint, 2003; Flint and Selker, 2003]. ... samples, mainly pyroclastic](https://static.fdocuments.in/doc/165x107/5b7728a97f8b9ad2498c1d87/transport-properties-of-pyroclastic-rocks-from-canmodifytheiroriginalpetrophysicalcharacteristicsfisher.jpg)