A structured weight loss program increases gut microbiota ...
14
RESEARCH ARTICLE A structured weight loss program increases gut microbiota phylogenetic diversity and reduces levels of Collinsella in obese type 2 diabetics: A pilot study Fabian Frost ID 1 , Lena J. Storck 1,2 , Tim Kacprowski 3,4 , Simone Ga ¨ rtner 1 , Malte Ru ¨ hlemann ID 5 , Corinna Bang 5 , Andre Franke ID 5 , Uwe Vo ¨ lker 3 , Ali A. Aghdassi 1 , Antje Steveling 1 , Julia Mayerle 1,6 , Frank U. Weiss 1 , Georg Homuth 3 , Markus M. Lerch 1 * 1 Department of Medicine A, University Medicine Greifswald, Greifswald, Germany, 2 Department of Medicine, Cantonal Hospital Winterthur, Winterthur, Switzerland, 3 Department of Functional Genomics, Interfaculty Institute for Genetics and Functional Genomics, University Medicine Greifswald, Greifswald, Germany, 4 Chair of Experimental Bioinformatics, TUM School of Life Sciences Weihenstephan, Technical University of Munich, Freising-Weihenstephan, Germany, 5 Institute of Clinical Molecular Biology, Christian Albrechts University of Kiel, Kiel, Germany, 6 Department of Medicine II, University Hospital, LMU Munich, Munich, Germany * [email protected] Abstract The global obesity epidemic constitutes a major cause of morbidity and mortality challenging public health care systems worldwide. Thus, a better understanding of its pathophysiology and the development of novel therapeutic options are urgently needed. Recently, alterations of the intestinal microbiome in the obese have been discussed as a promoting factor in the pathophysiology of obesity and as a contributing factor to related diseases such as type 2 diabetes and metabolic syndrome. The present pilot study investigated the effect of a struc- tured weight loss program on fecal microbiota in obese type 2 diabetics. Twelve study sub- jects received a low-calorie formula diet for six weeks, followed by a nine week food reintroduction and stabilization period. Fecal microbiota were determined by 16S rRNA gene sequencing of stool samples at baseline, after six weeks and at the end of the study after fifteen weeks. All study subjects lost weight continuously throughout the program. Changes in fecal microbiota were most pronounced after six weeks of low-calorie formula diet, but reverted partially until the end of the study. However, the gut microbiota phyloge- netic diversity increased persistently. The abundance of Collinsella, which has previously been associated with atherosclerosis, decreased significantly during the weight loss pro- gram. This study underlines the impact of dietary changes on the intestinal microbiome and further demonstrates the beneficial effects of weight loss on gut microbiota. Trial registration: ClinicalTrials.gov NCT02970838. PLOS ONE | https://doi.org/10.1371/journal.pone.0219489 July 18, 2019 1 / 14 a1111111111 a1111111111 a1111111111 a1111111111 a1111111111 OPEN ACCESS Citation: Frost F, Storck LJ, Kacprowski T, Ga ¨rtner S, Ru ¨hlemann M, Bang C, et al. (2019) A structured weight loss program increases gut microbiota phylogenetic diversity and reduces levels of Collinsella in obese type 2 diabetics: A pilot study. PLoS ONE 14(7): e0219489. https:// doi.org/10.1371/journal.pone.0219489 Editor: Shahrad Taheri, Weill Cornell Medical College in Qatar, QATAR Received: July 24, 2018 Accepted: June 23, 2019 Published: July 18, 2019 Copyright: © 2019 Frost et al. This is an open access article distributed under the terms of the Creative Commons Attribution License, which permits unrestricted use, distribution, and reproduction in any medium, provided the original author and source are credited. Data Availability Statement: All relevant data are within the manuscript and its Supporting Information files. Funding: The standardized weight loss program OPTIFAST was used with the consent of Nestle ´ Health Science Germany which also provided partial funding for this study and granted a 15% discount to the study participants. The work reviewed was further supported by grants from the Deutsche Forschungsgemeinschaft (DFG GRK
Transcript of A structured weight loss program increases gut microbiota ...

RESEARCH ARTICLE
A structured weight loss program increases
gut microbiota phylogenetic diversity and
reduces levels of Collinsella in obese type 2
diabetics: A pilot study
Fabian FrostID1, Lena J. Storck1,2, Tim Kacprowski3,4, Simone Gartner1,
Malte RuhlemannID5, Corinna Bang5, Andre FrankeID
5, Uwe Volker3, Ali A. Aghdassi1,
Antje Steveling1, Julia Mayerle1,6, Frank U. Weiss1, Georg Homuth3, Markus M. Lerch1*
1 Department of Medicine A, University Medicine Greifswald, Greifswald, Germany, 2 Department of
Medicine, Cantonal Hospital Winterthur, Winterthur, Switzerland, 3 Department of Functional Genomics,
Interfaculty Institute for Genetics and Functional Genomics, University Medicine Greifswald, Greifswald,
Germany, 4 Chair of Experimental Bioinformatics, TUM School of Life Sciences Weihenstephan, Technical
University of Munich, Freising-Weihenstephan, Germany, 5 Institute of Clinical Molecular Biology, Christian
Albrechts University of Kiel, Kiel, Germany, 6 Department of Medicine II, University Hospital, LMU Munich,
Munich, Germany
Abstract
The global obesity epidemic constitutes a major cause of morbidity and mortality challenging
public health care systems worldwide. Thus, a better understanding of its pathophysiology
and the development of novel therapeutic options are urgently needed. Recently, alterations
of the intestinal microbiome in the obese have been discussed as a promoting factor in the
pathophysiology of obesity and as a contributing factor to related diseases such as type 2
diabetes and metabolic syndrome. The present pilot study investigated the effect of a struc-
tured weight loss program on fecal microbiota in obese type 2 diabetics. Twelve study sub-
jects received a low-calorie formula diet for six weeks, followed by a nine week food
reintroduction and stabilization period. Fecal microbiota were determined by 16S rRNA
gene sequencing of stool samples at baseline, after six weeks and at the end of the study
after fifteen weeks. All study subjects lost weight continuously throughout the program.
Changes in fecal microbiota were most pronounced after six weeks of low-calorie formula
diet, but reverted partially until the end of the study. However, the gut microbiota phyloge-
netic diversity increased persistently. The abundance of Collinsella, which has previously
been associated with atherosclerosis, decreased significantly during the weight loss pro-
gram. This study underlines the impact of dietary changes on the intestinal microbiome and
further demonstrates the beneficial effects of weight loss on gut microbiota.
Trial registration: ClinicalTrials.gov NCT02970838.
PLOS ONE | https://doi.org/10.1371/journal.pone.0219489 July 18, 2019 1 / 14
a1111111111
a1111111111
a1111111111
a1111111111
a1111111111
OPEN ACCESS
Citation: Frost F, Storck LJ, Kacprowski T, Gartner
S, Ruhlemann M, Bang C, et al. (2019) A
structured weight loss program increases gut
microbiota phylogenetic diversity and reduces
levels of Collinsella in obese type 2 diabetics: A
pilot study. PLoS ONE 14(7): e0219489. https://
doi.org/10.1371/journal.pone.0219489
Editor: Shahrad Taheri, Weill Cornell Medical
College in Qatar, QATAR
Received: July 24, 2018
Accepted: June 23, 2019
Published: July 18, 2019
Copyright: © 2019 Frost et al. This is an open
access article distributed under the terms of the
Creative Commons Attribution License, which
permits unrestricted use, distribution, and
reproduction in any medium, provided the original
author and source are credited.
Data Availability Statement: All relevant data are
within the manuscript and its Supporting
Information files.
Funding: The standardized weight loss program
OPTIFAST was used with the consent of Nestle
Health Science Germany which also provided
partial funding for this study and granted a 15%
discount to the study participants. The work
reviewed was further supported by grants from the
Deutsche Forschungsgemeinschaft (DFG GRK
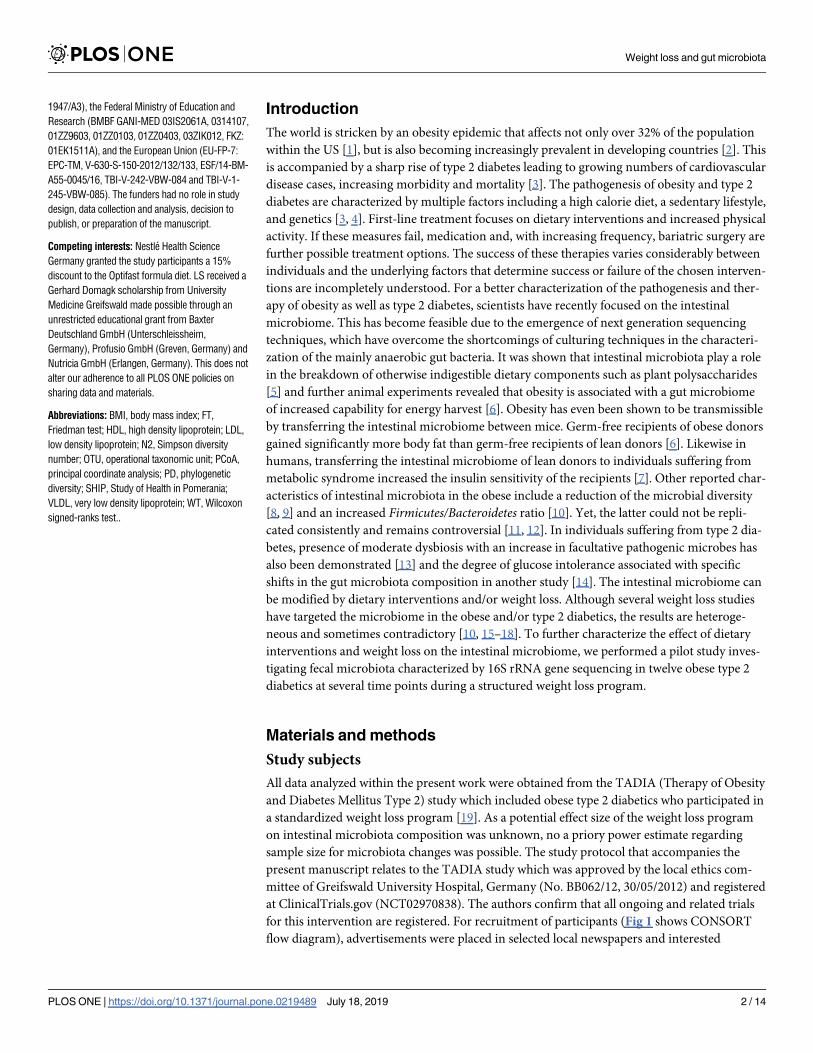
Introduction
The world is stricken by an obesity epidemic that affects not only over 32% of the population
within the US [1], but is also becoming increasingly prevalent in developing countries [2]. This
is accompanied by a sharp rise of type 2 diabetes leading to growing numbers of cardiovascular
disease cases, increasing morbidity and mortality [3]. The pathogenesis of obesity and type 2
diabetes are characterized by multiple factors including a high calorie diet, a sedentary lifestyle,
and genetics [3, 4]. First-line treatment focuses on dietary interventions and increased physical
activity. If these measures fail, medication and, with increasing frequency, bariatric surgery are
further possible treatment options. The success of these therapies varies considerably between
individuals and the underlying factors that determine success or failure of the chosen interven-
tions are incompletely understood. For a better characterization of the pathogenesis and ther-
apy of obesity as well as type 2 diabetes, scientists have recently focused on the intestinal
microbiome. This has become feasible due to the emergence of next generation sequencing
techniques, which have overcome the shortcomings of culturing techniques in the characteri-
zation of the mainly anaerobic gut bacteria. It was shown that intestinal microbiota play a role
in the breakdown of otherwise indigestible dietary components such as plant polysaccharides
[5] and further animal experiments revealed that obesity is associated with a gut microbiome
of increased capability for energy harvest [6]. Obesity has even been shown to be transmissible
by transferring the intestinal microbiome between mice. Germ-free recipients of obese donors
gained significantly more body fat than germ-free recipients of lean donors [6]. Likewise in
humans, transferring the intestinal microbiome of lean donors to individuals suffering from
metabolic syndrome increased the insulin sensitivity of the recipients [7]. Other reported char-
acteristics of intestinal microbiota in the obese include a reduction of the microbial diversity
[8, 9] and an increased Firmicutes/Bacteroidetes ratio [10]. Yet, the latter could not be repli-
cated consistently and remains controversial [11, 12]. In individuals suffering from type 2 dia-
betes, presence of moderate dysbiosis with an increase in facultative pathogenic microbes has
also been demonstrated [13] and the degree of glucose intolerance associated with specific
shifts in the gut microbiota composition in another study [14]. The intestinal microbiome can
be modified by dietary interventions and/or weight loss. Although several weight loss studies
have targeted the microbiome in the obese and/or type 2 diabetics, the results are heteroge-
neous and sometimes contradictory [10, 15–18]. To further characterize the effect of dietary
interventions and weight loss on the intestinal microbiome, we performed a pilot study inves-
tigating fecal microbiota characterized by 16S rRNA gene sequencing in twelve obese type 2
diabetics at several time points during a structured weight loss program.
Materials and methods
Study subjects
All data analyzed within the present work were obtained from the TADIA (Therapy of Obesity
and Diabetes Mellitus Type 2) study which included obese type 2 diabetics who participated in
a standardized weight loss program [19]. As a potential effect size of the weight loss program
on intestinal microbiota composition was unknown, no a priory power estimate regarding
sample size for microbiota changes was possible. The study protocol that accompanies the
present manuscript relates to the TADIA study which was approved by the local ethics com-
mittee of Greifswald University Hospital, Germany (No. BB062/12, 30/05/2012) and registered
at ClinicalTrials.gov (NCT02970838). The authors confirm that all ongoing and related trials
for this intervention are registered. For recruitment of participants (Fig 1 shows CONSORT
flow diagram), advertisements were placed in selected local newspapers and interested
Weight loss and gut microbiota
PLOS ONE | https://doi.org/10.1371/journal.pone.0219489 July 18, 2019 2 / 14
1947/A3), the Federal Ministry of Education and
Research (BMBF GANI-MED 03IS2061A, 0314107,
01ZZ9603, 01ZZ0103, 01ZZ0403, 03ZIK012, FKZ:
01EK1511A), and the European Union (EU-FP-7:
EPC-TM, V-630-S-150-2012/132/133, ESF/14-BM-
A55-0045/16, TBI-V-242-VBW-084 and TBI-V-1-
245-VBW-085). The funders had no role in study
design, data collection and analysis, decision to
publish, or preparation of the manuscript.
Competing interests: Nestle Health Science
Germany granted the study participants a 15%
discount to the Optifast formula diet. LS received a
Gerhard Domagk scholarship from University
Medicine Greifswald made possible through an
unrestricted educational grant from Baxter
Deutschland GmbH (Unterschleissheim,
Germany), Profusio GmbH (Greven, Germany) and
Nutricia GmbH (Erlangen, Germany). This does not
alter our adherence to all PLOS ONE policies on
sharing data and materials.
Abbreviations: BMI, body mass index; FT,
Friedman test; HDL, high density lipoprotein; LDL,
low density lipoprotein; N2, Simpson diversity
number; OTU, operational taxonomic unit; PCoA,
principal coordinate analysis; PD, phylogenetic
diversity; SHIP, Study of Health in Pomerania;
VLDL, very low density lipoprotein; WT, Wilcoxon
signed-ranks test..
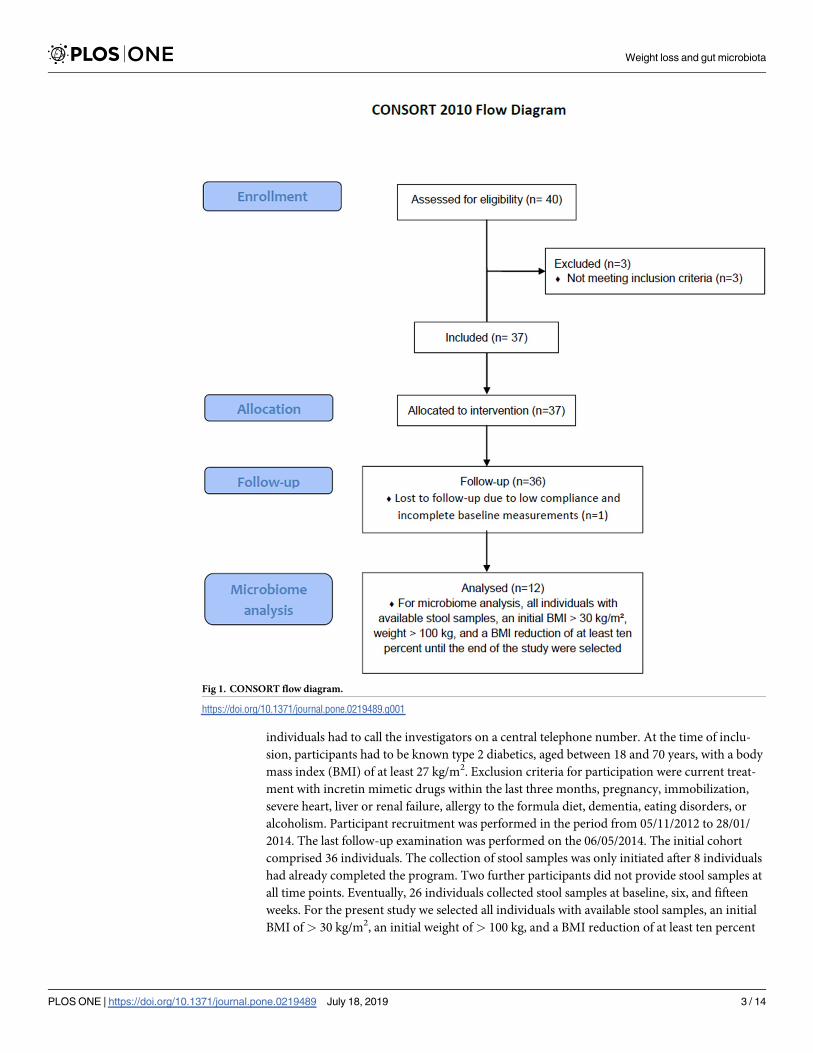
individuals had to call the investigators on a central telephone number. At the time of inclu-
sion, participants had to be known type 2 diabetics, aged between 18 and 70 years, with a body
mass index (BMI) of at least 27 kg/m2. Exclusion criteria for participation were current treat-
ment with incretin mimetic drugs within the last three months, pregnancy, immobilization,
severe heart, liver or renal failure, allergy to the formula diet, dementia, eating disorders, or
alcoholism. Participant recruitment was performed in the period from 05/11/2012 to 28/01/
2014. The last follow-up examination was performed on the 06/05/2014. The initial cohort
comprised 36 individuals. The collection of stool samples was only initiated after 8 individuals
had already completed the program. Two further participants did not provide stool samples at
all time points. Eventually, 26 individuals collected stool samples at baseline, six, and fifteen
weeks. For the present study we selected all individuals with available stool samples, an initial
BMI of> 30 kg/m2, an initial weight of> 100 kg, and a BMI reduction of at least ten percent
Fig 1. CONSORT flow diagram.
https://doi.org/10.1371/journal.pone.0219489.g001
Weight loss and gut microbiota
PLOS ONE | https://doi.org/10.1371/journal.pone.0219489 July 18, 2019 3 / 14

until the end of the study. Of the twelve selected participants, eight were of female and four of
male gender. The mean age was 57.2 years. Treatment of diabetes was performed dietetically
in five, with oral medication in four, and with combined oral and insulin medication in three
cases. Eleven individuals were suffering from hypertension and eight participants had hyper-
lipidemia of which seven were receiving antihyperlipidemic agents. One study subject was a
smoker. All study participants provided written informed consent before inclusion in the trial.
Standardized weight loss program
All participants received a standardized three-phase weight loss program (OPTIFAST II Short
program, Nestle Health Science Germany). The initial fasting phase lasted six weeks during
which individuals received a low-calorie formula diet fully substituting the regular diet. Five
formula sachets containing 96 g of carbohydrates, 70 g of proteins and 15 g of fat were con-
sumed per day providing 800 kcal energy. In addition, the sachets were enriched with the daily
recommended amount of minerals and vitamins. Apart from the formula diet, patients were
recommended to drink at least 2.5 liters of water or any other calorie-free beverage per day.
During the second phase, comprising four weeks, the formula diet was incrementally reduced
and a regular diet reintroduced, allowing a daily intake of 1,200 kcal. The final phase lasted five
weeks wherein the daily energy intake was incrementally increased up to the predicted amount
that would stabilize the participants weight (1,200–1,500 kcal). In addition to dietary instruc-
tions, all participants received a structured physical training course adapted to the individual
fitness level throughout the intervention. Health status and diabetic drug dosage were moni-
tored once a week by the study center. To avoid the occurrence of hypoglycemic episodes, oral
insulinotropic drugs and metformin were paused during the fasting phase. Furthermore, indi-
viduals requiring prandial insulin injections received a lowered dose of two insulin units per
carbohydrate unit. All subjects were advised to monitor their blood glucose levels at least six
times daily and to inform the study physician in case of levels below 5.6 mmol/l or higher than
12 mmol/l. Further adjustments of insulin dosages were performed on an individual basis
when necessary.
Phenotypic data
Body mass index (BMI) was calculated as kilograms per square meter. Blood for determination
of HbA1c, fasting glucose, insulin, total cholesterol, low density lipoprotein (LDL), high den-
sity lipoprotein (HDL), triglycerides, and uric acid was obtained in the morning after a mini-
mum fasting period of eight hours.
16S rRNA gene sequencing
All fecal samples were collected in the domestic environment at baseline, six and fifteen weeks
by the study participants, transferred into a stabilizing EDTA-buffer and then shipped to our
laboratory. DNA extraction was done using the PSP Spin Stool DNA Kit (Stratec Biomedical
AG, Birkenfeld, Germany) and the isolated DNA stored at -80˚C. The V1-V2 region of bacte-
rial 16S rRNA genes was amplified by dual-indexing PCR using the primer pair 27F and 338R.
The resulting PCR products were purified and normalized utilizing the Invitrogen SequalPrep
Normalization Plate Kit (Thermo Fisher Scientific, Waltham, USA). Sequencing was per-
formed on a MiSeq platform (Illumina, San Diego, USA). MiSeq Fast-Q files were generated
by CASAVA 1.8.2 (https://support.illumina.com/sequencing/sequencing_software/casava)
and all sequences trimmed with Sickle (https://github.com/najoshi/sickle). For merging of for-
ward and reverse reads and subsequent filtering VSEARCH [20] was used. Quality filtering
was performed by FastX Toolkit (http://hannonlab.cshl.edu/fastx_toolkit), including only
Weight loss and gut microbiota
PLOS ONE | https://doi.org/10.1371/journal.pone.0219489 July 18, 2019 4 / 14
reads with a quality score of at least 30 (error probability 1 in 1,000) per base in 95% of
sequenced nucleotides. Clustering of operational taxonomic units (OTU) was done at a mini-
mum sequence similarity of 97% using VSEARCH. Possible chimera were filtered out by
USEARCH [21]. After randomly selecting 10,000 reads from each sample, taxonomic assign-
ment was carried out using the RDP classifier at a minimum bootstrap confidence of 80% at
each taxonomic rank. Classifications with confidence below 80% were assigned to an artificial
taxon as unclassified family, order, class, or phylum.
Outcomes
Fecal microbiota composition based on 16S rRNA gene sequencing.
Data and statistical analysis
All statistical analyses and creation of figures were performed in ’R’ (v. 3.3.3, https://www.r-project.org/). Alpha diversity estimations based on OTU counts were calculated using the R
package ’vegan’ [22] for ’Simpson diversity number’ and ’picante’ [23] for ’Phylogenetic diver-
sity’. Calculation of Bray-Curtis dissimilarity index and subsequent principal coordinate analy-
sis (PCoA) was performed using the ’vegan’ functions vegdist and cmdscale, respectively, on
square root transformed genus abundance data. The significance of changes in beta diversity
during the study was estimated using the ’vegan’ function adonis, which fits linear models to
distance matrices and calculates p values by permutations (n = 10,000). Paired continuous phe-
notypic variables and laboratory parameters were assessed with the Wilcoxon signed rank test
(WT) or the Friedman test (FT) in case of two or three groups for comparison, respectively. To
evaluate differences in fecal microbiota all phyla or genera that were present in more than 50%
of samples were compared using the Friedman test and the resulting p values corrected for
multiple testing by the procedure of Benjamini & Hochberg. Thereafter, the corrected p values
were called q values. To further determine the specific time point at which taxa identified as
significant by the global Friedman test were changed, taxon abundances at baseline were com-
pared to six or fifteen weeks, respectively, using the Wilcoxon-signed rank test. All p or q val-
ues are given with three significant digits. Results were considered significant when q values
were< 0.05 in case of taxon comparisons at different time points. For all other statistical anal-
yses a p value < 0.05 was considered significant. All binary variables are stated as percentages
and continuous variables as medians (first to third quartiles).
Results
Twelve obese study subjects suffering from type 2 diabetes underwent a structured weight loss
program which consisted of a low-calorie formula diet for 6 weeks and a subsequent food rein-
troduction and stabilization period for another 9 weeks. In addition, all participants performed
structured physical exercises throughout the program. The aim was to investigate the effect of
the weight loss program on fecal microbiota. Stool samples were collected at baseline, six and
fifteen weeks and the microbial community structure determined by 16S rRNA gene
sequencing.
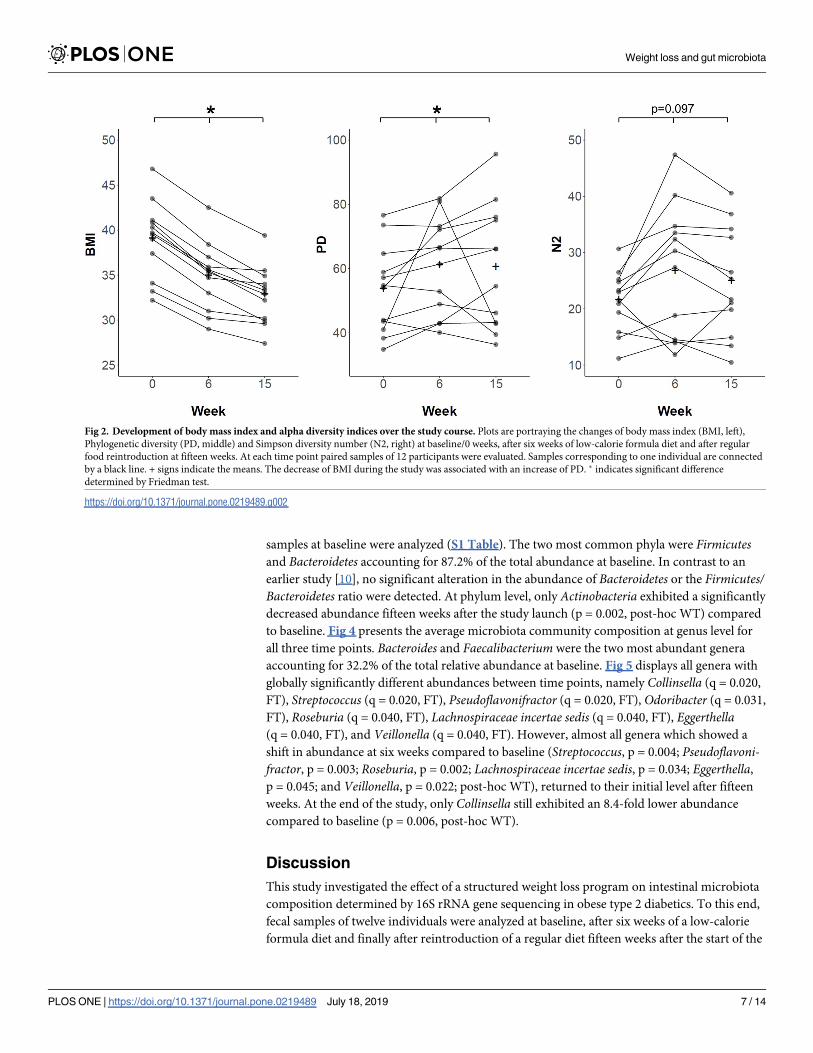
Throughout the program, all participants lost weight continuously, starting at a BMI of 39.6
(36.6–40.9) kg/m2, decreasing to 35.4 (32.5–36.2) kg/m2 at six weeks and finally reaching 33.1
(30.1–34.2) kg/m2 after fifteen weeks (p< 0.001, FT). The absolute weight loss in all partici-
pants over the whole program ranged from 11.4 to 30.1 kg. This was accompanied by a signifi-
cant improvement of glucose metabolism indicated by a reduction of HbA1c, fasting glucose,
and insulin (Table 1 and S1 Fig). Furthermore, a reduction of total cholesterol and uric acid,
which was most pronounced at the end of the fasting phase after six weeks, was noted.
Weight loss and gut microbiota
PLOS ONE | https://doi.org/10.1371/journal.pone.0219489 July 18, 2019 5 / 14

Weight loss is associated with increased phylogenetic diversity
Alpha diversity indices describe the species variation within a community or sample. To assess the
effect of weight loss on the gut microbiota alpha diversity, two different metrics, namely ’Phyloge-
netic diversity’ (PD)[24] and ’Simpson diversity number’ (N2)[25], were calculated and compared
to baseline (Fig 2). PD, which is based on the phylogenetic relationship between different taxa
within a sample, increased significantly from 54.4 (43.0–60.3) at baseline to 63.9 (47.5–72.4) after
six weeks and 60.3 (43.1–75.3) after fifteen weeks (global: p = 0.039, FT; 0 vs. 6 weeks: p = 0.009,
post-hoc WT; 0 vs. 15 weeks: p = 0.034, post-hoc WT). N2, which is based on taxon abundance
data and diversity, was 22.2 (18.5–24.9) at baseline and increased to 28.8 (14.4–33.8) after six weeks
and 23.5 (18.6–33.1) after fifteen weeks. However, the latter was not significant (p = 0.097, FT).
Beta diversity analysis reveals distinct fecal microbiota shifts during the
study
Beta diversity indices assess the variation in composition between different communities or
samples. To ascertain whether differences between gut microbiota at different time points
were detectable, we computed the Bray-Curtis dissimilarity[25] and subsequently conducted a
principal coordinate analysis. Fig 3 shows the first two principal coordinate axes explaining
36.2% of the total microbial variation. The fecal microbiota markedly shifted after the end of
the low-calorie formula diet (six weeks). Yet, at the end of the study (fifteen weeks) they
returned towards baseline again. Performing permutational analysis of variance using Bray-Curtis dissimilarity confirmed significant shifts in microbiota diversity between the different
time points (r2 = 0.08, p< 0.001).
The majority of taxon abundance changes are not sustained after
termination of the low-calorie formula diet
To further investigate the specific changes within the fecal microbiota at different study time
points, all classified phyla or genera, respectively, that were present in more than 50% of
Table 1. Laboratory evaluation of metabolic parameters at different study time points.
Baseline (0 weeks) 6 weeks 15 weeks p value
HbA1c
(%)
6.6 (6.1–7.2) - 6.0 (5.4–6.4) 0.003�
Fasting glucose (mmol/l)# 6.9 (6.2–8.3) - 5.8 (5.4–6.2) 0.002�
Insulin
(pmol/l)#154.3 (102.4–217.8) - 84.3 (53.1–99.8) 0.002�
Total cholesterol (mmol/l)# 4.7 (4.5–5.8) 4.5 (3.2–4.8) 4.8 (4.0–4.8) 0.016�
LDL
(mmol/l)#2.7 (2.6–3.4) 2.7 (1.9–3.2) 2.9 (2.6–3.0) 0.035�
HDL
(mmol/l)#1.2 (0.9–1.4) 1.0 (1.0–1.3) 1.1 (1.0–1.3) 0.234
Triglycerides (mmol/l)# 1.6 (1.1–2.5) 1.0 (0.9–1.6) 1.5 (0.9–2.2) 0.178
Uric acid
(μmol/l)
316.0 (282.8–356.2) 250.5 (200.8–299.5) 273.5 (249.5–354.2) 0.024�
Metabolic laboratory parameters of the twelve participants were evaluated at baseline (0 weeks), after the low-calorie formula diet (6 weeks) and after reintroduction of a
regular diet (15 weeks). LDL: Low density lipoprotein. HDL: High density lipoprotein. Data are given as median (first to third quartiles). Wilcoxon signed-rank test and
Friedman test were used for assessment of significance in case of two or three different time points, respectively.# one participant was not fasting before the blood sample was obtained and therefore excluded from the analysis.
� indicates significant test result. All values were rounded to one decimal place.
https://doi.org/10.1371/journal.pone.0219489.t001
Weight loss and gut microbiota
PLOS ONE | https://doi.org/10.1371/journal.pone.0219489 July 18, 2019 6 / 14
samples at baseline were analyzed (S1 Table). The two most common phyla were Firmicutesand Bacteroidetes accounting for 87.2% of the total abundance at baseline. In contrast to an
earlier study [10], no significant alteration in the abundance of Bacteroidetes or the Firmicutes/Bacteroidetes ratio were detected. At phylum level, only Actinobacteria exhibited a significantly
decreased abundance fifteen weeks after the study launch (p = 0.002, post-hoc WT) compared
to baseline. Fig 4 presents the average microbiota community composition at genus level for
all three time points. Bacteroides and Faecalibacterium were the two most abundant genera
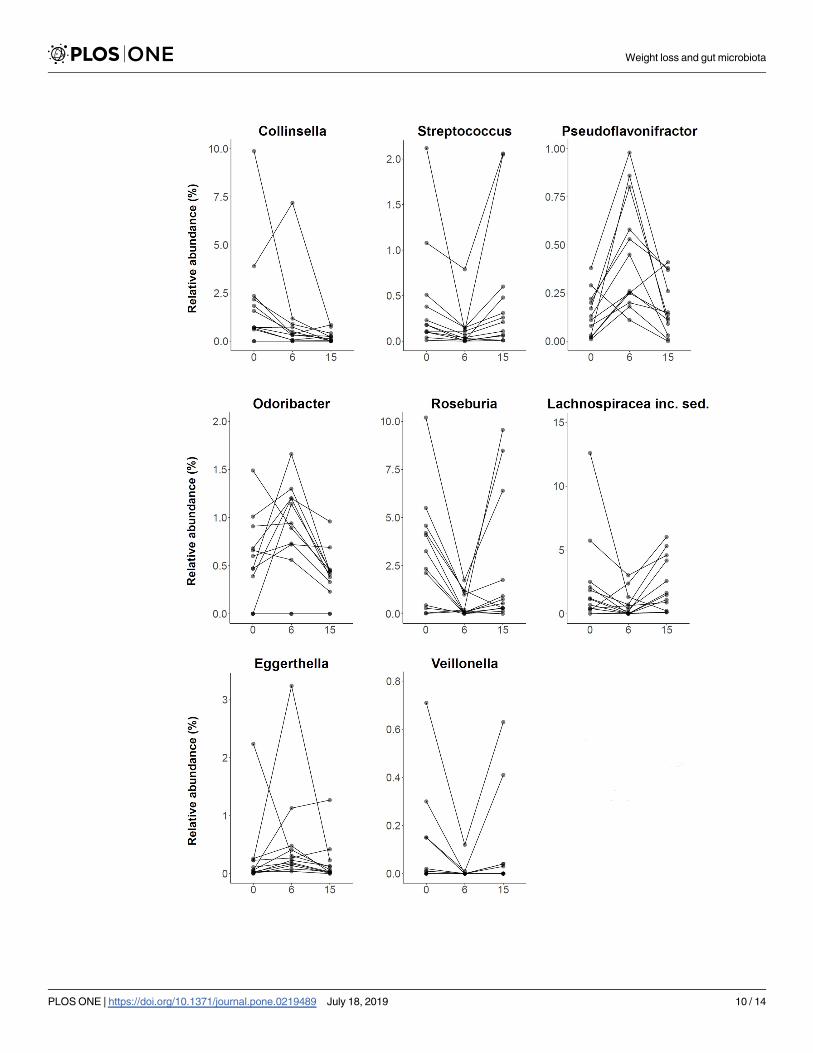
accounting for 32.2% of the total relative abundance at baseline. Fig 5 displays all genera with
globally significantly different abundances between time points, namely Collinsella (q = 0.020,
FT), Streptococcus (q = 0.020, FT), Pseudoflavonifractor (q = 0.020, FT), Odoribacter (q = 0.031,
FT), Roseburia (q = 0.040, FT), Lachnospiraceae incertae sedis (q = 0.040, FT), Eggerthella(q = 0.040, FT), and Veillonella (q = 0.040, FT). However, almost all genera which showed a
shift in abundance at six weeks compared to baseline (Streptococcus, p = 0.004; Pseudoflavoni-fractor, p = 0.003; Roseburia, p = 0.002; Lachnospiraceae incertae sedis, p = 0.034; Eggerthella,
p = 0.045; and Veillonella, p = 0.022; post-hoc WT), returned to their initial level after fifteen
weeks. At the end of the study, only Collinsella still exhibited an 8.4-fold lower abundance
compared to baseline (p = 0.006, post-hoc WT).
Discussion
This study investigated the effect of a structured weight loss program on intestinal microbiota
composition determined by 16S rRNA gene sequencing in obese type 2 diabetics. To this end,
fecal samples of twelve individuals were analyzed at baseline, after six weeks of a low-calorie
formula diet and finally after reintroduction of a regular diet fifteen weeks after the start of the
Fig 2. Development of body mass index and alpha diversity indices over the study course. Plots are portraying the changes of body mass index (BMI, left),
Phylogenetic diversity (PD, middle) and Simpson diversity number (N2, right) at baseline/0 weeks, after six weeks of low-calorie formula diet and after regular
food reintroduction at fifteen weeks. At each time point paired samples of 12 participants were evaluated. Samples corresponding to one individual are connected
by a black line. + signs indicate the means. The decrease of BMI during the study was associated with an increase of PD. � indicates significant difference
determined by Friedman test.
https://doi.org/10.1371/journal.pone.0219489.g002
Weight loss and gut microbiota
PLOS ONE | https://doi.org/10.1371/journal.pone.0219489 July 18, 2019 7 / 14

program. All selected participants showed continuous weight loss throughout the program
accompanied by alterations in the fecal microbiota. These changes were most pronounced
after six weeks but partially reversed until the end of the study.
Cross-sectional studies have shown lower microbiota diversity in obese subjects compared
to lean controls [8]. This was supported by a reported association of low gut bacterial richness
with a higher degree of obesity, insulin resistance and dyslipidemia [9]. In addition, obese indi-
viduals with low bacterial richness had experienced greater weight gain in the past compared
to obese individuals with high bacterial richness. Decreased microbial diversity has also been
identified as a key feature in other medical conditions such as Crohn’s disease [26]. Interest-
ingly, fecal microbiota transfer from healthy donors to Crohn’s disease patients resulted in an
increase of microbial diversity which positively correlated with the reduction of symptoms
[27]. Another study investigating the rate of chemotherapy-related blood stream infections in
non-Hodgkin lymphoma patients showed an increased rate of blood stream infections in indi-
viduals with decreased baseline gut microbiota diversity [28]. The above mentioned investiga-
tions suggest low microbial diversity to be disadvantageous for an individual’s health and
associated with adverse outcomes in disease. Considering the conditions that can arise in
Fig 3. Principal coordinate analysis (PCoA) of Bray-Curtis dissimilarity. PCoA of 36 gut microbiota samples
belonging to twelve participants at three different time points (baseline/0 weeks, six weeks and fifteen weeks). The two
major PCo1 and PCo2 are shown. All samples are connected to the centroid (displayed as square) of their respective
time point. The microbial communities shifted markedly between baseline and six weeks, then returned towards
baseline after fifteen weeks.
https://doi.org/10.1371/journal.pone.0219489.g003
Weight loss and gut microbiota
PLOS ONE | https://doi.org/10.1371/journal.pone.0219489 July 18, 2019 8 / 14

obese individuals, it is of interest whether a reduced microbial diversity can be improved by
dietary intervention and/or weight loss. To this end, a study reported that microbial gene rich-
ness in individuals with previously low genetic bacterial richness increases during a dietary
intervention [15]. In our study we can confirm a rise in phylogenetic diversity in parallel with
weight loss, which is sustained after the termination of the dietary intervention and reintro-
duction of a regular diet. However, the increase of the Simpson diversity number after comple-
tion of the program was not significant, which might be attributed to the smaller sample size
of our group.
Another supposed key feature in the microbiome of patients with obesity is a reduction of
the phylum Bacteroidetes [8]. This was backed by an observation made under a low-calorie
diet, revealing an increasing amount of Bacteroidetes in overweight individuals during weight
loss [10]. A further study investigated the microbiota alterations after weight loss achieved by
diet to that observed after obesity surgery, finding a decrease of Bacteroidetes after low-calorie
Fig 4. Taxon composition at baseline, 6 and 15 weeks after study launch. Stacked bar plots portraying the average sample composition of the study group (n = 12) at
baseline/0 weeks, after six weeks of low-calorie formula diet and after regular food reintroduction at fifteen weeks. Taxon abundance changes were most prominent at six
weeks, but mostly not sustained at fifteen weeks.
https://doi.org/10.1371/journal.pone.0219489.g004
Weight loss and gut microbiota
PLOS ONE | https://doi.org/10.1371/journal.pone.0219489 July 18, 2019 9 / 14
Weight loss and gut microbiota
PLOS ONE | https://doi.org/10.1371/journal.pone.0219489 July 18, 2019 10 / 14

diet in contrast to increasing levels after gastric sleeve resection [29]. Of note, the achieved
weight loss was similar in both groups. Another dietary intervention study in obese found nei-
ther the amount of Bacteroidetes to be different at baseline, compared to lean controls, nor a
change in the relative proportion of Bacteroidetes after low-calorie diet [11]. Pataky et al. like-
wise found no alteration of Bacteroidetes after low-calorie diet induced weight loss in a cohort
of obese individuals suffering from fatty liver disease [30]. In the present study, we could also
not replicate a significant change of Bacteroidetes at any time point during the investigation.
The heterogeneity of the results published so far therefore challenge the assumption of reduced
Bacteroidetes counts being a potentially reversible key feature of obese individuals.
We found eight genera to be significantly altered in their abundance during the study.
Seven of them were drastically increased or decreased at six weeks after completion of the low-
calorie formula diet. Subsequent reintroduction of a regular diet reversed almost all of the
changes until final sample collection at fifteen weeks. This observation confirms two previ-
ously published dietary intervention studies which enrolled obese individuals into a very low-
calorie diet and showed that large parts of the microbial alterations seen during the dietary
intervention regressed back towards baseline after termination of the dietary intervention,
irrespective of the weight loss achieved [17, 31]. It is known that dietary modifications them-
selves directly affect the gut microbial community structure [32]. Hence, our results may sug-
gest that a large proportion of the microbiota changes seen after six weeks of weight loss were
mainly driven by the caloric and nutritional content of the low-calorie formula diet rather
than being the consequence of the concomitant weight loss which continued over all study
time points. It remains unclear whether the observed changes in microbiota composition were
a promoting factor for the concomitant weight loss or whether they merely represent a corre-
lating effect of the specific diet. In the present study, the only taxon found to remain consis-
tently associated with weight loss at study termination was the genus Collinsella which
decreased 8.4-fold. A role of Collinsella in a variety of disorders has previously been proposed
in other studies. Increased levels of Collinsella were found in individuals suffering from type 2
diabetes mellitus and in patients with symptomatic atherosclerotic carotid artery stenosis [33],
[34]. Furthermore, in overweight pregnant women the presence of Collinsella was associated
with increased levels of insulin, triglycerides and very low density lipoproteins (VLDL) [35].
Even in healthy adults elevated Collinsella concentrations have been reported to be associated
with increased cholesterol and LDL [36]. In infants, an earlier acquisition of a Collinsella- and
Bifidobacterium-dominated microbiome was found to be associated with higher subscapular
skinfold thickness, indicating more body fat [37]. In view of the above mentioned studies, the
lasting reduction of Collinsella during the present weight loss intervention may have contrib-
uted to the increased insulin sensitivity at the end of the study. A lower abundance of Collin-sella may also decrease the susceptibility for cardiovascular disease if it were to be maintained
over longer time periods. However, due to the descriptive nature of our study, the reduced
abundance of Collinsella after weight loss could merely represent a biomarker indicating an
improved metabolic state. Nevertheless, these results imply an interesting target genus for
future microbiome intervention studies, which would have to determine whether a reduction
in Collinsella can improve metabolic parameters irrespective of the subject’s weight.
Although several studies have addressed changes in gut microbiota during and after weight
loss, some of the results have not been consistent and sometimes contradictory. Different
Fig 5. Genera with significantly different abundance between different time points. Plots are portraying the relative abundance changes of the
study group (n = 12) including all significantly altered genera at baseline/0 weeks, after six weeks of low-calorie formula diet and after regular food
reintroduction at fifteen weeks. Samples corresponding to one individual are connected by a black line. At the end of the study, only abundance
changes of Collinsella were sustained. inc. sed.: incertae sedis.
https://doi.org/10.1371/journal.pone.0219489.g005
Weight loss and gut microbiota
PLOS ONE | https://doi.org/10.1371/journal.pone.0219489 July 18, 2019 11 / 14

results between studies might be explained by the heterogeneous genetic background of the
study populations, diverse dietary regimens, different baseline microbial community structure
[15] or different (sequencing) methodology [38]. Limitations of the current study include the
small sample size and the confined time period of fifteen weeks. It remains unknown whether
the reported changes of the microbiota persist in the long term.
To summarize, we confirm earlier reports of increased microbial diversity following weight
loss, which in the present study was accompanied by a decrease of Collinsella, a genus that has
recently been associated with poor metabolic states, type 2 diabetes mellitus, and atherosclero-
sis. Future intervention studies will have to determine the relevance of Collinsella in the patho-
genesis of metabolic disorders. This study also shows that dietary interventions carry the
potential to directly modify the microbial community composition. Future studies should
therefore compare different formulations of hypocaloric diets to characterize their associated
microbiota changes and thus their potential for making weight loss programs more effective.
Supporting information
S1 Table. Phylum and genus comparisons.
(XLSX)
S2 Table. Phenotypic variables.
(TXT)
S3 Table. Microbiome dataset.
(TXT)
S1 Fig. Metabolic laboratory parameters.
(PDF)
S1 File. Study protocol german.
(PDF)
S2 File. Study protocol english.
(PDF)
S3 File. TREND checklist.
(PDF)
Acknowledgments
We thank Anja Wiechert, Susanne Wiche, and Doris Jordan for technical assistance.
Author Contributions
Conceptualization: Julia Mayerle, Markus M. Lerch.
Data curation: Fabian Frost, Lena J. Storck, Tim Kacprowski, Malte Ruhlemann, Corinna
Bang.
Formal analysis: Fabian Frost.
Funding acquisition: Andre Franke, Uwe Volker, Julia Mayerle, Markus M. Lerch.
Investigation: Fabian Frost, Lena J. Storck, Tim Kacprowski, Simone Gartner, Frank U.
Weiss.
Weight loss and gut microbiota
PLOS ONE | https://doi.org/10.1371/journal.pone.0219489 July 18, 2019 12 / 14
Supervision: Andre Franke, Uwe Volker, Antje Steveling, Julia Mayerle, Georg Homuth, Mar-
kus M. Lerch.
Visualization: Fabian Frost.
Writing – original draft: Fabian Frost, Markus M. Lerch.
Writing – review & editing: Fabian Frost, Lena J. Storck, Tim Kacprowski, Simone Gartner,
Malte Ruhlemann, Andre Franke, Uwe Volker, Ali A. Aghdassi, Antje Steveling, Julia
Mayerle, Frank U. Weiss, Georg Homuth, Markus M. Lerch.
References
1. Flegal KM, Carroll MD, Ogden CL, Curtin LR. Prevalence and trends in obesity among US adults,
1999–2008. JAMA. 2010; 303:235–41. https://doi.org/10.1001/jama.2009.2014 PMID: 20071471
2. Prentice AM. The emerging epidemic of obesity in developing countries. Int J Epidemiol. 2006; 35:93–9.
https://doi.org/10.1093/ije/dyi272 PMID: 16326822
3. Zheng Y, Ley SH, Hu FB. Global aetiology and epidemiology of type 2 diabetes mellitus and its compli-
cations. Nat Rev Endocrinol. 2018; 14:88–98. https://doi.org/10.1038/nrendo.2017.151 PMID:
29219149
4. Friedman JM. Obesity: Causes and control of excess body fat. Nature. 2009; 459:340–2. https://doi.
org/10.1038/459340a PMID: 19458707
5. Backhed F, Ley RE, Sonnenburg JL, Peterson DA, Gordon JI. Host-bacterial mutualism in the human
intestine. Science. 2005; 307:1915–20. https://doi.org/10.1126/science.1104816 PMID: 15790844
6. Turnbaugh PJ, Ley RE, Mahowald MA, Magrini V, Mardis ER, Gordon JI. An obesity-associated gut
microbiome with increased capacity for energy harvest. Nature. 2006; 444:1027–31. https://doi.org/10.
1038/nature05414 PMID: 17183312
7. Vrieze A, van Nood E, Holleman F, Salojarvi J, Kootte RS, Bartelsman JFWM, et al. Transfer of intesti-
nal microbiota from lean donors increases insulin sensitivity in individuals with metabolic syndrome.
Gastroenterology. 2012; 143:913–6.e7. https://doi.org/10.1053/j.gastro.2012.06.031 PMID: 22728514
8. Turnbaugh PJ, Hamady M, Yatsunenko T, Cantarel BL, Duncan A, Ley RE, et al. A core gut microbiome
in obese and lean twins. Nature. 2009; 457:480–4. https://doi.org/10.1038/nature07540 PMID:
19043404
9. Le Chatelier E, Nielsen T, Qin J, Prifti E, Hildebrand F, Falony G, et al. Richness of human gut micro-
biome correlates with metabolic markers. Nature. 2013; 500:541–6. https://doi.org/10.1038/
nature12506 PMID: 23985870
10. Ley RE, Turnbaugh PJ, Klein S, Gordon JI. Microbial ecology: human gut microbes associated with
obesity. Nature. 2006; 444:1022–3. https://doi.org/10.1038/4441022a PMID: 17183309
11. Duncan SH, Lobley GE, Holtrop G, Ince J, Johnstone AM, Louis P, Flint HJ. Human colonic microbiota
associated with diet, obesity and weight loss. Int J Obes (Lond). 2008; 32:1720–4. https://doi.org/10.
1038/ijo.2008.155 PMID: 18779823
12. Schwiertz A, Taras D, Schafer K, Beijer S, Bos NA, Donus C, Hardt PD. Microbiota and SCFA in lean
and overweight healthy subjects. Obesity (Silver Spring). 2010; 18:190–5. https://doi.org/10.1038/oby.
2009.167 PMID: 19498350
13. Qin J, Li Y, Cai Z, Li S, Zhu J, Zhang F, et al. A metagenome-wide association study of gut microbiota in
type 2 diabetes. Nature. 2012; 490:55–60. https://doi.org/10.1038/nature11450 PMID: 23023125
14. Larsen N, Vogensen FK, van den Berg FWJ, Nielsen DS, Andreasen AS, Pedersen BK, et al. Gut
microbiota in human adults with type 2 diabetes differs from non-diabetic adults. PLoS One. 2010; 5:
e9085. https://doi.org/10.1371/journal.pone.0009085 PMID: 20140211
15. Cotillard A, Kennedy SP, Kong LC, Prifti E, Pons N, Le Chatelier E, et al. Dietary intervention impact on
gut microbial gene richness. Nature. 2013; 500:585–8. https://doi.org/10.1038/nature12480 PMID:
23985875
16. Santacruz A, Marcos A, Warnberg J, Martı A, Martin-Matillas M, Campoy C, et al. Interplay between
weight loss and gut microbiota composition in overweight adolescents. Obesity (Silver Spring). 2009;
17:1906–15. https://doi.org/10.1038/oby.2009.112 PMID: 19390523
17. Heinsen F-A, Fangmann D, Muller N, Schulte DM, Ruhlemann MC, Turk K, et al. Beneficial Effects of a
Dietary Weight Loss Intervention on Human Gut Microbiome Diversity and Metabolism Are Not Sus-
tained during Weight Maintenance. Obes Facts. 2016; 9:379–91. https://doi.org/10.1159/000449506
PMID: 27898428
Weight loss and gut microbiota
PLOS ONE | https://doi.org/10.1371/journal.pone.0219489 July 18, 2019 13 / 14
18. Kim M-S, Hwang S-S, Park E-J, Bae J-W. Strict vegetarian diet improves the risk factors associated
with metabolic diseases by modulating gut microbiota and reducing intestinal inflammation. Environ
Microbiol Rep. 2013; 5:765–75. https://doi.org/10.1111/1758-2229.12079 PMID: 24115628
19. Vogt LJ, Steveling A, Meffert PJ, Kromrey M-L, Kessler R, Hosten N, et al. Magnetic Resonance Imag-
ing of Changes in Abdominal Compartments in Obese Diabetics during a Low-Calorie Weight-Loss Pro-
gram. PLoS One. 2016; 11:e0153595. https://doi.org/10.1371/journal.pone.0153595 PMID: 27110719
20. Rognes T, Flouri T, Nichols B, Quince C, Mahe F. VSEARCH: a versatile open source tool for metage-
nomics. PeerJ. 2016; 4:e2584. https://doi.org/10.7717/peerj.2584 PMID: 27781170
21. Edgar RC, Haas BJ, Clemente JC, Quince C, Knight R. UCHIME improves sensitivity and speed of chi-
mera detection. Bioinformatics. 2011; 27:2194–200. https://doi.org/10.1093/bioinformatics/btr381
PMID: 21700674
22. Oksanen J, Blanchet FG, Friendly M, Kindt R, Legendre P, McGlinn D, et al. vegan: Community Ecol-
ogy Package. R package version 2.4–2. https://CRAN.R-project.org/package=vegan. 2017.
23. Kembel SW, Cowan PD, Helmus MR, Cornwell WK, Morlon H, Ackerly DD, et al. Picante: R tools for
integrating phylogenies and ecology. Bioinformatics. 2010; 26:1463–4. https://doi.org/10.1093/
bioinformatics/btq166 PMID: 20395285
24. O’Dwyer JP, Kembel SW, Green JL. Phylogenetic diversity theory sheds light on the structure of micro-
bial communities. PLoS Comput Biol. 2012; 8:e1002832. https://doi.org/10.1371/journal.pcbi.1002832
PMID: 23284280
25. Borcard D, Gillet F, Legendre P. Numerical Ecology with R. Cham: Springer; 2018.
26. Manichanh C, Rigottier-Gois L, Bonnaud E, Gloux K, Pelletier E, Frangeul L, et al. Reduced diversity of
faecal microbiota in Crohn’s disease revealed by a metagenomic approach. Gut. 2006; 55:205–11.
https://doi.org/10.1136/gut.2005.073817 PMID: 16188921
27. Vaughn BP, Vatanen T, Allegretti JR, Bai A, Xavier RJ, Korzenik J, et al. Increased Intestinal Microbial
Diversity Following Fecal Microbiota Transplant for Active Crohn’s Disease. Inflamm Bowel Dis. 2016;
22:2182–90. https://doi.org/10.1097/MIB.0000000000000893 PMID: 27542133
28. Montassier E, Al-Ghalith GA, Ward T, Corvec S, Gastinne T, Potel G, et al. Pretreatment gut micro-
biome predicts chemotherapy-related bloodstream infection. Genome Med. 2016; 8:49. https://doi.org/
10.1186/s13073-016-0301-4 PMID: 27121964
29. Damms-Machado A, Mitra S, Schollenberger AE, Kramer KM, Meile T, Konigsrainer A, et al. Effects of
surgical and dietary weight loss therapy for obesity on gut microbiota composition and nutrient absorp-
tion. Biomed Res Int. 2015; 2015:806248. https://doi.org/10.1155/2015/806248 PMID: 25710027
30. Pataky Z, Genton L, Spahr L, Lazarevic V, Terraz S, Gaïa N, et al. Impact of Hypocaloric Hyperproteic
Diet on Gut Microbiota in Overweight or Obese Patients with Nonalcoholic Fatty Liver Disease: A Pilot
Study. Dig Dis Sci. 2016; 61:2721–31. https://doi.org/10.1007/s10620-016-4179-1 PMID: 27142672
31. Simões CD, Maukonen J, Scott KP, Virtanen KA, Pietilainen KH, Saarela M. Impact of a very low-
energy diet on the fecal microbiota of obese individuals. Eur J Nutr. 2014; 53:1421–9. https://doi.org/10.
1007/s00394-013-0645-0 PMID: 24378982
32. David LA, Maurice CF, Carmody RN, Gootenberg DB, Button JE, Wolfe BE, et al. Diet rapidly and repro-
ducibly alters the human gut microbiome. Nature. 2014; 505:559–63. https://doi.org/10.1038/
nature12820 PMID: 24336217
33. Lambeth SM, Carson T, Lowe J, Ramaraj T, Leff JW, Luo L, et al. Composition, Diversity and Abun-
dance of Gut Microbiome in Prediabetes and Type 2 Diabetes. J Diabetes Obes. 2015; 2:1–7. https://
doi.org/10.15436/2376-0949.15.031 PMID: 26756039
34. Karlsson FH, Fåk F, Nookaew I, Tremaroli V, Fagerberg B, Petranovic D, et al. Symptomatic athero-
sclerosis is associated with an altered gut metagenome. Nat Commun. 2012; 3:1245. https://doi.org/10.
1038/ncomms2266 PMID: 23212374
35. Gomez-Arango LF, Barrett HL, McIntyre HD, Callaway LK, Morrison M, Dekker Nitert M. Connections
Between the Gut Microbiome and Metabolic Hormones in Early Pregnancy in Overweight and Obese
Women. Diabetes. 2016; 65:2214–23. https://doi.org/10.2337/db16-0278 PMID: 27217482
36. Lahti L, Salonen A, Kekkonen RA, Salojarvi J, Jalanka-Tuovinen J, Palva A, et al. Associations between
the human intestinal microbiota, Lactobacillus rhamnosus GG and serum lipids indicated by integrated
analysis of high-throughput profiling data. PeerJ. 2013; 1:e32. https://doi.org/10.7717/peerj.32 PMID:
23638368
37. Dogra S, Sakwinska O, Soh S-E, Ngom-Bru C, Bruck WM, Berger B, et al. Dynamics of infant gut micro-
biota are influenced by delivery mode and gestational duration and are associated with subsequent adi-
posity. MBio 2015. https://doi.org/10.1128/mBio.02419-14 PMID: 25650398
38. Human Microbiome Project Consortium. A framework for human microbiome research. Nature. 2012;
486:215–21. https://doi.org/10.1038/nature11209 PMID: 22699610
Weight loss and gut microbiota
PLOS ONE | https://doi.org/10.1371/journal.pone.0219489 July 18, 2019 14 / 14