
A structured population model describing diabetes evolution
20
A structured population model describing diabetes evolution Alessandro Borri, Simona Panunzi, Andrea De Gaetano SIMAI 2018 Rome, July 5, 2018
Transcript of A structured population model describing diabetes evolution
A structured population model describing diabetes evolution
Alessandro Borri, Simona Panunzi, Andrea De Gaetano
SIMAI 2018
Rome, July 5, 2018

SIMAI 2018 A. Borri et al. – A structured population model describing diabetes evolution 2
Motivation – Structured models
• Structured models are population models in which the
individuals are characterized with respect to the value of
some variable of interest, called the structure variable
(typically age, stage or size).
• A very popular class of population dynamics models derives
from the Lotka–Volterra ODE prey–predator model [Volterra
(1928)].
• The age and size structures of populations have been treated
with typical PDE formulations for many decades [Leslie
(1945); Sinko and Streifer (1967); Arino (1995)].

3
Motivation – The diabetes epidemic
• In health and pharmacological research, diabetes is currently the object of much attention, since the epidemic of obesity in western and westernized countries is becoming a severe public problem; the associated metabolic diseases represent an important social burden.
• Single-patient pathophysiological models for the evolution of diabetes have been proposed in the last few years [Topp et al. (2000); De Gaetano et al. (2008)] and simulations of cohorts of virtual patients, using these models, approximate real observations of diabetes incidence in populations at risk [Hardy et al. (2012)].
• We instead propose a glycemia-structured population model, based on a linear PDE with variable coefficients.
SIMAI 2018 A. Borri et al. – A structured population model describing diabetes evolution

4
Model equations
where • 𝑝(𝑡, 𝑔) is the density of the adult (aged 18 +) population with respect to glycemia
𝑔 ∈ [𝑔𝑚𝑖𝑛, 𝑔𝑚𝑎𝑥) at time 𝑡 ∈ [0, +∞) (expressed in #
𝑚𝑀);
• 𝑣(𝑔) is the average increase rate of glycemia (average worsening rate of the
clinical picture, expressed in 𝑚𝑀
𝑚𝑜);
• 𝜇(𝑔) is the average death rate of the individuals with glycemia 𝑔 (expressed in 1
𝑚𝑜);
• 𝛽(𝑔) is the average accrual rate of “new adults” (individuals turning 18 years old)
with glycemia 𝑔 (expressed in #
𝑚𝑀∙𝑚𝑜);
• 𝑝 ∈ 𝐿1+ is the initial population density across glycemias, satisfying 𝑝 𝑔𝑚𝑖𝑛 = 0;
• [𝑔𝑚𝑖𝑛, 𝑔𝑚𝑎𝑥) is the interval of interest for glycemia.
SIMAI 2018 A. Borri et al. – A structured population model describing diabetes evolution
5
Basic properties
• Our model is a linear PDE with variable coefficients.
• It is characterized by 3 rate functions:
a new-adult population glycemic profile 𝛽;
a glycemia-dependent mortality rate 𝜇;
a glycemia-dependent average worsening rate 𝑣.
• Only the adult population is considered.
• Rate functions are time-average functions (independent of time
t), which is a reasonable approximation in stationary conditions
and allows a trade-off between complexity and accuracy.
SIMAI 2018 A. Borri et al. – A structured population model describing diabetes evolution
6
Technical assumptions
Two cases (bounded 𝑔𝑚𝑎𝑥 < +∞ and unbounded 𝑔𝑚𝑎𝑥 = +∞)
Assumptions:
(A1) β ∈ 𝐿+1 , β 𝑔𝑚𝑖𝑛 = 0 , consistently with 𝑝 𝑔𝑚𝑖𝑛 = 0
(A2) 𝑣 Lipschitz continuous and strictly positive
(A3) 𝜇 positive and locally essentially bounded
Further assumption in the unbounded case:
(U) there exist 𝑔 , Δ > 0 s.t. 𝜇 𝑔 ≥ Δ for almost all g ≥ 𝑔
SIMAI 2018 A. Borri et al. – A structured population model describing diabetes evolution
7
Model solution
• The explicit solution is obtained by means of the method of
characteristics.
• The solution is bounded at any time.
• Decomposition of 𝑝(𝑡, 𝑔) by linearity into homogeneous
evolution 𝑝0(𝑡, 𝑔) and forced evolution 𝑝𝛽(𝑡, 𝑔).
• The component 𝑝0(𝑡, 𝑔) depends on the initial population
density 𝑝 , independently of 𝛽.
• The component 𝑝𝛽(𝑡, 𝑔) depends on the monthly accrual rate 𝛽
of the population, independently of 𝑝 .
SIMAI 2018 A. Borri et al. – A structured population model describing diabetes evolution

Equilibrium behavior
There exists a unique stationary solution 𝑝𝑠𝑠 ∈ 𝐿+1 ,
independent of the initial population 𝑝 , satisfying
Remarks on 𝑝𝑠𝑠
• the fact that the limiting behavior is independent of the initial population density 𝑝 is intuitive, because the initial population eventually vanishes and the birth distribution 𝛽 is independent of it;
• the boundedness of the population at any time is suggested by the observation that the birth function is integrable and is compensated by the death rate, which is proportional to the current living population;
• the existence and uniqueness of the limit (no oscillations) is plausible because the birth function is constant over time.
SIMAI 2018 A. Borri et al. – A structured population model describing diabetes evolution 8
9
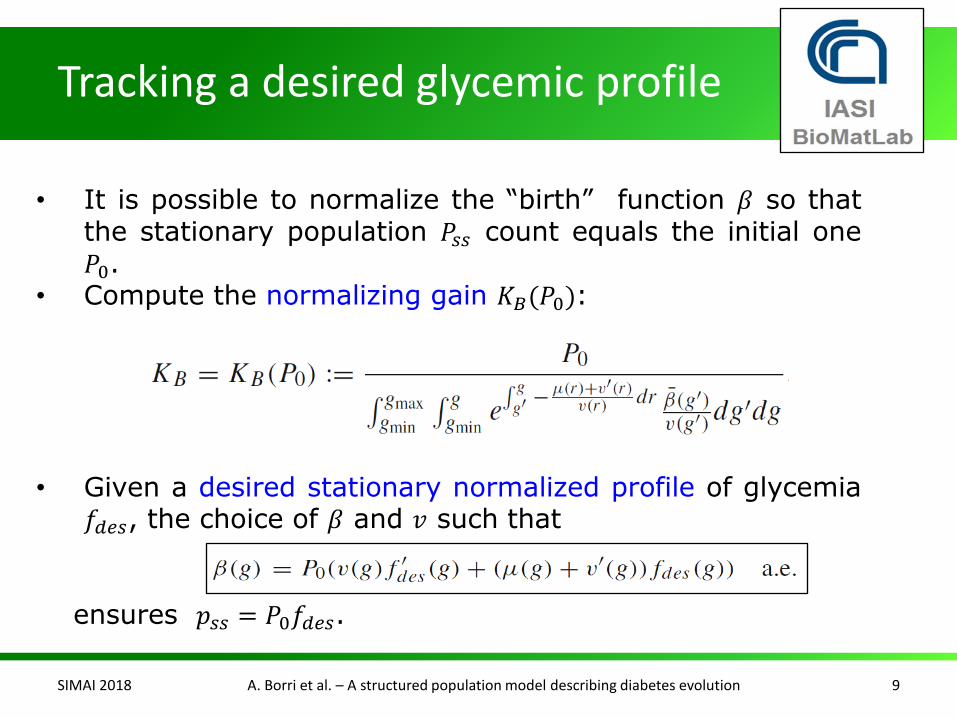
Tracking a desired glycemic profile
• It is possible to normalize the “birth” function 𝛽 so that the stationary population 𝑃𝑠𝑠 count equals the initial one 𝑃0.
• Compute the normalizing gain 𝐾𝐵(𝑃0):
• Given a desired stationary normalized profile of glycemia 𝑓𝑑𝑒𝑠, the choice of 𝛽 and 𝑣 such that
ensures 𝑝𝑠𝑠 = 𝑃0𝑓𝑑𝑒𝑠.
SIMAI 2018 A. Borri et al. – A structured population model describing diabetes evolution

10
System identification - 𝑝𝑠𝑠
The rate functions are fitted from real-life data (NHANES and WONDER databases), assuming that the US population is in equilibrium.
SIMAI 2018 A. Borri et al. – A structured population model describing diabetes evolution

11
System identification - 𝜇
The rate functions are fitted from real-life data (NHANES and WONDER databases), assuming that the US population is in equilibrium.
SIMAI 2018 A. Borri et al. – A structured population model describing diabetes evolution
12
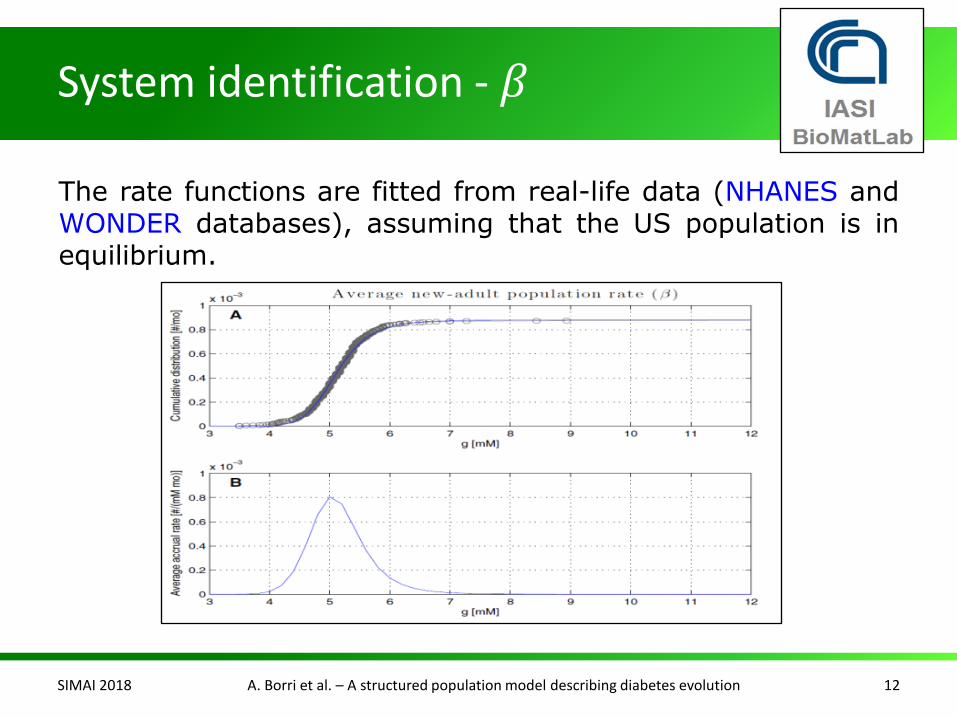
System identification - 𝛽
The rate functions are fitted from real-life data (NHANES and WONDER databases), assuming that the US population is in equilibrium.
SIMAI 2018 A. Borri et al. – A structured population model describing diabetes evolution

13
System identification - 𝑣
The rate functions are fitted from real-life data (NHANES and WONDER databases), assuming that the US population is in equilibrium.
SIMAI 2018 A. Borri et al. – A structured population model describing diabetes evolution

14
Simulation results
• We introduce some plausible modifications of functions 𝛽
and 𝑣 to obtain different steady-state glycemia
distributions.
• A change in the shape of 𝛽 can be associated to a
change in the dietary habits of teenagers.
• A reduction of 𝑣 could be the result of better therapies
of adult (pre)diabetic patients, resulting in a reduction
of the average glycemia worsening rate.
SIMAI 2018 A. Borri et al. – A structured population model describing diabetes evolution
15
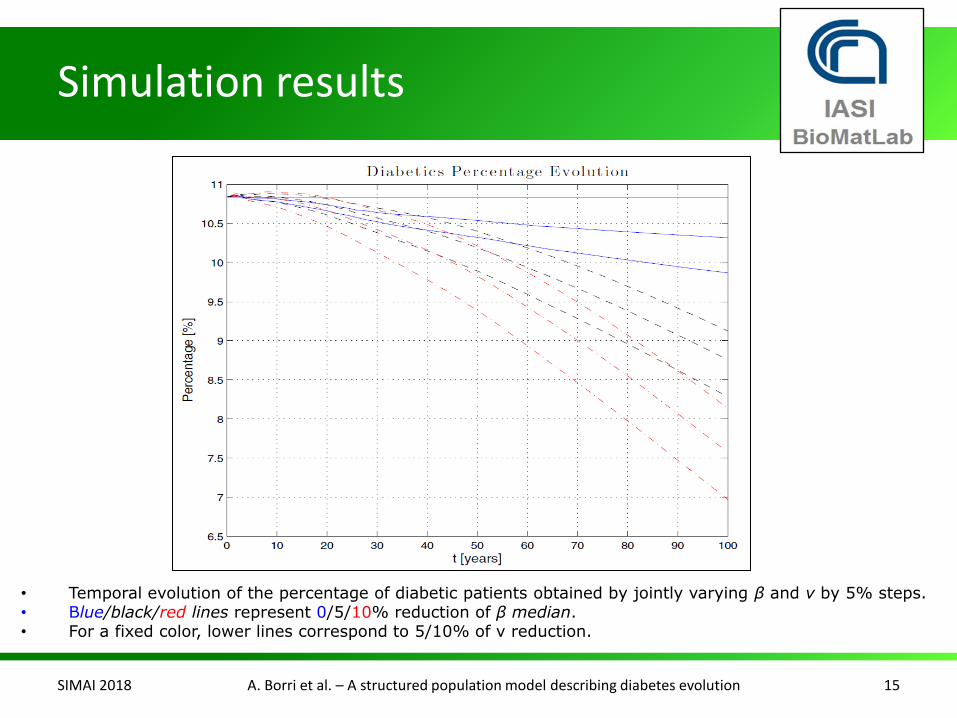
Simulation results
• Temporal evolution of the percentage of diabetic patients obtained by jointly varying β and v by 5% steps. • Blue/black/red lines represent 0/5/10% reduction of β median. • For a fixed color, lower lines correspond to 5/10% of v reduction.
SIMAI 2018 A. Borri et al. – A structured population model describing diabetes evolution

16
Simulation results
• Temporal evolution of the percentage of pre-diabetic patients obtained by jointly varying β, v by 5% steps. • Blue/black/red lines represent 0/5/10% reduction of β median. • For a fixed color, lower lines correspond to 5/10% of v reduction.
SIMAI 2018 A. Borri et al. – A structured population model describing diabetes evolution
17
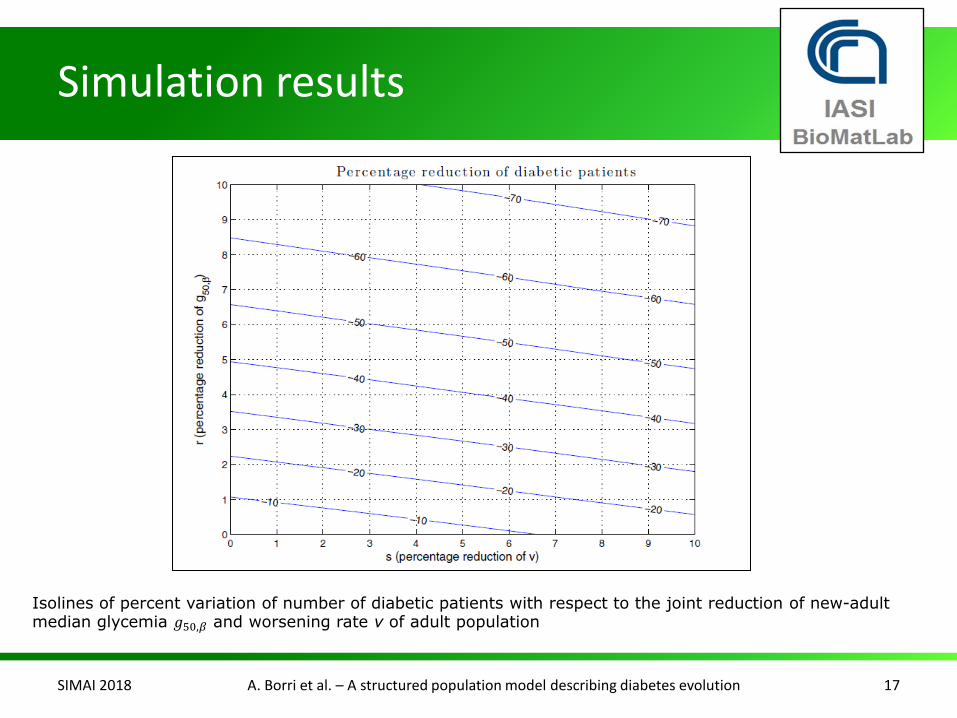
Simulation results
Isolines of percent variation of number of diabetic patients with respect to the joint reduction of new-adult median glycemia 𝑔50,𝛽 and worsening rate v of adult population
SIMAI 2018 A. Borri et al. – A structured population model describing diabetes evolution

18
Discussion and open points
• We defined a compact population model well approximating
the observed reality: it is simple and it reproduces plausibly
features, such as the behavior of the worsening rate 𝑣 ,
consistently with the expected behavior in the clinical
setting.
• The model can be used to offer insights in public health
studies or to assess pharmaceutical intervention strategies.
SIMAI 2018 A. Borri et al. – A structured population model describing diabetes evolution

19
Discussion and open points
• According to the model, it seems preferable to intervene
early, during childhood, in order to decrease the young
adult “at-risk” population, rather than wait and intervene with
lifestyle modifications and therapy during adult life. Anyway,
a combination of strategies should be the most effective at
producing the desired population profile changes.
• Possible extensions to glycemic frequency models,
considering also the increased mortality from hypoglycemia
(e.g. hepatic insufficiency).
SIMAI 2018 A. Borri et al. – A structured population model describing diabetes evolution
20
Bibliography
A. Borri, S. Panunzi, A. De Gaetano, A glycemia-structured population model, Journal of Mathematical Biology, 73(1): 39-62, 2016. and in the references therein.
Further details can be found in
...Thanks!
SIMAI 2018 A. Borri et al. – A structured population model describing diabetes evolution