A structural analysis and linear programming within an ...
216
Retrospective eses and Dissertations Iowa State University Capstones, eses and Dissertations 1963 A structural analysis and linear programming within an input-output model emphasizing agriculture in India Marudarajan Ramachandran Iowa State University Follow this and additional works at: hps://lib.dr.iastate.edu/rtd Part of the Agricultural and Resource Economics Commons , and the Agricultural Economics Commons is Dissertation is brought to you for free and open access by the Iowa State University Capstones, eses and Dissertations at Iowa State University Digital Repository. It has been accepted for inclusion in Retrospective eses and Dissertations by an authorized administrator of Iowa State University Digital Repository. For more information, please contact [email protected]. Recommended Citation Ramachandran, Marudarajan, "A structural analysis and linear programming within an input-output model emphasizing agriculture in India" (1963). Retrospective eses and Dissertations. 2359. hps://lib.dr.iastate.edu/rtd/2359
Transcript of A structural analysis and linear programming within an ...

Retrospective Theses and Dissertations Iowa State University Capstones, Theses andDissertations
1963
A structural analysis and linear programmingwithin an input-output model emphasizingagriculture in IndiaMarudarajan RamachandranIowa State University
Follow this and additional works at: https://lib.dr.iastate.edu/rtd
Part of the Agricultural and Resource Economics Commons, and the Agricultural EconomicsCommons
This Dissertation is brought to you for free and open access by the Iowa State University Capstones, Theses and Dissertations at Iowa State UniversityDigital Repository. It has been accepted for inclusion in Retrospective Theses and Dissertations by an authorized administrator of Iowa State UniversityDigital Repository. For more information, please contact [email protected].
Recommended CitationRamachandran, Marudarajan, "A structural analysis and linear programming within an input-output model emphasizing agriculture inIndia" (1963). Retrospective Theses and Dissertations. 2359.https://lib.dr.iastate.edu/rtd/2359

This dissertation has been 63—5193 microfilmed exactly as received
RAMACHANDRAN, Marudarajan, 1926-A STRUCTURAL ANALYSIS AND LINEAR PROGRAMMING WITHIN AN INPUT-OUTPUT MODEL EMPHASIZING AGRICULTURE IN INDIA.
Iowa State University of Science and Technology Ph.D., 1963 Economics, agricultural
University Microfilms, Inc., Ann Arbor, Michigan

A STRUCTURAL ANALYSIS AND LINEAR PROGRAMMING WITHIN
AN INPUT-OUTPUT MODEL EMPHASIZING AGRICULTURE IN INDIA
by
Marudarajan Ramachandran
A Dissertation Submitted to the
Graduate Faculty in Partial Fulfillment of
The Requirements for the Degree of
DOCTOR OF PHILOSOPHY
Major Subject: Agricultural Economics
Approved:
In Charge of Major Work
Head of Major Departme
Dean oj Gradua College
Iowa State University Of Science and Technology
Ames, Iowa
1963
Signature was redacted for privacy.
Signature was redacted for privacy.
Signature was redacted for privacy.

ii
TABLE OF CONTENTS
Page
INTRODUCTION 1
Nature of Input-output Analysis 1
Historical Background 2
Objectives of Study 6
PARTIAL ANALYSIS, INPUT-OUTPUT AND GENERAL EQUILIBRIUM 8
Partial Analysis and the Input-output Model 8
General Equilibrium and the Leontief System 10
AGGREGATE GROWTH MODELS AND THE INPUT-OUTPUT SYSTEM 1?
The Harrod-Domar Model 18
The Hahalanobis® Model 21
Macro Economic Models and the Dynamic Input-output System 35
A Short Term Planning Model for India 38
A Long Term Planning Model 47.
THE LEONTIEF OR INPUT-OUTPUT SYSTEM 57
Mathematical Model 58
A Numerical Example 67
Assumptions of the Input-output Model 75
AGGREGATION AND SECTORAL CLASSIFICATION 77
Problem of Aggregation 77
Conceptual Background for the Indian Inter-industry Table 84
Sources and Estimation Procedures 90

ill
Page
EMPIRICAL APPLICATIONS 93
Structural Analysis 93
Programming Applications 113
A Linear Programming Model within the Input-output Framework 130
A Variable Capital Programming Model 148
SUMMARY 181
ACKNOWLEDGMENTS 185
LITERATURE CITED 187
APPENDIX A 195
APPENDIX B 198
APPENDIX C 201

1
INTRODUCTION
In the recent past, most countries in Asia, Europe
and Latin America have been formulating and implementing
development plans. During the process of planning, there is
the need for appraising individual investment projects. Often
all investment projects are interrelated. Unless the detailed
interindustrial relations are known, the input-output relations
among industries can hardly be grasped. For example, an
investment in one industry requires the input of raw materials
from many other industries, whose production must be increased;
hence more investment must be made in these industries. This
endless process of considering all the interrelations is the
theme of input-output analysis or interindustrial analysis.
Nature of Input-output Analysis
Input-output analysis provides a compact and systematic
arrangement of different sectors or industries of an economy.
It allows the goods and services associated with each industry
to be identified as sales and purchases, depending on whether
they are outputs or inputs, respectively. These quantitative
relationships are utilized to investigate the various facets
of the economy. Interindustry techniques have been applied
for both structural analysis and for orienting government
policies. Though most of the research in the field has been

2
designed to reveal the quantitative significance of various
types of interdependence of the economy, quite a few countries
have undertaken the task of building interindustry tables so
as to serve as an aid to planning and economic development.
Beyond revealing the network of interrelationships, the inter
industry techniques have so far been of limited value for
prediction of future events.
Historical Background
Although intersectoral relationships in economics
can be traced back to the days of Tableau Economique of
Quesnay (1758), the modern theoretical form for the inter-
dependencies was provided by Leon Walras (1874) only in the
late nineteenth century. Empirical explorations in the inter
industry analysis began with the studies of Professor Leontief
(1951) on the American economy published in 1936 and 1941.
His first work was the 1919-29 study of American economy,
which was followed by a table for 1939 constructed by members
of the Harvard Economic Research project (1953)* Since then,
extensive work has been undertaken and the United States
Department of Labor (1952) has prepared an elaborate table
of two hundred sectors for 1947, in which about four hundred
and fifty industries have been detailed out and distinguished.
Cornfield, Evans and Hoffenberg (1947) investigated the
industrial implications of the attainment of full employment

3
in 1950 using the 38 x 38 input-output matrix based on the
1939 table prepared by Leontief (1951)* Barnett (1954)
evaluated the results of the study by using multiple regres
sion techniques and concluded that the input-output projec
tions were the best for all industries. However, the study
also indicated that alternate techniques were better, when
individual industry groups are considered. The studies
initiated by the U. S. Bureau of Labor Statistics, the Bureau.
of Mines, the Air Force and the Harvard University yielded
detailed indices of price and production from the base year
(1947), capital coefficients by separate types of equipment
for each industry, inventory requirements and input structures
for certain strategic military industries. An extension of
the input-output technique for solving practical problems was
the "emergency model" built up to explore the possibilities of
post-Korean defense build up.
In the United Kingdom, Barna (1956) applied input-
output analysis to ascertain the import content of different
elements of final demand and to study the effects of wage
adjustment on prices. Detailed studies have also been done
in Japan by way of structural analysis of the direct and
indirect requirements of final demand elements for imports
for labor and capital. The Economic Commission for Latin
America (1956, 1957» 1958) concentrated on the construction
of separate import matrix for several Latin American countries

4
so as to allow for a detailed analysis of import requirements.
Several regional input-output models have been developed
by decomposing the aggregate production and consumption by
regions. The regional models can broadly be classified as
(i) international trade models, (ii) interregional input-
output models and (iii) the interregional programming models.
Neisser-Modigliani (1953) constructed a world trade model for
three commodities and six regions, with exports and imports
as endogenous variables and national income, industrial
production and prices as exogenous variables. The input-
output model of Moses (1955) for United States economy and
the model of Chenery (1953) for Italy are more detailed than
other models in respect to the number of commodities, but the
number of regions are less, three in the former and two in the
latter. Both the models treat production levels and inter
regional shipments as endogenous variables, while final demand
is considered exogenous. The programming analysis of Hender
son (1958) for the United States coal industry determines
production levels, but considers consumption levels given in
each region. On the other hand, in the model of Fox (1953)
for livestock feed, demand in each region is dependent on
price, while the production is assumed as given. The optimum
supply pattern is then determined. Isard (1951» 1953) and
Leontief (1953) proposed a "balanced regional model", which
could be used to disaggregate the national aggregate.

5
Peterson (1953) and Peterson and Heady (1955)
constructed a five sector model of the U. S. economy for
1949» 1939 and 1929» laying special emphasis on agriculture.
Schnittker (1956) and Schnittker and Heady (1958) pursued
the work and constructed a regional model for agriculture for
1949. In this model, there are six regions, subdivided into
primary and secondary agriculture and six aggregate national
industry sectors. Carter (1958) and Carter and Heady (1959)
developed a regional model for United States, with ten regions
and nine commodity groups and studied economic interrelation
ships among agricultural regions and between agriculture and
rest of the economy. Regional studies have also been carried
out by Derwa (1957) for Belgium, by Bauchet (1955) for France,
by Artie (1959) for Sweden, by the Kansai Economic Federation
(1958) for Japan and by the Municipal Bureau of Statistics
(1953-54) for Holland.
The last decade has witnessed a rapid and energetic
growth in the input-output studies in many parts of the
world. Chenery and Clark (1959) in summarizing the present
research in the field observe that the applications that have
been made so far constitute illustrations of its usefulness
having varying degrees of realism; but, however, they consider
that the results must still be regarded experimental. The
nearest approaches to policy and programming uses of the
input-output technique have been attempted only in a few

6
countries, as United States and Italy. Applications to
government planning and policy orientation have been made on
a limited scale in a number of countries, as the Netherlands,
Israel, Argentina, Japan, Norway, Yugoslovia, Peru, India
and a few others.
Objectives of Study
The general objective is to investigate problems
associated with the applications of the input-output model.
Specific objectives are:
1. To appraise the similarities and dissimilarities between
the general equilibrium analysis of the classical and
neo-classical schools and the input-output analysis.
2. To trace the relation between aggregate growth models
and input-output framework and to review some of the
applications of input-output technique for short term
and long term planning in India.
3- To discuss the problems inherent in aggregation and
consider the conceptual framework for the input-output
table of the Indian economy.
k* To use the presently available Indian table in an
aggregated form for making an empirical application of
the input-output technique.
5« To investigate the interdependencies between the dif
ferent sectors of the Indian economy and systematically

7
analyse the destination of flows of goods and services
and the purposes for which they are absorbed.
6. To formulate a programming model within the input-output
framework to allocate the given capital resources in an
optimal manner.
7» To develop a variable capital programming model using
the input-output coefficients and to obtain the optimum
levels of output at different discrete levels of capital
availability.

8
PARTIAL ANALYSIS, INPUT-OUTPUT AND GENERAL EQUILIBRIUM
In this section, we consider the approaches of partial
analysis and the input-output system and discuss the similari
ties and dissimilarities of the Walrasian general equilibrium
and the Leontief system.
Partial Analysis and the Input-output Model
The partial equilibrium analysis, propounded by
Marshall (1890) and extended by his followers, explains the
reactions of producers and consumers of a given commodity
to each other's behavior and thereby determines price and
output levels in a given market under ceteris paribus
conditions. The relations between the particular industry
supplying the commodity and the consumers are expressed by a
set of supply and demand functions. Changes in the output
levels or income of the household alter the demand functions,
while changes in the uses for inputs affect the supply func
tions of the industry.
The Leontief input-output system, on the other hand,
is an aggregate system, which assumes fixed input proportions.
Supply and demand in each market is brought about, not by
changes in price, but by changes in output. In view of the
assumption of fixed input proportions, changes in the produc
tion of any one sector affects all the other sectors of the

9
economy. The profit maximization, which is the cornerstone
of partial analysis, is not explicit in the Leontief analysis.
Besides, partial analysis generally concentrates only on one
or a few of the sectors of an economy and it is further
assumed that other sectors are not affected by the changes
in the sector producing the commodity in question, which is
far from reality. Professor Leontief (1951) has stressed
this aspect in defending his system as follows:
The principal merit of the general equilibrium theory is that it enables us to take account of the highly complex network of interrelationships which transmits the impulses of any local primary change into the remotest corners of the economic system. While in the case of partial analysis, which operates simultaneously with only two or three variables, the interrelationships among these few elements can be perceived directly, such intuitive inference becomes practically impossible as soon as the number of variables increases up to four or five, not to say ten or twenty.
Regression analysis aM input-outnut
In the regression analysis, usually a small number of
independent variables are used to estimate a dependent vari
able. In contrast, in the input-output analysis there are a
large number of independent variables. Even by inclusion of
larger numbers of variables in the regression analysis, one
is not sure that the results would really improve. The
input-output models seem to have one advantage over the
regression models in that any discrepancy can be checked by
point by point comparisons to locate the error in the structure

10
or in the demand. In the case of regression analysis, there
is no scope for tracing backwards and one has to simply give
up, if the results are not up to theoretical expectations.
The input-output analysis attempts to establish causal
sequences and errors in estimates are not considered to be
the result of stochastic processes, but due to the failure
to identify correctly the parameters of demand or structure.
As such, discrepancies could always be reconciled in an
input-output model and there is no scope for hindsight in
a regression model.
General Equilibrium and the Leontief System
The interdependencies of economic variables in the
system were considered by Quesnay, as early as 1?59« Political
arithmeticians as Petty, King and others recognized in the
structure of their accounts the intermediate and final product
relationships even earlier. Walras (1874), Pareto (1911) and
Barone (1938) described interdependencies of the economy in
a system of mathematical equations, but the system was not
applied for actual problems. The Walrasian system determines
prices and quantities of services and goods supplied and
goods demanded under equilibrium conditions, when coefficients
of production, utility functions and supply functions are
assumed to be known. The input-output systen, on the other
hand, does not allow for changes in relative prices or for the

11
"price mix" or for interrelations of the price mix with the
"product mix" and the "process mix" or the "materials mix".
However, the Leontief system is useful in analyzing the
output levels that would bring all the sectors into exact
equilibrium for certain specified deliveries to final demand.
Often the input-output model is criticised that it concentrates
only on the "product mix" at the cost of all other mixes.
With its simplified assumptions, the Leontief system lends
itself to numerical computations using the data on the flows
of goods between the different sectors of an economy. Let
us now consider the similarities and differences between the
Walrasian equilibrium and the input-output system.
Walrasian general equilibrium
Balderston (1954), while discussing the Walrasian / '
equilibrium, has stated that Walras, in essense, showed
how in a static equilibrium, under conditions of free
competition, unknown prices and quantities of produced goods
could be found, given the utility functions for individuals,
coefficients of production and individual as well as market
demand functions. Cassel (1932) however, assumed as given
parameters the market supply and demand functions and
Leontief's input-output framework is more like Cassel*s
rather than the Walrasian system.
Though Walras' contribution was, no doubt, great in

12
its theoretical framework, he has been criticized for
considering a static system. Further, he did not prove that
the system of equations would have a unique solution. Goodwin
(1953) has shown that the method of reaching equilibrium,
once it is disturbed, may differ from the solution of the
mathematical problem. It was Vald (1934) who set down the
conditions for a unique solution. Wilfred Pareto (1907)
introduced the concept of changes in the parameters in the
general equilibrium. Further, refinements in the field of
comparative statics have also been suggested by Hicks (1946)
and Samuelson (1948).
The assumption of free competition is again an over
simplification of the existing system. In the terminology of
Moore (1929), "The Walrasian equations are not deduced from
reality but are hypothetical, and the equilibrium to which
the mathematical conditions lead is an ideal statical
equilibrium." The recent developments in the theory of
games put forth by von Neumann and Morgenstern (1944) have
opened new vistas for including the effects of monopoly,
government intervention, et cetera in describing solutions
reached by market.
Another criticism leveled against the Walrasian
system is the assumption of linear homogenous production
functions. This implies that the coefficients of production
are fixed and no substitution of inputs is possible. Walras

13
(1954)« however, has defended his system that under free
competition, the profits are zero and that a simplifying assump-/
tion could be made that equal quantities are produced by each
entrepreneur and that fixed and variable costs are proportional
to the total costs. Variability of coefficients could be
introduced within the framework of Walrasian system and Hicks
(1946) and Samuelson (1948) have suggested minimizing the
value of production factors (costs) subject to the production
function in order to obtain the inputs used for various
outputs. The input-output model also, in its simple form,
assumes constant technical coefficients and free competition.
IllS. iBBUt-OWtBUt system
In the input-output model, the economy is divided
into a number of industries which consume the products of
other industries and their products again go as inputs of
some other industries. In addition, in the open model, there
is the exogenous final bill of goods, which uses up products
of industry, but there is no output produced within the /
system. The open input-output model can be schematically
shown as in Table 1. / *
To start with, in the Leontief input-output system
we have a set of balance equations describing the input and
output for all goods and services. The second relation is the
set of constant technical input-output coefficients of the
form aij = Xjj/Xj, where ajj is the constant input coefficient,

14
Table 1. Scheme of input-output table
Consumers 1 2 3 . ». n Final Total Producers j. demand output
1
2
3
n
j is the amount of goods flowing from sector i to sector j
and Xj is the total output of the commodity of sector j. Thus,
with a set of constant input-output coefficients and specified
final demands (Y), the system of equations (given in detail
in the following pages under the heading mathematical model)
can be solved for the outputs required to satisfy the final
demands.
Similarities and dissimilarities of the Walrasian
and Leontief systems:
Walras has four sets of equations dealing with
(a) market supply and demand functions for factors
(b) market demand functions for goods
(c) services supplied equals demand

15
(d) cost of production equals prices of each good.
In the Leontief's model, the three sets of equations
are:
(e) balance equations describing the output of each good
and its uses as a consumption good, investment good
and as inputs in further production
(f) the average cost equals price, and
(g) fixed technical relation between input and output.
Both Walras and Leontief assume static equilibrium
as reflected in conditions (c) and (g). Similarly, they also
assume free competition as could be seen from conditions (d)
and (f ). By assuming constant technical coefficients,
Walras equates supply and demand of services and also cost
and prices of individual goods (c and d) and likewise, Leon
tief also has fixed technical coefficients over short periods
(g). In the input-output model, there are no market supply
functions or demand functions for factors in terms of price
as in the Walrasian system. There is also no counterpart for
the individual utility functions of Walras in the input-output
system and final demand is specified as a result of independent
investigations or, in other words, it is exogenous to the
model.
Carl Christ (1955) has stated that the input-output
analysis can not be rightly designated as a general equilibrium
system. While he does not dispute that the system is general,

16
/
he hesitates to concede that it is an equilibrium system. He y
observes that input-output analysis is different from the
general equilibrium theory in that it is not in itself an
equilibrium system any more than is any other production
function. The input-output system can be transformed into a
general equilibrium system by introducing utility functions
or demand schedules to reflect the preferences of the users
of outputs. The introduction of optimizing on the demand side
will yield a general equilibrium system. In the programming
formulation developed in the later sections, the element of
choice is introduced and the optimizing behavior is incorpor
ated in the input-output system. Cornfield, Evans and Hoffen-
berg (194?) have built a general equilibrium system around
the input-output production function. They first projected
the labor force, wages and labor hours for 195° and estimated
full employment national income in 1950. Then, they estimated
the quantities of goods and services that may be demanded by
households and businesses from each of the industries at the
expected level of income. Treating this as the final bill of
goods, they projected total outputs. The choice factor enters
in their model in their implicit use of the consumption and
investment functions. We shall proceed to consider some of
the aggregate growth models and their relation to the input-
output framework.

17
AGGREGATE GROWTH MODELS AND THE INPUT-OUTPUT SYSTEM
One of the problems facing both the developed and
less developed economies is the allocation of total investment
funds, available from year to year, among the different sectors
of the economy so as to ensure that the resultant growth of
the economy is balanced in character. Several growth models
have been developed to tackle this problem of investment
and these models generally fall under one of two types, riz.» »
aggregate growth models and disaggregate growth models.
Aggregate growth models are generally based on the assumption
of a single sector, comprising of the total national product
of the economy, while in the disaggregate models, the economy
is divided into several interdependent sectors for purposes
of analysis.
In this section, we do not propose to consider the
entire field of growth models, since it is outside the scope
of our study, but we will only discuss the main aspects of
the Harrod-Domar approach, which has close similarity to the
Mahalanobis1 model. As the Mahalanobis model provided the
structural scaffolding for the Second Five Year Plan, we have
considered it in greater detail. It will then be shown as to
how the macro-models discussed are structurally similar to the
dynamic input-output model. The final sections will deal
with some of the planning models developed within the input-

18
output framework.
The Harrod-Domar Model
The aggregate growth models essentially originate
from the Harrod-Domar (1957) models, which in turn take their
inspiration from Keynes (1935) insofar as the saving invest
ment equilibrium and multiplier-accelerator mechanism is
concerned. The models generally concentrate on investment
rates, which will result in a steady economic growth of the
country. Though these models have direct applicability in
respect of mature, advanced economies, nonetheless they have
been found useful for the formulation of economic policies
for the less developed countries as well.
Assuming that a certain proportion of income is being
saved, the mathematical setup of the Harrod-Domar model may
be stated as
St = sYt (2.1J
where is the saving at time t, s, the marginal propensity
to save and Y, the national income at time t. It is assumed
that the marginal propensity to save is equal to the average.
Investment at time t results in an increment of national
income at period t+1. If we denote the increment of income
by AYt and investment by It, the relationship between the two
can be expressed as

19
ÂYt = plt (2.2)
where 0 is the reciprocal of the capital-output ratio, 1%,
the investment at time t and AY ., the increment in national
income.
Under conditions of equilibrium, investment equals
savings, which can be written as
It = St (2.3)
It follows that
AYt = sYt (2.4)
which can be expressed as
AYt = sp (2.5)
xt
Equation 2.5 denotes that the proportional rate of
growth of income is equal to the saving coefficient multiplied
by the output-capital ratio. Rewriting Equation 2.5 we have
Yt+1 - Yt = sp (2 .6)
*t
or
Yt+1 = Yt + SPY,. = Yt(l + sp) (2.7)

20
Solving the difference equation we get
Yt = Y0(l + (2.8)
Equation 2.8 describes the equilibrium rate of growth
of national income over time, given the marginal propensity
to save (s) and the output-capital ratio (p ) .
Now if we assume the capital-output ratio to be
constant, we can ascertain the amount of savings needed to
realise a particular rate of growth. Denote the relative
rate of growth as r. Then it follows that
s = r/p (2.9)
or, in other words, the savings rate is equal to the rate of
growth multiplied by the capital-output ratio. The growth
of per capita income can be obtained from Equation 2.9 by
subtracting the rate of increase of population from the rate
of growth of total income, which can be expressed as
r = sp - p (2.10)
where r is the rate of growth of per capita income and p, the
population growth. If p is assumed to be a constant, the
saving ratio required for the desired increase of per capita
income r may be derived as
s = p(r + p)

21
or s = k(r + p) (2.11)
where k is the constant capital-output ratio.
The Harrod-Domar model, thus, indicates in an
aggregative manner, the amount of savings required to raise
the per capita income, given the rate of growth of population
and the rate of growth of per capita income, and assuming
constant capital-output ratio. The model, being highly
aggregative, conceals many of the structural aspects of the
problem of steady rate of growth.
The Mahalanobis1 Model
The Mahalanobis' models are just an extension of the
Harrod-Domar, which he developed independently. The models
introduce additional parameters, which we will discuss later,
and hence may be considered relatively more operational.
Professor Mahalanobis (1953) for the sake of simplicity has
developed a one sector model, where he assumed a population
growth of 1-1/4 percent, a rate of net investment of about
5 percent and a national income coefficient of net investment
of 30 to 33 percent (as high as in the United States of
America), and showed that the rate of increase of per capita
income in India will be about one-fourth of one percent,
which is not significant for all practical purposes. If,
however, the per capita income in India is to be doubled in,

22
say, 35 years, with the population growth at the assumed rate,
the per capita net national income must increase by 2 percent
and the total net national income by three and a quarter
percent. In order to attain this level, the rate of new
investment should be of the order of 10 to 11 percent of net
income per year.
the single sector of the economy to two sectors, the invest
ment goods sector and the consumers' goods sector. He also
assumes that investment (1%) can be divided into two parts,
one part going to investment goods sector (X ) and the other
part to the consumption goods sector (Xc)• It follows that
Xk + Xc = 1.
If pjç and 0C are the respective output-capital ratios
of the two sectors, we can then express
In his two sector model, Mahalanobis (1953) extended
It " Jt-1 = pk Xk Xt-1 (2.12)
and Ct - Ct-1 = p c Xc !%_% (2.13)
Equation 2.12 can be solved as
I t yi + xk , IQ = initial investment
(2.14)
:t-:o ' (2.15)

23
Similarly from Equation 2.13 it can be derived that
Ct " C0 " pc Xc ZQ
(1 + - i
xk pk
(2.16)
Adding up Equation 2.15 and Equation 2.16 we get
Yt - Y0 • V" H V'• « (2.17)
If we write IQ = aQ YQ, where aQ is a certain constant less
than unity denoting the proportion of investment to income,
then we have
A comparison of Equation 2.18 with Equation 2.8 shows
that the time path of income depends on a larger number of
structural equations in the Mahalanobis1 model than in the
Harrod-Domar model. Several interesting conclusions emerge
from the growth Equation 2.18. If we consider P's to be
technologically fixed, then the growth of income would depend
on <XQ and Xk since XQ is fixed once we know X%. Assuming <xQ
{(1 + »k Xk)* - 1}
or
Y t

24
to be a fixed constant, the planner is left with only one
policy instrument viz.. Xk. A high value for renders the
system to grow at slower rate in the initial stages and it
gains momentum with passage of time. Chakravarty (1959) has
also shown that for a high Xk, the planned marginal rate of
savings must also be higher. Haldane (1955) has, however,
shown that the optimum value of Xk may be derived by
maximizing national income or its growth over the specified
planning period.
Apart from the problem of optimum allocation of
investment funds, there was acute unemployment in the country
and hence the planners had to necessarily consider employment
as one of the important targets, while formulating the Second
Five Year Plan. Mahalanobis (1955) extended his two sector
model to one of four sectors to meet the dual objective of
maximum national income, compatible with specified employment
opportunities. The four sectors in his model are (1) invest
ment goods industries (k), (2) factory organized consumers'
goods industries (kj), (3) small scale household industries
producing consumers' goods (kg), and (4) service industries
including health, education, et cetera (k ). If we denote
Nk, N]_, Ng and as the number of additional persons
employed in the four sectors and if we describe A as the
total investment, N the total number of persons employed and
E the total increase in income over the period, the following

25
relationships are established
(2.19)
A = Nkek + + N2©2 + N3©3 (2 .20)
E = pkNk6k + + p2N262 + P3N3©3 (2.21)
ït = Y0{(1 + %)* - 1) (2.22) (2 .22)
where 0 is the net investment per employed person and other
parameters are the same as defined earlier. If a constant
annual rate of growth of income, say at percent per annum
is assumed, then E could be derived from initial income YQ.
Sectoral coefficients aM growth indicators
At this stage, we might consider some of the sectoral
coefficients of the Mahalanobis* model. Several published
sources, as the estimates of the agricultural production by
the Central Statistical Organization and the Index of
Industrial Production are available to provide a basis for
the estimation of national income. Uma Datta (1961) has
estimated the levels of net domestic product in 1955-56
and 1960-61 at the 1958-59 prices as is shown in Table 2.
order of 18 percent based on the estimates of the national
income taking into account the actual levels of production.
From Table 2 the rise in national income is of the

26
Table 2. Net domestic product at 1958-59 prices (in 100 crores of rupees)
Sector 1955-56 1960-61 Percent increase during 1956-61
1. Agriculture, animal 55*7 62.1 11.4 husbandry, etc.
2. Mining, manufacturing 20.1 25.5 26.8 and small enterprises
3» Commerce, transport 18.8 22.4 19*1 and communications
4. Professions and 17.3 22.3 28.9 services including government administration
5» Net domestic 111.9 132.3 18.2 product and factor cost
Using the figures of income, investment and employ
ment, she has calculated the sectoral values of the ratio of
increment of income to investment (3) and the net investment
required per person (0) for the Second Five Year Plan period
and has compared them with the figures assumed by Mahalanobis
(1955), as shown in Table 3.
Table 3 is a broad indicator of the country's economic
conditions. However, one notable feature is that the overall
average incremental capital-output ratio works out to 3*3:1;
as against 2.3:1 estimated in the Second Five Year Plan. To
what extent this high ratio is due to the capital intensive

Table 3« Sectoral coefficients
Sector Incremental output-çapital ratio (6)
At the end of 2nd Plan
Assumed by Mahalanobis
Net fixed investment per engaged person (6) At the end Assumed by of 2nd Plan Mahalanobis
1. Basic investment goods 0.15
2. Large scale consumer goods O.25
3. Agriculture and small scale 0.60 industries
0.20
O.35
1.25
25,000
14,200
5,515
20,000
8,750
2,500
4. Services 0.30 0.45 6,550 3,750
Table 4. Sectoral coefficients in the Third Plan
Sector P's @ *s
1. Basic investment goods (k) 0.20 25,000
2. Large scale consumer goods (cj) 0.35 10,000
3. Agriculture and small scale industries (c2)
0.75 5,500
4. Professions and services 0.45 6,000

28
nature of the sectors or otherwise cannot be accurately
assessed, because the price changes between 1952-53 and
1958-59 have been considerable and no details are available
separately on the price changes of products and investment.
PrQffrftfflitunig formulations al Mahalanobis model
Uma Datta (1961) has also formulated the linear
programming framework of the Mahalanobis* model to determine
the possible rise in national income during the Third Plan
period, i.e. 1960-61 to 1965-66. The programming formulation
can be represented as
Max ek6kNk + 6CieCiHCi + 6C2SC2NC2 + e e N <2-*3)
subject to
N, + N +N + N = N (2.24) k °1 2 3
Vk + V°1
+ V°2 + SS = 1 12-251
and 0kNk = XkI (2.26)
where N is the total additional employment to be generated
during the Third Plan, I, the net investment and Xk, the
proportion of total investments in the producers * goods
industries, k is the basic investment goods industry, c
is the large scale consumer goods industry, eg is the agri-

29
culture and small scale industries and c is the services
sector. Subscripts denote the particular sectors and absence
of subscripts indicates national parameters.
The values of parameters used in the above programming
formulation are given in Table 4 on page 27. The simplex
solution using the parameters in Table 4 indicated that with
a fixed investment of 9600 crores, an increase in national
income of 44 percent can be achieved, generating additional
employment of 14 million workers. But the solution also
indicated that 5° percent of total investment should be in
agricultural and small enterprises, with no investment in
services sector. The problem was reformulated in order to
attain a balanced growth and the second best maximum was
obtained by splitting the services sector as the capital
intensive portion and less capital intensive part. An
additional constraint was also imposed that
\ + \ S Nc2 (2-27)
which implies that employment generated in the factory
sector is less than the employment in agriculture and small
scale industries. The simplex solution with the additional
constraints is given in Table 5*
The solution in Table 5 gives a 36 percent rise in
national income and an investment of 1727 crores in agricul-

Table 5» Simplex solution
Sectors Additional Fired investment employment As estimated As in (in millions) draft outline
Rupees Percent Rupees Percent crores of total crores of total
1. Investment goods (k) 0.84 2100 22 2100 22
2. Factory consumer goods (c ) 2.30 2300 24 1525 16
3- Agriculture and small scale industries (c )
3*14 1727 18 2565 27
4. Services (c ) 2o22 1474 36 1419 25 ;
Total 14.00 9601 100 9600 100

31
ture and small scale industries and 3474 crores in the
services sector. The growth of the economy over the Third
Plan period is found to be of the order of 7 percent per
annum and the pattern of investment is broadly in line with
the draft plan. We have discussed the linear programming
framework of Mahalanobis® model developed by Uma Datta (1961)
at some length in order to show the differences between the
parameters in this program and in the empirical model to be
developed by the author later within the input-output frame
work.
Having considered the Mahalanobis (1955) planning
model and the linear programming framework of Uma Datta (1961)
using the same parameters as Mahalanobis proposed, let us
now consider some of the weaknesses of the model. Komiya
(1959) has criticized that the Mahalanobis' model seems to
neglect the demand side of economic planning. Secondly, he
shows that the increase in national income can be more than
Mahalanobis' solution and therefore, it is not an optimum
allocation of resources as claimed by him. Thirdly, the
model pays no heed to the problem of factor prices and when
possible patterns of factor prices are taken into account,
the accuracy of the parameters seems to be in doubt.
Komiya (1959) has analysed the Mahalanobis model
using the same coefficients used by Mahalanobis* The
initial national income is taken at 108,000 million rupees

32
per annum, the total investment funds at 56,000 million
rupees during the Second Five Year Plan period and the target
for new employment at 11 million jobs. The increase in
national income per year at the assumed rate of 5 percent is
nearly 29,000 million {I + 0.05) - I). The investment in
sector 1, i.e., investment goods sector, can be calculated
as 1/3 of 56,000 million or 18,500 millions of rupees.
Increase in income produced in that sector can be obtained by
dividing the investment by the capital-output ratio, i.e.,
18,500 4- 5 - 3700 million. Increase in employment in sector
1 is obtained by multiplying the labor in man years by the
increase in income or roughly 3700 x .00025 =0.9 million.
Now the planning problem of Mahalanobis is reduced to the
distributing the remaining investment fund of 37»500 million
rupees among the rest of the sectors so as to increase income
by 25,300 million rupees and provide employment to the balance
of 10.1 million people. The deterministic solution of
Mahalanobis may be obtained from the following set of equations.
The system of equations may be written as
AY = Y2 + Y3 + X4 = 253OO (2.28)
AK = a2Y2 + a3Y3 + afy = 37500 (2.29)
AN = b2Y2 + b Y + b Y = 10.1 (2.30)

33
where Y is the increase in national income of the i th
sector, AY, AK and AN the total increase in national income,
capital stock and employment, a is equal to 1/(3 defined
as the increase in net national income per unit of time to
the net investment necessary for it) and b is equal to
l/@lPi (@i being the ratio of the net investment to
corresponding increase in employment).
The above model has been criticized by Komiya (1959)
that it completely neglects the demand side. He points out
that the total demand for consumers' goods will be determined
by the marginal propensity to consume, but in the model, the
total supply of consumers' goods and the supply of each group
of consumers' goods is determined only from the considerations
of supply and the level of demand has not been taken into
account. Again, supply and demand has not been equated and
the balance of payments problem has not been taken care of
in the model. The model also pays no specific attention to
the supply and demand of intermediate products, as also
replacement of capital goods. The model can be useful for
economic planning only if all the restrictive conditions are
taken into account.
Instead of assuming 5 percent increase in national
income, Komiya maximizes the national income under the given
conditions of the supplies of investment funds and labor
force. The programming problem may be written as

34
Max AY = ï2 + Y3 + (2.31)
subject to
a2X2 + a3ï3 + a < 37,500 (2 .32)
b2Y2 + b3%3 + b < 10,100,000 (2.33)
*2 > 0, %3 & 0 Y4 > 0
where Y , a and bj_ are the same as defined in Equations 2.28
through 2.30 above. The solution suggested that all the
capital should be invested in sector 3 and about a third of
the capital is not used up, while all the labor is used up.
Since this is contrary to theoretical expectations, he changed
the weights in the maximizing function allowing for subsidies
and taxes in factor requirements. The reformulated problem
yielded a solution in which national income was higher than
that estimated by Mahalanobis from his model. Hence, Komiya
concluded that the solution emanating from the Mahalanobis
model is not "an optimum allocation of resource" as claimed
by him.
a deterministic model, a model with some choice always leads
to an optimum solution, given the set of restrictions.
Thus, Komiya (1959) showed that instead of developing

35
Macro Economic Models and the Dynamic Input-output System
Having considered some of the macro models used for
planning, it might be useful to investigate the feasibility of
casting these models in the Leontief sectoral framework.
Mathematical models may be divided into two types, viz. static
and dynamic models, dynamic models are characterized by
functional equations, which involve variables relating to
different points of time (dated variables). Static models
are the limiting cases of dynamic models, where the variables
relate to a particular point of time (undated variables).
The general equilibrium of the Lausaune school, followed by
later economists like Hicks, Samuelson, Lange and others, is
a classic example of a static mathematical model.
The static Leontief system is concerned with problems
of static comparabilities of levels of production in different
sectors of the economy, if the specified bill of goods is to
be produced. The mathematical model adopted by Leontief is
just a simplified version of the general equilibrium system.
Economists are generally concerned with models of economic
processes or activities, which throw some light in planning
long term economic development and here the dynamic version is
more useful than the static one. Therefore, we may consider
the analogy of the Leontief dynamic model with that of the
Harrod-Domar model. Leontief's dynamic system differs from

36
the static system by the introduction of stock flow
coefficients.
Let j be the output of the i th industry held by
j th industry as stock and Xj be the gross output of the j th
industry, and b indicate the size of stock of the commodi
ties required per unit of commodity j or the capital coef
ficient of commodity i in industry j. Assuming a relation
ship
Sij = blj Xj (2-34)
it follows that
Sij " "ij ij (2-35)
• •
where 3 j and Xj denote the rate of change of the variables
with respect to time.
Now the balance equations of the Leontief system may
be written as
n n . X i - D X i i - E S 1 i
= F . ( 2 . 3 6 ) j=l 1J j=l 1J 1
(i ~ I, 2, •.. f n)
where F is the final demand and other variables are as
defined earlier.
By substituting Equation 2.35 into 2.36 we get the

37
balance equation as
xi - 1 aij Xj - Z bij Xj - Pi (2-37)
(i ~ 1, 2, •t•| n)
If = 0, then we get the closed version of the
dynamic model. The dynamic Leontief model could be shown to
be analogous to the Harrod-Domar model.
The basic equation of Harrod-Domar may be written as
sYt = (2.38)
where s is the saving coefficient and is equal to 1 - a and
a is the consumption coefficient. 0 is the reciprocal of the
capital-output ratio and let 1/0 be equal to b.
Equation 2.38 may be rewritten as
(I - a) Yt = b (Yt+1 - Yt) (2.39)
The solution of this difference equation will give an
income growth equation over time.
Considering the balance Equation 2.37 of the
Leontief system and using finite differences, the equation
can be written as

38
n n X, = Z a,, X, + Z b, , AXi (2.40)
j=l 1J J j=l 1J J
(since F = 0)
n Xz - 2 a, , X, = bz , AX, (2.41) x j—2 x J J -1 J J
In the matrix notation this could be compactly
expressed as
(I - a) (X) = [b] {AXj.3 = [b] {Xt+1 - X ) (2.42)
where I is the unit matrix, [a] the matrix of input-output
coefficients, [b] the matrix of intersectoral capital-output
ratios. It could be seen that the dynamic model expressed in
Equations 2.39 has close similarity to Equation 2.42 except
for the fact that scalars have been replaced by vectors.
However, Leontief assumes matrix [a] to be technologically
fixed, while in the Harrod-Domar model, the saving ratio can
be altered to attain a certain specified rate of growth.
A Short Term Planning Model for India
Padma Desai (1961) has presented a planning model
for the Indian economy by formulating an input-output model
closed with respect to all household consumption except that
originating from government employees. The distribution of

39
consumption expenditure among the households is determined
endogenously, each group having a specific consumption
pattern.
The endogenous sectors are (i) agricultural, (ii)
manufacturing, (iii) services and (iv) transport and (v)
household sectors. There are as many household sectors as
processing sectors. Each household sector derives its
income from the corresponding processing sector. The
exogenous sectors create demand for exports, capital forma
tion, government outlays and consumption expenditure of
government employees. The household now includes wages and
salaries and distributed dividends. The matrix of inter-
sectoral transactions is presented in Table 6.
The consumption expenditure of households in each
sector is derived by subtracting taxes and savings from the
household row to ascertain the disposable income. The
disposable income is distributed according to the consump
tion expenditure of each household sector on different
commodities and services. For this purpose, a pattern of
consumer expenditure of rural, urban and mixed households is
drawn up on the basis of data available in the All India
National Sample Surveys. The items of expenditure of the
households in the different sectors are given in an abridged
form in Table ?•
The rural pattern of consumption expenditure in Table

Table 6. Intersectoral transfers of intermediate products and commodities and services for final consumption 1950-51 (in rupees billion)
Outlays in -» for pur- , chases from
Agri- Manu- Serv-cul- fac- ices ture turing
Trade Foreign and coun-t reins- tries port (exports
to)
Government
Gross capital formation
Pri- Govern-vate ment
Agriculture 11.17 12.247 .98 .613
Manufacturing 1.86 8.329 .433 1*39 2.160 3.08 2.650 I.362
Services ———— • 117 ——— .49 ———— 1.090 ——— ————
Trade and transport .632 3.969 .091 .306 .139 .625 .530 .272
Foreign countries . 158 2.834 • 021 .264 ———— • 053 ——— ——— (imports from)
Gov GriUDGUt/ mm*» mm mm mm MMMMM — — — — WEE W W
Depreciation —-— 1.161 .I83 .23 .19 allowances and retained surplus
Households 47.34 14.199 6.448 14.75 5*36 —— .816

Table 6 (Continued)
Outlays in —> Households in Total Exogenous for pur- Agri- Manu- Serv- Trade Govern- gross demand chases from* cul- fac- ices and ment output
ture turing transport
Agriculture 25.022 6.119 2.318 4.851 1.765 64.905 2.378
Manufacturing 9.723 3.072 1.587 3.641 1.363 40.650 10.615
Services 3.50 1.27
CO . 1.78 .67 9.697 1.760
Trade and transport
4.916 1.950 .944 2.145 .794 17.317 2.360
Foreign countries (imports from)
.799 .229 .101 .233 .088
Government
Households
Government
Households 88.913

42
Table 7» Pattern of consumer expenditure
Items of expenditure Percent of total expenditure bv households
Rural Urban Mixed
Agriculture 61.9 43.8 55.8
Manufacturing 28.8 37.7 31.9
Services 7.8 16.0 10.6
Trade and transport -ia _2ju6 -JUZ
Total 99.8 100.1 100.0
7 is applied to agricultural households and the urban pattern
to households in services, trade and transport and government
sectors. The manufacturing sector is divided into large scale
industries, which have the mixed pattern and small scale
industries, which is likely to have the rural pattern.
Allowing for taxes and trade margins, the expenditure of each
household is computed in terms of producers' prices.
Generalized BQflel
Consider m processing sectors and m household sectors,
each household deriving its income from the corresponding
processing sector. Let the processing sectors be identified
from 1 to m and the household sectors (m + 1) to (m + m).
The gross output is represented by q , q , q , ..., q , q ,
qm+2, •••» Qm+m* The output of each sector is distributed to

43
the m processing sectors, household sectors and to exogenous
demand.
The input-output coefficients are of the form
qij = aij qj (2-43)
(i — 1, 2, . • #, m, m+1, m+2, . •., m+m)
(j ~~ 1» 2, 3» •••» ffl)
It is also assumed that for each household sector,
the consumption expenditure is distributed in a fixed propor
tion of its earnings.
hi,m+j "" ai,m+j Qm+j (2.44)
(i — 1, 2, 3» ...» m)
(j — 1» 2, 3» ...» m)
where is the expenditure of households in the m + jth
sector on consumer goods and services of i th sector; »
the consumption coefficient, shows the amount of consumers
goods and services of the i th sector purchased with a unit
of household services in the m+j th sector and qm+j is the
earnings of the households in the m+j th sector.
«i = 9n + q12 + ... + 1im + \ (Z.W)
(i = 1, 2, 3, ..., m, m+1, m+2, ..., m+m)

44
where q is the flow from sector i to the j th processing A J
sector and a is its flow to household sectors and final
demand. Substituting yields,
m m+m ql = f aij 1j + a13 q + Xl + (2.46)
where X is imports, G government expenditure, 1 the amount
of sector i output that moves into gross capital formation.
The matrix of all intersectoral flows is represented as shown
on page 45* The matrix of input-output coefficients and
consumption coefficients from Table 6 may be represented as
shown on page 46. The upper left submatrix on page 45 contains
input coefficients a j defined in Equation 2.43. The lower
left-hand submatrix contains ,j coefficients with regard
to household sectors. As the household sector receives its
income from the corresponding processing sector only, non-
diagonal elements are zero. The upper right-hand coefficients
contain ai#m+j defined in Equation 2.44. The lower right-hand
matrix is all zero since there are no intersectoral flows.
The processed outputs q , q2, ..., qm and the house
hold incomes qm+ » m+2' %+m can be expressed as sums
of purchases by all endogenous sectors in the form
Q = A • Q + Y (2.4?)

*11 a12 *•* alm
a21 a22 a2m
aml am2 " amm
am+l,l 0 0
0 *m+2,2 ••• 0
0 0 am+m,
al,m+1 al,ra+2
2, m+1 2 , m+2
lm,m+l am,m+2
l,m+m
2, m+m
m,m+m
(2.48)
0 -F Vx
0 0 0

0.1721
0.0287
0.0000
0.0097
0.7924
0
0
0
0.3013
0.2049
0.0029
0.0975
0
0.3493
0
0
0.0000
0.0447
0.0000
0.0094
0
0
0.6649
0
0.0566
0.0803
0.0283
0.0177
0
0
0
0.8522
0.5286 0.4309 0.3316 0.3289
0.2054 0.2165 0.2461 0.2468
0.0739 0.0894 0.1210 0.1207
0.1038 0.1373 0.1464 0.1454
(2.49)
0
Os
0 0 0 0

47
where Q is the output vector of order m+m x I, Y is the
exogenous demand vector of order m+m x I, the first m
elements of Y are X + G + I , where i = 1, 2, 3» •••» m
and the remaining m elements are zero.
The solution Q, = (I - A)~* Y gives the values of the
m processed outputs and m household income as a function of
exogenous variables Y. The inverted matrix gives the output
and income requirements for any number of alternate exogenous
vectors. For example, one can find out the distribution of
processing and household sectors of the 'additional1 output
generated through a billion rupee increase in gross capital
formation. Likewise, if the plans call for a billion rupee
cut in agricultural exports and that resources can be
transferred to meet an additional final demand for services
of 1.4 billion on government account, the increase of house
hold income in services could be directly read from upper
right-hand submatrix of System 2.49. Thus, within the
framework of input-output technique, Padma Desai has provided
a short term planning model for India. Let us now consider
a long term planning model using the input-output coefficients.
A Long Term Planning Model
The long term objective of the Planning Commission is
to divide the process of development into shorter plans, like
the Five Year Plans, so that certain priorities could be set

48
up in reaching the ultimate goals. However, the process of
planning is to be considered as a whole and the objectives
of each shorter planning period are linked with a larger
perspective. Thus, the First, Second and Third Plans should
be conceived of as stages in the long term economic develop
ment of the country.
The macro models, as the Harrod-Doaar type, are
highly aggregate models and for a planner, information on
a number of small disaggregate sectors might be needed to
assess the different magnitudes of sectoral development in
the process of planning. With this end in view, Sandee
(i960) built a long term planning model for India, distin
guishing thirteen sectors. In the model, he utilized the
input-output coefficients of the inter-industry table for
1953-54 with certain modifications, wherever necessary.
Taking into account the general principles of
aggregation, discussed elsewhere, Sandee (I960) adopted
mostly the input-output coefficients from the 1951-52 and
1953-54 inter-industry tables for India. Wherever the
coefficients are known to change considerably, he modified
those coefficients to account for the possible changes. For
example, there was reason to assume that electricity consump
tion per unit of output was expected to go up by one hundred
and fifty-two percent during the Second Five Year Plan. He
foresaw the trend to continue in the Third and Fourth Plans.

>19
In order to account for these changes, he multiplied the
input-output coefficients for electricity by four, or in
other words, the electricity input coefficients were taken
four times higher than given in the table for 1953-54.
Similar adjustments were made for the steel sector also.
In the model, he identified the following sectors:
21. Agriculture (including plantations, fishing and small scale food industries
22. Large scale food manufacturing
23. Steel industry
24. Electrical power industry (both thermal and hydro)
25. Coal mining
26. Fertilizer industry (nitrogenous fertilizer only)
27. Transport
28. Heavy engineering
29. Other equipment industry
30. Other large scale industries (including other mining)
31• Construction (including the cement and small scale building materials industries)
32. Small scale industries
33. Housing
There is no separate sector as fertilizer industry
(Sector 26) in the inter-industry table for India. It was
built up from the project reports for new fertilizer plants.
The first twelve balance equations are given in Table 8. No
balance equation was set up for x , since we can treat

50
Table 8. Balance equations
%2i - O.W*22
%22 " 0.06x22
" O.OlXgy * O. OZgg 0
x2l* " O.OIX22 + O.O8X2j + 0.0$X2^ + O.OTxgg; * 0.15x26 + 0.02Xgy + 0.02X20 + 0
X25 • O.IQX23 + O.lOXg + 0.05x2 + 0.0?x26 + O.OjXg + 0.05xgg + 0
x26 "
X27 - O.22X23 + °*°4x26 + 0#01x27 + 0
x28 "
x29 "
x^o * O.OlyCgg + O.2OX23 * 0ellx2lt + 0e°7x25 + 0,1®x26 + 0#1^X27 + °*1^X28 + °*
+ 0,
X31
X32

+ 0.19x30 + 0,01x31 + O.C£x32 + c21 + (2a-l)
+ 0.02k30 + c22 + e22 + ngg (2a«2)
+ O.lSxgp + O.Oitfc * °*°7x31 + 0e01x32 * e23 + n23 (2a»3)
+ 0.02x29 + O.Olyc Q + 0.01x32 + 300 (2a*k)
+ O.OlXgp + 0.01x o + O.Olx + (2a«£)
e26 +a26 + *26-21 (2a,6)
+ 0.01x2 + O.Olx Q + 0.0?x31 + (2a»7)
+ i28 +e28 * n28 (2a,8)
+ 0.03Xg + ±29 + e29 + °29 (2**9)
+ O.lOxgp + 0.15x30 + 0.11x31 + 0.22x32 + (2a*10)
0.13x^ + i31 + n31 (2a*ll)
0.06X31 + O.Olgc^ + c 2 + n^. (2a»12)

51
X33 = c33 an<i thus save one equation.
The first twelve equations described in Table 8 are
of the Leontief type. Equation 2a.13 explains the rise in
agricultural output consequent on the increase in fertilizer
applied (*25.21^» irrigation projects executed (131.21)
agricultural extension (i^). Thus the equation for agri
culture was derived from extraneous information on the
possible course of development. The need for such a special
treatment for the agricultural sector according to Sandee was
because there was no fixed relation between the inputs and
agricultural output. Another feature of the equation for
agriculture is the inclusion of the effects of agricultural
extension. Sandee included the extension work as the
'stimulant* for agricultural production of about 3*3 million
tons annually, which is not accounted for in the increases as
a result of fertilizer or irrigation. In functional form,
the thirteenth equation for agriculture may be written as
X21 = f(*26*21' i31*21» *34) (2a.l3)
In addition to the thirteen equations, the following
three equations are specified in the model to describe invest
ment, exports and consumption.
1 i28 + i29 + i31 + i34 + .JL nj (2a.14)

52
«21 * «22 + «23 * e26 + e28 + e29 + e30 = 0 (2a'15)
C + C£2 Cgy c^2 (2à.l6)
where I denotes total investment and nj refers to rise in
stocks in the sectors. Equation 2a.15 assures that the
balance of visible trade between I960 and 1970 will be more
or less similar. Equation 2a.16 defines the total consumption
of goods, transport and housing services C.
Constraints
Several constraints were imposed to regulate the
export surplus. The constraints on export surpluses are
1. Agricultural export surplus e^ < 94
2. Food export surplus egg 5 177
3» Steel export surplus ~e23 — 0.25 + 3°
4. Fertilizer export surplus ~e26 — 350
5* Heavy engineering export surplus -e2g i 0.25 x2g
6. Other equipment egg < 92
7« Other large scale manufacturing e^0 < 0
For illustration, we will indicate as to how the
constraint on agricultural export surplus was established.

53
An upper limit to net exports was set by the elimination of
imports of food grains and a considerable improvement in the
balance of cotton exports and imports. An improvement by
rupees 94 crores seemed the maximum that could be expected.
Similarly, the upper limit to manufactured food was established
by estimating an increase of 20 percent or 27 crores in tea
exports, an improvement in the sugar balance by 5° crores and
increase in oil exports to the tune of 100 crores, totaling
177 crores. In the same manner, constraints on other sectors
were built up based on possible trends and other guesses on
the course of development. The lower constraints on exports
were constructed on the estimated world total supply and the
quantities that could be purchased by India without upsetting
the world market•
Equation 2a.16 defined welfare as the sum of six
types of consumption viz. agriculture, large scale food
manufacturing, transport, large scale industries, construction
of residential property and small scale industries. As in the
case of exports, lower and upper limits were built up for
consumption also. The lower and upper constraints were set
at 13 percent of I960 consumption above and below Engel curves
for each commodity.
Besides constraints on exports and consumption,
constraints were also built up for investment and agricultural
stimulants. The constraint on investment was worked out based

54
on stock-flow coefficients. By the conventional procedure,
total investment has been linked to the total income and the
marginal propensity to save was estimated at 24.5 percent.
Since the total material consumption c is taken as given in
the model, it was estimated that for every crore of rupees
increase in consumption, investment rises by 0.245/1 - 0.245
= O.32. The constraint for investment is, therefore, stated
as
I = .32c , I > 0
Output-investment constraints (n) were set up for a
number of individual sectors, as agriculture, large scale
food, steel, fertilizer, transport, heavy engineering, other
engineering and other large scale manufacturing. Investment
in i960 was linked with the growth rate of output in that
year and the assumption of a linear trend in all investment
flows over time was introduced. For example, the rate of
growth of food manufacturing was put at rupees 25 crores per
annum and the total increase in output from i960 to 1970
should be at least 5 times this amount, viz. 125 crores of
rupees. Instead of a constraint on the output of agriculture,
a lower limit on irrigation was prescribed, which cannot fall
below zero.
The model enables us to maximize a linear function of
the variables in the 16 equations. With the help of constraints

55
the welfare function, viz.. consumption is maximized by the
linear programming technique. The levels of production,
consumption and exports are calculated from the solution.
In the model, the level of material consumption in
1970 is used as the only criterion. As investment and welfare
go together, maximizing consumption also indirectly amounts
to maximizing investment. Further, it has been assumed in
the model that savings would continue to restrict investment
even after 1970 and so the target function was not modified.
Sandee has also stated that if employment had also been taken
into account, the plan would have been different. It is
possible that some material welfare would be sacrificed to
ensure more employment. Thus, using input-output coefficients
for 1953-54 for the most part and building additional con
straints on exports, consumption and investment, Sandee has
projected the optimum output, consumption, investment and
exports for 1970.
Egpnqrcug development sM j&S 9DSH model
In the open models, generally the household sector
is treated as exogenous. While discussing the paper of Fox
and Sengupta (1961), Richard Day* has suggested in a private
communication the inclusion of household sector as endogenous
*Day, Richard, United States Department of Agriculture, Washington, D.C. Comments on Fox and Sengupta*s paper on uses of the input-output and related techniques in partial analysis. Private communication. 1962.

56
to the model, similar to the approach of Padma Desai (1961),
discussed earlier. By using the aggregated tables provided
by Fox and Sengupta (1961), Day has computed that in the
United States, a 10 percent increase in deliveries to final
demand in 194? of the industrial sector would call for an
increase of 4-1/2 percent in agricultural output. This
contrasts with a corresponding increase of 0.6 percent when
the households are exogenous. Similarly, an increase of 10
percent to final demand of the agriculture complex would call
for an increase of nearly 6 percent in the output of all other
industries, as against 0.9 percent when households are exo
genous. By this illustration, he demonstrates how the specifi
cation error can arise when important sectors are omitted from
the Leontief model.
It is also pointed out by Day that the inclusion of
the household sector as a part of the structure of the input-
output model generates substantial demand for agricultural
products to meet increased final deliveries to the industrial
sector for investment purposes. This suggests that economic
development of agriculture may be an important correlative
for any industrial development program. Having considered
different macro models, we proceed to study the mathematical
structure and simple numerical applications of the input-
output model.

57
THE LEONTIEF OB INPUT-OUTPUT SYSTEM
In describing the input-output analysis, Wassily
Leontief (1951) admits that the input-output approach to the
empirical analysis of inter-industrial relationships repre
sents an admittedly crude attempt to combine facts and theory
in the study of the structure and operation of a modern
economy. Any economy can be described as a system of mutually
inter-related industries or interdependent economic activities.
The inter-relation consists in the steady stream of goods
which links directly or indirectly all the sectors of the
economy to each other. The inputs of one industry are the
outputs of another and vice versa. These flows can be
observed and described in quantitative terms.
The Leontief system may be an open system of linear
equations describing the flows of commodities between the
different sectors of an economy or a closed system. In the
open system, household consumption of goods and services,
capital formation, government, foreign trade and stocks form
the components of final demand or the autonomous sectors.
If all the sectors are both producers and consumers, the
system is described as a closed one. Let us now consider
the quantitative illustration of an open static Leontief
system.

58
Mathematical Model
The open Leontief system describes the flow of
commodities between the different sectors of an economy.
These sectors are divided into two types. One is known as
the intermediate sectors and includes those whose demand for
the commodities of other sectors arises directly from their
own decisions to produce goods. The other kind# namely, the
final demand sectors are treated as autonomous sectors. The
flow of goods to the intermediate and final demand sectors
may be described in the form of equations as
X11 * =12 * ••• + xlj + "• + xln + Y1 = X1
X21 + x22 + *•* + x2j + + x2n + Y2 X2
(3.1)
xnl + xn2 + ••• + xnj + ••• + x^ + %n
where Xjj is the amount of output of sector i purchased by
sector j, is the final demand for product i, and X^ is the
total output of sector i and Y^ final demand for the i th
producing sector.
The intersectoral flows, x^j's, may be in physical
quantities or in value terms. Again, some transaction matrices

59
are prepared taking into account the producers' prices, while
others adopt market prices and thus, the valuational aspect
varies with the conceptual framework and the nature of
availability of data in the different countries. The system
of equations in 3.1 can be represented in matrix form as
Z Î + Ï = x (3.2)
where Z is matrix of intersector flows, I is a column vector
of n rows each element of which is one, Y is a vector of
final demands, and X is a vector of total outputs.
Equation 3.1 may be rewritten in terms of final
demand as (3.3)
*1 ~ X11 " x12 xlj xln = Y1
~x21 + X2 " x22 " " x2j ~ **• " x2n ~ Y2
"xnl " 2 xnj - + %nn " xnn " Yn
The system in 3*3 may be written in matrix notation as
X - Z ï = Y (3.4)
In 3.3 when i equals j is non zero, the total output
is described as gross output and if i equals j is zero, the

60
output is a net one.
The intersectoral flows, depicted either in physical
or in value terms, describe the structural interdependence.
Leontief, in his model, makes the simple assumption of fixed
technical coefficients. The technical or the input-output
coefficients a^j's denote the amount of output of the i th
sector required to produce one unit of output of the j th
sector. Assuming linear relationship between the purchases
of the endogenous sectors and the total output, the input-
output coefficient may be obtained as
aij = -èj- (3-5)
where a^ is the technical coefficient in the i th row and
j th column, x^ is the output of sector i used in sector j,
and Xj is the total value of the j th producing sector's
output.
From 3.5, it follows
Xij ~ aij Xj (3e6)
Equation 3*6 implies that the total amount of output
used by sector j from sector i is equal to the amount of
sector i output used per unit of output from sector j.
Substituting this relationship in the system of Equations 3»3

61
and considering in net terms we get
*1 " a12X2 ~ aljXJ # • • Y 1
"a21Xl * X2 - ... - a2jXj - ... - a2nxn ~ Ya
(3.7)
#
#
"anlXl " an2X2 anjXj * = Yn
The system 3.7 may be expressed in matrix notation as
where A is the matrix of technical coefficients, X is the
total outputs and Y is the vector of final demands.
Aitkin (1951) has shown that the system 3.7 of n
linear equations with n unknowns can have a general solution
only if the matrix of coefficients in the lefthand member is
nonsingular. Hawkins and Simon (1949) have proved that the
system of nonhomogeneous equations can have economic meaning
only if X^'s are positive and a necessary and sufficient
condition for all X^'s to be positive is that all the
principal minors of matrix A be positive.
The final demand for the i th commodity Y% is
established by the relationship from 3*7 as
(I - A)X = Y (3-8)

62
= xi - aij Xj (3-9)
where Y^ is the total autonomous demands from sector i and
Xj_ is the net output of sector i, aij is the input-output
coefficients and Xj is the total output of sector j.
Given the final bill of goods Yj, Y2, ...» Yn and the
constant input-output relationship a^j's, the system 3*7 can
be solved for the output levels X^, X2, «.., X^ required to
meet the specified final bill of goods. The solution is
given by
X = (I - A)"1 Y (3.10)
or X = BY (3.11)
where I is an identity matrix, A the matrix of input-output
coefficients, Y is the final demand vector, X is the vector
of outputs and B is the (I - A)""*.
Expressing outputs as a function of final demands
yields the system of equations 3.12 shown on page 63* The
bjLj's are known as the interdependence coefficients. Inter
dependence coefficients describe the required change in the
(gross or) net output of industry i for a unit change in the
amount of goods delivered to final demand by industry j.
There are several methods by which the matrix
(I - A)"1 may be computed. Heady (1958) suggests the Grout

63
Vl + W2+'"'+ Vj + ""'+^n =
b21Yl + b22Y2 + ••• + b2jYj + ••• + b2nYn = X2
(3.12)
Wl + W2 + "" + bnj?j + + Vn = ^n
method, while others use the Doolittle method described by
Anderson and Bancroft (1952)• A simple method of power series
expansion has been suggested by Waugh (1950) for calculating
an approximate inverse. The progression
1 + a + a2 + a3 + a* +
has infinite number of terms, but if *a* is less than 1, then
the terms converge so fast that there is a limit to the value
of progression. By adding more terms, one can make it closer
to 1/1-a. Similarly, the matrix (I - A)"1 may be calculated
by the series expansion, if the sum of the numbers in each
column is less than or equal to one. To check computational
accuracy, one can compute the product (I - A)(I - A)"1. If
the computations are accurate, the product will be equal to
the identity matrix or close to it. The errors by the method
of series expansion have been found to be extremely small by
Waugh (1950) even in the case of large sized matrices.

64
Price equilibrium
From Equation 3.6 the quantity of output needed from
the first sector to support a given level of activity of the
j th sector is given by a^j. If this quantity is multiplied
by p^, the price of the first sector's output, we get the
monetary value of output required from the first sector by
the j th sector for its level of activity. This can be
represented in equational form as
(&ljXj)pi + (a2jXj)p2 + ... + (anjXj)pn + Vj = Xjpj (3.13)
where a^j's are technical coefficients and p^ is the price of
i th sector's output.
System 3»13 may be written in matrix form as
XA'p + V = Xp (3-14)
where X is the diagonal matrix of production levels, A' is
the transpose of the matrix A, V is the column vector of
payments to autonomous sectors and p is the column vector of
prices for the intermediate sectors. The system 3*14 can be
solved for prices as
p = [(I - A')"1] X ~1 V (3.15)
It can be seen from Equation 3*15 that the same
inverse matrix that represents a general solution for produc
tion equilibrium becomes in its transpose form a solution to

65
problems of price equilibrium. The column vector V may be
comparable to the factor payment side of the gross national
product.
lbs dynamic system
The incorporation of stocks and flows into the basic
input-output system transforms it also into a dynamic theory,
which refers not only to the inter-relationships between the
different parts of the economic system at any given point of
time, but also formulates its 'law of change' over time. In
the original static equation, all additions to stocks have
been treated as parts of the autonomous final demand. The
dynamic formulation introduces another set of structural
equations in which the stock is related to output Xj.
The relationship may be expressed as
Sij = bld X. (j = 1, 2, ..., n) (3.16)
where the constant b^j denotes the size of stock of
commodities required per unit of the output of commodity j
or it can be referred to as the capital coefficient of
commodity i in industry j.
The rates of change in output Xj and the corresponding
rate of change of stocks required to produce these outputs may
be obtained by differentiating Equation 3*16 with respect to
time as

66
Sij = bij xj (j = 1, 2, ..., n) (3-17)
The dynamic balance equation can now be written as
n n X, - £ a,. X. - E b,, X. = Y. (3.18) J AJ J j—2 1J J J
(j ~ 1» 2, ..., n)
The dynamic equation differs from the static equation #
in that there is an additional term bjj Xj, which connotes
the 'investment demand' for the products of industry i.
The solution of the system 3*18 of linear differential
equations describes the 'law of growth' of individual outputs.
The solution may be written as
n , Xj = E exit + Li (Y1# Y£, ..., Yn) (3-19)
j-i
where Xj is the output of the j th sector, c± and are
the coefficients and roots of the auxiliary equation and
is the linear function of final demands.
In numerical form, the solution aids the policy maker
in explaining the behavior of the economic system over time.
The solution further shows that the growth of outputs follows
an exponential path.

67
A Numerical Example
This section provides a numerical illustration of
the mathematical model described earlier. As detailed
structural analysis of the Indian economy is described in
the empirical section, a simple three sector model is used
here for illustration.
A three sector transaction matrix Table 9 is an oversimplified, aggregated version of
the Indian economy for the year 1949-50 described by Uma
Datta (1957)» The economy is divided into four sectors
viz.. agriculture, industry, services and households.
Agriculture (X^), industry (X2) and services (X^) are
endogenous, while households (Y) are exogenous.
Row 1 in Table 9 shows that the gross output of
agriculture was 58 thousand millions of rupees. The internal
purchase by the agriculture sector was 9«77 thousand million
rupees. The consumption of seeds for further production,
feed for livestock etc. are some of the demands from its own
sector. Row 1 Column 2 describes the purchases of industries
from agriculture, which amounted to 8.32 thousand million
rupees. Agricultural outputs, as cotton, oilseeds, etc.
are purchased by the industrial sectors for their output.
The purchases of the services sector from agriculture sector
was 1.40 thousand million rupees and is shown in Row 1

68
Table 9. Transaction matrix (in thousand million rupees)
Producing sectors Agri
culture 1
Industry
2
Services
3
Household 4
Total output
9-77 8.32 1.40 38.64 58.13
2.08 6.15 2.11 26.75 37*08
SL2Z 5*21 mz 29.54 39*74
12.62 20.46 5*98
léxéé 32.76 9m3
58.13 37*08 38.74 133.95
1. Agriculture
2. Industry
3* Services
Total input
Total domestic product or value added
Total product
Column 3* The households purchased from the agricultural
sectors 38*64 thousand million worth of produce. The last
column in Row 1 shows the total gross output of the
agricultural sector. Similarly, the allocation of the out
puts of industries and services are described in Rows 3 and
4 respectively.
As the rows describe the outputs of the sectors,
the columns describe the cost structure of the different
sectors. Column 1 describes the input of agriculture,
industry and services in the agriculture sector. The total
input in agriculture is shown at the bottom and it amounted

69
to 12.62 thousand million rupees. Or in other words, with an
input of 12.62 thousand millions, agricultural output was
68.13 thousand million rupees. The balance of 45*51 thousand
million is the value added or the domestic product. In input-
output terminology, it is the primary inputs, as labor costs,
taxes, etc. In national income accounting, gross domestic
product is treated as returns to factors. For example, the
households provide labor for the different industrial
activities and the government provides services. The
returns to labor (factor) are in the form of wages and to the
government returns are in the form of taxes. Columns 2 and
3 describe the cost structure of the industry and services
sectors respectively. Column 4 shows the cost structure
of the households. It will be seen from Table 9 that the
total cost of households equals the value added or the
returns to factors employed.
Bmut-owtnut coefficients
The input-output coefficient a^j describes the
value of output of the i th producing sector required per
rupee worth of output of the j th consuming sector. The
input-output coefficients can be computed from Table 9 by
applying the relationship given in Equation 3.5-
The matrix of input-output coefficients is

70
.1681 2244 .0361
A = .0358 1659 0545 ( 3 - 2 0 )
0013 1605 0638
The matrix of input coefficients is computed by
dividing the elements in each of the columns in Table 9 with
its corresponding gross output. For example, all the elements
in Column 1 were divided by the total output for agriculture,
the elements in Column 2 by the total output for industries
and the elements in Column 3 by the total output for
services. The element in Row 1 Column 1 in Equation 3*20 is
.1681 and this is obtained as 9*77 / 58.13. Similarly, the
element in Row 2 Column 3 is .0545 and is computed as
2.11 / 38.74. In the same manner all the input coefficients
are calculated and presented as matrix A.
the requirements per rupee worth of output. For one rupee
worth of agricultural output .17 rupee of internal purchases
.04 rupee worth of industrial purchases and .001 rupee worth
services were required. The per unit cost structure of the
industrial and services sectors are indicated in Columns 2
and 3 respectively of matrix A in System 3.20.
interdependence coefficients
Earlier in the section interdependence coefficients
bij's were defined as the amount by which output of the i th
The input-output coefficients may be interpreted as

71
I - A"1 = B =
producing sector will increase for each rupee increase in
the final demand for the product of the j th sector. The
matrix of interdependence coefficients (B) is obtained by
computing the (I - A)~ . The inverse for the matrix in
System 3.20 is given below:
1.21683 0.34021 0.06666
0.05295 I.22723 0.07343 (3.21)
0.01072 0.21084 1.08084
Expressing output levels as a function of final
demands yields the relation similar to Equation 3-12. If
we specify the final demands shown in Column 4 of Table 9»
the output levels will be as shown in Column 5 of the table.
The system may be written as (3.22)
X1 = 1.21683x38.64+.34021x26.75+.06666x29.54 = 58.13
X2 = .05295x38.64 + 1.227 23x26.75 +•07 343x29.54 = 37-08
X3 = .01072x38.64+.21084x26.75+ 1.08084x29.54 = 38.74
Application fi£ interdependence coefficients
Let us consider the economy described in Table 9«
Also assume that the planning authority in India estimates
certain increases in the final uses, say, in a planning period
of five years. The planners are now interested in knowing the

72
output composition of different sectors required to support
the increased final bill of goods. In such a situation the
interdependence coefficients are useful.
For illustration, assume that the planners estimate
the following increases in the final demands taking into
account per capita income, population increases, foreign
trade, et cetera:
1. Agriculture 10 percent
2. Industry 30 percent
3» Services 10 percent
The increased values of final products to be made
available for household consumption computed from Table 9 are
given below:
1. Agriculture 42.50 thousand crore of rupees
2. Industry 34.78 thousand crore of rupees
3« Services 32.49 thousand crore of rupees
The total outputs needed to support these increased
final demands can be computed by applying the system of
equations described in 3*12. The total outputs are calculated
as (3.23)
X1 = 1.21683 x 42.50 + 0.34021 x 34.78 + 0.06666 x 32.49 = 65.71
X2 = 0.05295 x 42.50 + 1.22723 x 34.78 + 0.07343 x 32.49 = 47.32
X3 = 0.01072 x 42.50 + 0.21084 x 34.78 + 1.08084x 32.49 = 42.91

73
From the system of Equations 3»23» the increased total
gross outputs needed to support the increases in final demands
are obtained. The new output of agriculture has to be 65*71
thousand million rupees, industry has to produce 47*32
thousand million rupees worth and services has to reach 42.91
thousand million rupees.
It will be interesting to know the extent of inter
mediate uses consequent on the increased total outputs, for
a planner is primarily interested in knowing the capacity
requirements and whether the available capacities can meet
the increased outputs. The estimated or increased outputs,
intermediate uses and total output are described in Table 10.
From Table 10, it will be seen that for the desired
increase of 10 percent (percentages shown in parentheses) in
final demands for agriculture, an increase of 19.09 percent
or 23.21 thousand million rupee worth of intermediate products
have to be produced. The estimated increase in total output
of agriculture is 13.04 percent. In the case of industry,
for an increase of 30 percent of final demand, an increase of
21.28 percent in the intermediate uses is required and 27.62
percent increase in the total output is necessary. For the
increase of 10 percent in services sector, 14.25 percent
increase in intermediate uses and 10.76 percent increase in
total demand are needed. To meet the specified increases of
final demand the total gross output will have to be increased

Table 10. Changes in total output and intermediate uses (in thousand million rupees)
Product Intermediate uses Final flgfflanfl îfttal OUtBUt originating from Given Estimated Given Desired Given Estimated
1. Agriculture 19.49 23.21 38.64 42.50 58.13 65.71
(19.09)* (10.00) (13-04)
2. Industry- 10.34 12.54 26.75 34.78 37.08 47.32
(21.28) (30.00) (27.62)
3- Services 9.12 10.42 29.54 32.49 38.74 42.91
(14.25) (10.00) (10.76)
4. Total 133.95 155.94
(16.42)
^Figures shown in parentheses are percentages.

75
by 16.42 percent. Thus, given the specified final demands,
the interdependence coefficients are useful for finding out
the extent of demands of intermediate sectors and also the
total output levels required to support the desired final
demands.
Assumptions of the Input-output Model
Several restrictive assumptions are made mainly to
facilitate empirical applications. One of the important
assumptions is that of constant returns to scale. It is
often contended that functions are more complex than simple
proportions in describing the production process. For
example, in industries like railways and power at least
one large installation must be provided before any output
appears. But, the assumption of constant returns to scale
is made for computational simplicity.
A second assumption is that there is no substitution
among inputs. Gathering of data is simpler if an industry
is regarded as a single process with fixed input coefficients.
Samuelson (1957) has proved that absence of substitution
need not be assumed in an open model, if there is just one
scarce resource. Though the production functions allow
substitution among inputs, it does not take place, no matter
how the final bill of goods is changed, because the achieve
ment of efficiency in production always leads to a unique

76
set of input ratios for each industry. In actual situations,
there is more than one scarce resource and hence, the
assumption is being made again for simplicity and empirical
expediency.
Another assumption is made about the absence of joint
products, i.e., every process produces only one output. If
a process produces two or more outputs in constant propor
tions, as hides and meat for example, then a single new output
for the process could be defined which will meet the assump
tion. In contrast, in linear programming, it is taken that a
process can produce several outputs.
An additional assumption is made in static models
that only current flows of inputs and outputs are important.
The problems of capacity and capital are not taken into
account. In the dynamic models this aspect is taken care of
by the inclusion of stock-flow coefficients.
Earlier in the section, we considered a four sector
model in which the different industries of the Indian economy
were aggregated into three sectors, besides the exogenous
household sector. Ir. the input-output analysis, the solution
to any analysis depends on the nature of aggregation. Since
aggregation of sectors is crucial to the model, we shall
consider the different aspects of aggregation in the next
section.

77
AGGREGATION AND SECTORAL CLASSIFICATION
The Walrasian general equilibrium does not consider
aggregation of industries or products and one must, therefore,
assume that each product and factor be assigned a set of
equations. If, for example, there were 1000 products and 100
factors, there would be 2199 equations and unknowns requiring
solution. Further, the classical general equilibrium theories
were not concerned with the applications of their system for
solutions to real problems. But, if one attempts to apply
such system of equations, the magnitude of the number of
equations and unknowns has to be within manageable proportions.
Thus, one is left with one of two alternatives, either the
data has to be aggregated, in which some information is bound
to be lost, or to retain the detailed information at the
expense of inability to solve the large system of equations.
Problem of Aggregation
In the macro economic models, considered earlier,
relations are generally established among the few large
aggregates, as national income, total investment, total
consumption, et cetera of the economy. These aggregate models
are completely devoid of sectoral details and consequently,
no economically meaningful conclusions could be drawn from the
heterogeneous aggregated data. In these models, the problem

78
of aggregation is mostly ignored and the conclusions may,
therefore, vary with changes in the composition of the
aggregates.
The aggregation process props up in the input-output
analysis essentially to reduce the number of equations and
unknowns. Balderston and Whitin (1954) have observed that
input-output model employing systems of simultaneous equations
lends itself to the handling of more variables than multiple
correlation analysis, thus facilitating the inclusion of
detail on industry inputs and outputs. However, when simul
taneous inter-relationships are taken into account, consider
able detail is lost. Leontief (1951) recognized this fact
and has stated that "the practical choice is not between
aggregation and non-aggregation, but rather between a higher
and lower degree of aggregation."
The problem of aggregation in macro models has been
discussed extensively by Dresch (1938), Klein (1946), May
(1947), Shou Shan Pu (1946) and Fisher (1958), to mention
only a few. One of the criteria set down by Klein (1946)
stipulates that if functional relations exist for input and
output of an individual firm, there should also exist func
tional relations that connect aggregate output and input for
the economy or parts of it. Similarly, the marginal
productivities of the firm and the aggregated industry should
be proportional under perfect competition. As the input-

79
output model does not consider the marginal productivities,
the second criterion is applicable only to general equilibrium
situations of the Walrasian type.
Some of the difficulties that are encountered in the
aggregation process of the input-output models are of a
mathematical nature and others relate to the classification
of industries and interpreting solutions. For the input-
output model to be of practical use in planning economic
programs, it is essential to formulate criteria based on
sound theoretical principles for aggregating the available
data.
In the input-output model, the total output of industry
i can be expressed as
n ^ Bjj Yj = (i = 1, 2, ..., n) (4.1)
where B is the (I - A)'"*" and Yj is the final demand and
is the output.
Let us now assume that we aggregate some industries
and denote the aggregate by I. The new sector may be written
as
XT = Z X, (4.2) x iel 1
where e denotes "is an element of the set." The linear equa-

80
tions for the new system can be stated as
XI " 2 XIJ - YI J
(I = 1, 2 » • • • » m) (4.3)
or XI " j aIJ XI Y I
Solving for aggregated outputs yields
(4.4)
where AJJ is the amount of the I th industry's output required
for a unit of final demand for good J.
fication of n industries remain ungrouped in the second
classification of m industries also. It will be possible to
find the levels of output h for changes in the demand for g
from Equations 4.1 and 4.4, and it can be seen that the solu
tions will differ in both the cases. Therefore, it is
difficult to find out the type of aggregation that would
provide the 'correct solution'.
solutions, a careful study of the objective of the model is
necessary. An aggregation admirably suited for a particular
study may be totally useless for another purpose. An input-
output table should be detailed as far as possible. For
example, an increased level of activity in iron and steel
Now assume some industries g, h in the first classi-
As different methods of aggregation yield different

81
industry might necessitate increased production of coal. If
coal is not shown separately in the input-output table, the
difficulty of increasing coal proportionate to the steel
production would be hidden in some aggregate fuel sector,
which may even result in attempting an impossible attainment.
Thus, aggregation often hides bottlenecks and shortages.
Some suggest that for purposes of aggregation, the
various components to be aggregated should form a constant
proportion of the aggregate. Proportionality of prices is
not a sufficient condition for aggregation, unless outputs
also vary proportionately. As demand elasticities are likely
to vary, it is not likely that the total value of the products
will also vary proportionately concomittant with proportionate
price changes.
According to Samuelson (1948), a number of variables
may be treated as a single variable when they are substi-
tutable, i.e., when each has the same effect upon all the
economic functions. Perfect substitution is rare, but by
relaxation of rigid standards they can be approximated.
Commodities which are close substitutes on the output side
may not be substitutes in the input side also. Cotton and
rayon are good substitutes from the consumers' point of view,
but the raw materials making the inputs are altogether differ
ent. Normally, these two would be aggregated, but if, say,
rayon is imported and if one of the aims of study is concerned
82
with the nature of import, then it would be desirable to
keep the sectors separate. As indicated earlier, one of the
important aspects of aggregation is to ascertain in advance
the uses to which the aggregated table is to be put and to
align the data to meet the desired objectives.
Some commodities which are substitutes in certain
activities may not at all be substitutes in other activities.
Goal and oil may be substitutes in household, but for the
production of steel, they are not.
Balderston and Whitin (1954) have clearly brought
out the degree of feasibility of aggregated solutions.
Assume that there exists perfect substitutability between components of each aggregate and also assume lack of substitutability between aggregates. In so far as the former assumption exagerates the degree of substitutability, solutions might be thought feasible which were not economically attainable# The latter assumption, in underestimating the degree of substitutability, may indicate that some solutions are not feasible which in fact are economically attainable. Thus, highly aggregative systems are likely to overestimate the attainable levels of production and consumption. On the other hand, systems involving much less aggregation are likely to underestimate the potentialities of the economy.
Another criterion for aggregation suggested by
Samuelson (1948) is complementarity, i.e., commodities which
have an invariant relationship to each other. Industries
which are vertically integrated, as metal wiring, metal
fabricating and metal products industries might be grouped
into a single sector. But one difficulty in such a grouping

83
is that prices are likely to fluctuate disproportionately and
to carry it through the component parts of the aggregated
sector is quite tedious. Hicks (1946) has stipulated the
conditions under which the price movements may be in
opposite directions in certain complementary goods. In
this case, the total value components may not be proportional.
It is often suggested that aggregation of sectors
with similar input coefficients could be effected. In order
to ascertain the conditions under which two sectors could be
grouped, let us consider the input coefficients of the
aggregated sector. Denote the grouped sector as
x(m+n) ~ ^m %n
Xi (m+n) _ xim * xin i(m+n) = X(m+n) * + %
(4.5)
„ alm * ain Xn „ / V _ ( \
X. + Xn "ixm + Xn J "W + /
a.
- wm aim + wn ain> "here w %m
%m + %n
Chenery and Clark (1959) have stated that if all the input
coefficients a1(m+n) of the grouped sector are unaffected
by changes in the output levels X^ and Xn, the demands of
the consolidated sector for the output of other sectors will

84
be equal to the sum of the demands of its components. If aim
equals ain, i.e., input coefficients are similar, then no
change in the weights resulting from changes in the proportions
in which Xm and Xn are demanded will affect the aggregate
coefficient.
The main aim of aggregation is to produce the minimum
average error for all the production totals of the solution.
When the objectives of the analysis is specified in advance,
the importance of possible errors can be estimated better
and the bases for aggregation could be adjusted according
to the problem on hand.
Conceptual Background for the Indian Inter-industry Table
The picture of inter-industrial relationships may be
considered as an extension of accounting of national product.
The national product could be considered either in terms of
market values (viz., supply prices of producers plus the
indirect or commodity taxes net of subsidies) or in terms of
supply or producers' prices. In an input-output table, the
total delivery of a domestic sector should tally with some
prior estimate reckoned at producers' prices. Imports have
to be classified according to the flowing sectors and not in
respect of the ultimate utilizers. As the input-output table
constructed by the Indian Statistical Institutes for the
year 1953-54 (Appendix A) is on the basis of market value,

85
the appropriate duties also have to be deducted. The
conceptual framework for the table provided by the Indian
Statistical Institute (1957) can be schematically represented
in accounting principles as
Product at - Product at + taxes market price supply price
= sum of deliveries + exports - imports
= all material inputs (domestic and foreign)
+ wages + rents + entrepreneurial earnings
An inter-industry table is similar to a double entry
bookkeeping scheme applied to the several sectors of a nation's
economy. The column of an activity gives the entries on the
debit or cost side of ordinary accounts. In constructing a
table, especially for less developed economies, the data
problems are considerable and several approximations have to
be made in the process of construction. The broad classifica
tion may be as producing sectors and consuming sectors. The
sectoral classification and the problem of aggregation is
crucial in an inter-industry table. As regards the consuming
sectors, non-profit organizations like hospitals, educational
institutions, and research institutions have not been
included either in households or in government consumption,
but they have been treated along with services. Defense

86
capital outlay has been considered as an element of government
consumption. Current outlays, as road maintenance, et cetera,
though forming part of government consumption, cannot be
normally separated out from the structure of the economy.
Fixed capital formation is also taken as a non-
producing sector. It is difficult to distinguish between
current, operating and resting accounts in a two way table
and therefore, transactions in building capital have been
included in the receiving sector.
The producing sectors or activities or businesses can
be divided into any arbitrary variety of groups. The sectors
are composed of a number of establishments and the nature of
each establishment is determined by its 1 characteristic out
put*. In practice, the nature of data and the general
structural characteristics dictate the demarcation of the
sectors. Theoretically, sound grouping of the sectors will
be to aggregate sectors with identical cost structure or to
group sectors with similar distribution of outputs between
sectors. In the Indian table, the former criterion was the
guiding factor.
Three kinds of production sectors have been distin
guished in the table. They are (a) commodity producing
sectors, (b) distributive trades (wholesale and retail)
and (c) transport and services, including ownership and upkeep
of residential property. Commodity producing sectors were

87
again subdivided into primary activities, as (1) agriculture,
plantations, animal husbandry and mining, (2) secondary
production, like large scale factory production of producer
and consumer goods and small scale domestic production.
Maintenance work is allocated to the appropriate delivering
sectors, i.e., entries in diagonal cells.
The distributive trade essentially includes ware
housing and storage in the course of transport of produce.
The railways also undertake a considerable storage, but this
is merged with the railway activity and is excluded from
trade items. In the table "sellers' values" have been
adopted since it might be more suggestive of true economic
relationships. The main reason is that trade margin on
purchases by households is far bigger than on any other
transaction that it can be reasonably assumed that they are
proportionate. The difference between the sellers' price
and buyers' price could be entered as a payment by the buying
sector to the trade sector. An alternative method is to
record separately buyers' quota of transport charges apart
from "pure" trade margin and the transport charges do not
enter in the cost of operation of trade except in so far as
there is a transport margin in the material inputs used up
in the current operation of trade. The second procedure has
been adopted for this table.
Tertiary productive activities include (a) banking,

88
insurance and cooperatives, (b) professions, services and
non-profit institutions and (c) upkeep of residential house
property. Professions, however, include self-employed
persons. The payments passing into the hands of individuals
are recorded as wages.
As the inter-industry table is to analyze true
economic relationships in real terms, only three kinds of
transactions have been considered. These are (a) barters,
(b) transactions compensated by money, i.e., buying and
selling, and (c) real transfers, i.e., transactions not
compensated. In as much as the main bulk of the transactions
is of the second type, the table may be construed to represent
the total financial transactions of the community. Gifts,
government welfare measures, grants to institutions, et cetera
are considered to pass directly to consumers.
Income has been regarded as payments to households
and enterprises. Payments to government by way of taxes have
been excluded because they are not relevant for industrial
analysis. Subsidies have been treated as reduction in opera
ting costs. All interest and premiums on insurance have been
recorded as payments to the respective banking and insurance
sectors as if they were real transactions. This is a modifi
cation of the table for 195°-51 prepared by Goodwin (1953)*
where interest and profit are treated as operating surplus.
Profits are difficult to identify and they have been entered

89
in the same manner as bookkeeping accounts, viz. as an item
which closes the operating account.
In the table, distinction is made between current and
capital accounts. First, for each sector, a current and
capital account was drawn taking into account the real trans
actions. Then, all deliveries on capital account originating
the capital or current accounts were merged in order to obtain
the deliveries of producing sectors. However, capital accounts
were not set up for households. The amount of goods which are
regarded as capital represents a flow to the current and
capital accounts of different productive sectors as well as
of government. Flow of scraps is treated as a negative flow
of output, but detailed information on this account was not
available for a number of industries.
The nature of depreciation raises an important issue
in the table. In as much as the table was not intended to
depict dynamic aspects of the economy, capital formation was
not shown as an activity and therefore, depreciation could not
be shown as a delivery to the productive sectors. Instead,
the practical approach of the National Income Committee,
viz., entering depreciation as a current cost of maintenance
at a discounted rate was adopted. Depreciation has been
accounted as an item of input in the table and has been merged
with material costs. Similarly, the estimate of capital forma
tion is also net, i.e., new over and above depreciation.

90
Sources and Estimation Procedures
Most of the information for the table was collected
from mainly three sources: (1) The National Sample Survey
(1952) has conducted a number of rounds on agricultural and
industrial production. The data from fourth and fifth rounds
were adopted for the table. For the industries, the Sample
Survey of Manufacturing Industries and the detailed Census
of Manufacturers on Indian Manufacturing Industries were
available. (2) Considerable data was also culled out from a
number of government publications of the state and central
governments and also from the publications of Reserve Bank
of India. (3) Use was also made of the unpublished dossiers
of the Central Statistical Organization for verifying alloca
tion estimates.
In constructing the table, account had to be taken
of the nature of estimates available from the National Sample
Surveys. The surveys indicated the payments handed out by
different types of activity. By allocating all the outlays
for the different recipient sectors, we also obtain deliveries
by the sectors. The expenditure end and allocation of deliv
eries had to be tallied at different stages for purposes of
confirmation.
The national estimates available from the National
Sample survey yield information only on heavily grouped inputs
and therefore, they had to be adopted for equally heavily

91
aggregated sectors. As a result, the outlays of productive
sectors, as small scale and cottage production, could not
be accurately identified. Consequently, the table does not
reveal linking of small scale and cottage production. It
is also hard to guess from aggregate estimates of outlays as
to how much represented a draft from large scale enterprises
and how much from the corresponding small scale industries.
The ratio of the value of output to the value added may be
a useful guide, but has to be supplemented in each case by
sound judgment and other outside information, emanating from
the nature of linkage of the major industry to the small
scale sectors.
The estimates in the autonomous sectors contain
consumption, private and public investment and net exports.
Household consumption, by groups of items, is available in
the surveys of the National Sample Survey, but since they
are heavily lumped in final estimates, it was estimated as
a residual. Fairly reliable estimates are available for
outlays of government and local authorities and they are
assumed as given. Exports and imports are ascertained from
the Annual account of Sea and Airborne Trade of India.
Transport charges have been deducted from the
different sectors and shown separately against the corre
sponding sectors. Similarly, duties and taxes were separated
out and entered under the column representing the group of

92
products. These were then checked with the net value added
and the total value product of the sectors.

93
EMPIRICAL APPLICATIONS
In this section, an empirical analysis of the Indian
economy is presented. In the investigations, the 1960-61
projection of the inter-industry table published by the
Indian Institute of Public Opinion (ca. i960) has been used.
This table provides considerable detail about the agricultural
sectors, as wheat and other cereals, rice, industrial crops,
livestock products, et cetera. The table is relatively
small, the total economy being divided into nineteen sectors.
Another advantage is that the table is in producers' prices
and comparisons with other countries is, therefore, possible.
Structural Analysis
The table (Appendix B) may be broadly divided into
two subdivisions, xi&., agriculture and industry. The first
five sectors represent agriculture and the rest are industrial
sectors. The nineteen sectors are identified as follows:
1. Wheat and other cereals
2. Rice
3» Industrial crops
4. Livestock and products
5» Other industrial crops
6. Food manufactures
7. Vegetable oil

94
8. Wood
9. Jute
O
r—1
Textiles
11. Leather and rubber
12. Fuel and power
13- Mining
14. Basic metal industries
15. Metal products
16. Non-metallic products
17. Chemicals
18. Construction
19. Transport
The nineteen sector table also provides data on
exogenous final demands, as exports, government expenditure,
investment and consumption. As the table describes the
transactions at producers' prices, trade margins are excluded
from the flows depicted in the table and is considered as
exogenous input.
Let us now consider the analytical uses of the inter
industry table. To ascertain the extent of inter-industry
current uses and the final uses of the gross total output,
the percentages for both these uses out of the total gross
output were computed. The allocations are presented in
Table 11.

95
Table 11. Allocation of total output for inter-indus try and final uses (in percentages)
Sector Total interindustry uses
Final uses
1. Wheat and other cereals 6.95 93.05
2. Bice 9.98 90.02
3. Industrial crops 86.74 13.26
4. Livestock and products 28.90 71.09
5- Other industrial crops 35-62 64.38
6. Food manufactures 6.07 93.93
7. Vegetable oil 11.41 88.59
8. Wood 70.24 29.76
9. Jute 32.91 67.08
10. Textiles 11.33 88.67
11. Leather and rubber 5.05 94.95
12. Fuel and power 18.49 81.51
13- Mining 30.58 69.42
14. Basic metals 84.76 15.24
15. Metal products 30.72 69.28
16. Non-metallic products 92.02 7.99
17. Chemicals 47.12 52.88
18. Construction 4.12 95.88
19. Transport 60.37 39.63

96
Prom Table 11, it would be seen that in eight of the
industries, more than eighty percent of the gross total output
moves directly for final uses and less than twenty percent is
demanded for inter-industry uses. The few sectors in which
inter-industry uses are of considerable magnitude are
industrial crops, wood, basic metal industries, non-metallic
products and transport. These sectors, as one would expect,
supply their outputs as inputs for other industrial sectors.
In all the other cases, products moving directly for final
uses exceed sixty percent of gross output. This implies
that in a less developed economy, the network of processing
industries is not as complicated as in developed economies
and there is less dependence of one industry for its input
on the output of another industry. Most of the goods do not
obviously undergo elaborate stages of processing. It might
be noted that in the case of the agricultural Sectors 1 to
5» except in Sector 3» viz*. industrial crops, 6k to 93
percent move directly for final uses. Similarly, the final
uses for food manufactures, vegetable oil, textiles, fuel
and power exceed 80 percent of the total output.
The interdependence among productive sectors may also
be investigated from the proportion of the factors of produc
tion employed in the processes of production of the commodity.
The quantum of indirect use of factors can be measured by the
ratio of purchased inputs to the total gross output of that

97
sector. These ratios, calculated as percentages, are
presented in Table 12.
It would be seen from Table 12 that the purchased
inputs vary from 11 percent to 71 percent of the gross
output of that sector. In the case of the first five
agricultural sectors, excepting the livestock products, the
ratio is low, varying from 11 to 16 percent. Similarly, in
the case of wood and mining, the ratio is relatively lower
than other industrial sectors. A high ratio of purchased
input of ?1 percent is noticed in sectors, like vegetable
oils and non-metal products. Food manufactures is another
sector which has purchased inputs amounting to 60 percent.
Let us now denote by w^ the ratio of intermediate
total demand to the total output of the sector and by u^
the ratio of purchased input to output. These ratios are
now used to classify the different sectors of the Inter
industry Table for India, depending on whether they are
high or low. (See Table 13»)
In Table 13, we have adopted the classification of
the types of productive sectors similar to the one followed
by Chenery and Watanabe (1958) so that comparison of the
Indian table could be made with those of Japan, United States
and Italy. It is interesting to note that the classification
of sectors for India follows more or less a similar pattern,
though there are certain deviations. The figures of Chenery

98
Table 12. The ratio of purchased Input to output
Sector Percent
1. Wheat and other cereals 16
2. Hi ce 11
3- Industrial crops 12
4. Livestock and products 40
5. Other industrial crops 12
6. Food manufactures 60
7. Vegetable oil 71
8. Wood 25
9. Jute 68
10. Textiles 42
11. Leather and rubber 47
12. Fuel and power 33
13. Mining 22
14. Basic metals 44
15- Metal products 29
16. Non-metallic products 71
17. Chemicals 47
18. Construction 40
19. Transport 38

Table 13» Types of productive sector of India—1961-62
By use of output Final (low w) Intermediate (high w)
By type III. Final manufacture w u II. Intermediate manufacture w u of input
4. Livestock products .29 .40 14. Basic metals .84 .44 6. Food manufacture .06 06O 16. Non-metallic products .92 .71
Manufac 7- Vegetable oil .11 .71 17. Chemicals .47 .47 turing 9. Jute • 33 .68 19. Transport .60 .38 (high u) 10. Textiles .11 .42
Transport (high u)
11. Leather and rubber .05 .4? 18. Construction • 05 .40
IV. Final primary I. Intermediate primary production production
1. Wheat and other .07 .16 3. Industrial crops .87 .12 cereals 8. Wood • 70 .25
Primary 2. Rice .09 .11 • 70 .25
produc 5- Other industrial .36 .12 tion crops
.36
(low u) 12. Fuel and power .18 •33 13. Mining •31 .22 15. Metal products .29 • 31

100
and Clark (Table 8.2, 1959) are the average values of u and
w for Italy, Japan and United States, and their table also
distinguished 29 sectors, while there are only 19 sectors in
our table. Food manufactures, vegetable oil, textiles and
leather and rubber and livestock products (processed foods)
get classified under final manufacture in both the cases,
which have a low w and high u. Similarly, basic metals,
as iron and steel, non-metals and chemicals fall under the
grouping intermediate manufacture, with high w and high u
values. In the table for India, services are considered as
autonomous inputs and therefore, do not get classified under
primary production. However, extractive industries, as
agriculture and mining and fuel and power get classified as
final primary production. The main difference is, however,
in the transport sector, which falls under final primary
production in the case of Italy, Japan and U.S., while in
India it is under intermediate manufacture, and this is
probably due to the differences in the industries going into
aggregation. In India, ship building and railways are
included in transport sector, while they are separate sectors
in the tables of Chenery and Watanabe. Likewise, mining is
classified under intermediate primary production for the
three countries, while for India it comes under final
primary production. This classification is similar to the
classification of Colin Clark (1951)• Colin Clark's classifi-

101
cation of primary and tertiary industries are identified by
the low values of w's and secondary production by high
values of u's.
The classification of sectors in Table 13 brings out
the structural interdependence in the process of production.
The sectors under Category I, viz.. intermediate primary
production, have high intermediate demand and low purchased
inputs. Category II, on the other hand, is characterized by
high intermediate demand as well as high purchased inputs.
The sectors falling under Category III, viz., final
manufacture, have low intermediate demand and require high
purchased inputs. For the final primary production sectors
(Category IV) intermediate demand as well as purchased
inputs are low.
Let us now consider some of the simple applications
of the open input-output table. The activity levels can be
expressed as a linear function of the final bill of goods,
which can be written as
X = (I - A)"1 Y (5.1)
where X is the vector of outputs, (I - A)~^ is the inverse
of the coefficient matrix and Y is the vector of final demands.
The output of the i th sector X^ is, therefore, a function
of all the final demands Y1# ..., YQ.
Before we investigate the levels of outputs required

102
to meet given final demands, let us first consider the
interpretation of the row and column sums of the inverse
matrix. Appendix C shows the (I - A) inverse for the 19
sector model of the Indian economy for the year 1960-61. The
sum of the rows of an inverse matrix indicates the rupee or
dollar worth of output of each sector that would support a
rupee or a dollar worth of final demand from each of the
sectors. Or in other words, the final demand vector (Y) is
a sum vector, sum vector being defined as the sum of n
independent unit vectors if there are n sectors. The column
sums of the inverse matrix have a different interpretation.
The sum of the first column, for example, denotes the rupee
worth of outputs of the different sectors that would be
required to support only 1 rupee worth of final demand for
Sector 1, i.e. for supporting a unit vector of final demand
of the sector in question. The row and column sums of the
inverse matrix are presented in Table 14.
The ranking of the sums of rows denotes the different
magnitudes of the output of the sectors required to support
one unit each of the final bill of goods. From Table 14, it
would be seen that the output of industrial crops will have
to be at its maximum for supporting a unit bill of goods of
all the sectors. Next in the order of ranking is the
transport sector and then other agricultural products and
so on. In a similar investigation by Chakravarthi (1961)

103
Table 14. Bow and column sums of the 19 x 19 inverse matrix for India, 1960-61
Sector Sum of row
Bank Sum of column
Bank
1. Wheat and other cereals 1.1083 17 1.2052 16
2. Bice 1.2614 11 1.1448 19
3- Industrial crops 3.1498 1 1.1647 17
4. Livestock and products 1.8610 4 1.4941 11
5. Other industrial crops 2.3571 3 1.1615 18
6. Food manufactures 1.0676 18 1.8067 4
7. Vegetable oil 1.2046 12 1.8507 2
8. Wood 1.4644 7 1.3734 14
9. Jute 1.1715 14 1.8304 3
10. Textiles 1.1296 16 1.5704 9
11. Leather and rubber I.0433 19 1.7062 6
12. Fuel and power I.836I 5 1.4586 13
13. Mining 1.3683 9 1.3292 15
14. Basic metal industries 1.4020 8 1.6302 8
15. Metal products 1.7849 6 1.4602 12
16. Non-metal products 1.1959 13 2.0925 1
17. Chemicals 1.2955 10 1.7590 5
18. Construction 1.1485 15 1.6867 7
19. Transport 2.3817 2 1.5074 10

104
for the 36 sector model for India for 1953-54, the ranking of
distribution and trade was highest followed by agriculture
and then livestock products and so on. In as much as the
sectors in the 19 x 19 table are differently aggregated, the
results are not strictly comparable. But, however, the
ranking of the sectors follows a more or less similar pattern,
though in some sectors there is considerable variation,
probably due to the differences in the nature of aggregation
of industries. This also, in a way, lends support to
Leontief's (1951) hypothesis that different aggregations of
sectors would lead to different solutions. In Table 14, the
row sums of leather and rubber and food manufactures rank 19
and 18, respectively, which implies that their output has to
be supported least for the unit demand of each of the final
bill of goods.
Similarly, the column sums in Table 14 indicate the
magnitude of a unit final demand (unit vector of final
demand) of the different sectors of the economy on the total
value of outputs of all the sectors. In other words, for
supporting 1 crore (10 million) of final demand of non-metal
products, which incidentally ranks 1, an output of 2.0925
crores of rupees worth of all the sectors has to be produced.
Agricultural sectors, as wheat and other cereals, rice,
industrial crops and other agricultural products occupy the
lower rung of the rankings, which implies that for a crore of

105
rupees worth of final bill of goods of each of these sectors,
the output to be supported by all the sectors is relatively
less. In the investigations of Chakravarthi (1961) also,
the agricultural sectors are way down in the rankings.
The inverse matrix (I - A)"^ is useful for
investigating the output-composition of the economy, given
the final bill of goods. In the inter-industry table for
India (Appendix B), the columns 20 to 23 describe the final
demands, viz.. exports, government expenditure, investments
and consumption of the households. To obtain the output
levels required to support each of the components of final
demands, we have computed the output-composition for the
different final demand vectors, as exports, government and
private consumption and investment separately by applying
Equation 3*12. The total disaggregated outputs to meet the
different components of final demand are presented in Table
15.
It would be seen from the Inter-indus try Table
(Appendix B) that the government consumption is quite small
and hence, it was added to the vector of private consumption
for computing the output levels. Columns 1, 2 and 3 describe
the output-composition of the 19 sectors needed to support
the levels of final demands of exports, investment, government
and private consumption respectively. Column 4 of Table 15
indicates the aggregate outputs needed to meet all the three

106
Table 15• Outputs required to meet the different components of final demand (in crores of rupees)
Sectors Supply of output to meet demand of Total Exports Invest- Govt, and gross
ment private output consumption
12 3 4
1. Wheat and 1.3704 2213.3764 2214.7468 other cereals
2. Bice 4.4278 5.5519 2088.6463 2098.6260
3. Industrial 186.1389 5.8842 878.8596 1070.8827 crops
43.0963 4. Livestock 43.0963 8.7104 1707.0942 1758.9009 and products
283.6156 2797.5646 5. Other agricul 283.6156 13.5297 2797.5646 3094.7099 tural products
6. Food 23.5528 0.1326 629.6622 653.3476 manufactures
7. Vegetable 35.9008 2.5987 476.0003 514.4998 oils
8. Wood 14.2853 53.4150 139.0542 206.7545
9. Jute 139.5503 6.8911 61.5351 207.9765
10. Textiles 158.0312 0.0013 927.8862 1085.9187
11. Leather and 35.5939 2.2618 124.6021 162.4578 leather goods
35.5939
12. Fuel and 31.1129 57.1090 908.9507 997.1726
13. power Mining 58.7363 29.6590 77.4613 165.8566
14. Basic metal 24.0711 88.5027 77.8941 190.4679 industries
15. Metal 39.9007 382.8979 316.0617 738.8603
16. products
16. Non-metal 5.8180 80.2458 12.2018 98.2656 products
80.2458 98.2656
17. Chemicals 11.8515 18.oi32 112.4834 142.3481
18. Construction 3.0593 506.8803 41.3496 551.2892
19. Transport 42.3851 53.3261 590.4319 686.1431

107
components of final demands. These structural details aid
the planner to estimate the capacity requirements of individual
sectors to meet a set of final demands, which are estimated
from extraneous sources, as consumption patterns, change of
tastes, population growth, availability of foreign and total
investments, prospects of foreign trade, et cetera.
The imports are shown as an autonomous input item
under How 23 of the transactions matrix (Appendix B). Many
of the developing countries are interested in replacing the
imported goods with products of indigenous origin. Though a
sophisticated study on imports would be to consider competi
tive and non-competitive imports separately, as has been done
for the several Latin American countries by the Economic
Commission for Latin America (1956, 1957» 1958), we are not
in a position to undertake such an investigation for want of
data separately under the two types of imports. However, such
an approach is possible, if the imports could be separated
out as competitive and non-competitive from export figures
available in meticulous detail in the annual account of
Sea and Airborne Trade of India. Within the limitations of
available data, we will make the restrictive assumption that
all the items of imports can be substituted by products of
national origin and that they could be produced within the
available technological process of production. Since our
purpose is merely to estimate changes on the output-composition

108
in case the imports are to be substituted, we have computed
the output levels of the nineteen sectors required to replace
imports. These are presented in Table 16.
So far, we have considered the output-composition
required to support the different components of final demand
and exports. Let us now investigate the effects of autonomous
inputs, like exports, the cost of trade and services and the
labor costs. The autonomous inputs are similar to the
concept of 'value added' in national income accounting. The
value of primary inputs is the difference between the value
of production in a sector and the cost of inputs from
productive sectors. Wherever the imports are treated as
primary inputs, the column totals have to be considered as
total supply rather than total domestic production.
In the input-output table for India for i960-61 (Ap
pendix B) four types of primary inputs have been distinguished.
They are imports, trade and services, government expenditure
and wages. As the wages in the table include returns to
labor and also probably other factor incomes as rents, inter
ests and profits, any refined analysis of employment is not
feasible. In addition, wages do not account for incomes of
self-employed persons and such incomes are likely to be high
in less developed economies, particularly in agriculture.
Therefore, our analysis of wages will reflect only wage
earners and will not have any relation to the total employ-

109
Table 16. Outputs needed to substitute imports
Sectors Output levels Imports needed to during replace imports 1960-61
1. Wheat and other cereals 151.84 142.53
2. Rice 66.97 51.75
3- Industrial crops 149.54 118.75
4. Livestock and products. 32.66 4.05
5- Other agricultural products 57.05 21.65
6. Food manufactures 16.42 15.22
7. Vegetable oils 10.55 4.68
8. Wood 38.07 25.58
9. Jute 2.08 0.02
10. Textiles 35.41 31.42
11. Leather and leather goods 3.32 3.01
12. Fuel and power 130.20 102.46
13. Mining 20.72 1.58
14. Basic metal industries 118.20 35.34
15. Metal products 437.24 395-85
16. Non-metal products 13.94 11.89
17. Chemicals 39.44 29.15
18. Construction 3.14
19. Transport 59.55

110
ment in the country.
The amount of labor inputs, xLs.*» wages, imports
and trade margins per unit value of output have been
presented in Table If. Government revenue has not been
considered separately, for it is a fluctuating one depending
on the policy of the government.
Table 17 describes the cost of the primary or
exogenous inputs per unit value of output. It would be seen
from the table that in the case of basic metal industries,
per rupee worth of output, .54 rupee worth of imported inputs
is necessary. Similarly, in chemicals, .20 unit of imported
inputs is used for every unit of output. For expanding these
sectors one must take into account the balance of trade
position and the availability of foreign exchange. It should
be the aim of the planners to analyze the various components
of imported inputs and efforts should be made to substitute
them gradually with products of indigenous origin. It is
also seen that imported inputs are the least for jute per
unit value of output.
A look into the trade costs would reveal that the
input on this item is high in the case of wheat and other
cereals, rice, mining and other agricultural products. In
the case of agricultural products, it is known that the trade
costs are high since the produce passes through a number of
intermediaries before reaching the ultimate consumer. The

Ill
Table 1?» Wages, trade costs and imports per unit value of output
Sectors
1
Imports
2
Trade costs
3
Wages
4
Gross value of primary-inputs
5
1. Wheat and .0643 .4033 .3052 .8418 other cereals
2. Hi ce .0247 .2234 .6309 .8890
3- Industrial .1107 .0077 .7257 .8782
4. crops Livestock .0023 .0734 .4982 .6011 and products
.6313 .8767 5- Other agricul .0070 .1988 .6313 .8767 tural products
.1608 6. Food .0233 .1182 .1608 .3980 manufactures
7- Vegetable oils .0091 .0766 .1868 .2858
8. Wood .1236 .0295 .5139 .7489
9. Jute .0001 .0172 .1784 .3208
10. Textiles .0289 .1299 .3459 • 5757
11. Leather and .0185 .0657 .3386 .5343 leather goods
12. Fuel and power .1028 .1384 .3297 .6722
13- Mining .0095 .2719 .4280 .7787
14. Basic metal .1855 .2782 .5625 industries
15. Metal products .5376 .0560 .0142 .7104
16. Non-metal .1207 .0011 .1497 .2866 products
.0363 17. Chemicals .2040 .0363 .1593 .5293
18. Construction —- .1671 .4176 • 5957
19. Transport —— — .5298 .6089

112
input coefficients of trade and services guide the planners
in undertaking marketing facilities so as to reduce the cost
to the minimum.
Column 4 of Table 17 describes the input cost on
account of wages. The input of labor is uniformly high in
all the agricultural and allied industries. In the first
five agricultural sectors, labor inputs range from 30 to 72
percent. Again in sectors like wood and mining, the labor
inputs are high. Purely industrial sectors, as vegetable oils,
food manufactures, jute industry, metal products and non-metal
products and chemicals have low inputs of labor per unit value
of output. These low labor input coefficients imply that the
technology in these sectors is well advanced and the sectors
are capital intensive and mechanized. Construction and
transport have a high input coefficient and these larger
inputs are partly due to deliberate planning to provide
employment for the large army of unemployed. The relatively
high input of labor in the textiles is probably due to the
existence of a large handloom sector side by side with the
mechanized textile mills. The leather and its products are,
similarly, carried on more as a cottage industry than as an
organized industrial sector. The availability of cheap
labor to an extent accounts for the high input of labor in
the different sectors.
Column 5 of Table 17 depicts the total primary inputs

113
per unit value of output. In the first five agricultural
sectors, excepting for livestock products, the total cost of
primary inputs varies from 84 to 89 percent. Likewise, the
cost of primary inputs exceeds 70 percent in the case of
wood, mining and metal products. The high coefficient in the
purely industrial sector of metal products is due to the large
imported inputs. An interesting feature is that except in the
case of wood, the primary inputs exceed 5° percent and there
fore, the purchased inputs are less than fifty percent. This
implies that most of the sectors depend heavily on exogenous
sectors for inputs and the interdependence between the
producing sectors is quite low.
So far, we have considered some of the structural
aspects of the Indian economy. We now proceed to investigate
the programming applications of the input-output system.
Before casting the input-output model into the programming
framework, it would be appropriate to first discuss the logic
of linear programming and then to consider the generalized
activity models.
Programming Applications
Positive aM normative approaches
Before discussing the programming formulations, we
shall consider the empirical tools available to economists
and their conceptual approaches. There are two separate

114
approaches commonly known as positive and normative analysis.
Positive analysis has been described by Heady (1961) to mean
prediction of quantitative relationships among variables as
they actually do exist at a point in time or have existed over
a period of time. This is analogous to saying that the models
are descriptive or predictive. As the analysis describes the
structure as it actually exists, it can be used to predict
the magnitude of one variable from the magnitudes of others.
On the other hand, normative analysis refers to what ought to
exist under the assumptions made. If, for example, the
planners of India have certain goals and knowledge, a norma
tive analysis would indicate as to what would happen or is
expected to take place under certain given conditions. One
advantage of normative approach is that we could take into
account certain new variables, which are likely to exist, into
the programming formulation, while in positive analysis, we
essentially use historic data of the past to predict the
future. In essence, positive analysis is the extrapolation
of past trends to predict the future events, and therefore
cannot take care of any new variables that are likely to prop
up in the planning horizon.
The major tools for the positive analysis are the
different regression methods and the more recent input-output
technique. The important techniques for normative analysis
are budgeting and programming methods. In any planning model,

115
our interest lies in the future course of events and not in
the historic past. As a matter of fact large scale planning
is resorted to to change the course of events, as increasing
the supply of outputs, changing the production structure and
technology. Regression models based on time series observa
tions cannot tackle such problems. As such, one has to
resort to programming techniques in order to analyze the
possible effects of new variables and more detailed examina
tion of specific variables.
Normative analysis has also certain inherent deficien
cies. While global coefficients or regional aggregates can
be handled readily by regression models, programming models
built on national aggregates may have little meaning. Heady
(1961) has observed that even if sufficient restrictions are
introduced, the model could tell only the historic story and
would have the same limitations as the regression models in
predicting a future, subject to technological and institu
tional changes.
While both normative and positive approaches have
their merits and demerits yet they have helped in analyzing
factor demand and product supply in agriculture. Our
empirical programming formulation of the input-output model
presented later in the section is in a way blending of the
positive and normative approaches.

116
înpwt-owtput analysis and linear programming
The concept of activity analysis has been discussed by
Heady (1958)» Koopmans (1957) and Chenery and Clark (1959).
Activity analysis is a method of analyzing economic changes
through smaller units known as activities. Activity analysis
is more general than linear programming in that it covers a
broad range of problems, as the classical theory of production
and of the relation between production and prices, besides
linear programming. While activity analysis just provides a
set of concepts and their implications, linear programming
may be considered as an empirical, mathematical formulation
which provides numerical solutions under certain assumptions.
Linear programming was initially developed to allocate resources
or for working out production plans in a manner that would yield
maximum profits or outputs or that would minimize cost. The
technique has so much developed that it is now applied to a
wide range of allocation and price problems.
Assumptions (l) In both the input-output analysis and linear
programming activities have to be additive. That is, the
total amount of resources used by several enterprises must
equal the sum of the resources used by individual enterprise.
There cannot be any interaction in the amount of resources
used whether the activities are produced alone or in varying
proportions. We also assume lack of economies or diseconomies

117
and constant returns to scale in both the models. (2) The
input-output model assumes that each commodity is produced by
a single sector of production, while in linear programming, we
take it that a commodity may be produced by several activities
and each activity has several outputs. (3) In both the models,
a linear homogeneous function is assumed (i.e., a ii = J
x../X.). For linear programming, proportionality assumption 1 j J
is essential, while it is not important in the input-output
model. (4) Non-negativity of activity levels is necessary
in both the models. In the linear programming model a
specific condition must be imposed, while in the Leontief1 s
input-output model, it is a necessary property and is, there
fore, built in the model itself. (5) Both linear programming
and static input-output models employ the assumption that
input-output coefficients, prices and resource supplies are
known with certainty at a particular point of time.
Computational ana conceptual similarities Linear programming is applied to select the best
possible choice or optimum program, while in input-output
system, the solution revolves around determing the quantita
tive manner in which one sector is related to another. Heady
(1958) has shown that in the simplex table, each of the input-
output coefficients computed in the feasible solution of
linear programming is also an interdependence coefficient.
Thus, both the models have some close computational and con

118
ceptual similarities in determining solutions. If we denote
by r^j the input-output coefficients computed in each feasible
solution in the simplex table, then r^ indicates the amount
by which the activity in the i th row will be increased or
decreased per unit change of activity of the j th column.
Basic concepts o£. linsaz programming In this part, we will discuss some of the programming
concepts as resource restrictions, production possibilities
and the optimum plan. These concepts have been discussed in
detail by Heady (1958), Dorfman, Samuelson and Solow (1958)
and by a number of others.
Resource restrictions
Table 18 contains the data for a simple two resource,
two activity programming problem. For the purpose of illustra
tion, we will take the agricultural farm planning problem
provided by Candler (1957)• In this example, there are two
activities, potato and corn production (P^ and P^)• These
activities are limited by supply of land (P^) and capital (P^).
For producing one unit of potatoes, 1 acre of land, 0.887
(hundred dollars) of capital are required and the net revenue
is 0.834 (hundred dollars). Similarly, for producing one unit
of corn, 1 acre of land, 0.350 of capital are needed and the
activity yields a net revenue of 0.724 dollars. Production of
potatoes and corn is limited by the farmer's limited supply of

119
land and capital. The programming problem is to combine the
production of potatoes and corn in such a way that the profit
is maximized within the limitations of the supply of land and
capital.
The problem described in Table 18 may also be
geometrically expressed as in Figure 1. The vertical axis
measures the potatoes in acres and the horizontal axis measures
the corn in acres. The line r r1 will yield a revenue of $1000
i.e., all combinations of the areas under potatoes and corn
on the isorevenue curve r r* will yield a revenue of $1000.
As we move away from the origin, we come across successively
higher isorevenue curves. The profit or revenue is the
maximum where the production possibility curve intersects the
highest isorevenue curve. In Figure 1, the production
possibility curve b c a intersects the highest isorevenue
curve at the point c. So the optimum plan is 5«59 acres
of potatoes and 54.41 acres of corn. The point c can also
be shown to be the optimum plan by calculating the marginal
rates of substitution and substituting in the criterion
equation.
From Figure 1, it would also be seen that the feasible
area or the production possibility open to the farm is bounded
by the broken line b c a. Above b c, the limitation of
capital does not allow for the full utilization of land and
above c a, the limitation of land does not allow for the full

120
50
$4,405 ISO-REVENUE 40
w
P 3 ISO-RESOURCE
\ (60 ACRES OF LAND) 30
LU
P 4 ISO-RESOURCE ($2,400) 20
\ -$1,000 ISO-REVENUE
70 50 60 30 40 20 0 10 CORN (ACRES). .
Figure 1. Production problem expressed in terms of acres of.crop production
(

121
Table 18. Per acre requirements and resource supplies
Resource Units Activity Supply-Potatoes Corn
Land P^ Acre 11 60
Capital P4 $100 .887 -350 24
Net revenue $100 .8]4 .724
utilization of capital resource. The distance between a1 c
and b* c indicates the amount of land that has to go unused
for plans along the segment a' c and similarly, the amount of
capital that has to go unused for points on b* c is given by
the distance between c a and c b*.
In this simple case chosen for illustration, only a
single program at c exhaust the resources, ils»» capital
and land. If we allow for the nonuse of resources (or provide
for disposals), there may be a more profitable optimal program
in which some resources may go unused. In a problem, where i
there are a large number of activities and resource restric
tions, an optimal plan that yields maximum profits may be
one in which one or more resources may not be completely
used up.

122
PrgflttgUon possibility curve
From Table 18, the production possibilities may be
represented as
lp + lc = 60 (5.2)
.887p + .350c = 24 (5.3)
Expressing the production possibility of potatoes
as a function of corn we have
p = 60 - lc (5*4)
P = 27.05 - -39c (5.5)
The coefficient 1 for corn is the ratio of
land requirement per unit of corn = land requirement per unit of potatoes Ac
Ap/Ac is the marginal rate of substitution of corn
for potatoes. Similarly, .39 may be described as the
marginal rate of substitution of corn for potatoes for the
capital requirements.
Feasible and optimum clans. To start with, point b in Figure 1 can be selected as
a feasible plan. Under that plan, all the area will be under
potatoes and nothing under corn. Now we would like to know
whether this is an optimum plan or whether there are more

123
profitable plans. This can be ascertained from the following
criterion equation:
iz0 = Bc - Bp • (5.6)
where Z0 is the increase in profits associated with every
unit increase in corn. Bc and Bp are the net revenues of
corn and potatoes respectively and is the marginal rate
of substitution of corn for potatoes. We know the slope of
b c from Equation 5*4. With the net revenues of potatoes
at $ .834 per acre and at $ .724 per acre of corn, we can
rewrite Equation j.6 as
AZq = .724 ~ (.834 x .39) = 0.40 (5.7)
Since ZQ is positive, profit can be increased by substituting
corn for potatoes. Again applying the criterion equation,
we test whether the move from c to a is profitable or not.
The increase in profits may be computed as
AZ0 = .724 - (.834 x 1) = -0.11 (5.8)
The negative profits imply that it is not profitable
to move from the point c. The point c with 5*59 acres under
potatoes and 54.41 acres under corn is not only a feasible
plan but also an optimum plan.
The optimum program, it was seen, was at the corner

124
c, the point of intersection of the isoresource curves.
Points b and c are also corners and the solution or the
optimum program revolves around finding that corner which
yields maximum profits or intersects the highest isorevenue
curve. The simplex procedure developed by Dantzig (1949)
essentially uses the above principles. However, in the
simplex table, disposal activities are included for nonuse
of some of the activities.
Having considered the different approaches to economic
analysis and the basic concepts of activity analysis and
linear programming, we proceed to consider the generalized
activity models and the linear programming formulation within
input-output framework.
Generalized activity model
The Leontief system is based on the idea that the
choice of technology, source of supply and pattern of demand
are independent of the outcome of analysis. The system
assumes that choices are not dependent on the level of output
in each sector and therefore, can be fixed in advance. In
this part, we cast the input-output model in the linear
programming framework and thereby introduce the element of
choice in the model. The programming approach considers
alternative sources of supply as separate activities and the
level at which each is utilized becomes a variable in the

125
model. The system, therefore, is riot unique and has many
possible solutions. Another advantage is the criterion for
preferring one solution to another, which may be maximization
of welfare, national income or output levels or cost minimiza
tion. As discussed earlier, the maximizing behavior, which
is central to economic theory, is completely ignored in the
Leontief system. By formulating a programming model, we
introduce choice and a certain criterion for preferring one
solution to another and hence, indirectly incorporate the
economizing assumption in the Leontief model. Though a
planning authority is interested in knowing the network of
interdependencies in the economy, he is more interested in
finding out the output levels or final demands under different
changing situations. The programming formulation aids the
planner in arriving at the optimal choice within the resource
limitation, commodity levels and structural constraints.
In the input-output model, we have a number of
industries or sectors of production. As the model generally
assumes fixed proportions of inputs to output, each of the
industries can be considered as an activity. Any activity j
may be represented as a column vector as shown in Equation
5.9, where Aj is the column vector of input-output coefficients
a^j's for activity j. Positive coefficients in the vector
denote outputs and negative coefficients describe inputs.
Assuming that there are n activities, the activities

126
alj
a2j
l3J (5.9)
amj
can be expressed in a matrix form as
A (A^, Ag, . « «, A^)
all a12
21 22
ml a, m2
In
2n
mn
(5-10)
where A is the matrix of technical coefficients of n
activities that produce m commodities. In the Leontief
input-output matrix, the number of activities and the number
of commodities are equal, i.e., n = m, and therefore the
model is deterministic with no choice of activity. In any-
planning situation, it will be almost impossible to anticipate
a particular set of proportions and the outputs as detailed in
a Leontief matrix. The planner would like to choose from the
different alternatives the optimum that maximizes welfare or

127
national income or those outputs that could be produced with
minimum cost. So in the activity model or linear programming
the output levels (gross or net) become the activity levels.
Using the same notations used in input-output analysis, there
are a set of activity levels (X^, X2, .••, Xn), with the input-
output relation as
*ij = aij Xj (5*11)
The final demand (Y) constitutes the restrictions,
which are taken as given from extraneous sources. There
is one restriction for each of the m sectors, industries
or commodities. The column vector of constraints may be
represented as
Y =
The linear programming problem consists essentially
in the choice of the activities. At this stage, mention may
be made about the assumption of linearity, which is basic to
the theory of linear programming. It would be appropriate to
quote Tinbergen in this context:
m
(5-12)

128
First it is a well known mathematical proposition that almost any function may be approximated by linear functions over small intervals. The exceptional functions for which this proposition does not hold need not interest us here at all. Most economists would not be aware of their existence.
The second reason why I think linear relations are not so ridiculous, is that observation simply teaches us that they occur.
Apart from these reasons, is it not natural to begin any attempt at analyzing the economic mechanism by making the simplest assumption compatible with general theory?
In addition to all this there is one theoretical reason why for great masses of individuals, the joint reaction may be much more than individual reaction will be. (1958)
Having considered the logic in favor of linear rela
tionships, we can represent the linear programming problem as
Maximize C = E c, Xi (5.13) J J
subject to
Z aiJ Xj < Yi (5.14)
Xj > 0 (5.15)
where Xj is the activity level, a^j's are input-output
coefficients. Y^'s are fina^ demands or specified constraints.
A linear programming model seeks to maximize or minimize some
linear function of activities subject to certain restrictions.
The choice of the objective function depends on the welfare
function, the community wants to maximize. The method of
reaching the optimum solution was discussed earlier in the

129
numerical example.
System linear equations, aM linear programming
In a system of linear equations, a unique solutions
exists, if the number of linearly independent equations is
equal to the number of unknowns. There is more than a
solution, if the number of variables exceeds the number of
equations. If the number of equations is m and there are n
unknowns (n > m), the system has (n - m) fold infinity of
solutions and the system is considered to be underidentified.
The system is overidentified when the number of equations
exceeds the variables or the degrees of freedom is negative.
This implies that we have more restrictions than the
variables, which is not consistent. In a crude way, one
could ascertain whether a solution exists or not, by counting
the number of variables and the number of equations. In the
linear programming formulation, the number of variables
exceeds the number of equations. The Leontief input-output
system will yield a deterministic solution, since the variables
just equal the number of equations. Therefore, in casting the
Leontief model in the linear programming framework, additional
variables have to be introduced for an optimum solution.

130
A Linear Programming Model within the Input-output Framework
One of the objectives of development programming is
to obtain a wide perspective of the economic development of
the country so as to establish coordinated production targets
compatible with the stability of the system. A detailed
perspective affords information on the different sectors and
their capacities and also provides the necessary base for
certain criteria relating to the establishment of financial,
monetary foreign trade and other policies, that will lead to
the success of the plans or objectives. A planner, for exam
ple, can formulate the production targets taking into account
the necessary rate of development within the limitations of
capital and other resources. In this study, an attempt has
been made to develop a linear programming model within the
input-output framework to deal with the problem of allocation
of capital resources during the Third Five Year Plan period
for the Indian economy.
For our model, the 1960-61 input-output projections
(Appendix B) published by the Institute of Public Opinion
(.£&• I960 ) were used. There are nineteen sectors in the
table, but they had to be aggregated to ten sectors to meet
the available computational facilities. As the sectors are
more detailed, the input-output coefficients get smaller and
the rounding errors tend to get magnified. In the aggregated

131
table, food crops include wheat and other cereals and fibre
products include wood, jute, textiles and leather and rubber.
Non-ferrous metals include chemicals, besides non-metals.
Mining was aggregated with ferrous metals and its products.
Capital intensive sectors, as power and transport were
combined to form a single sector.
Programming formulation
The model seeks to maximize the total gross national
income at the end of the Third Plan period, subject to the
structural restrictions and certain output levels targetted
for the plan period. In addition, the total capital available
during the Third Plan is limited and the estimated outlay of
ten thousand crores of rupees forms the resource constraint.
The problem is, therefore, to find the optimum output levels
during the plan period with the dual objective of maximizing
the national income or outputs and allocating the capital to
the various activities in an optimal manner.
The mathematical version of the model may be repre
sented as shown on the following page, where AX^ is the
difference between the targetted outputs in 1965-66 and the
actual outputs attained in 1960-61 in the food crops sector.
Similarly, AX2, AX^, .., AX^Q are the increases in outputs
in industrial crops sector, livestock products and so on.
The a^j's are the input-output coefficients for the year

132
Max F = àXl + âXz + AX3 + AX^ + AX^ +
AX6 + AXy + AXg + AXg + AX 10
subject to
allAXl + a12AX2 + •" + al,10AX10 - AX1
a21AXl + a22à X2 + + a2,10AX10 - à X2
(5.16)
ai0,lAXl+ai0,2AX2+***+ai0,10AX10 - AX10
b1AX1 + b2AX3 + ... + b10AX1() < K
and AX^-^q Max AX-^^q» i 11» 12 * • 20
AXi > 0
1960-61 and we assume that these coefficients do.not change
over the planning period. The b^'s are the capital-output
ratios and K is the total investment made during the Third
Plan period. An equal weight of one has been given for all
the ten activities so that our aim is to maximize the gross
national output or the national income.
The model described in System 5»16 can be written

Max F = AX1 + AX2 + AX^ + ... + AX1Q
subject to
(l-a11)AX1 - a12AX2 - a^AX^ al,10AX10 " Y1
~a21AXl + 1~a22^AX2 ~ a23AX3 »... - a2,10AX10 " Y2
~a31AXl " a32AX2 + <1-a33)AX3 - ... - a3,i0AX10 " Y3
"a10,lAXl "a10,2AX2 ~ a10,3AX3 ~ + 1"aiOt10^AX10
—b^AX^ - bgAXg -b3AX3 — ... — t*20AX10 "" c
and AX-l + p^ = Max AX^
AXg + p2 = Max AX2
• • •
• • •
E * *
AX10 + Pio = Max AX10
AX, > 0

134
including the slack variables, which would render the inequal
ities as equalities.
It would be seen from System 5*17 that the final
demands Y^'s are obtained as slack variables. Similarly, c
represents the slack for unused capital and Max AX^, Max AXg,
..., Max AX^o indicate the maximum output levels or upper
bound constraints. The slacks p1# p2, ...» P1Q denote the
amount by which the upper bound levels are not met. Since
the model is described in terms of increases (AX's), the
lower bound is zero and is built within the model.
Description ai j&s model In India, the Planning Commission (1961) has estimated
that the investment during the Third Five Year Plan will be
to the tune of ten thousand crores of rupees. So it was
taken that the capital available for new investment during
the five years 1961-65 would be ten thousand crores. The
output levels that have been attained at the end of Second
Five Year Plan, i.e., in 1960-61, were taken as the minimum
levels. For the most part, the minimum levels were adopted
from the 1960-61 projections of the inter-industry table
published by the Institute of Public Opinion (sa. I960).
From the estimates of investments, growth of capacities,
demand for products consequent on population growth, increase
in standards of living, et cetera, maximum outputs have been
projected by the Planning Commission (1961). Instead of

135
adopting these levels as such, we thought it better to
calculate approximate increases during 1961 to 1966 in terms
of percentages, since at the time of planning, much ahead of
the period in which it is put into operation, it would be
rather operational to anticipate increases as percentages
rather than fixing any particular level of output. These
percentages and the calculated output levels are given in
Table 19* Since we are interested in allocating the capital
resources for increases in output, the lower bound, as
indicated, was taken as the production levels already
attained in 1960-61. The increases in the activity levels
(AX's) are, therefore, the differences between the anticipated
outputs in 1965-66 and the outputs already attained at the
end of the Second Five Year Plan, i.e., 1960-61.
Our aim is to maximize the gross national income or
gross output. In the process of planning in a less developed
economy, a balanced growth is needed and therefore, equal
weights were given for all the sectors.
The technological changes in less developed economies
take place rather very slowly due to many causes, one of them
being institutional rigidities. So, in our model, we have
assumed that the technology is not likely to change from the
1960-61 level and hence have adopted the input-output coef
ficients (a^j's) of the base period. The aggregated ten
sector technology matrix and the input-output coefficients

Table 19» Estimated increases in outputs in the Third Plan (output in crores of rupees)
Sector Output in Percentage Output at Estimated 1960-61 increase the end of increase
anticipated 1965-66 in output (AX)
12 3 4
1. Food crops 4313.45 30 5607.46 1294.01
2. Industrial crops 1072.28 30 1393.96 321.68
3- Livestock products 1758.91 25 2110.69 351.78
4. Other agricultural 3095.10 30 4023.63 928.53 products
1167.78 5. Food and vegetable oils 1167.78 30 i5i8.ll 350.33
6. Fibre products 1663-98 40 2329.57 665.49
7- Mining, metals and 1092.81 37 1497.87 405.03 its products
361.08
405.03
8. Non-ferrous metals 240.72 50 361.08 120.36 and chemicals
50 361.08 120.36
9. Power and transport 1682.74 50 2524.ll 841.37
10. Construction 551.40 31 722.13 170.73

137
(a^j's) for the year 1960-61 are given in Tables 20 and 21
respectively.
Çapital-outnut ratios The amount of capital required to produce one unit of
gross output was assumed to be the capital-output ratio for
the purpose of our model. It was further assumed that the
capacities are fully utilized in the base year 1960-61. In
the absence of reliable estimates, the capital-output ratios,
applied by Sandee (i960) for his Demonstration Planning model
for India were approximated to suit the 10 sectors in the
model. Certain estimates of the capital-output ratios for
agriculture were also available with the Planning Commission.
The ratio for agriculture was estimated by the Planning
Commission by dividing the capital stock with the net domestic
product. The capital output-ratio of the latest available
year (1957) was calculated as follows:
capital stock— = 6813 = , 2uiu domestic product 5520
The five year average ratio was quite close, though lower,
but since it was felt that the condition in i960 will be
approximately closer to 1957 than earlier years, the 1957
figure, the latest available, was adopted. Similarly, for
chemicals, textiles, jute and vegetable oils in the 19 sector
table, the estimates provided by the Reserve Bank of India

Table 20. Transaction matrix for India, 1960-61 (in 10 millions of rupees)
l a 2 3 4 5 6 7 8 9 1 0 T o t a l interindustry uses
la 214.59 2.02 25.91 3.46 26.55 2.31 - - 88.37 363.21
2 3.02 63.81 - - 499.46 363.75 - - - - 930.04
3 88.20 12.70 97.81 55.70 64.69 64.89 - - 124.43 508.42
4 176.19 - 537.49 216.48 52.90 - - 0.55 118.83 1102.44
5 8.04 - 24.45 3.17 37.15 2.93 - 16.39 6.19 98.32
6 36.74 8.77 - 21.94 8.82 167.29 1.91 15.67 40.98 42.87 344.99
7 0.20 - - 5.77 12.90 21.74 217.75 29.28 94.06 56.73 438.43
8 2.05 - - 5.77 7.59 24.04 9.79 14.92 1.25 92.62 158.03
9 54.02 43.25 16.03 69.27 44.48 78.51 102.56 53.09 106.63 30.71 598.55
10 0.20 - - — 6.14 4.50 1.32 7.65 7.60 27.41
^Sectors 1 to 10 are the same as described in Table 19, page 136.

Table 20 (Continued)
Exports Government Consumption Total Total expenditure final gross
and demand product investment
la - - 3950.24 3950.24 4313.45
2 31.00 - 111.24 142.24 1072.28
3 14.55 - 1285.94 1249.94 1758.91
4 240.00 1.00 1751.66 1991.00 3095.10
5 55-00 - 1014.46 1069.46 1167.78
6 315-75 32.80 970.44 1318.99 1663.98
7 92.50 341.35 220.53 754.38 1092.81
8 10.00 2.00 71.44 83.44 240.72
9 14.00 30.00 1040.19 1084.19 1682.74
10 — 524.00 — 524.00 551.40

Table 21. Input-output coefficients
Sector 1 2 3 4 5
1. Food crops 0.0497 0.0018 0.0147 0.0011 0.0227
2. Industrial crops 0.0007 0.0595 0.0000 0.0.000 0.4276
3- Livestock products 0.0204 0.0118 0.0556 0.0179 0.0553
4. Other agricultural 0.0408 0.0000 0.3055 0.0699 0.0452 products
5. Food and vegetable 0.0018 0.0000 0.0138 0.0010 0.0318 oils
6. Fibre products 0.0085 0.0081 0.0000 0.0070 0.0075
7. Mining, metals 0.0000 0.0000 0.0000 0.0018 0.0110 and its products
0.0064 8. Non-ferrous metals 0.0004 0.0000 0.0000 0.0018 0.0064 and chemicals
9. Power and transport 0.0125 0.0403 0.0091 0.0223 0.0380
10. Construction 0.0000 0.0000 0.0000 0.0000 0.0052

Table 21 (Continued)
Sector 6 7 8 9 10
1. Food crops 0 .0013 0 .0000 0 .0000 0 .0525 0.0000
2. Industrial crops 0
V\ 00 a 0 .0000 0 .0000 0 .0000 0.0000
3- Livestock products 0 .0389 0 .0000 0 .0000 0 .0739 0.0000
4. Other agricultural 0 .0000 0 .0000 0 .0022 0 .0706 0.0000 products
.0680 .0360 5- Food and vegetable 0 .0017 0 .0000 0 .0680 0 .0360 0.0000 oils
6. Fibre products 0 .1005 0 .0000 0 .0650 0 .0243 0.0777
7- Mining, metals 0 .0130 0 .1992 0 .1216 0
00 0 0.1028
and its products .0619 0.1679 8. Non-ferrous metals 0 .0144 0 .0089 0 .0619 0 .0070 0.1679
and chemicals 9. Power and transport 0 .0471 0 .0938 0 .2205 0 .0633 0.0556
10. Construction 0 .0027 0 .0012' 0 .0317 0
-d-0
0 0.0000

142
were used. In our 10 sector model, the ratios are weighted
averages of the 19 sector classification described in the
following pages. The capital-output ratios for the ten
sectors in our model are given in Table 22.
Table 22. Capital-output ratios
Sector Capital-output ratio
1. Food crops 1.21
2. Industrial crops
i—1 CVJ i—I
3- Livestock products 1.21
4. Other agricultural products 1.21
5- Food and vegetable oils 0.59
6. Fibre products 1.17
7. Mining, metals and its products 2.36
8. Non-ferrous metals and chemicals 2.03
9. Power and transport 5.11
10. Construction 0.22
The simplex solution to the problem indicated that
the upper bounds or targets shown in Column 4 of Table 19
could be attained except in the case of power and transport
(Sector 9)• In the case of power and transport, the optimum
increase was found to be output valued at 831.0? crores of

143
rupees, instead of the targetted level of 841.37 crores.
Having obtained the increases in outputs (AX's) from,
the simplex solution, we computed the output levels at the
end of the Third Plan, viz.. 1955-56» The output levels (X's)
are the same described in Column 3 of Table 19 except in the
case of power and transport. The optimum output of power
and transport from the solution is 2513*81 crores of rupees,
instead of the targetted figure of 2524.11. From the optimum
output levels, we computed the optimum levels of final demand
and inter-industry demand at the end of the Third Five Year
Plan. The transaction matrix of the optimums is presented
in Table 23.
Though our estimates of outputs were very rough, they
were generally higher than the estimates of the Planning
Commission. Since the sectors are highly aggregated, only
approximate percentages of the possible increases could be
guessed. Despite the inherent deficiencies in the data, it
appears that higher targets than those estimated by the Plan
ning Commission seemed feasible. The optimum solution lends
support to the criticism of Surendra J. Patel (1961) that the
targets of the Planning Commission are conservative and higher
levels of production can be attained with the intended level
of investment of ten thousand crores of rupees during the
Third Plan period.

Table 23. Projection of the transaction matrix for 1965-66 based on the optimum output levels (in 10 millions of rupees)
la 2 3 4 5 6 7 8 9 10
la 278.69 2.51 31.03 4.43 34.46 3.43 - - 131.97 -
2 3.92 82.94 - - 649.14 509.41 - - - -
3 114.39 16.45 117.35 71.97 83-95 90.62 - - 185-77 -
4 228.78 - 644.82 281.25 68.62 - - 0.79 177.47 -
5 10.09 - 29.13 4.02 48.28 3.9 6 - 24.55 9.05 -
6 47.66 11.29 - 28.16 11.39 234.12 2.55 23.47 61.09 56.11
7 - - - 7.24 16.69 30.28 298.37 43.91 140.27 74.23
8 2.24 - - 7.24 9.71 33-55 13.33 22.35 1.76 121.25
9 70.09 56.18 19.21 89-73 57.69 109.72 140.49 79.62 159.12 40.15
10 - — — — 7.89 6.29 1.79 11.45 II.3I -
aSectors 1 to 10 are the same as described in Table 19» page 136.

Table 23 (Continued)
Total Final Gross (1-10) demand output
la 486.42 5121.04 5607.46
2 1245-41 148.55 1393.96
3 680.50 1430.19 2110.69
4 1401.73 2621.90 4023.63
5 129.08 1389.03 i5i8.ll
6 475.84 1853-73 2329.57
7 610.99 886.85 1497-84
8 211.43 149.65 361.08
9 822.00 1691.81 2513.81
10 38.73 683.40 722.13

146
limitations iha model One of the weak links in the model is the assumption
that the technology remains constant. Though it could be
argued that changes in technology take root rather very
slowly in less developed economies, the planning in the past
has generated certain expansion of industries and the pumping
in of further investment is bound to alter the input mix.
The model does not take care of such possible changes in
input coefficients. However, if definite information of
changes in input coefficients of some strategic industries
are available as a result of surveys, they could be
incorporated in the model without difficulty.
A more important weakness in the model is that there
is only one effective resource restriction, viz.. the capital-
output ratios. Additional restrictions could not be imposed
on the model for want of adequate data. One of the possible
ways to improve the practical utility of the model is to
impose an additional restriction on the employment potential.
Here also, the labor force may be divided into skilled labor
and unskilled labor. In under-developed economies, there is
no scarcity of unskilled labor in view of chronic unemploy
ment and underemployment. What is dear is the skilled labor
and if we could obtain capital-labor ratios of skilled
personnel, it could form an ideal restriction and might
enhance the practical applicability of the model for planning

14?
purposes.
Tlnbergen (1958)» Sand.ee (i960) and Chenery (1958)
have explored the possibility of applying accounting prices
or shadow prices rather than market prices. Tinbergen (1958)
has postulated a hypothesis that market prices of a number of
commodities, particularly those of factors of production, as
capital, labor and foreign exchange, often differ from their
'intrinsic value* or accounting prices. The important reason
for this divergence is attributed to the fundamental dis
equilibrium as widespread unemployment in less developed
economies due to the absence of complementary means of
production. In spite of large scale unemployment, the market
wages are likely to be higher due to activities of the trade
unions and certain welfare measures imposed by the governments.
If we accept that the market rates do not reflect their
intrinsic value, it might be desirable to give different
weights to the maximizing function. While the calculation of
optimum weights is, no doubt, difficult in view of the absence
of data depicting the extent of disequilibrium, certain
approximations could be tried. This approach, it is possible,
might render some of the projects more profitable than at
market prices. This is an important aspect for future workers
to pursue.
Our primary concern has been to develop a linear
programming model within the input-output framework. The

148
data used and the results obtained are, therefore, of
secondary importance. For any meaningful programming solution
the input-output coefficients should be reliable and the
resource constraints should be effective and binding. Capital
is not the only scarce resource in an underdeveloped economy.
Therefore, no claim is laid about the applicability of the
model to actual planning situations. The model is just
illustrative and has to be modified for any specific planning
formulation by the introduction of additional resource and
other constraints.
A Variable Capital Programming Model
It is common knowledge that capital resources for
investment in all less developed economies are very scarce
and most of the developing economies heavily depend on
foreign aid for their economic development. As the develop
ment progresses, there is an aggregate increase in the capital
inputs. For instance, in the United States there has been a
phenomenal increase in the input of capital items for agri
culture. Heady (1962) has estimated that machinery and
equipment used by I960 were three times that of 1940. As
the technology advanced, inputs of capital items, as the new
crop varieties, insecticides, antibiotics, pure-bred animals,
et cetera, had also increased by four to five times in the
last twenty years. So the problem that faces the planners

149
of a country or an individual farmer is to find an optimum
plan, under conditions of varying levels of capital. If a
certain amount of capital is available, then a discrete
optimum can be found assuming clearly defined resource and
price situations. But, when the level of capital availability
is an uncertainty and is linked to forces outside the control
of the planner or the farmer, then a single optimum will not
be meaningful. There is, therefore, the need for optimum
plans for each of a series of different capital levels. In
the variable resource programming, we seek a series of solutions
assuming a different initial level of capital.
Eogio fil variable resource (capital) programming The essential feature of the variable capital program
ming is that capital is always invested in the activity with
the highest marginal product. Or, in other words, every
rupee invested yields the highest possible income and for any
level of capital availability, the amount of income is a
maximum. As the income is a maximum for each level of capital,
the program is an optimum for each of the levels. This type
of variable capital programming is also known as continuous
programming since the assumptions, as Heady (1958) has pointed
out, prevent calculations with increasing marginal products.
If, for example, there is a fixed plant, this investment has
zero marginal product and will not be undertaken until all

150
other investment opportunities have been exhausted.
Modified simnlex procedure
Heady (1958), Candler (1956), Boles (1956) and others
have suggested a modified simplex method for computing
optimum solutions for each of the varying levels of capital.
The modified method allows a planner or a farmer to follow
all the changes in the optimum plan, as the availability of
capital increases from zero to any higher level. As
discussed earlier, the principle again is to invest each
dollar or rupee where its marginal product is highest. If in
the simplex table we could identify the activity with the
highest marginal product, then our problem is solved, since
that row can be selected as the outgoing row. For identifying
the activity with the highest marginal productivity of capital,
we include a new row, which Heady (1958) designates as the
'decision row* in the simplex table. The D (decision row)
is obtained by dividing the negative Z-C row (profit row)
by the appropriate input-output coefficients for capital.
The highest negative element in the new criterion D row is
selected as the activity. For purposes of illustration, we
will take the example provided by Heady (1958)• Instead of
assuming that capital is available at a single level, we will
make the additional assumption that capital is available at
varying levels and seek optimal solutions for each of the
levels of capital availability. An illustrative modified

151
simplex procedure for variable capital is provided in Figure 2.
In the simplex table, we can note some of the important
differences between the ordinary simplex procedure and the
modified simplex method for variable capital (resource)
programming. The resource level, which is considered to vary
is recorded at the zero level. In the present case, capital
is the variable resource, while all the other resources have
fixed levels. An important departure from the normal simplex
method is the calculation of the decision row. The element
in the column P^, for example, is obtained by dividing the
element in the Z-C row, viz.. 220, by the input-output
coefficient of capital for that activity, i.e., 1.1. The
highest element in the decision row (D) denotes the marginal
productivity of capital for that activity is largest. In
the example P«j is the row with highest marginal productivity.
Another deviation from the simplex procedure is in the
computation of B ratio for limiting resources. While in the
normal simplex method, the smallest B is taken as the out
going row, in the modified simplex procedure, the outgoing
row is given by the smallest B ratio "other than capital".
The capital is never selected as the outgoing row. The
result of this will end up in negative levels for capital
in successive iterations. Since capital is not a fixed
resource, the equations for the production possibilities will
not include the activities' requirements for this resource,

152
c -* 0 0 •0 0 0 • 50 -70 70 220 130 5 Z Resource Disposal activities Real sctlvihes
c.' activity Hog
I
1 Rotation Cora Hay level Capital Land housing Hay Corn 2 Caille Hogs selling buying P<fce«h
B P. P. P. P» P» P, P. P. Pt P. P.
0 Capital P, 0 1 0 0 0 0 6 .6 1.1 0 .05 4.35 • ..
0 Land P. 120 0 1 0 0 0 3 4 0 0 0 0 128 0 Hot housing P, 15 0 0 1 0 0 0 0 0 1 0 0 17
0 Kay P., 0 0 0 0 1 0 2 -2.5 .8 1.2 0 -1 2 5 0 Cora ?» 0 0 0 0 0 1 -1.4 -1.5 .5 1.1 (D 0 .1 0
Z-C 0 0 0 0 0 0 50 70 •70 -220 EI10 5 •295
i-r -134 0 0 0 0 0 -49.2 .69.6 68.7 216.6 130 -3.05 148.45
D • • • • • -70 -200 -- •
c pi 0 0 0 0 0 .4 .6 1 1.1 0 .05 4 35 0
0 «- Pi 120 0 1 0 0 0 ® 4 0 0 0 0 128 40
0 P. 15 0 0 1 0 0 0 0 0 1 0 0 17
0 . P.s 0 0 0 0 1 0 2 2 5 .# 1.2 0 -1 2 5
110 -* P. 0 0 0 0 0 -1.4 -1.5 5 1.1 1 0 .7
Z-C 0 0 0 0 0 130 ED3 •125 •5 -77 0 5 •204
i-r -134 132.8 3.7 73.6 •3.03
B • * •220 -206.333 5 -70
0 Pt 24 •J 0 0 0 0 • 4 1 1.1 0 .05 •21.25 • •
.so P, 40 0 .333 0 0 • 0 1 1.333 0 0 0 42.467 0 P, 13 0 0 1 0 0 0 0 0 A - 0 0 17 15 0 P.i 10 0 .666 0 1 0 0 .166 .8 L2 0 82.834 67
no P, 56 0 .466 0 0 0 .366 .5 LI I 0 60.434 51 Z-C 5280 0 43.956 0 0 130 0 $0.956 -5 ŒJ 0 5 5428.044 l -L •3446 3.7 73.6 -3.03
B* D
•3446 • • • • • •3 -70 *
0 S9.3 P» -40.5 -J •1.1 0 0 0 -4 1 0 0 .05 •39.93 ..
•so 40 Pt 40 0 0 0 220 IS P« 15 0 0 1 0- 0 0 0 0 1 0 0 17
0 62 Pit 62 0 .666 •1.2 1 0 0 .166 ® 0 0 62.434 77.5 UO 3*5 Pt 39.3 0 .466 •1.1 0 0 .366 •3 0 1 0 41.734 79
6433 Z-C 6435 0 43.956 77 0 130 0 30.956 GD 0 0 5 6737.044 •6630 l-I -6350 3.7 •3.05
D * * 3
0 P, -116 1 •1.033 .4 -US 0 0 -.408 0 0 0 1.3 -117.992 —
-30 P, 40 0 220 P. 15 0
70 -• P, 77.5 0 833 -1.5 1.25 0 0 408 1 0 0 -145 78.042 130 *- P. .75 0 .05 -.35 -.625 I 0 462 0 0 1 db> 2.713 1.2
Z-C 6622.5 0 48.121 69.5 6 25 130 0 31.996 0 0 0 ELHI 7127.254
l-£ -6836.75 1.575
S • • * • * • • 962
0 Pi •119.56 .50 P» 40 220 P« 15 70 P. 79 3 -» P, IJ 0 .08 .56 -I 1.1 0 .419 0 0 1.6 1 4.341
Z-C 6824 0 48.221 68.8 5 132 0 52.52 0 0 2 0 7132.68 l-I -6638.64
'
70 -* P. 59.5 1 J -1.1 0 0 0 J 1 0 0 .05 60.03 •30 p. 40 0 220 P« 15 • 0
0 p.* 14.4 -.8 130 p. . *75 • 3
Z-C 6732.5 $ 42.956 71.3 0 130 0 49 936 0 0 0 3.25 7037.294
I-X -6870.13 I-X -6870.13
Figure 2. An illustration of variable capital programming

153
but only the requirements of fixed resources and hence the
negative levels for capital are consistent with any feasible
plan. The negative level of capital simply means that if the
capital had been at such and such a level, the plan in that
iteration is feasible. For example, in Section 3 of the
table (Figure 2), capital is -24, which denotes that the plan
is optimum for the capital availability of $2400.
One advantage with a variable resource programming
formulation is the computation of optimum plans of a number
of discrete resource supplies. In the simplex table provided
in Figure 2, the third section describes the optimum plan
for $4050 of capital (since one unit is taken in the example
as $100 of capital). Let us now, say, be interested in a plan
for #1000 of capital availability. Section 5 in the table
will not be feasible since it requires $11,800 of capital.
Now the capital is fixed and so we may select the capital
row if it has the smallest B ratio. B* column in Section 4
shows the level of capital at disposal, i.e. (100 - 40.5 =
59*5)• Excepting for this, the plan of other activities
remains the same. The capital row has the lowest B and is
picked as the outgoing row. The optimum plan for 10,000
dollars of capital is shown in the last section of the
simplex table (Figure 2).
Having discussed the technique of variable capital
programming, let us consider the application of the variable

154
capital programming for a programming formulation within the
input-output framework.
Description the model
For the variable capital programming model, we
have used the nineteen sector table for India for 1960-61
published by the Institute of Public Opinion (Appendix B).
As described earlier in the structural analysis, the first
five sectors in the table are primarily agricultural sectors.
The rest of the sectors may be broadly considered as industrial
sectors.
In any programming formulation, the utility of a model
would entirely depend on its practicability and application to
current pressing problems. In a country like India, with a
population of four hundred and thirty-eight millions of people
(1961), any planning authority would have to give utmost
priority to agriculture for two main reasons. First of all,
the country should strive to produce the minimum output needed
to feed its population at the rate of at least sixteen ounces
per day. Otherwise, food has to be imported from foreign
countries, which would result in a considerable drain of the
foreign exchange resources. Secondly, if agricultural outputs
are not met, then meeting of the targets in other sectors may
well become impossible due to the inefficiency of labor as a
result of discontentment and undernourishment. So, in the
present model, we maximized the profit function giving a

155
weight of 10 for the first five agricultural sectors and a
weight of 0.1 for the rest fourteen industrial sectors.
frQWSr constraints
As for the minimum levels of outputs that have to be
met, it was considered that the levels of outputs at the 1960-
61 would not be meaningful since those targets have been more
or less attained nearly two years ago. In as much as we are
in the second year of the Third Five Year Plan, it is to be
expected that in several sectors, the outputs would now be
higher than the 1960-61 level. In order that the model may
be realistic, the lower bound for output levels were computed
as fifty percent of the difference between the 1960-61 levels
and the 1965-66 levels. For example, the output level for
the wheat and other cereals during 1960-61 was 2214.84 crores
of rupees. The estimated output for 1965-66 is 2879*29 crores.
The increase estimated during Third Five Year Plan in the
output of wheat and other cereals is 664.45 crores. Of this
output, the minimum level was put at 50 percent of the antici
pated increase plus the 1960-61 output level. Thus, the
lower bound for wheat and other cereals was calculated as
2214.84 + 332.22 = 2547.06 crores of rupees. Similarly, the
lower bound was calculated for all the other sectors and is
presented in Column 3 of Table 24. The implication of fixing
the minimum output levels at a level higher than the 1960-61
level is, that even if the worst comes, that is, even if an

156
activity is not profitable, at least some increase would have
been met and will not be merely at the 60-61 level. In the
less developed economies, the interdependence between the
industrial sectors and agricultural sectors is so low, that
one cannot expect the industrial sectors to go up beyond the
proportion needed for agricultural outputs, especially when
we maximize the agricultural sectors with a higher weight
than the industrial sectors.
Vppsr constraints
In the case of the maximum outputs that have to be
attained at the end of the Third Five Year Plan, the output
levels were calculated taking into account the production
capacities that are available, the demand for products
considering the population growth, et cetera. In general, the
projected output levels of the planning commission provided
a valuable guide in arriving at the maximum levels of output
or the upper bounds desired to be attained. To give an idea
of the manner in which output levels were arrived at by the
Planning Commission, the output levels at the end of the Third
Five Year Plan was estimated to increase by thirty percent
over the i96o-6i levels in the case of the agricultural sectors
except for livestock products. For livestock products, the
increase was estimated at twenty percent. In the case of
food manufactures, vegetable oils, construction and jute also,
the estimated increase was around thirty percent. The increase

157
Table 24. Capital-output ratios and upper and lower constraints (outputs in crores of rupees)
Sectors
1
Capital-output ratio
2
Minimum levels
3
Maximum output levels in 1965-66
4
1. Wheat and 1.21 2547.06 2879.29 other cereals
2. Bice 1.21 2413.40 2728.19
3- Industrial ^ M M
1.21 1233.12 1393.96
4. crops Livestock 1.21 1934.80 2110.69 products
3559.36 4023.63 5. Other agricul 1.21 3559.36 4023.63 tural products
849.52 6. Food 0.70 751.50 849.52 manufactures
7. Vegetable oils 0.45 591.44 668.59
8. Wood 1.90 269.98 333.08
9. Jute 0.83 239.39 270.62
10. Textiles 1.01 1205.78 1325.27
11. Leather and 1.90 221.19 279.74 leather goods
12. Fuel and 6.40 1050.28 1104.12 power
265.62 13. Mining 2.40 215.82 265.62
14. Basic metal 2.35 320.99 451.48 industries
2.35
15- Metal products 2.35 1240.15 1745.01
16. Non-metal 1.90 133.99 170.46 products
405.86 17. Chemicals 2.12 274.38 405.86
18. Construction 0.22 636.76 722.13
19. Transport 3.25 934.13 1241.98

158
in sectors, like wood and mining was nearly sixty percent
over the Second Plan targets. The estimated increase in the
leather goods sector and non-metal products was 72 percent.
The increases in both the basic metal industries sector and
the metal products sector were taken at one hundred and thirty
seven percent, as no separate breakdown of these independent
sectors was available. This high increase in these two
sectors is to be expected, since the four big steel plants
are to come into full production during the Third Plan.
Similarly, the increase in chemicals was also estimated at a
high level of one hundred and eighty four percent, since the
fertilizer production and other chemicals is expected to
reach a new high. The targets or the upper bound constraints
that were estimated are presented in Column 4 of Table 24. As
contrasted from the earlier model, the output levels were
calculated in a more detailed manner, checking at every
stage with the Planning Commission's breakdown of estimates
of corresponding sectors.
Papital-owtowt ratios Having computed the maximum levels, viz.. the upper
bounds to be attained, as also the minimum constraints, the
problem was one of maximizing total output subject to the
structural constraints and output levels. An additional
resource constraint was also introduced, since capital is one
of the chief limiting factors in the development of the less

159
developed areas. The capital-output ratios were computed for
all the nineteen sectors. The interpretation of capital-
output ratio may be considered as the amount of capital
required for every unit of output. As the details of industries
that were aggregated in each of the nineteen sectors were not
precisely known, and as the capital-output ratios were not
available for a number of sectors, they were approximated in
several cases. In a programming formulation, Sandee (I960)
had adopted certain capital-output ratios computed by Mukherjee
and Shastry (1959) and these were adopted for most of the
industrial sectors. The Reserve Bank of India had also
estimated the capital-output ratios for vegetable oils, wood,
jute and chemicals and these figures were used with respect
to similar sectors in our table. In the case of agriculture,
capital-output ratios were estimated by dividing the total
capital stock estimated for agriculture with the domestic
product for agriculture. This was the nearest approximation
that could be made with the figures available at our disposal.
The capital-output ratios for the nineteen sectors are given
in Column 2 of Table 24.
It may be appropriate here to discuss briefly the
concept of capital-output ratios. The amount of fixed capital
needed to produce a unit of a commodity is generally known as
the capital-output ratio of the production in question.
Capital-output ratios are expressed in gross terms or in net

160
terms. It is also expressed as value added or as contribution
to national income, in which case, it expresses certain degree
of netness. For our model, we have assumed that the capital-
output ratios are based on gross output. A further assumption
is that all the productive capacity is fully utilized and the
new output, between 1960-61 and 1965-66, will have to come
from the new capacity. It is also assumed that the normal
level of inventories held is proportional to the output level
and that a constant stock-output ratio is maintained. Sendee
(i960) has discussed the inherent deficiencies of the capital-
output ratios and has stated that the valuation of assets is
a difficult problem. Again, the concept of full utilization
is a vague concept and could lend itself to different inter
pretations.
Total jjiveistMfr jua iiia Flan aerlod
In our model, the total capital needed to produce
the minimum levels of output (Column 3 of Table 24) amounted
to 26933-49 crores of rupees. The outlay for investment
during the Third Plan is estimated at 10,000 crores of rupees.
Out of this total outlay, more than fifty percent is to come
by way of foreign loans and aid. If for certain reasons
outside the control of the planners this anticipated outlay
does not become available, then arises the problem of pruning
of the targets and setting up of priorities. In such a setting
the planner is interested in finding the optimal solutions for

161
different levels of capital availability. The variable
capital programming provides optimal answers for such a
predicament.
Mathematical fccnmlatloa lbs linear program The mathematical formulation of linear programming
may be expressed as
5 19 Maximize P = 10 E X, + 0.1 E X,
j=l 3 j=6 J
subject to
allxl + a12x2 + ••• + al,19x19 - xl
a21Xl + a22X2 + ••• + a2,19X19 - X2
(5-18)
a19,lXl + a19,2x2 * •** + a19,19X19 - X19
b]_X^ bgX2 **" » • • b^^Xjç £ K
Xi-19 < Max Xj^-2-9 ( 1 ~ 201 211 *..« 38)
xi-38 * Min xi-38 (i = 39, 40 57)
Xi > 0
where X is the output level at the end of the Third Plan
period, a^j's are input-output coefficients for the year

162
1960-61 and are shown in Table 25, and it is assumed that the
technology remains constant over the planning horizon. The
bj^'s are capital-output ratios indicated in Column 2 of Table
24 and K is the total capital available for investment
between 1960-61 and 1965-66. In this model, a weight of 100
for the agriculture sectors and a weight of 1 to the industrial
sectors has been given. Assuming that the planners are
interested in maximizing agricultural sectors, which are
crucial to the development of the other sectors in a predomi
nantly agricultural economy, higher weights were given for the
agricultural sectors. Max (i = 20, 21, ..., 38) are
the upper constraints of targetted output levels indicated
in Column 4 of Table 24 and Min Xi-38 (i = 39, 40, ..., 57)
are the lower bounds or minimum constraints given in Column 3
of Table 24.
The system described in Equation 5»18 can be written
including the slack variables, which would render the
inequalities as equalities, as in Equation 5*19, where Y^
is the final demand, which is obtained as a slack and the
slacks p^'s show the disposals for maximum and minimum
constraints, c is the slack variable for capital.
Table 26 describes the optimum outputs (Column 2)
and final demand (Column 3)• Column 4 indicates the amount
by which the upper constraint is not met. Column 5 denotes
the amount by which output has increased over the lower

163
Table 25. Input-output coefficients
Sec-torsa
1 2 3 4 5
1 .056428 - - - -
2 .002546 .040012 .001884 .014731 .001179
3 - .001439 .059509 - -
4 .019911 .021014 .011843 .055608 .017996
5 .052275 .028786 - .305581 .069943
O
7 .002357 .001344 - .013901 .001024
8 .001038 .001053 - - .004850
9 .007644 .007290 .008179 - .002239
10 - - - - -
11 - - - - -
12 .000190 .000386 - - .002239
13 - - - - -
14 - - - - -
15 - .000095 - - .001864
16 - - - - -
17 ,000470 .000481 - - .001864
18 - .000095 - - -
19 .015288 .009020 .040335 .009114 .020141
^Sectors 1 to 19 are the same as described in Table 24, p. 157.

164
Table 25 (Continued)
Sec— torsa
6 7 8 9 10
1
0
.040629 - - - .002126
C
3 .293673 .597997 - .574242 .224811
4 .098993 - .001305 - .020934
5 .029044 .065954 - - -
6 .056849 - - - .001151
7 - - - - .000359
8 .000842 .000292 .100783 .004660 .006030
9 .010375 .002605 - .002594 .003019
10 - - - .001777 .112585
11 - - .002320 .001201 .001068
12 .019327 .005794 .010151 .015948 .013394
13 - - - - -
14 — - - - -
15 .006687 .016586 .009377 .022914 .013836
16 .005662 - - - -
17 .004015 .002294 .033788 .010520 .009408
18 .00358i .007389 .001208 .010232 .001951
19 .032151 .015283 .092179 .035067 .013578

165
Table 25 (Continued)
Sec 11 12 13 14 15 tors3
13 15
1 mm - » -
2 - .082924 - - -
3 - - - - -
4 .257501 .124873 - - -
5 - - - -
6 - .000783 - - -
7 .007932 - - - -
8 .032403 .026564 - .000787 .001969
9 - - - .001260 .000095
10 - - - - -
11 .032403 - - - -
12 .085957 .011180 .018311 .114593 .005623
13 - - .016685 .143097 -
14 - .000492 - .001365 .186692
15 - .013819 .014336 .028136 .057396
16 - - - - .002621
17 .028345 - - .005774 .009181
18 - .003723 - .006929 -
19 .021151 .063616 .171967 .135590 .026036

166
Table 25 (Continued)
Sectors3
16 17 18 19
1 _ — _ —
2
O
- - - .008364
4 - - - —
5 .005582 - - .173148
6 - .003219 - -
7 - .111469 - .007883
8 .002436 .049612 .077747 .019219
9 .081599 .002099 - -
10 - - - .000379
11 - - - .001544
12 .130620 .098943 .055694 .041775
13 .085659 .017004 .017864 -
14 - .008257 .028437 .009325
15 .113671 .042194 .056583 .106952
16 - .008117 .152104 -
17 .031462 .074592 .015869 .001821
18 .068304 .006438 - .005668
19 .194052 .048702 - .004998

Max P = 10%i + 10X2 + ... + 10X5 + 0.1X5 + O.IX7 + ... + 0.1X19
subject to
^1"all^Xl " a12X2 " a13X3 al,19X19 " Y1 °
-»21X1 + (l-a22)X2 " a23X3 a2,19*19 -Y2 = °
-a31Xl " a32X2 +(1-a33)X3 *3,19*19 " S = °
(5.19) ON
"a19,lXl " a19,2x2 " a19,3X3 ~ " + (1-a19,19)X19 " Y19 °
™blxl - b2X2 " b3X3 - b1QX10 - c -K
X _ 9 * Pi„i9 — Max X _ g (i — 20, 21, •.., 3®)
Xi.38 " Pi-38 = Min Xi-38 ~ 39, 40, ..., 57)
Xi > 0

168
Table 26. Optimal solution for investment at 6000 crores or capital stock at 32933.49 crores of rupees
Optimum Final Upper Increase in output demand bound output over levels not met and above
minimum output levels
1 2 3 4 5
1. Wheat and 2812.10 2620.32 67.19 265.04 other cereals
2620.32
2. Bice 2413.40 2176.91 314.79 -
3. Industrial 1233.12 173.35 160.84 -
crops 4. Livestock 2110.69 1519.86 - 175-89
products 1519.86
464.27 5. Other 3559.36 2220.43 464.27 -
agriculture 705.68 98.02 6 • Food 751.50 705.68 98.02 -
manufacture 7. Vegetable oil 591.44 508.21 77.15 -
8. Wood 269.98 91.11 63.IO -
9. Jute 239.39 156.61 31.23 -
10. Textiles 1205.78 1069.24 119.49 -
11. Leather 221.19 210.33 58.55 -
12. Fuel and 1050.28 801.33 53.84 power
49.81 13. Mines 215.82 138.77 49.81
14. Basic 320.99 59.05 130.49 _
metal 15. Metal 1240.65 930.45 504.36 -
16. products
36.47 16. Non-metals 133.99 27.40 36.47 -
17. Chemicals 274.38 181.85 131.48 -
18. Construction 636.76 601.82 85-37 -
19. Transport 964.13 447.24 277.85 -

169
constraints. It would be seen that outputs of wheat and
other cereals has Increased by 265.04 crores of rupees and
livestock products by 175*89 crores of rupees# Even in the
case of wheat, the output is lower by 67.19 crores of rupees
than the maximum level. In all the other 17 sectors, outputs
are at their minimum. The situation implies that the
capital of six thousand crores of rupees is just sufficient
to meet the increases in livestock and wheat and other
cereals. With an investment of 6000 crores of rupees, only
a little over fifty percent of the increase of output levels
can be reached, since our minimum constraints were calculated
as fifty percent of the difference between 1960-61 output
levels and 1965-66 output levels plus the output levels
attained in 1960-61. Now, we proceed to find out the output
levels that could be met at the next higher level of capital
availability. The optimum levels obtained after thirty-eight
iterations at an investment level of 7218.58 crores of rupees
or the total capital stock of 34152.07 crores of rupees are
presented in Table 27.
From Table 27 it would be seen that the" maximum
output levels of all the five agricultural sectors are met
with the investment level at 7218.52 crores of rupees. This
plan indicates the capital investment required to meet the
maximum targets for the five agricultural sectors and the
minimums in the other fourteen industrial sectors, viz.,

l?0
Table 27. Optimal solution for Investment at 7218.58 crores or total capital stock at 34152*07
Optimum output levels
Final Upper demand bound
not met
Increase in output over and above the minimums
5
1. Wheat and 2879.29 2683.72 332.23 other cereals
2. Bice 2728.19 2478.09 314.79
3- Industrial 1393.96 324.16 160.84 crops
2110.69 1501.64 4. Livestock 2110.69 1501.64 - 175.89 products
4023.63 2639.66 464.27 5. Other agri 4023.63 2639.66 - 464.27 cultural crops
705.68 6. Food 751.50 705.68 98.02 -
manufactures 7. Vegetable 591.44 507.15 77.15
oils 8. Wood 269.98 88.47 63.10 -
9. Jute 239.39 151.45 31.23 -
10. Textiles 1205.78 1069.24 119.49 -
11. Leather 221.19 210.33 58.55
12. Fuel and 1050.28 800.15 53.84 power
13. Mines 215.82 138.77 49.81 -
14. Basic 320.99 59.05 130.49 metals
15. Metal 1240.65 929.55 504.36 -
16. products
27.40 36.47 16. Non-metals 133.99 27.40 36.47 -
17. Chemicals 274.38 180.80 131.48 -
18. Construction 636.76 601.79 85.37 -
19- Transport 964.13 427.54 277.85 -

171
fifty percent of the estimated increase in the Third Five
Year Plan period. In other words, the fourteen industrial
sectors enter the solution at their minimum output levels
and the five agricultural sectors at their maximum output
levels.
The next plan considered is at an investment level
of 8775*12 crores of rupees. This feasible plan was
obtained after forty-eight iterations. The optimal output
levels and final demands are presented in Table 28. At this
level of investment, excepting the five sectors, viz.. fuel
and power, mines, basic metals, metal products and transport,
all the other sectors enter the solution at their maximum
levels. In the case of the five sectors, the outputs are
at their minimum. One interesting aspect that may be noted
from Table 24 is that the capital-output ratios of these five
sectors, which enter at their minimums, are all fairly high.
Therefore, if they are to be brought at their maximums
higher weights may have to be assigned these sectors
depending on their strategic importance in the course of
the development of an economy.
We had so far considered the optimum levels of
output at three intermediate levels of investment. If the
entire outlay of 10,000 crores was available during the
Third Plan period, then what will be the levels of output
that would be met with the available capital investment?

172
Table 28. Optimal solution for investment at 8775*12 crores or total capital stock at 35708.61 crores of rupees
Sector
1
Optimum output levels
2
Final demand
3
Upper bound not met
4
Increase in output over and above the minimums
5
1. Wheat and 2879.29 2679.48 332.23 other cereals
2. Bice 2728.19 2478.09 - 314.79
3. Industrial 1393.96 204.45 160.84 crops
2110.69 4. Livestock 2110.69 1474.28 175-89 products
2631.52 464.27 5. Other agri 4023.63 2631.52 - 464.27 cultural crops
6. Food 849.52 797-57 - 98.02 manufactures
7. Vegetable 668.59 - 569.14 - 77.15 oils
8. Wood 333.08 128.50 - 63.IO
9. Jute 270.62 177.74 - 31.23
10. Textiles 1325.27 1175.22 - 119.49
11. Leather 279.74 266.67 - 58.55
12. Fuel and 1050.28 765-84 53-84 —
power 13. Mines 215.82 131.88 49.81 -
14. Basic 320.99 — 130.49 •
metals 15. Metal 1538.14 1190.55 206.87 297.49
16. products
170.46 16. Non-metals 170.46 48.48 - 36.47
17. Chemicals 405.86 291.43 131.48
18. Construction 722.13 682.27 85-37
19. Transport 964.13 392.20 277.85 -

173
Table 29. Optimal solution for investment at 10,000 crores or total capital stock at 36933*49 crores of rupees
1
Optimum output levels
2
Final demand
3
Upper bound not met
4
Increase in output over and above the minimums
5
1. Wheat 2879.29 2679.48 - 332.23
2. Bice 2728.19 2477.28 - 314.79
3- Industrial 1393.96 204.45 - 160.84 crops
4. Livestock 2110.69 1474.28 - 175.89 products
2614.87 464.27 5- Other agri 4023.63 2614.87 - 464.27 cultural crops
6. Food 849.52 797-57 98.02 manufactures
7- Vegetable 668.59 568.38 77.15 oils
8. Wood 333.08 126.14 - 63.IO
9. Jute 270.62 177.56 31.23
10. Textiles 1325.27 1175.18 119.49
11. Leather 279.74 266.52 58.55
12. Fuel and 1050.28 744.80 53-84 —
power 265.63 162.19 13- Mines 265.63 162.19 - 49.81
14. Basic 451.48 90.79 130.49 metals
15- Metal 1745.01 1370.88 - 504.36
16. products
36.47 16. Non-metals 170.46 47.94 - 36.47
17. Chemicals 405.86 288.60 - 131.48
18. Construction 722.13 68O.83 - 85.37
19. Transport 1060.29 456.24 - 96.16

174
The optimum plan under such a situation is presented in
Table 29. It would be seen from the table that all the
sectors except fuel and power enter at their maximum levels.
The fuel and power output would be only half of the targetted
increase in the Third Plan, since it enters the final solution
at its minimum level. The upper bound of fuel and power
sector is not met by 33.84 crores of rupees. As the capital
output ratio is 6.4 for the fuel and power sector, a capital
of (53*84 x 6.4) 344.6 crores of rupees is needed in addition
to the 10,000 crores of outlay estimated in the plan, if that
sector is also to reach the maximum targetted.
Table 3° describes more or less the investment map
the planner will have to follow for optimum allocations for
varying levels of capital availability. The figures presented
in the table are percentages and the total availability of
capital is indicated at the top of the table. It can be seen
that investment in the metal products (Sector 15) should be
19*75 percent when capital for investment is available at
6000 crores, 16.41 percent at 7218.58 crores and 23.70
percent at 10,000 crores of rupees. It is interesting to
note that 38.07 percent of the investment has to be in the
first five agricultural sectors at 6000 crores of capital
availability and 35*04 percent when capital is available
at 10,000 crores of rupees.
The above program could also be modified if the

175
Table 30. Optimum allocation of capital in the different sectors at varying levels of capital availability
At 6000 crores
7218.58 crores
8775.12 crores
10,000 crores
1. Wheat and 12.04 11.13 9.16 8.04 other cereals
11.13
2. Bice 6.35 10.55 8.68 7.62
3. Industrial 3.24 5-39 4.44 3.89 crops
4.26 4. Livestock 7.09 5-89 4.85 4.26 products
15.56 5- Other agri 9.35 15.56 12.79 11.23 cultural products
6. Food 1.14 0.95 1.57 1.37 manufactures
7. Vegetable 0.58 0.48 0.79 0.69 oils
8. Wood 2.00 1.66 2.97 2.61
9. Jute 0.43 0.36 0.59 O.52
10. Textiles 2.16 1.80 2.75 2.41
11. Leather and 1.85 1.54 2.53 2.23 leather goods
2.53 2.23
12. Fuel and 5.74 4.77 3.93 3.44 power
I.65 1.36 13. Mining 2.00 I.65 1.36 2.39
14. Basic metal 5.11 4.25 3.49 6.13 industries
4.25 3.49 6.13
15. Metal 19.75 16.41 21.48 23.70
16. products
19.75
0.96
23.70
16. Non-metal 1.15 0.96 1.58 1.38 products
17. Chemicals 4.64 3.86 6.35 5-58
18. Construction 0.31 0.26 0.43 O.38
19. Transport 11,94 12,.51 1ûjl?9 13,li
Total 99.97 99.98 100.03 100.03

176
objective of the planners is to maximize certain industrial
sectors, which are considered to be the core of the plan.
The weights in the maximizing function could be altered to
suit the objectives of the planners and the same model could
provide an optimum under the changed ideals. Unlike the
aggregate models, this simple model provides sectoral
requirements for the 19 sectors in the Indian economy. The
model could be easily extended to the 1955-56 table contain
ing 36 sectors of the economy. Additional resource restric
tions will greatly enhance the applicability of the model
to practical planning problems.
Primal aM the dual
The general equilibrium where the value of outputs
are maximized can be written as
Maximize p^X^ + + ••• + PnXn
subject to
allXl + a12X2 + + alnXn - rl
a21xl + a22X2 + ••• + a2nXn - r2
(5 .20)
amlXl + am2X2 + "• + Wn * rm
> 0

177
where is the price of output and a^j's are input
coefficients and r^'s activity levels.
In the maximizing problem, the value of total output
(price x output) is maximized. The dual of the maximizing
problem is minimizing costs, which can be written as
Minimize r1V1 + r2V2 + ... + rmVm
subject to
^ll\ 2 " ^ Pi
a12Vl + a22V2 + ••• + m2^m - P2 (5-21)
alnVl + a2nV2 + • • • + amnVm * Pn
Vi > 0
In the dual or the minimizing case the minimizing
function denotes that the total factor income should be the
least. Thus, the dual problem is to find the values for the
scarce resources such that the total value of resources or
incomes is the minimum consistent with no activity having
unimputed surplus. According to one fundamental theorem
in linear programming, a linear program has a solution if
both the primal and its dual are feasible. Therefore, if we
can find an equilibrium or optimal solution for the outputs

178
y
of the general equilibrium, then there is solution also for
factor returns. Economic theory also tells us that the
demand and supply functions are such as to force this
equality. In the words of Dorfman, Samuelson and Solow (1958)»
there is hidden in every competitive general equilibrium system
a maximum problem for value of output and a minimum problem
for factor returns.
In our formulation of the maximizing problem in
System 5*18 outputs are maximized. One can also formulate
its dual in which the optimum will yield the equilibrium
prices as can be seen from System 5*21. Time and funds
prevented us from getting the solution for the dual. Since
our purpose is to mainly provide a theoretical model,
empirical verification is only secondary. However, the
shadow prices obtained from the solution of the variable
capital programming model are presented in Table 31.
It would be seen from the table that the shadow
prices of the agricultural sectors, for which a weight of
100 was given, are around 9.9, while the industrial sectors,
with a weight of 1, range from 0.026 in the case of mining
to 0.097 in the case of fuel and power. One of the reasons
for the fuel and power sector entering the solution at its
minimum is probably the high imputed price for that sector.
A more realistic approach might be to try the actual price
indices for the different sectors with the input-output table

179
/ /
Table 31. Imputed values or shadow prices for the different sectors
Sectors At 10,000 crores
At 8775.12 crores
1. Wheat and other cereals 9.9628 9.9485
2, Rice 9.9628 9.9485
3- Industrial crops 9.9628 9.9485
4. Livestock and products 9.9628 9.9485
5. Other agricultural products 9.9628 9.9485
6. Food manufactures 0.0785 0.0702
7. Vegetable oils 0.0861 0.0808
8. Wood 0.0415 0.0191
9. Jute 0.0745 0.0647
10. Textiles 0.0665 0.0536
11. Leather and leather goods 0.0415 0.0191
12. Fuel and power -0.0969 -0.1723
13. Mining 0.0261 -0.0021
14. Basic metal industries 0.0277 -
15. Metal products 0.0277 -
16. Non-metal products 0.0415 0.0191
17. Chemicals 0.0347 0.0098
18. Construction 0.0932 0.0906
19. Transport - -O.O383
Capital 0.0308 0.0425

180
computed at producers' prices rather than work with a table
computed at market prices, since the ratio between the prices
of different sectors may not remain constant over time.
Before concluding, we would like to stress that the
variable capital programming model has the same limitations
described for the earlier model. Absence of data did not
permit us to extend the scope of the model. In the face of
all the deficiencies, the model does indicate to the planner
the optimum capital allocations to the different sectors,
assuming that agricultural production should be met at the
end of the Third Plan.

181
SUMMARY
This study, besides briefly reviewing the nature of
input-output work carried on in the different parts of the
world, considers the important differences between the
partial analysis and the input-output approach. The
essential similarities and differences between the Leontief's
input-output system and the general equilibrium are also
considered.
The macro economic growth models, as the Harrod-
Domar model and the Mahalanobis' Planning Model for India
are discussed with a view to showing how the aggregate
growth models have close conceptual similarity to the
dynamic input-output system. The major departure between
the aggregate models and the Leontief's model is that the
global coefficients of the former models are disaggregated
into sectoral coefficients in the latter system. We have
also discussed at length the programming formulations of the
Mahalanobis' model by Uma Datta (1961) and Komiya (1959)
since the introduction of choice leads to optimal solutions
and renders the Mahalanobis' model more operational, which
is otherwise deterministic. The Short Term Planning Model
for India developed by Padma Desai (1961) and the long term
Demonstration Planning Model for India projected by Sandee
within the input-output framework are considered to demonstrate

182
the usefulness of input-output data for building models to
aid economic development.
In this study, we have discussed some of the problems
inherent in the aggregation of sectors and have also considered
the conceptual background for the inter-indus try table pub
lished by the Indian Statistical Institute. Nature of data,
sources and estimation procedures have also been touched upon.
In the empirical part of the study, a structural
analysis of the Indian economy has been made using the nineteen
sector input-output projection for 1960-61. The types of
productive sectors of the Indian economy have been classified
by type of input and by use of output after Chenery and
Watanabe (1958) into (l) intermediate primary production,
(2) intermediate manufacture, (3) final manufacture and
(4) final primary production. Such a classification for the
Indian economy is compared with those of Italy, Japan and the
United States of America.
By using the inverse matrix (I - A)~^, we have computed
the output-composition needed to support the different final
demand vectors, as exports, government and private consumption
and investment. In the developing economies, efforts are
directed towards replacing the imported goods with products
of indigenous origin. The estimated changes in the output-
composition to substitute imports have been indicated. The
amount of primary and purchased inputs required by the

183
different sectors and their implications in economic inter
dependence have also been discussed.
Another aspect of the empirical analysis is the
programming formulation of the open Leontief system. In
India during the Third Five Year Plan, a sum of ten thousand
crores is estimated to be invested for the development of the
agricultural and industrial sectors. The 19 sector table was
aggregated to 10 sectors and output levels at the end of the
Third Plan were estimated from the figures provided by the
Planning Commission (1961). Capital was considered to be the
scarce resource and capital-output ratios were built up for
the 10 aggregated sectors. The programming problem was one
of maximizing output or national income subject to resource
and structural constraints. The simplex solution indicated
that all the maximum outputs, except that of power and
transport, could be met with the proposed investment of ten
thousand crores of rupees.
Out of the total investment of ten thousand crores of
rupees, more than fifty percent of the capital is anticipated
from outside sources, as foreign investments, foreign aid,
and loans. Assuming that the country is not in a position
to secure the foreign capital as expected, then the planners
are faced with the problem of allocating the available
capital in an optimal manner. In a country like India,
agricultural targets are essential and have to be met before

184
one could think of increasing targets in the industrial
sectors. So higher weights were assigned for the agricultural
sectors and a variable capital programming was run to find
the optimum output levels at different discrete levels of
capital availability. The optimum output levels at 6000,
7218.58, 8775*12 and 10,000 crores of rupees are presented
in Table 26 to 29.

185
ACKNOWLEDGMENTS
The author expresses deep appreciation to Dr.
Earl 0. Heady for his keen interest and guidance throughout
the period of graduate study and in the preparation of this
manuscript. The author considers it a rare privilege to have
been associated with Dr. Heady, an international authority in
agricultural economics, and is grateful for the inspiration
he drew from Prof. Heady. Also, the author is greatly
indebted to Professors William B. Murray, George M. Seal,
Erik Thorbecke and Frank Biecken, members of the graduate
committee, for their guidance and constructive suggestions
during the course of the graduate study.
To Dr. Karl A. Fox and Dr. Gerhard Tintner, thanks
are due from the author for the encouragement and help
received from them. /
The programming computations of this study would
not have been possible but for the facility afforded by Mr.
Henry Hibshman of the Esso Research and Engineering Co.,
New Jersey and the author heartily thanks him for the timely
help. The author also appreciates the assistance rendered by
Mr. Dale Grosvenor in the different stages of the computation.
Finally, the author expresses his gratitude to
Dean Krishnamurthi for affording the opportunity for this
graduate study and to the Government of Madras, the University

186
of Tennessee and the Technical Cooperation Mission for the
financial support.

187
LITERATURE CITED
Aitken, A. C. 1951. Determinants and matrices. 7th ed. Edinburg and London, Oliver and Boyd.
Anderson, R. L. and Bancroft, T. A. 1952. Statistical theory in research. New York, N. Y., McGraw-Hill Book Co., Inc.
Artie, Roland. 1959* Studies in the structure of Stockholm economy. Stockholm, Business Research Institute, Stockholm School of Economics.
Balderston, J. 1954. Models of general economic equilibrium. In Morgenstern, Oscar, ed. Economic activity analysis-pp. 3-41. New York, N. Y., John Wiley and Sons, Inc.
and Whitin, T. M. 1954. Aggregation in the input-output model. In Morgenstern, Oscar, ed. Economic activity analysis, pp. 79-144. New York, N. Y., John Wiley and Sons, Inc.
Barna, Tibor, ed. 1956. The structural interdependence of the economy. New York, N. Y., John Wiley and Sons, Inc.
Barnett, H. J. 1954. Specific industry output projections in National Bureau of Economic Research, long range economic projection. Princeton, N. J., Princeton University Press.
Barone, E. 1938. The ministry of production in the collectivist state. In Hayek, F. A., ed. Collectivist economic planning, pp. 254-290. London, George Routledge and Sons, Limited.
Bauchet, Pierre. 1955» Les tableaux economiquisi analyse de la region Lorraine. Paris, Genin.
Boles, J. N. 1956. Shortcuts in programming computations. J. Farm Econ. 4: 981-990.
Candler, Wilfred. 1957• Linear programming with stochastic yields. Unpublished Ph.D. thesis. Ames, Iowa, Library, Iowa State University of Science and Technology.

188
. 1956. A modified simplex solution for linear programming with variable capital restrictions. J. Farm Econ. 4; 940-955»
Carter, Harold 0. 1958. Regional input-output analysis of agriculture and industry. Unpublished Ph.D. thesis. Ames, Iowa, Library, Iowa State University of Science and Technology.
and Heady, Earl 0. 1959« An input-output analysis emphasizing regional and commodity sectors of agriculture. Iowa Agr. Expt. Sta. Res. Bui. 469.
Cassel, Gustav. 1932. Theory of social economy. New York, N. Y., Harcourt Brace and Company, Inc.
Chakravarthi, A. K. 1961. On some aspects of the structure of the Indian economy. Paper presented at the International Input-Output Conference on Input-Output Techniques. Geneva.
Chakravarty, S. 1959. The logic of investment planning. Contributions to economic analysis XVIII. Amsterdam, North Holland Publishing Company.
Chenery, H. B. 1953* Regional analysis in the structure and growth of the Italian economy. (Published in Italian in L'Industria) 1:3-26.
__________ and Clark, P. G. 1959. Interindustry economics. New York, N. Y., John Wiley and Sons, Inc.
________ and Watanabe, T. 1958. International comparisons of the structure of production. Econometrica 4: 487-521.
Christ, Carl. 1955» A review of input-output analysis. In Input-output analysis: an appraisal. Studies in income and wealth, Volume 18. A report of the National Bureau of Economic Research, New York, pp. 137-149* Princeton, New Jersey, Princeton University Press.
Clark, Colin. 1951* The conditions of economic progress. 2nd ed. London, Macmillan and Company.
Cornfield, J., Evans, W. D. and Hoffenberg. 1947. Full employment patterns, 1950. Monthly Labor Review 2:163-190 and 3:420-432.

189
Dantzig, G. B. 1949» Maximization of linear form whose variables are subject to linear inequalities. Headquarters U. S. Air Force. The comptroller. Washington, D. C. (Mimeographed).
Derwa, Leon. 1957* Une nouvelle methode d'analyse de la structure économique. Belgium, Revue du Consiel Economique Wallon.
Domar, Evsey. 1957» Essays in the theory of economic growth. New York, N. Y., Oxford University Press.
Dorfman, R., Samuelson, P. and Solow, R. M. 1958. Linear programming and economic analysis. New York, N. Y., McGraw-Hill Book Company, Inc.
Dresch, F. W. 1938. Index numbers and the general economic equilibrium. Bulletin of the American Mathematical Society 44: 134-141.
Fox, K. A. 1953* A spatial equilibrium model of the livestock-feed economy in the United States. Econometrica 4:547-566. .
__________ and Sengupta, J. K. 1961. Uses of the input-output and related techniques in partial analysis: the agricultural sector. Paper presented at the International Conference on Input-Output Techniques. Geneva (Mimeographed). U. N. Statistical Office, New York, N. Y.
Fisher, W. D. 1958. Criteria for aggregation in input-output analysis. Review of Economics and Statistics 3:250-260.
Goodwin, R. M. 1953» Static and dynamic linear general equilibrium models. Input-output relations. Proceedings of a conference on interindustrial relations held at Driebergen, Holland, pp. 5 -98. ed. The Netherlands Economic Institute, H. E. Stewfert Kroese. Leiden.
and Sengupta, S. £a. 1953* Interindustry table for 1950-51* Calcutta, Indian Statistical Institute.
Haldane, J. B. S. 1955* The maximization of national income. Sankhya, The Indian Journal of Statistics 16: 1-2.

190
Harrod, R. F. 1948. Towards a dynamic economics. London, Macmillan and Go.
Hawkins, D. and Simon, H. A. 1949» Note: some conditions of macro economic stability. Econometrica 17î 245-248.
Heady, Earl 0. 1962. Agricultural policy under economic development. Ames, Iowa, Iowa State University Press.
. 1961. Uses and concepts in supply analysis. In Heady, E. 0., Baker, C. B., Diesslin, H. G., Kehrberg and Staniforth, S., eds. Agricultural supply functions, pp. 3-28. Ames, Iowa, Iowa State University Press.
_________ and Candler, W. 1958. Linear programming methods. Ames, Iowa, Iowa State University Press.
Henderson, J. M. 1958. The efficiency of the coal industry. Cambridge, Massachusetts, Harvard University Press.
Hicks, J. R. 1946. Value and capital. 2nd ed. London, Oxford University Press.
India. £&. i960. Input-output projections for 1960-61. New Delhi, Institute of Public Opinion.
. 1957* Interindustrial relations in the Indian Union. Paper presented by the Indian Statistical Institute at the Conference on Research in National Income. New Delhi.
. 1952. The national sample survey—no. 2. Department of Economic Affairs, Ministry of Finance, Government of India.
. 1956. Second five year plan. Planning Commission, Government of India. New Delhi.
___________ 1961. Third five year plan. Planning Commission, Government of India. New Delhi.
Isard, W. 1951* Inter-regional and regional input-output analysis. The Review of Economics and Statistics 4: 318-328.

191
. 1953* Some empirical results and problems of regional input-output analysis. In Leontief, W., ed. Studies in the structure of the American economy, pp. 116-184. New York, N. Y., Oxford University Press.
Japan. 1958. Inter-regional input-output table for the Kinki area and the rest of Japan. Bansai Economic Federation, Osaki.
Keynes, John Maynard. 1935» The general theory of employment. Employment, interest and money. New York, N. Y., Harcourt Brace and Company, Inc.
Klein, L. R. 1946. Macroeconomics and the theory of rational behavior. Econometrica 14; 93-108.
Komiya, Ryutaro. 1959» A note on Professor Mahalanobis' Model of Indian Economic Planning. The Review of Economics and Statistics 1:29-36.
Koopmans, T. 1957» Analysis of production as an efficient combination of activities. In Koopmans, T., ed. Activity analysis of production and allocations, pp. 33-97» New York, N. Y., John Wiley and Sons.
Leontief, W. 1956. Interregional theory. In Leontief, W., ed. Studies in the structure of the American economy, pp. 93-115» New York, N. Y., Oxford University Press.
. 1949* Recent developments in the study of interindus trial relations. Papers and proceedings of the American Economic Association, p. 216. Evanston, Illinois.
. 1951» The structure of the American economy, 1919-1939. 2nd ed. New York, N. Y., Oxford University Press.
__________ and Members of the Harvard Economic Research Project. 1953» Studies in the structure of the American economy. New York, N. Y., Oxford University Press.

192
Mahalanobis, P. C. 1955» The approach of operational research. Sankhya, The Indian Journal of Statistics 16: 3-62.
. 1953» Some observations on the process of growth of national income. Sankhya, The Indian Journal of Statistics 12: 307-312.
Marshall, Alfred. 1920. Principles of economics. 8th ed. London, Macmillan.
May, K. 194?. Technological change and aggregation. Econometrica 15i 303-313.
Moore, H. L. 1929. Synthetic economics. New York, N. Y. The Macmillan Company.
Moses, L, N. 1955» The stability of interregional trading patterns and input-output analysis. American Economic Review 5: 803-832.
Mukherjee, M. and Shastry, N. S. R. 1959. Estimate of the tangible wealth in India. Income and Wealth Series VIII. pp. 365-387» London, Bowes and Bowes.
Neisser, H. and Modigliani, F. 1953» National incomes and international trade. Urbana, Illinois, Illinois University Press.
Netherlands. 1954. Amsterdam Municipal Bureau of Statistics, Stedeligke jaarkeningen van Let Bureau van Statistick du Germeente, Amsterdam. Supplement 4.
Padraa, Desai. 1961. A short-term planning model for the Indian economy. The Review of Economics and Statistics 2: 186-193»
Pareto, Vilfredo. 1911. Manuel d1Economic Politique. V. Girard et E. Briere, Paris, 1907 and Economie Mathématique, Encyclopedic des Sciences Mathématiques, Paris.
Patel, Surendra J. 1961. Observations on the Third Five Year Plan. Working paper, Indian Statistical Institute. Calcutta.

193
Peterson, G. A. 1953* Use of input-output analysis in estimating the interdependence of agriculture and other economic sectors. Unpublished Ph.D. thesis. Ames, Iowa, Library, Iowa State University of Science and Technology.
__________ and Heady, Earl 0. 1955* Application of input-output analysis to a simple model emphasizing agriculture. Iowa Agr. Expt. Sta. Bes. Bui. 427.
Quesnay, Francois. 1894. Tableau économique. London, reproduced in facsimile for the British Economic Association. (First printed in 1758).
Samuelson, P. A. 1957* Abstract of a theorem concerning substitutability in open Leontief models. In Koopmans, T., ed. Activity analysis of production and allocation, pp. 142-146. New York, N. Y., John Wiley and Sons, Inc.
. 1948. Foundations of economic analysis. Cambridge, Massachusetts, Harvard University Press.
Sandee, J. I960. A demonstration planning model for India. Bombay, Asia Publishing House.
Schnittker, John Alvin. 1956. Application of input-output analysis to a regional model stressing agriculture. Unpublished Ph.D. thesis. Ames, Iowa, Library, Iowa State University of Science and Technology.
and Heady, Earl 0. 1958. Application of input-output analysis to a regional model emphasizing agriculture. Iowa Agr. Expt. Sta. Bes. Bui. 454.
Shou Shan Pu. 1946. A note on macroeconomics. Econometrica 14: 303-313*
Tinbergen, J. 1958. The design of development. Baltimore, Maryland, The Johns Hopkins Press.
Uma Datta. 1957* A preliminary study of interindustry relations in India. Working paper 7« India, Indian Statistical Institute, Calcutta.
. 1961. Growth of the Indian economy during the third plan period. Paper presented at the Second Econometric Conference, Waltair, India.

194
United Nations. Economic Commission for Latin America. 1956-Analyses and projections of economic development. II. Economic development of Brazil. New York, N. Y.
Economic Commission for Latin America. 1957< Analyses and projections of economic development. III. Economic development of Columbia. New York, N. Y.
Economic Commission for Latin America. 1958. Analyses and projections of economic development. IV. Economic development of Argentina. New York, N. Y.
United States. Department of Labor. 1952. Table 1, Interindustry flow of goods and services by industry of origin and destination, continental United States, 1947.
von Neumann and Morgenstern, 0. 1944. Theory of games and economic behavior. Princeton, N. J., Princeton University Press.
Wald, Abraham. 1934. Uber die eindeutige positive Losbarkeit der neuen Produktionsgleichungen, Ergebrisse eines Mathemati s chen Kolloquiums.
Walras, Leon. 1954. Elements of pure economics. (W. Jaffe, tr.). (First published in French in 1874). Homewood, Illinois, Richard D. Irwin.
Waugh, V. 1950* Inversion of Leontief matrix by power series. Econometrica 12: 142-154.

195
APPENDIX A

Figure 3* Inter-industry relations of the Indian economy, 1953-54 (in crores of rupees)
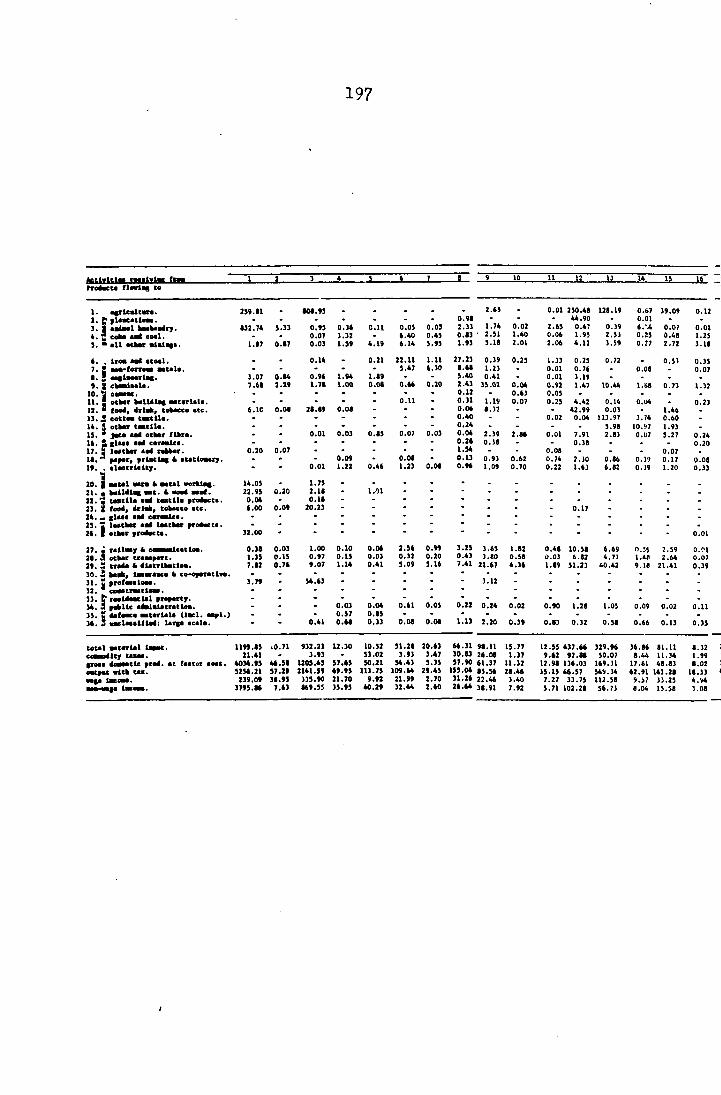
197
Ulllltlm lu» Protect flovtag to
_
1 agrleal tare. 239.11 •Oft.93 2.43 . 0.01 230.48 128.19 0.67 39.09 0.12 2 6* plaatatloae. 0.9»
0.02 44.90 0.01
3 | ealael testeadry. •32.7* 3.33 0.93 0.11 0.03 0.03 2.33 1.74 0.02 2.63 0.47 0.39 6.\4 0.07 0.01 4 % cote ul coal. 0.07 ft.40 0.43 0.63 • 2.31 1.40 0.06 1.93 2.33 0.23 0.48 1.23 S * ell otter mlalegs. 1.17 0.S7 0.03 4.19 6.14 3.93 1.93 3.1ft 2.01 2.06 4.12 3.59 0.27 2.72 3.18
é . iro# aai stool. . 0.14 0.21 22.U 1.11 27.23 0.39 0.23 1.33 0.23 0.72 . 0.33 0.33 7 5 asa-forroes astsls. 3.47 4.30 • ft* 1.23 0.01 0.76 0.08 0,07 • 5 eaglaeerlag. 3.07 o.u 0.9ft l.ft9 3.40 0.41 0.01 3.19 9 3 cteaUals. 7.6ft 2.29 1.7ft 0.0ft O.ftft 0.20 2.43 33.02 0.04 0.92 1.47 10.44 1.118 0.73 1.32
10 0.12 0.6) 0.03 11 9 otter teUdlag aetsrlals. 0.11 • 0.31 1.19 0.07 0.23 4.42 0.14 0.04 0.23 12 • food, drlaft, totecco etc. 6.1C 0.04 2ft #9 0.06 ft.32 42.99 0.0) 1.46 13 JS cottee tsatlls. 0.40 0.02 0.04 113.97 3.,4 0.60 14 S otter teatlle. 0.24 3.98 10.1-7 1.93 IS. • Jete Mi otter fibre. o.ot 0.15 0.07 0.03 0.04 2.39 2.6ft 0.01 7.91 2.83 0.07 3.27 0.24 u. & glass sari cersalcs. 0.2ft 0.38 0.38 0.20 17. S leather ted rahter. 0.20 0.07 1.34 0.08 0.07 IS. J prise leg ft stationery. - - 0.0ft • 0.13 0.93 0.62 0.74 2.30 0.86 0.39 0.17 0.08 19. . electricity. • 0.01 0.4ft 1.23 0.0ft 0.9ft 1.09 0.70 0.22 1.63 6.82 0.J9 1.20 0.33
20. { motel vara ft metal vorktag. 14.03 - 1.73 . - - . . . 21. a telldlag eat. ft wood aaaf. 22.93 0.20 2.1ft 1.01 - -
22. « testlle eei teatlie products. 0.04 O.U 23. 8 food, drlafc, totecco etc. ft. 00 0.09 20.23 0.17 2*. w glass sad cor sales. 23. 2ft. 1 otter products. 32.00 0.01
27. s i 1 s
0.38 0.03 1.00 0 0.0ft 2.3ft 0.99 3.23 3.63 1.82 0.48 10.38 6.69 0.ÎJ 2.39 0.01 29. 3 otter traaspore. 1.33 0.13 0.97 0.03 0.32 0.20 0.43 3.80 0.38 0.03 6.82 4.73 1.48 2.64 0.07 29 " trade ft dlstrlhatloa. 7.12 0.7ft 9.07 0.41 3.09 3.16 7.41 21.67 4.3ft 1.89 31.23 40.42 9.18 21.41 0.39 30. * teak, lasaraace ft co-operative. 31. 5 professloae. 3.79 34.63 3.12 32. coaotractioao. 33. t reeldeatlel property.
0.22 34. 3 pahllc adalaistratloa. 0.04 0.61 0.03 0.22 0.24 0.02 0.90 1.28 1.03 0.09 0.02 0.11 33. g defeats asterlaIs (lacl. eapl.) 0.ft3
1.13 3ft. 5 aaclssslfied: large scale. 0.41 O.ftft 0.33 0.0ft 0.0ft 1.13 2.20 0.39 0.83 0.32 0.38 0.66 0.13 0.33
teul astorUl tepee. ccseodlty UIM. gross dsswtlc prod. et factor cost, oetpee with tu. M|« laccae. Mi HI IWOM.
1199.83 i0.71 932.21 12.30 10.32 31.2ft 20.*3 66.31 98.11 13.77 12.33 437 .66 329.96 36.86 81 .11 8.32 21.41 3.93 33.02 3.93 3.47 30.83 26.08 1.37 9.ft2 92 88 30.07 8.44 11.34 1.99
4034.93 4ft 3ft 1203.43 37.63 30.21 34.43 3.33 37.90 61.37 11.32 12.9ft 136 .03 169.31 17.61 48 .83 8.02 323ft.21 57.29 2141.39 ft9.93 113.73 109.64 29.43 133.04 •3.3ft 28.46 33.13 66.37 349.34 62.91 141, 28 18.33 239.09 3ft.93 333.90 21.70 9.92 21.99 2.70 31.2ft 22.46 3.40 7.27 33 .73 112.38 9.>7 » . .23 4.94
3793.M 7.63 •69.33 33.93 40.29 32.44 2.ft0 2ft.ft4 36.91 7.92 3.71 102 .28 36.73 8.04 13, 38 3.08

_UL J2 IL M 22-
39.09 0.12 0.11 . 0.09 . 141.84 0 05 0.45 4.08 53.42 3.90 . -
5.49 . . 0.21 3.76 - -
0.07 0.01 3.37 1.61 1.62 5.76 3.02 164.61 0 86 6.47 14.23 2.12 97.52 33.05 0.32 2.15 0.01 0.48 1.25 0.55 0.90 7 29 0.38 0.67 0.1) 0.44 0 09 1.17 17.74 1.10 0.97 0.99 1.46 o.ot 2.72 3.18 0.57 0.43 1 46 0.56 4.85 0.67 1.59 0 *6 0.36 1.96 2.35 38.37 ? *•» 0 04 4.51 19.93 0.50 i 0.34
0.53 0.35 0.21 0.06 7.73 0.21 . - 0.04 0.1! 7.56 0.72 0.70 44.09 3.23 0.01
0.07 0.04 0 18 10.71 - 3.29 0.36 3.30 0.01 1.12 0.01 1 74 0.01 0.02 3.29 20.74 32.57 0.92 8.81 30.35 0.43 i
0.73 1.32 I.R9 1.02 0.19 0.39 1.36 3.68 0 10 0.11 80.46 1.0# 2.71 0.65 14.99 13.80 0.22 0.5* 0.85 34.36 2.32
0.23 0.04 0.06 0.45 0.04 2.13 0.76 3.13 17.62 2.91 1.46 0.63 0.2* 0.17 JJ.iO 0 01 0.01 0.51 0.96 . J5 38.94 0.60 4.18 0.23 - 40.27 - 1.33 0.13 0.5* 2.42 0.#4
1.93 0.01 11.7} 0.75 5.27 0.24 0.10 0.39 0.61 0.17 0.06 0.04 0.34 4.18
0.20 0 03 6.6# 3.69 o.ei
0.07 0.20
1.51 0.05 0 29 7.21 3.58 0.25 10.85 0.17 0.08 0.60 6.87 0.09 0.39 0.49 0.63 0 02 0.01 1.07 0.97 0.55 1.65 1 93 4.70 1.34 0.01
1.20 0.33 o. il 0.75 2 75 - • 0.1) 0.21 0.17 0.92 1.96 8.79 0 16 2.76 - • 0.01
. 0.01 1.21 0.11 11.9# 5.71 . . - 1.57 0.59 5.03 48.74 1.56
5.15
- " - - 0.89 5.91 1.37 0.25
-
0.01 6.50 0.14 7.71 9.00 16.97 - - 0.91 10.51 46.25 : -
2.59 0.01 0.14 1.77 0 23 1.81 0.47 1.10 4.02 0 l. 0.64 5.14 2.52 8.12 22.21 2 64 5.71 16.79 0.67 0.05
2.64 0.07 1.11 0.64 0 05 0.35 0.14 1.70 0 II 1.05 5.08 1.50 0.83 6.70 0 03 1.84 6.91 0.5# 0.07
21.41 0.39 5.65 8.68 1 25 b.71 2.15 5.62 19.45 1 ot 7.62 44.96 6.41 35.90 *7.03 0 14 17.95 69.52 4.54 0.57 21.41 0.39 2.00 63.90 0 66
- - - • 0.13 0.44 7.59 6.6* 10 16 44.25 3.64
0.02 0.11 0.10 0.08 - - - - - 0.26 - - : -
0.13 0.35 0.17 1.58 0.06 0.03 0 20 0.02 1.32 0.12 0.48 0 67 1.64 0 15 - - 0.21
1698.75 55.35
1210.13 55.74
145.15
122.51 40.07
134.93 192.40
31.17 34.16 m. 33 16#.71
31.43 21.72 12.43 25.70 29.47 35.26
35.02 83.S)
5.37 34.93
112.50 53.15
66.56 134.61
1.10 4.17
15.60
81.11 8.32 27, .04 27.51 17.27 29 .21 21.96 66.87 406 .78 3.22 34.18 182.24 72.93 246.7* 300.01 16.41 112.42
11.34 1.99 6, .66 6.40 4.76 26 .99 0.02 21.04 36.60 2.41 48.83 #.02 11 .57 33.57 29.37 26 .23 #0.67 97.03 219 .18 11.52 50.84 131.26 2*4.03 116.09 1815.** 82.30 667.63
141.2# 10.33 47 .27 67.48 51.60 55 .44 I02.il lo.'.% 652 .95 i4.7* 85.02 313.52 316.96 383.87 2152.05 98.73 7#2.46 33.25 4 ,V4 5, .94 19.25 9.89 4, ,99 11.29 11.47 32. .65 0.62 3.40 23.51 167.22 38.17 1*9.90 39.91 510.7*
15.58 3.0# 7 .63 14.32 19.6# 21 .24 69.18 85.56 186 .53 10.90 47.44 107.75 76.81 77.92 1665.5* 42.31 156.89
412.72 21.2V 70.01 3.47 5396.41 2».34 - 17.il 469.41
354.64 556.07 55# #7 1.24 11067.74 767.34 605.6# 55#.87 70.01 22.52 16933.56 11537.15 354.6* 1.7) 55#.#7 • 0.34 2830.34
547.34 - • 0.90 #237 *0

8 33.42 3.90 2.44 1698.73 3545.73 19.04 39.70 •70.20 3.17 31S4.ll
3.76 33.35 2.48 0.02 - 0.09 • 0.47 87.19
2 97.32 33.05 0.)2 2.11 0.01 1210.13 904.14 1.24 0.02 8.83 43.31 •15.69 •10.61 21*1.59
4 1.10 0.97 0.99 1.46 0.37 0.01 15.76 12.11 0.42 2,93 - 0.72 - 0.4* 49.91
38.37 ? *•» 04 4.H 19.93 0.30 17.66 0.34 145.15 28.95 0.61 * 21.41 -49.04 4.71 113.73
6 0.72 0.70 44.09 3.23 2.23 0.01 122.51 . 0.91 15.68 4.07 -21.*4 •10.87 109.4*
6 ).)0 O.Ol 1.64 1.12 40.07 0.91 5.13 1.32 •14.42 • 2.6* 6 32.37 0.92 8.81 30.33 0.43 16.33 134.93 20.63 27.33 129.67 3.09 •131.4* •24.77 15$.04
8 2.71 0.63 14.99 13.BO 2,71 0.22 192.60 71.93 1.19 0.04 3.44 •32.42 -33.04 US.$4
4 0.83 14.99
34.36 2.32 38.87 . 0.59 • 0.73 •10.21 24.44
0.76 ).l) 17.82 2.91 34.16 24.00 0.10 0.77 • 1.14 •22.72 IS.IS
6 1.33 38.94 17.82
166.33 448.86 103.20 •29.70 •22.12 444.$7
4 2.42 0.44 168.71 377.02 0.03 74.34 $4.0$ •14.91 9*9.14
0.75 31.63 49.58 2.03 4.30 •23.73 • 0.90 41.91
4 0.34 4.18 28.72 1.24 11X43 • 0.24 • 1.03 141.1*
6.64 3.69 0.81 12.43 7.64 0.20 • 1.7* - 0.20 14.33
5 10.83 21.70 9.62 0.03 3.77 - 1.43 *7.17
7 0.33 1.63 1 93 4.70 1.34 1.96 0.01 29.67 58.40 1.97 - • 4.97 -14.57 - 4.94 47*4
2 1.96 8.79 0 16 2.76 - 0.01 35.26 12.59 3.75 - - • SI.44
1.21 0.11 11.98 1.71 „ 33.02 11.01 11.26 . • 0.03 • 1.40 SS.44
1.37 0.39 3.03 48.74 1.36 83.6) 6.70 26.40 • -14.72 101.41
3.15 5.37 142.30 9.77 4.*4 143.90
0.23 3.15
34.93 617.37 0.45 4SI.99 14.74 14.74
82.02 3.00 43.02
- 0.91 10.31 46.2$ - - 130.00 164.41 - - 13.00 6.3* • 0.23 111.91
2 8.12 22.21 2 64 3.71 16.79 0.47 3.60 0.03 112.50 175.10 17.00 0.47 $.97 5.72 • - 314.94
D 0.83 6.70 0 03 1.84 6.91 0.38 0.71 0.07 53.15 317.64 0.44 0.7) 4.33 7.1* 341.17
1 33.90 47.03 0 14 17.93 69.32 4.54 17.19 0.17 444.44 1352.89 4.43 4.27 (.1.63 57.79 2132.05
2.00 63.90 0 66 44.54 32.17 94.71
7.39 6.64 10 16 44.2$ 3.44 134.41 588.70 39.15 741.44 49.44 244.34 451.54 747.14
399.82 $.84 409.44
0.26 t.10 333.77 354.47
2.73 4.17 47.82 • 1.94 70.01
2 0.46 - 0 67 1.64 0.1$ . 2.73
0.21 13.40 • - 0.32 6.95 1.61 • 3.2* - 0.92 21.S1
3 2*4.7* 300.01 16.4) 112.42 412.72 21.2V 70.01 3.47 >114.41 9910.04 604.44 263.00 72).23 $11.72 -337.43 -144.07 1 21.04 34.40 - 2.41 . 24.34 - 17.41 *49.41
3 114.09 1413.44 82.30 667.63 334.4* $$6.07 5$4 47 - 1.24 11047.74 1 343.47 2132.03 96.73 742.44 747.34 403.48 $$4.47 70.01 22.$2 14933.34 11337.11 11337.13 2 38.17 149.90 39.99 $10.74 3$4.4* 4.7) $$4.87 - 0.34 2430.34 1 77.92 1443.34 42.31 136.89 - $47.34 - • 0.90 8237.40

198
APPENDIX B

199
Table 32. Input-output projections for India - 1960-61 (in crores of rupees at 19]
Purchase by-
Sales by 1 2 3 b 5 6 7
1. Wheat and other cereals 12k.98 - - - - 26.55 -
2. Rice 5.6b 83.97 2.02 25.91 3.b6 - -
3« Industrial crops - 3.02 63.81 - - 191.91 307.55
b# Livestock and products lib.10 bb.10 12.70 97.81 55.70 6k» 69 -
5# Other agricultural products 115.78 60.bl - 537.b9 2l6.b8 18.98 33.92
6. Food manufactures - - - - - 37.15 -
7. Vegetable oils 5.22 2.82 - 2b.b5 3.17 - -
8# Wood 2.30 2.21 - = 15.01 0.55 0.15 : 9. Jute 16.93 -15.30 8.77 - 6.93 6.78 1.3b 10. Textiles - - - . - - _
11. leather and leather goods - • - - - - —
12« Fuel and power O.ij.2 0.81 - - 6.93 12.63 2.98
13. Mining - - - - - - -
lb. Basic metal industries - - - - » • _
15. Metal products - 0.20 - - 5.77 b.37 8.53
16. Non metal b.37 8.53
products - - - - - 3.70 _ 17. Chemicals 1.0b 1.01 - - 5.77 2.71 1.18 18. Construction - 0.20 - - - 2.3b 3.80 19. Transport 33.86 18.93 13.25 16.03 62.3b 21.01 7.86 ] 20. Import 11*2.53 51.75 118.75 b.05 21.65 15.22 b.68 î 21. Govt, ordinary
21.65 15.22 b.68 î
revenue 20.27 20.3b 36.09 5.67 133.93 62.53 6.32 ] 22. Trade and services 1026.1b b68.96 8.27 129.27 615.37 77.27 39.bl 23. Wages 675.87 1323.93 778.11 876.27 1953.78 105.10 96.09 1C
Total 2215.08 2097.96 1071.77 1717.23 3106.29 653-29 513.81 2(

b 1952-53 prices)
8 9 10 11 12 13 lk 15 16 17 18 19
- - 2.31 -
82.63 - - - - - -
5.7k
% - 119.5k 2kk.21 - - - - - - - - -
0.27 - 22.7k kl.88 12k.k3 - - - - - - -
% -
1.25 0.78 m
0.55
0.k6 m
II8.83
15 3k
20.85
O.k8
0.97 0.5k 0.37
0.25
0.39 6.55 3.28
122.30
1.16
1.29 5.27
5.27
26.k7 — 0.15 0.2k
l.k5 0.07
0,2k 8.0k
15.93 7.0 9 0.30
k2.87 5.kl 13.19
0.26
1.06
?8 2.10 3.32 lii.55 13.98 11.1k 3.0k 2.77
21.83 27.26
k.lk 12.87 B.kk
lk.lk 2.k3
30.71 9.85
28.67
- - - - O.k9 - 0.26 137.k6 - 1.18 15.68 6.ko
>3 1.9k k.77 15.03 - 13.77 2.38 5.36 k2.26 11.20 6.03 31.20 7 3.kl
18 30 36 58
6.99 0.25 19.07 25.58
2.19 2.13 7.30 0.02
10.22 2.12 lk.75 31.k2
k.6l -3.71
3.kk 63.39 3.01 102.k6
28.55 1.58
1.93 1.10 6.76 3.10 1.32 - 6.73 25.83 19.12 19.12 35.3k 395.85 11.89
1.16 10.66 0.92 6.96 29.15
83.87 8.75 1.25
3.89 3.k3
32 10.13 il 6.11 )9 106.31
2k.80 3.59 37.1k
76.52 lkl.09 375.76
17.63 92.21 10.68 137.92 55.07 328.58
9.31 k5.l5 71.05
15.15
52.99
70.87 1.03 ki.23 0.11 10.k9 lk.75
17.0k 5.06 59.63 5.19 92.13 22.77 230.26 363.62
31 200.08 206.93 1085.65 162.13 987.98 163.83 186.83 731.67 98.07 Hil.lO. 550.38 68k.78

200
Table 32. (Continued)
Purchase by- Sum of intermediate demand
Exports Govt, ordinary expenditure
Inve
Sales by 1-15 20 21
1» Wheat and other cereals 153.8k - -
2. Rice 209.37 - -
3» Industrial crops 930.0k 31.00 -
k. livestock and 508.k2 lk .55 products 508.k2 lk .55 *
5» Other agricultural products H02.kk 2k0.00 1.00
6. Food manufactures 39.6k 22.00 -
7. Vegetable oils 58.68 33.00 -
8. Wood 11*5.32 6.10 10.00 il 9. Jute 68.52 135.65 2.50 10. Textiles 122.93 lko.oo 13.10 11. Leather and
leather goods 8.22 3k.00 1.20 2 12. Fuel and
power lBk.26 ik.oo 18.00 13» Mining 50.75 53.50 10.00 0 Ht» Basic metal
industries I6l.k7 16.00 » 1 15. Metal
products 226.21 23.00 17.00 312 16. Non metal
312
products 90.66 5.oo - 2 17 e Chemicals 67.3k 5.oo -
18. Construction 27 .kl - 2k.00 5oo 19e Transport klk.29 - 12.00
5oo 20. Import 99k.93 9.00 -
21. Govt, ordinary revenue 68k.53 - —
22. Trade and services 28k7.97 23# Wages 7k77.93 k5.12 829.17 275
Total 16575.17 826.92 937.97 1097

t. ordinary Investments Consumers Total final Total goods supply enditure demand national output
21 22 23 20-23 1-23
- - 2061.00 2061.00 221k.8k - - I889.2lt 1889.2k 2098.61
- - 111.2k lk2.2k 1072.28
• - 1235.9k 1250.k9 1758.91
1.00 - 1751.66 1992.66 3095.10
- - 591.8k 613.8k 653.k8
_ k22.62 k55.62 5lk.30 L0.00 it.00 kl.k6 61.56 206.88 2.50 1.50 139.65 208.17 L3.10 - 810.26 963.26 1086.29
1.20 2.00 117.22 I5k.k2 162.6k
18.00 _ 780.19 812.19 996.k5 l0.00 0.30 5l.k7 115.26 166.02
- 1.80 11.23 29.03 190.50
.7.00 312.25 157.83 510.08 736.29
- 2.00 0.87 7.87 98.53 - - 70.57 75.57 lk2.91
ik.oo 500.00 - 52k.00 55l.kO .2.00 - 260.00 272.00 686.29 - - 39.2k k8.2k 10k3.17
— * 5k5.l9 5k5.19 1229.72 - • — • 28k7.97
19.17 275.18 1596.98 27k6.k5 1022k.3&
17.97 1097.53 I25k7.55 15409.97 31985.1k

Total final Total goods supply Total net supply demand national output 20-23 1-23
2061.00 1889.21*
221k.8k 2098.61
2089.89 2013.58
11*2.21* 1072.28 1008.05
1250.1*9 1758.91 1619.k3
1992.66 3095.10 2886.20
613.81* 653.k8 616.09
1*55.62 61.56 139.65 963.26
5lk.30 206.88 208.17 1086.29
513.87 179.25 206.35 963.73
151* .1*2 162.6k 156.86
812.19 115.26
996.k5 166.02
976.76 161.07
29.03 190.50 186.60
510.08 736.29 689.39
7.8? 75.57 52k.00 272.00 1*8.2k
98.53 lk2.91 55l.kO 686.29 10k3.17
98.17 130.77 550.3k 659.kl*
5k5.19
27k6.k5
1229.72 28k7.97 1022k.3&
-
1&09.97 31985.1k

201
APPENDIX C

202
Table 33» Inverse of the input-output projections for India, 1960-61
la 2 3 4 5
la 1.05980 .00000 .00000 .00000 .00000
2 .00358 1.04233 .00292 .01715 .00222
3 .00714 .00760 1.06906 .01050 .00273
4 .02409 .02428 .01405 1.06644 .02135
5 .07138 .04253 .01308 •35545 1.08685
6 .00000 .00000 .00000 .00000 .00000
7 .00316 .00196 .00060 .01546 .00188
8 .00219 .00185 .00121 .00248 .00668
9 .00838 .00778 .00882 .00105 .00249
10 .00002 .00002 .00003 .00000 .00001
11 .00004 .00003 .00008 .00003 .00005
12 .00157 .00132 .00235 .00195 .00405
13 .00012 .00009 .00023 .00014 .00023
14 .00070 .00046 .00145 .00079 .00123
15 .00270 .00184 .00547 .00323 .00524
16 .00005 .00005 .00007 .00005 .00006
17 .00094 .00084 .00033 .00094 .00258
18 .00024 .00027 .00037 .00025 .00022
19 .01916 .01158 .04475 .01844 .02381
aSectors 1 to 19 are the same as described in Table 32.

203
Table 33 (Continued)
6 7 8 9 10
1 .04565 000000 .00000 .00000 .00260
2 .00550 .00279 .00296 .00394 .00298
3 .34217 .64149 .00381 .61729 .27498
4 .12164 .01103 .00577 .01157 .03192
5 .08672 .08333 .02285 .01648 .01686
6 1.06031 .00001 .00015 .00006 .00143
7 .00298 1.00098 .00562 .00213 .00251
8 .00439 .00304 1.11787 .00921 .00994
9 .01500 .00820 .00028 1.00793 .00584
10 .00005 .00003 .00004 .00204 1.12689
11 .00012 .00009 .00285 .00138 .00132
12 .02598 .00991 .02178 .02259 .01913
13 .00134 .00107 .00176 .00167 .00097
14 .00382 .00524 .00639 .00746 .00454
15 .01654 .02437 .02637 .03428 .02168
16 .00684 .00129 .00078 .00187 .00057
17 .00576 .00340 .04155 .01266 .01234
18 .00493 .00793 .00246 .01106 .00269
19 .05720 .04636 .10986 .06660 .03176

Table 33 (Continued)
204
11 12 13 14 15
1 .00000 .OOOO3 .00000 .00000 .00000
2 .01337 .09062 .00412 .01308 .00367
3 .01095 .00281 .00118 .00273 .00175
4 .29711 .13781 .00459 .01834 .00502
5 .10672 .06199 .03553 .03947 .01410
6 .00019 .00085 .00002 .00013 .00007
7 .01653 .00289 .00165 .00258 .00199
8 .04352 .03259 .00517 .01005 .00593
9 .00058 .00091 .00016 .00164 .00072
10 .00001 .00003 .00007 .00007 .00002
11 1.03365 .00019 .00030 .00030 .00001
12 .09619 I.OI636 .02813 .12975 .03479
13 .00098 .00003 1.01829 .14796 .02994
14 .00235 .00588 .00868 1.01381 .20205
15 .00865 .02439 .03705 .05576 1.07653
16 .00045 .00075 .00029 .00153 .00326
17 .03373 .00191 .00108 .00791 .01248
18 .00103 .00438 .00124 .00871 .00223
19 .04034 .07342 .18142 .17640 .06539

205
Table 33 (Continued)
16 17 18 19
1 .00001 .00016 .00000 .00000
2 .01654 .01150 .00863 .01364
3 .05556 .08138 .01039 .00635
4 .02366 .01819 .01290 .01119
5 .06029 .03082 .01744 .19540
6 .00026 .OO38O .00016 .00005
7 .00678 .12190 .00378 .00901
8 .02236 .06647 .09389 .02562
9 .08365 .00435 .01295 .00078
10 .00027 .00004 .00005 .00043
11 .00054 .00029 .00034 .00169
12 .16064 .11912 .09078 .04973
13 .09528 .02315 .03914 .00500
14 .03527 .02267 .04696 .03216
15 .16320 .06574 .09243 .11956
16 1.01178 .01049 .15439 .00133
17 .03989 1.08496 .02757 .00498
18 .07252 .00981 1.01201 .00644
19 .24408 .08409 .06304 1.02410