A Strategic Approach for Air Pollution Reduction in Karachisustainableinitiatives.org.pk/da/External...
41
A Strategic Approach for Air Pollution Reduction in Karachi Dieter Schwela, Gary Haq and Mohammad Aqib Uddin
Transcript of A Strategic Approach for Air Pollution Reduction in Karachisustainableinitiatives.org.pk/da/External...

A Strategic Approach for Air Pollution
Reduction in Karachi
Dieter Schwela, Gary Haq and Mohammad Aqib Uddin

2
Contents
Abbreviations and Acronyms .....................................................................................3
1 Introduction..........................................................................................................4
2 The Issue of Particulate Matter ............................................................................7
3 Impact of Particulate Matter on Health .................................................................8
4 Air Pollution in Pakistan .......................................................................................9
5 Air Quality Monitoring in Karachi........................................................................11
6 Results ..............................................................................................................13
7 Policy Recommendations ..................................................................................17
Strategies.............................................................................................................20
Industry ................................................................................................................20
Transport..............................................................................................................21
Land use...........................................................................................................21
Traffic management..........................................................................................22
Encouraging alternatives to the private motor vehicle .......................................22
Reducing motor vehicle emissions....................................................................23
Measures to reduce transport emissions in Karachi ..........................................24
Area sources ........................................................................................................26
Transboundary air pollution ..................................................................................29
Regional haze from forest fires.............................................................................30
Tropospheric ozone pollution ...............................................................................30
Measures to reduce emissions which contribute to transboundary polluton..........31
Measures All Emission Sources ...........................................................................32
World Health Organization air quality guidelines ...............................................32
Use of a simple integrated model for air quality management ...........................34
8 Implementation in Karachi……………………………………………………………35
References ..............................................................................................................38

3
Abbreviations and Acronyms
ABC Atmospheric Brown CloudACS American Cancer SocietyAPINA Air Pollution Information Network for AfricaAP-42 Acronym for the documentation of emission factors of USEPA’s Emission
Factor and Inventory GroupAQG Air Quality GuidelineAQM Air Quality ManagementBS Black SmokeCAIP Clean Air Implementation PlanCDM Clean Development MechanismCNG Compressed Natural GasCO Carbon dioxideCORINAIR CORe INventory of AIR emissionsEC European CommissionEU European UnionGHG Greenhouse GasHC HydrocarbonHg MercuryI&M Inspection & MaintenanceISO International Standardization OrganizationIVL Swedish Environmental Research InstituteHEI Health Effects InstituteLPG Liquid Petroleum GasMSW Municipal Solid WasteNGO Non-Governmental OrganizationNO Nitrogen oxideNO2 Nitrogen dioxideNOx Nitrogen oxides, usually NO+NO2
O3 OzonePM Particulate matterPM1 Particles smaller than 1.0 µm in aerodynamic diameterPM2.5 Particles smaller than 2.5 µm in aerodynamic diameterPM10 Particles smaller than 10 µm in aerodynamic diameterPOPs Persistent Organic PollutantsRAPIDC Regional Air Pollution In Developing Countries programmeRIAS Rapid Inventory Assessment SystemSEI Stockholm Environment InstituteSF Strategic FrameworkSida Swedish International Development Cooperation AgencySIM-AIR Simple Integrated Model for Better Air QualitySO2 Sulphur dioxideSWM Solid Waste ManagementTSP Total Suspended Particulate matterUF Ultra Fine particlesUNEP United Nations Environment ProgrammeUR Unit RiskUSEPA United States Environmental Protection AgencyVOC Volatile Organic CompoundsWHO World Health OrganizationWMO World Meteorological Organization

4
1 Introduction
There is an urgent need to address the health and environment effects associated with
urban air pollution in Pakistan and to promote more effective frameworks to address
urban sources of air pollution. In those Pakistani cities where air quality monitoring has
been performed, levels of air pollution exceed World Health Organisation (WHO)
recommended guidelines (WHO, 2000; 2005)1. National estimates of the burden of
disease for Pakistan indicate that approximately 28,700 people die annually due to
exposure to outdoor urban air pollution, and 70,700 people are assumed to die annually
due to exposure to smoke from solid fuel use (WHO, 2006). The cost to the economy in
terms of air pollution was estimated at to range from US$ 233 to 368 million per year in
1992 (Brandon, 1995) and at Rs. 62-65 billion (US$ 1.03-1.08 billion) per year for urban
air pollution and Rs. 60-75 billion (US$ 0.998-1.25 billion) per year for indoor air
pollution (WB, 2006). The costs of air pollution were calculated in terms of premature
deaths, hospital admissions and sickness requiring medical treatment and minor
sickness, including restricted activity days and respiratory symptom days.
There is a link between air pollution and poverty since poor people are exposed to
higher concentrations of air pollutants and tend to suffer disproportionately from the
effects of deteriorating air quality. Women and children exposed to high concentrations
of air pollutants are particularly susceptible to developing respiratory ailments. Illness
due to air pollution has implications for child development, well-being and quality of life.
The burning of municipal solid waste is a significant source of air pollution which is
difficult to quantify. As of 2004 almost 55,000 tonnes of solid waste is generated each
day across Pakistan, most of which is either dumped in low-lying areas or burned
(GOV_PK, 2005). The burning of solid waste at low temperatures not only generates fine
particulate matter (PM), but also carcinogenic pollutants. Another important source of
PM is dust from both natural and anthropogenic sources. The arid conditions result in
clouds of fine dust that form a haze over many cities, compounded by dust storms in the
summer months (WB, 2006).
Health impacts of air pollution depend on the sensitivity and exposure levels of the
susceptible population to the pollutant. The worst affected are often low-income groups
– who live and work in areas with high concentration of air pollution, who may have
lower immunity, and who are likely to face a disproportionate health and opportunity
1 Baseline (Ambient Air Quality) Study of Six Major Cities of Pakistan. Pakistan Space & Upper Atmosphere ResearchCommission (SUPARCO), Karachi. http://www.suparco.gov.pk/pages/spas-project08.asp
5
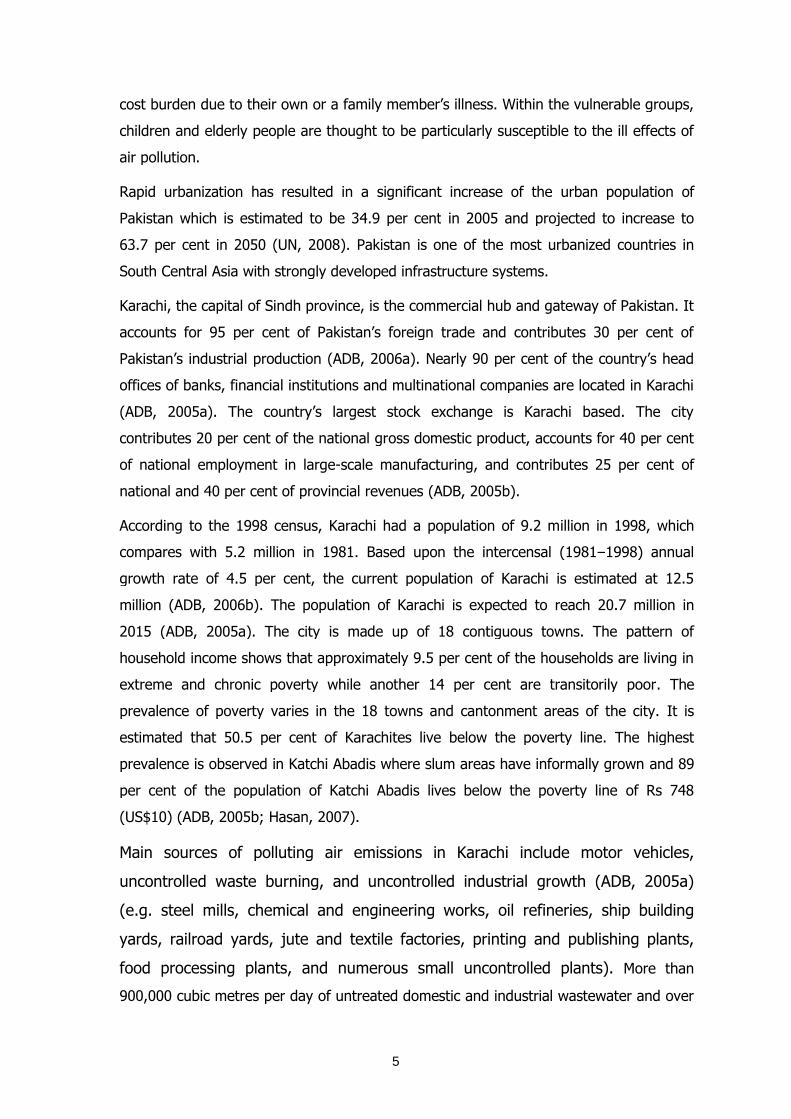
cost burden due to their own or a family member’s illness. Within the vulnerable groups,
children and elderly people are thought to be particularly susceptible to the ill effects of
air pollution.
Rapid urbanization has resulted in a significant increase of the urban population of
Pakistan which is estimated to be 34.9 per cent in 2005 and projected to increase to
63.7 per cent in 2050 (UN, 2008). Pakistan is one of the most urbanized countries in
South Central Asia with strongly developed infrastructure systems.
Karachi, the capital of Sindh province, is the commercial hub and gateway of Pakistan. It
accounts for 95 per cent of Pakistan’s foreign trade and contributes 30 per cent of
Pakistan’s industrial production (ADB, 2006a). Nearly 90 per cent of the country’s head
offices of banks, financial institutions and multinational companies are located in Karachi
(ADB, 2005a). The country’s largest stock exchange is Karachi based. The city
contributes 20 per cent of the national gross domestic product, accounts for 40 per cent
of national employment in large-scale manufacturing, and contributes 25 per cent of
national and 40 per cent of provincial revenues (ADB, 2005b).
According to the 1998 census, Karachi had a population of 9.2 million in 1998, which
compares with 5.2 million in 1981. Based upon the intercensal (1981–1998) annual
growth rate of 4.5 per cent, the current population of Karachi is estimated at 12.5
million (ADB, 2006b). The population of Karachi is expected to reach 20.7 million in
2015 (ADB, 2005a). The city is made up of 18 contiguous towns. The pattern of
household income shows that approximately 9.5 per cent of the households are living in
extreme and chronic poverty while another 14 per cent are transitorily poor. The
prevalence of poverty varies in the 18 towns and cantonment areas of the city. It is
estimated that 50.5 per cent of Karachites live below the poverty line. The highest
prevalence is observed in Katchi Abadis where slum areas have informally grown and 89
per cent of the population of Katchi Abadis lives below the poverty line of Rs 748
(US$10) (ADB, 2005b; Hasan, 2007).
Main sources of polluting air emissions in Karachi include motor vehicles,
uncontrolled waste burning, and uncontrolled industrial growth (ADB, 2005a)
(e.g. steel mills, chemical and engineering works, oil refineries, ship building
yards, railroad yards, jute and textile factories, printing and publishing plants,
food processing plants, and numerous small uncontrolled plants). More than
900,000 cubic metres per day of untreated domestic and industrial wastewater and over

6
1,000 tons per day of uncollected solid waste finds its way directly or indirectly to the
sea, providing a constant source of marine pollution.
Karachi’s industries generate a cocktail of chemicals and toxic substances, and a
significant amount of industrial effluent is discharged into creeks, rivers, or the sea. New
development takes place within environmentally sensitive areas and reserves for critical
infrastructure, causing major environmental problems. Vehicle-generated air pollution is
severe, with high concentrations of fine and ultrafine particles in the air which can cause
respiratory problems among a large number of Karachi’s urban residents (ADB, 2005b).
The fastest growth in mobile sources has been in two-stroke delivery vehicles, but the
number of diesel trucks and buses has also increased up to three times. International
experience indicates that a major share of the emission load from motor vehicles can be
attributed to a relatively small number of smoky diesel and two-stroke vehicles (ADB,
200x).
The main sources of ambient air pollution in Karachi are old and ill-maintained vehicles,
waste burning (8,000 tonnes of waste generated/day), re-suspended dust, and small-
scale businesses using ‘dirty fuels’ for manufacturing and production purposes. Air
pollution levels in Karachi and other urban centres of Pakistan are extremely high by
international standards and rising each year (WB 2005).
Since early 1980s the main focus of Pakistan’s Transport and Communication strategy
was to construct more roads. After two decades the strategy resulted in strong
dependence of travellers on the road-based system and consequent rise in vehicle
numbers. Many vehicles are old, and new ones built locally do not use modern engine
technology and specifications, thus contributing to vehicle emissions. Engine
maintenance is generally performed by technicians who have had no formal training.
There is no established system of engine maintenance. The use of adulterated fuel and
lubricants by many private and public vehicles operators has aggravated ambient air
pollution from the transport sector (SUPARCO, 2005).
The emission of air pollutants is directly related to fuel consumption. Pakistan’s
consumption of petroleum products is growing at an annual rate of approximately 6 per
cent, almost half of which is consumed by the transport sector. The high content of
sulphur in diesel (0.5-1 per cent) and furnace oil (1-3.5 per cent) is a major contributor
to air pollution, a smaller contributor are dirty “waste” fuels, such as old tyres, paper,
wood and textile waste. Industrial emissions are further compounded by the widespread

7
use of small diesel electric generators in commercial and residential areas in response to
the poor reliability of electricity supplies.
In order to augment current PM monitoring in Karachi, the International Union for
Nature Conservation (IUCN) and the Stockholm Environment Institute (SEI), with the
support of the Pakistan Space and Upper Atmosphere Research Commission (SUPARCO)
conducted a monitoring programme for fine and ultrafine PM covering the period
September 2007 to July 2008. The monitoring was conducted as part of the regional air
pollution in developing countries programme (RAPIDC) funded by the Swedish
International Development Cooperation Agency (Sida).
This report outlines the contribution of PM to urban air pollution in Karachi and presents
a strategic approach to achieve PM reduction.
2 The Issue of Particulate Matter
PM is a general term used to describe a complex mixture of solid particles and liquid
droplets suspended in the ambient air which have diverse chemical and physical
characteristics. A large number of anthropogenic and natural sources contribute to
ambient airborne PM. These include: motor vehicles; power plants; smelters; quarries
and cement industries; resuspended and wind blown dust; photochemical processes
producing secondary PM, and tobacco smoke. PM is divided into two classes, primary
and secondary. Primary particles are released directly into the atmosphere. Secondary
particles are formed in the atmosphere as a result of reactions that involve gases (ADB,
2006).
The health and environmental exposure to, and effects of, particles depend strongly on
particle size. Particle size is a consequence of the process that resulted in its generation,
and thus is also dependent on the source and its characteristics. Particles are generally
classified by their aerodynamic diameters since size is a critical determinant of site of
deposition within the respiratory tract. PM10 are particles less than 10 microns in
aerodynamic diameter. They can further be divided into coarse particles (from 2.5 to 10
µm), fine particles (PM2.5, less than 2.5 µm) and ultrafine (UF) particles (particles of
diameter less than 0.1 µm). Coarse particles contain earth crustal materials, dust from
roads, industries and construction activities, and biological material, such as pollen
grains and bacterial fragments. PM2.5 contains combustion particles, the secondary
formed aerosols (gas to particle conversion), and re-condensed organic and metal
vapours. Diesel trucks emit particles primarily in the range of 0.1-0.2 µm. The

8
composition of particles varies substantially across cities around the world depending
upon local geographical, meteorological conditions and specific sources. Figure 1
illustrates the sizes of various particles in comparison with human hair.
Figure 1: The size of various particles in comparison to the width of a human hair
3 Impact of Particulate Matter on Health
Total suspended particulate matter (TSP) and black smoke (BS) were used as indicators
of airborne particles in the past, and TSP is still used as an indicator of PM in some
countries. Nowadays PM10 and PM2.5 are used as indicators for airborne particulate
matter as there are extensive measurement data of PM10 throughout the world. It
includes inhalable particles which can penetrate to the thoracic region. However, PM2.5
has a higher probability of deposition in the airways and lungs due to its size. Particles
with different aerodynamic diameters differ in their overall contributions to airborne
particle mass and in their origin, physical characteristics, chemical composition, and
health effects.
There has been evidence showing that PM exposure is linked to a variety of adverse
effects on mortality (non-accidental all-cause mortality, cardiovascular and respiratory
mortality) and morbidity (hospital admissions, out-patient and emergency visits, asthma
attacks and acute respiratory infections). Several meta-analyses have been conducted to
examine the relative risk of short-term mortality associated with a 10 µg/m3 increase of
PM10. Meta-analyses on European studies, US studies and Asian studies showed that for
each increase of 10 µg/m3 PM10 the estimates for short-term all cause mortality were
0.62 per cent, 0.46 per cent and 0.5 per cent, respectively (HEI, 2004). Evidence also
showed chronic adverse health effects associated with long-term exposure to air
pollution. Two long-term exposure studies (i.e. the US American Cancer Society (ACS)
study and Harvard Six-Cities cohort study) reported associations between long-term
exposure to PM2.5 and mortality. A 10 µg/m3 increase of PM2.5 was associated with about

9
a 4 per cent, 6 per cent and 8 per cent increase risk of all-cause, cardiopulmonary, and
lung cancer mortality, respectively.
The association between PM and adverse health effects is consistent in various cities,
both in developed and developing countries. The risk for adverse health outcomes has
been shown to increase with exposure. There is no evidence to suggest a threshold
below which no adverse health effects would be anticipated. In addition to PM10 and
PM2.5, there is considerable toxicological evidence of potential adverse effects of UF
particles on human health, but the available epidemiological evidence is insufficient to
derive an exposure-response relationship to UF particles.
4 Air Pollution in Pakistan
Due to rapid growth of the urban population, and the striving for economic growth
Pakistan faces polluting air emissions from:
industries (point sources) including the small scale uncontrolled industrial facilities;
exhaust gases from vehicles;
uncontrolled waste burning in urban areas;
poor drainage, sanitation and waste disposal system.
The Pakistan Environmental Protection Agency (Pak-EPA) is an attached department of
the Ministry of Environment and responsible for the implementation of the Pakistan
Environmental Protection legislation in the country. Significant measures for the
improvement of air quality include the establishment of vehicle emission standards and
strengthening of inspection programmes, conversion of petrol-driven vehicles to
compressed natural gas (CNG), promotion of liquefied petroleum gas (LPG) and biofuels,
planning of mass rapid transit (MRT) in Pakistani cities, and implementation of industrial
emission standards (Pak-EPA, 2006; 2008). However, air quality standards have not yet
been adopted in Pakistan (Aziz, 2006). In Pakistan only unleaded gasoline is used
(PCFV, 2008a). Diesel specifications in Pakistan allow for a sulphur content of 500 ppm,
still a high value when compared to those of developed countries (PCFV, 2008b). Table
1 shows the key environmental legislation in Pakistan.

10
Table 1: Key environmental legislation in Pakistan
Legislation Content (Date of Promulgation)
PEPO
Environmental Protection Ordinance No. XXXVII (1983)o Environmental Protection Council (PEPC) to form national
environmental policy and ensure enforcement of NationalEnvironmental Quality Standards (NEQS)
o Federal Environmental Protection Agency (FEPA) with wideranging functions including the preparation and coordination ofenvironmental policy and powers to set and enforce NEQS
o Environmental Impact Assessment
PEP
Pakistan Environmental Protection Act (1997)o Sustainable development through the protection, conservation,
rehabilitation and improvement of the environmento Reconstitution of PEPC to give more representation to
provinces, trade and industry and NGOso Set up of Environmental Tribunals in Karachi and
LahoreDesignation of environmental Magistrates in threeprovinces
o Implementation of the PEP by provincial governmentso Self-monitoring and reporting for industry with a Self Monitoring
and Reporting Tool (SMART)o Constitution of a National Coordination Committee to supervise
the implementation of environmental policies and enhance interprovincial coordination.
o Formulation of analytical methods and sampling procedures
Source: UNIDO (2000)
Due to scarcity of equipment and funding, few monitoring stations exist in Pakistani
cities, including Karachi. The challenges which have prevented progress in managing
urban air quality in Pakistan include:
capacity building in different disciplines;
public awareness about air pollution issues;
emissions from waste and urban open burning;
existence of several thousand small-scale manufacturing units especially in
Karachi producing particulate matter;
emission from vehicles and uncontrolled industries
lack of air quality standards or shortcoming in their implementation;
Lack of an effective waste management system in the cities;
Weaknesses in law enforcement;
Lack of funds to launch a fully fledged air quality monitoring program in the
five major cities of the country.

11
5 Air Quality Monitoring in Karachi
In collaboration with the Government of Japan, the Pak-EPA launched the Environmental
Monitoring System project. With respect to air pollution, the project has provided
continuous monitoring stations for gaseous compounds (SO2, NO2, O3 and CO) and
particulate matter (PM10) to build up air surveillance at two sites in each city, Islamabad,
Karachi, Lahore, Peshawar and Quetta (Pak-EPA, 2006). The stations have been
operational since 2007. Three mobile monitoring stations were also provided by the
project.
Before the operation of these monitoring facilities initial campaigns for monitoring of
TSP, PM10 and the key gaseous compounds (SO2, NOx, O3, CO) were performed by
SUPARCO (2005). Figure 2 presents the results for PM10, SO2 and NOx.
0
50
100
150
200
250
300
350
Karachi Lahore Islamabad Rawalpindi Peshawar Quetta
PM
10
co
ncen
trati
on
[µg
/m3]
Cycle 1 (2003) Cycle 2 (2003) Cycle 3 (2004) Cycle 4 (2004)
Figure 2: PM10 24-hour concentrations in 2003 and 2004, averaged overmonsoon (cycle 1 and 3) and summer (cycle 2 and 4) seasons,respectively, in six Pakistani cities
Source: SUPARCO (2005)
Averaged PM10 concentrations (see Figure 2) in all six cities are above the WHO
guideline value of 50 µg/m3 by a factor of 3 to 4. This shows that practically all
individual 24-hour concentrations do not comply with the WHO guideline value.
The SO2 concentrations (see Figure 3) are all above the WHO 24-hour guideline value of
20 µg/m3 or 7 ppb. Although the 48-hour concentrations cannot be rigorously compared

12
with the 24-hour guideline value the results indicate that 24-hour SO2 concentrations
would not comply with the guideline value.
0
5
10
15
20
25
30
35
Islamabad Karachi Lahore Peshawar Quetta Rawalpindi
SO
2co
ncen
trati
on
[pp
b]
Cycle 1 (2003) Cycle 2 (2003) Cycle 3 (2004) Cycle 4 (2004)
Figure 3: SO2 48-hour concentrations in 2003 and 2004, averaged overmonsoon (cycle 1 and 3) and summer (cycle 2 and 4) seasons,respectively, in six Pakistani cities
Source: SUPARCO (2005)
0
5
10
15
20
25
30
35
40
45
Islamabad Karachi Lahore Peshawar Quetta Rawalpindi
NO
xco
ncen
trati
on
[pp
b]
Cycle 1 (2003) Cycle 2 (2003) Cycle 3 (2004) Cycle 4 (2004)
Figure 4: NOx 48-hour concentrations in 2003 and 2004, averaged overmonsoon (cycle 1 and 3) and summer (cycle 2 and 4) seasons,respectively, in six Pakistani cities
Source: SUPARCO (2005)
The NOx concentrations, if interpreted as the essentially NO2, are all below the WHO 24-
hour guideline value of 200 µg/m3 or 106 ppb. Although the 48-hour concentrations

13
cannot be rigorously compared with the 24-hour guideline value the results indicate that
the observed 24-hour NO2 concentrations would comply with the guideline value.
DustTrak™ 8520 Aerosol Monitors were used by IUCN/SUPARCO and SEI in order to
augment current PM monitoring in Karachi. The DustTrak is a portable, battery-operated
laser photometer with real-time mass concentration readout and data logging capability.
The monitor provides reliable exposure assessment by measuring particle concentrations
corresponding to respirable size, PM10, PM2.5 or PM1.0 size fractions. The DustTrak
monitoring was conducted from September 2007 to August 2008.
A training session for SUPARCO staff was conducted to explain how to use the DustTrak
This session included explain the functioning of the device, the change and preparation
of inlets for PM10, PM2.5 and PM1.0 monitoring, the checks of functionality, the procedure
for regular calibration consisting of flux control and zeroing, cleaning of the devices and
main quality assurance/quality control procedures.
6 Results
Figure 5 shows the results of the monitoring exercise of PM1 and PM2.5 concentrations
using the DustTraks. The measurement was performed on from September 2007 to
June 2008. This figure is indicative of the magnitude of PM concentrations for coarse
and fine particles. Apparently most, i.e. around 80 per cent of PM2.5 is PM1, an
observation that is now often made in cities of developing countries. The figure also
shows that the average daily concentrations during this period would well exceed the
PM2.5 guideline value of the WHO (WHO, 2005) almost all the time.
14
0
100
200
300
400
500
600
03/0
9/20
07
17/0
9/20
07
01/1
0/20
07
15/1
0/20
07
29/1
0/20
07
12/1
1/20
07
26/1
1/20
07
10/1
2/20
07
24/1
2/20
07
07/0
1/20
08
21/0
1/20
08
04/0
2/20
08
18/0
2/20
08
03/0
3/20
08
17/0
3/20
08
31/0
3/20
08
14/0
4/20
08
28/0
4/20
08
12/0
5/20
08
26/0
5/20
08
09/0
6/20
08
23/0
6/20
08
07/0
7/20
08
21/0
7/20
08
Date
Co
nc
en
trati
on
Ug
/m3
PM1
PM2.5
WHO Guideline 20 µg/m3
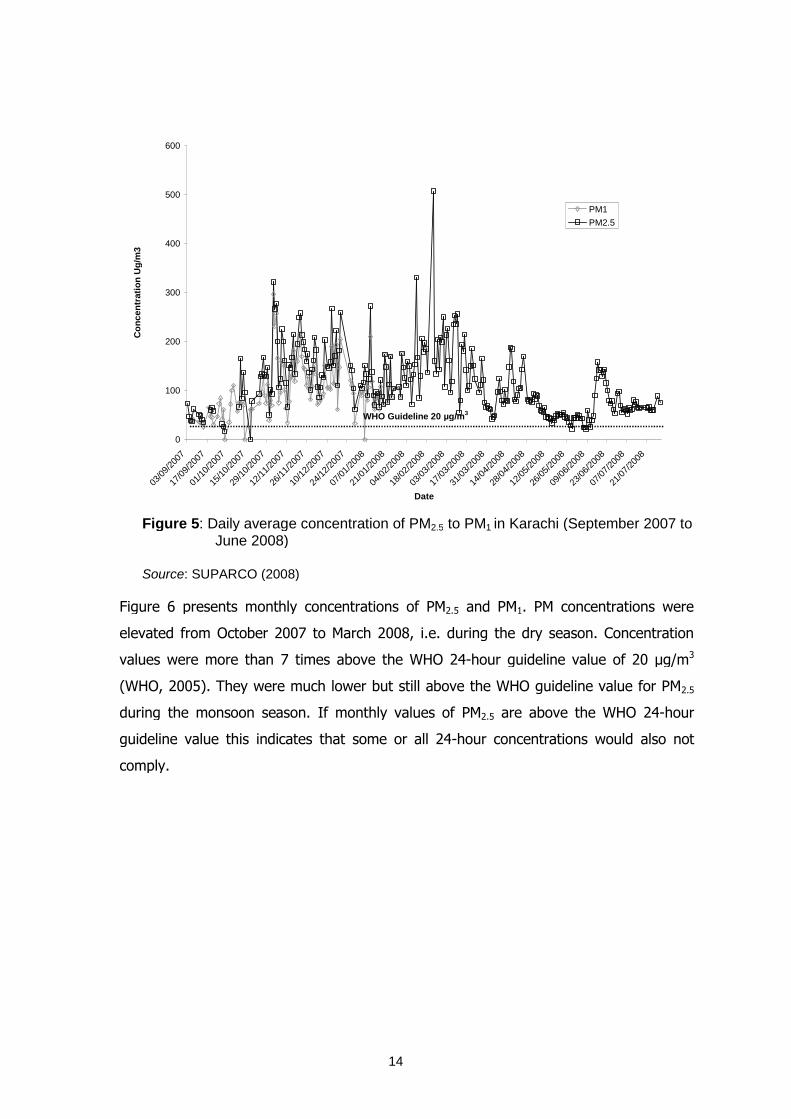
Figure 5: Daily average concentration of PM2.5 to PM1 in Karachi (September 2007 toJune 2008)
Source: SUPARCO (2008)
Figure 6 presents monthly concentrations of PM2.5 and PM1. PM concentrations were
elevated from October 2007 to March 2008, i.e. during the dry season. Concentration
values were more than 7 times above the WHO 24-hour guideline value of 20 µg/m3
(WHO, 2005). They were much lower but still above the WHO guideline value for PM2.5
during the monsoon season. If monthly values of PM2.5 are above the WHO 24-hour
guideline value this indicates that some or all 24-hour concentrations would also not
comply.
15
0
20
40
60
80
100
120
140
160
180
200
Sep-07 Oct-07 Nov-07 Dec-07 Jan-08 Feb-08 Mar-08 Apr-08 May-08 Jun-08
Month
Co
nc
en
tra
tio
n(µ
g/m
3)
PM2.5 PM1
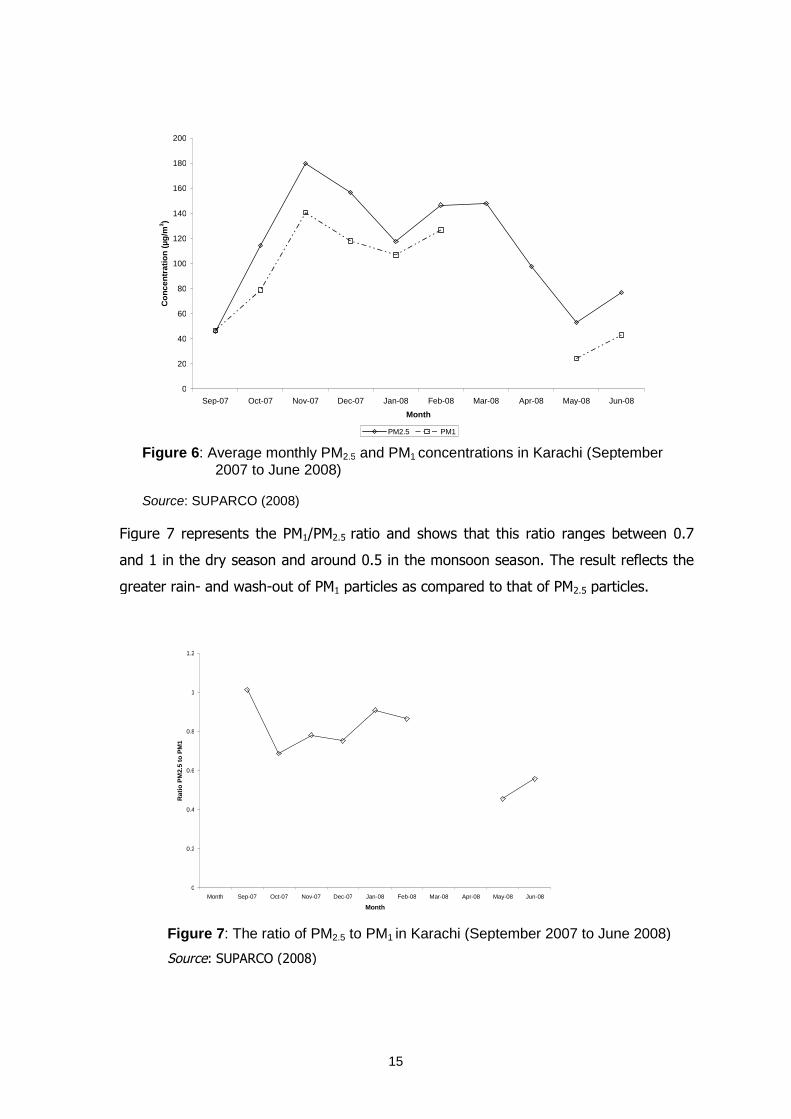
Figure 6: Average monthly PM2.5 and PM1 concentrations in Karachi (September2007 to June 2008)
Source: SUPARCO (2008)
Figure 7 represents the PM1/PM2.5 ratio and shows that this ratio ranges between 0.7
and 1 in the dry season and around 0.5 in the monsoon season. The result reflects the
greater rain- and wash-out of PM1 particles as compared to that of PM2.5 particles.
0
0.2
0.4
0.6
0.8
1
1.2
Month Sep-07 Oct-07 Nov-07 Dec-07 Jan-08 Feb-08 Mar-08 Apr-08 May-08 Jun-08
Month
Ra
tio
PM
2.5
toP
M1
Figure 7: The ratio of PM2.5 to PM1 in Karachi (September 2007 to June 2008)
Source: SUPARCO (2008)

16
Figure 8 shows the daily variations of PM2.5 and PM1 during the monitoring period
September 2007 to January 2008. It also shows the hourly values of PM2.5 averaged
over the period September 2007 to July 2008. All three time patterns are distinguished
only by the magnitude of the concentrations while the slopes do not differ.
0
50
100
150
200
250
0 2 4 6 8 10 12 14 16 18 20 22 24
Daytime
PM
co
ncen
trati
on
[µg
/m3]
PM2.5 (Sep-July) PM2.5 (Sep-Jan) PM1.0 (Sep-Jan)
Figure 8: Daily variation of PM2.5 and PM1
Source: SUPARCO (2008)
Two maxima are visible: one between 8 am and 10 am and the other one between 11
pm and 2 am. While the first maximum can be interpreted as reflection of the morning
traffic rush hours the sources responsible for the second maximum are not so clear.
Figure 9 shows the daily ratio of PM1 to PM2.5 averaged over the period September 2007
to January 2008. The values of this ratio range between 0.72 and 0.86 and indicate a
major contribution of particles below 1 µm. A distinct maximum is seen between 10 am
and 5 pm indicating the prevalence of PM1 particles during that time of the day.

17
0.70
0.72
0.74
0.76
0.78
0.80
0.82
0.84
0.86
0.88
0 2 4 6 8 10 12 14 16 18 20 22 24
Daytime
PM
1/P
M2
.5
Figure 9: The daily variation of the ratio PM1/PM2.5
Source: SUPARCO (2008)
7 Policy Recommendations
The main challenges to achieving better air quality in Karachi include rapid urbanisation,
rural-urban migration, haphazard growth, unplanned settlements, vehicle emissions, and
an increase in number of vehicles, industrial emissions and mismanagement of solid
waste, and weak institutional capacity. Tools to overcome these challenges include the
implementation of a sound and rational air quality management (AQM) within the overall
policy framework, as well as in specific policies aimed at land use planning, energy,
transport and industrial development.
AQM aims to maintain the quality of the air that protects human health and welfare but
also provides protection of animals, plants (crops, forests, and natural vegetation),
ecosystems, materials and aesthetics, such as natural levels of visibility. AQM is a tool
which enables governmental authorities to set objectives to achieve and maintain clean
air and reduce the impacts on human health and the environment. Governmental
authorities in collaboration with other stakeholders can determine the individual steps of
the implementation of this process according to:
- local circumstances with respect to background concentrations of air pollutants
and technological feasibilities;
- cultural and social conditions; and
- financial and human resources available.

18
An effective AQM strategy is dependent on a number of factors such as emission
inventories, air quality monitoring networks, dispersion models, exposure and damage
assessments, health and environment based standards together with a range of cost-
effective pollution control measures and the legislative powers and resources to
implement and enforce them (see Table 2).
Table 2: Components of a strategic framework for air quality management
Air Quality PoliciesTo include and/or strengthen the concept of air quality, humanhealth and environment in policies, legislation and itsharmonisation and implementation in the development ofKarachi.
Air Quality GovernanceTo facilitate law enforcement and inform, educate, train andstrengthen stakeholder participation in all aspects related toair quality and the prevention and reduction of air pollutionand the corresponding health and environmental impacts.
EmissionsTo include and/or strengthen enforceable, affordable,sustainable and highly effective measures to assess andreduce emissions
Air Quality ModellingTo support and strengthen national and local air qualityestimates and allow source apportionment and estimations oftransboundary pollution
Air Quality MonitoringTo establish and/or strengthen national and local air qualitymonitoring programmes to assess compliance with national airquality standards and assess health and environmentalimpacts
Health, Environmental andEconomic RiskAssessments
To establish and/or strengthen national and local programmeswhich monitor the health, environmental and economic impactof air pollution in a harmonised way
Financing of AQMTo establish mechanisms for financial sustainability in regional,national and local air quality, environmental and healthprogrammes including financing from private sector and othersectors
AQM enables governmental authorities in collaboration with other stakeholders to:
- identify and establish appropriate policies on air quality;
- identify relevant legislative and regulatory requirements;
- identify all sources of air pollution caused by human activities;
- set appropriate objectives and targets for human and environmental health;

19
- set priorities for achieving objectives and targets;
- establish a structure and programmes to implement policies and achieve
objectives and targets;
- facilitate the monitoring of air quality and effects on human health and
environment;
- facilitate urban planning, corrective action and the prevention of adverse effects;
- ensure compliance with emission and air quality standards;
- account for changing circumstances.
A strategic approach to air pollutant reduction in Karachi will only be implemented if the
ideas developed are generally accepted by all stakeholders. It is therefore necessary to
bring the strategic approach to the attention of inter- and supranational organisations,
governments, environmental protection agencies, industry, academia, media, aid
agencies, and non-governmental organisations (SF, 2004). Clean air implementation
plans (CAIPs) are a viable means of improving air quality and are a convenient way of
reporting on activities in AQM. CAIPs contribute to public information and awareness
rising. It is necessary and advantageous to implement the CAIP in incremental steps,
tailored to the goals, policies, needs, capabilities and resources available.
Strengthening the national and local institutional set-up for AQM ensures the capability
to implement AQM policies, enforce laws and regulations and review their effectiveness.
It is necessary to ensure different organisations are equipped with physical and financial
resources to undertake their responsibilities and to avoid friction and competition among
these stakeholders. Undertaking periodic reviews of key parts of AQM assists in
measuring progress in AQM. Periodic review will determine the effectiveness of AQM
systems and the desirability and feasibility of broadening the scope of and designing its
functioning. AQM procedures become more effective if all stakeholders help consider the
need for stakeholder capacity enhancement in AQM and develop national and local
strategies to work with the mass media and strengthen their participation. Capacity for
pubic information can be used to regularly inform the general public and other
stakeholders of the importance of AQM policy and strategy. A focus upon “champions of
AQM” to convey air quality information increases the awareness in public groups and
ensures that AQM issues have a high public profile.

20
Strategies
AQM strategies to address outdoor air pollution can be implemented in five areas:
transport, industry, area sources, transboundary and climate change. The following
section briefly examines various strategies for managing air quality in each of these
areas. The key to implementation is an assessment of the priorities of the issues
associated with emissions in each area. The strategies to reduce air pollution should
address the priority issues and pollutants. In most cases, the emissions with the greatest
health effects should be targeted first.
Industry
To implement strategies to reduce urban industrial emissions, it is important to have
adequate information on the type of emissions from these industries, tendencies in
emissions and effectiveness of actions to reduce these tendencies, and priorities. Most
of this information should be available from emissions inventories. The main strategies
for addressing industrial pollution are the promotion of cleaner production, emissions
reduction by industry, land use planning and zoning.
A multitude of sources exist in Karachi such as steel mills, chemical and engineering
works, oil refineries, ship building yards, railroad yards, jute and textile factories,
printing and publishing plants, food processing plants, and numerous small uncontrolled
plants. Many of these facilities are old or obsolete. For future industrial facilities in
Karachi a general low cost option is not to permit the import of obsolete technologies
from developed countries (see Table 3). Technologies imported in developing countries
should follow the same state-of-art technology as those in developed countries. Banning
the import of obsolete technologies would avoid health and environmental impact which
will be much more costly to address once the technology is installed.
Table 3: Measures to reduce industrial air emissions
Measure Description
Ban the import of
obsolete technologies
from developed countries
Technologies imported in developing countries should follow
the same state-of-the-art technology in developed countries
in order to avoid health and environmental impacts that will
be more costly to sort out once the technology is installed.

21
Transport
Motor vehicles are a main source of PM in Karachi. Air pollution from the transport
sector has important health and environmental effects. Road transport is responsible for
a significant proportion of NO2 and PM (PM10 and PM2.5), which are the pollutants most
likely to exceed air quality objectives. Therefore reducing emissions from urban motor
vehicles is a key part of local AQM.
Better traffic management reduces congestion, makes smoother driving possible and
thus reduces vehicle exhaust emissions. Traffic management measures include banning
or restricting traffic, parking restrictions, promoting bus public transport, walking and
cycling. As well as the direct pricing of road use and integrating land use and transport
planning with local air quality management strategies to improve air quality. Poor traffic
management, congestion, exposure to traffic pollution and fear of accidents are a
disincentive to people to both walk and cycle in an urban environment.
A number of measures can be adopted which address not only vehicle pollution control
but demand management. To achieve an environmentally sustainable transport system,
ensuring a minimal environmental impact both in the short- and long-term, measures
will need to be taken to reduce the overall demand for travel, and to encourage the use
of less polluting modes of transport. This requires the adoption of a combination of
measures ranging from emission standards to land use policies, in order to ensure that
the overall need to travel and vehicle pollution are reduced (Gwilliam et al., 2004).
However, none of these strategies alone will provide the optimum solution.
Combinations of strategies applied progressively over a period of time and in an
integrated manner will normally achieve the best results, although the details and
optimum mix of strategies will vary according to local circumstances. The strategies for
managing pollutants from transportation activities are discussed below.
Land use
Land use planning has important implications for energy consumption and vehicle-
related air pollution. Travel and transport developments interact to allow significant land
use changes. The result has been the development of more energy-intensive land use
and increased vehicle activity patterns. Land use planning has been shaped by the
increasing dominance of the motor vehicle as the main mode of transport. As urban
developments become more decentralised, and move to the fringe of the city, there is

22
an increase in car dependence for normal everyday travelling, to work, school, shopping
and leisure activities.
There is a need to integrate land use and transport planning within local AQM strategies
in order to improve air quality and change travel behaviour. The provision of
infrastructure in the past has shown that it exacerbates rather than solves the problem.
New roads can generate more new traffic (SACTRA, 1999).
Traffic management
Traffic management can be used to reduce vehicle emissions. Traffic management
measures have included computerised traffic light control, network and junction design,
parking controls, reducing the supply of space allocated to car parks, speed limits,
restricted access for non-essential traffic, bus priority lanes, pedestrian areas and cycling
facilities. These measures not only reduce energy use but also provide an environment
which is more people-friendly and which encourages greater walking and cycling.
Small traffic management schemes can influence air quality in their immediate vicinity,
but are likely to have a relatively small effect over a larger area. Free-flowing traffic and
smooth driving techniques usually mean lower emissions and better fuel consumption. It
should be a general objective of traffic management to reduce congestion, making
smoother driving possible, but without speeding. However, improving traffic flow and
reducing congestion may attract more vehicles and additional measures may be required
to prevent an increase in vehicle movements.
Enforcement of traffic laws and regulations can provide considerable improvement in
traffic flow (USEPA, 1998). However, improved traffic flow can also generate increased
traffic unless used in combination with management of traffic demand. This may include
measures to discourage use of vehicles in congested areas of the city during peak
periods by using parking policies, congestion charges, and electronic road pricing. Travel
demand management is attractive to Pakistani cities as it normally involves
implementation of relatively low cost actions with considerable success.
Encouraging alternatives to the private motor vehicle
Use of public transport and non-motorized transport (NMT) can help reduce transport
emissions by reducing use of private vehicles. However, efficient bus or rail systems
need to be developed by making them sufficiently attractive to induce high occupancy
rates. High standards of quality of service need to be implemented to avoid or curtail the

23
operations of informal transport providers using small, old, polluting, and poorly
maintained vehicles. Bicycle and pedestrian programmes also need to be attractive to
the public by giving emphasis to safe and efficient transport.
Reducing motor vehicle emissions
Improvements in fuel and vehicle technologies provide cost-effective options to reduce
vehicle emissions in many developing countries where there is a rapid growth in private
vehicle ownership. The Government can implement the use of cleaner fuels and tighter
emission standards for new vehicles without direct additional costs to governments. This
can be achieved by passing the costs to consumers, and amending the taxation
schedules to reduce taxes on cleaner fuels and vehicles and increasing the taxation on
polluting fuels and vehicles. However, regulations to reduce fuel adulteration and
substitution should be considered. Fuels and vehicles can be thought of as a joint
system, as cleaner vehicle technologies usually require improved fuels.
Cleaner fuels usually involve the elimination of lead, and reductions in sulphur, benzene,
vapour pressure and total aromatics in petroleum, and lowering the density, sulphur,
and polycyclic hydrocarbons in diesel. The introduction of cleaner fuels needs close
consultation with stakeholders, particularly the oil and auto industries, and usually
requires short- and medium-term strategies to enable the fuel and vehicle industries
sufficient time to adapt.
Improving fuel quality may also involve the introduction of alternative fuels to reduce
particle emissions. These alternative fuels include LPG, CNG, biofuels, hydrogen and
electricity. In addition to reducing emissions of air pollution, these fuels may diversify
energy sources and reduce greenhouse gases (GHG) emissions. Vehicle technologies
being used to reduce emissions include catalytic converters, exhaust gas recirculation,
and diesel particle traps. Use of these technologies in new vehicles is largely driven by
new vehicle emission standards.
Without a balance between the emission standards for new vehicles and for in-use
vehicles, there can be adverse unintended consequences. Stringent requirements for
new vehicles can be expensive, and if standards for in-use vehicles are lax or not
effectively implemented, vehicle replacement is delayed, resulting in an ageing, high
emission vehicle fleet. Effective implementation of standards for in-use vehicles is
necessary to ensure that vehicles with high levels of emissions are repaired or retired
from the road.

24
Vehicle inspection and maintenance (I&M) programmes can successfully reduce
emissions from old vehicles and ensure that new vehicles remain in good condition.
Emissions of CO and HC can be reduced up to 25 per cent through strict I&M
programmes. Criteria pollutants commonly regulated for in-use diesel vehicles are PM,
smoke, and NO2 for petrol-fuelled vehicles, CO, HCs, and NOx and for two- and three-
wheeled vehicles, CO, HCs and smoke (ADB, 2003). These I&M programmes also
accelerate the disposal of old and inefficient cars. However, they may face financial,
political and enforcement difficulties. Different countries have had varying levels of
success with effective implementation of I&M.
Test procedures should be designed to make it difficult to cheat or avoid testing, and to
minimise differences between test centres and maximize reproducibility. Strong
independent oversight and auditing of the system is required.
If resources are limited, it is usually advisable in the initial phase of implementation to
focus resources on a limited number of vehicle categories, such as vehicles that travel a
large number of kilometres per year and are heavily polluting (such as commercial diesel
vehicles) in preference to testing every vehicle every year (Gwilliam et al., 2004).
Where centres conduct both testing and maintenance it is difficult to supervise and audit
the test and repair systems to provide quality control and prevent corruption. Outcomes
are better where the testing and repair functions are clearly separated with centralised,
test-only I&M centres (ADB, 2003).
Measures to reduce transport emissions in Karachi
Table 4 presents the key low cost measures that can be taken to reduce motor vehicle
emissions n Karachi.
Many vehicles in Karachi are older than 14 years. Obsolete vehicles which would not be
licensed anymore in their countries of origin emit 10 times more air pollutants than
newer vehicles. Pakistan should not allow the import of obsolete vehicles and to phase-
out old vehicles already in circulation.
The use of low sulphur fuels in vehicles, particularly diesel-driven vehicles, reduces the
emission of ultra fine sulphates which are a serious threat to human health because they
can be carcinogenic.
Smoothing traffic flow and reducing speed, banning or restricting traffic, or particular
types of vehicles, working with business and public to raise awareness of implications of

25
Table 4: Measures to reduce motor vehicle emissions in Karachi
Measures Description
Traffic management Traffic management measures include computerised traffic light
control, network and junction design, parking controls, reducing
the supply of space allocated to car parks, speed limits, avoiding
obstacles leading to acceleration- and deceleration driving,
restricted access for non-essential traffic, bus priority lanes,
pedestrian areas and cycling facilities.
Regulation and
control of public bus
transport
Use of efficient and comfortable public transport systems can
help reduce transport emissions by reducing use of private
vehicles. High standards of quality of service need to be
implemented.
Segregated lanes Segregated lanes can help smooth the traffic flow thus reducing
emissions.
Non-motorized
transport (NMT)
NMT is cycling and walking and serves to reduce short-distance
car trips which are most polluting. Segregated lanes for
motorized and NMT are necessary.
Ban the import of
obsolete vehicles and
phase-out old vehicles
still circulation.
Many vehicle fleets in SSA cities are older than 14 years.
Obsolete vehicles which would not be licensed anymore in their
countries of origin emit 10 times more air pollutants than newer
vehicles. A low cost option is to not allow the import of obsolete
vehicles and phase-out old vehicles already in circulation.
Physical restraint Physical restraints on vehicle use may take the form of limiting
use of vehicles on specific days or in specific areas provided
public transport facilities exist.
Parking policies Parking policies including Park and Ride Systems are likely to
reduce both congestion and the demand for individual motorized
transport. Effective enforcement of parking restrictions is
necessary.
Road pricing Tolls on roads and motorways and congestion charges for the
access to urban areas help limit car movement provided viable
alternatives exist and under pricing is avoided.
Use of low sulphur
fuels in vehicles
The use of low sulphur fuels in vehicles, particularly diesel-driven
ones reduces the emission of ultra fine sulphates which are a
serious threat to human health because due to their carcinogenic
properties.

26
transport choice. Stop-and-start driving, typical of congested traffic, increases total
emissions of PM for the same distance travelled. Traffic management can smooth out
speeds on existing traffic volumes and reduce emissions. CO, hydrocarbons, and PM
emission levels tend to fall and NOx emissions rise, with increasing vehicle speed.
A general low cost option to reduce motor vehicle pollution is better traffic management
which reduces congestion and makes smoother driving possible. Measures include
banning or restricting traffic, parking restrictions, promoting bus public transport,
walking and cycling. As well as the direct pricing of road use and integrating land use
and transport planning with local air quality management strategies to improve air
quality. Poor traffic management, congestion, exposure to traffic pollution and fear of
accidents are a disincentive to people to both walk and cycle in an urban environment.
Figure 9 presents recommendations to reduce emissions from the transport sector
ordered according to increasing level of cost.
Area sources
Burning of biomass and open burning of waste are major contributors to poor air quality
in Karachi. It is therefore necessary to implement strategies to reduce urban emissions
from areas sources such as forest fires, burning of biomass and open burning of waste.
Prevention and control strategies may include enforcement of bans on burning of
materials or waste, and promotion of alternatives to burning. These may also include
paving roads, establishing re-vegetation programmes in dust control areas and use of
street sweeping equipment. Education strategies may involve informing the community
about sources of emissions, and the impact of these practices on health and the
environment (WHO, 2000).
Open burning of waste can produce toxic emissions. To address this issue it is necessary
to identify areas where this occurs, assess the extent of the problem; then assess the
adequacy of the city’s provision of disposal means in these areas and, if necessary,
improve the facilities and capacities for solid waste management (SWM). The present
SWM situation in Karachi can be characterised as sub-standard, inefficient and
hampered by serious organisational and technical deficiencies, resulting in various
dysfunctional systems and many related negative effects on the environment and public
health. Household, industrial and medical waste is sometimes deposited in the same
landfill sites. Used car accumulators generated in Pakistan are not collected and usually

27
end up at illegal dumps or are mixed with the municipal solid waste (MSW) and disposed
at municipal landfills. No incineration facilities for the disposal of SWM exist in Karachi.
Figure 9: Options to reduce motor vehicle emissions based on increasing cost
SWM strategic objectives and targets include:
SWM policy and legislative framework development;
Institutional/organisational arrangements;
Human resources and capacity enhancement;
Final disposal facilities;
Waste separation, storage, collection and transport systems;
Financing and cost recovery instruments;
Stakeholder awareness and communication;
IncreasingCost
Ban the Importation of Old Second-
Hand Motor Vehicles
Reduce Sulphur Content in Diesel
Traffic Management Measures to
Ensure Free Flowing Traffic
Transport Demand Management
Replace Diesel Driven Bus Fleet by
CNG-LPG/CNG
Inspection And Maintenance System

28
Data availability and reporting requirements;
Waste avoidance and reduction targets;
Waste recovery and recycling systems;
Waste treatment and processing facilities.
Recycling is presently not financially feasible in Pakistan since the net costs are
considerably higher than the costs of land filling. This is mainly due to the high costs of
the required separate collection, limited volumes and lack of proper processing facilities.
In order to stimulate and increase the recycling rates, the introduction of specific
product charges and taxes would be necessary. The required extensive organisational
capabilities at national and local level however are not considered adequate yet to
handle such complicated systems. Therefore the introduction of “producers’
responsibility” is strongly recommended as a low cost option; an approach that is
increasingly applied in other countries.
Measures to reduce area source emissions in Karachi
Table 5 presents the key low cost measures that can be taken to reduce polluting air
emissions from areas sources in Karachi.
Table 5: Measures to reduce polluting air emissions in Karachi
Measure Description
Ban deliberate open burning in
urban areas and at municipal waste
deposits.
A ban of open burning in urban areas helps reduce
pollutant emissions. A collection, expert deposition
and/or treatment must exist in order to enforce the
ban
Burn municipal and industrial
hazardous wastes in existing
cement plants at high
temperatures.
Hazardous wastes must be treated before
deposition of their residues. Municipal waste
incinerators are expensive due to the high
temperatures of incineration needed. Cement
plants use incinerating temperatures high enough
to burn most hazardous wastes and produce non-
hazardous ashes and residues.
Collection and use of used tyres as
fuel in cement kilns.
Open burning of used tyres in urban areas and on
waste deposits leads to high emissions of PM and
should therefore be avoided. Their incineration in
tar and lime production facilities or cement kiln
avoids this problem.

29
A ban of open burning in urban areas helps reduce pollutant emissions. A collection,
expert disposal and/or treatment must exist in order to enforce the ban. Facilities for
waste treatment such as waste incineration plants are expensive. A low cost option for
air pollution caused by area sources would be to ban deliberate open burning in urban
areas and at municipal waste deposits. However, two challenges occur as a
consequence of such a ban:
Open burning of wastes in urban areas are banned and the ban enforced, a
viable collection, disposal and/or treatment system of SWM must be available.
Due to the high ambient temperatures experienced in Pakistan accidental
burning of waste deposits also occurs, in particular if municipal and industrial
wastes are deposited together.
Hazardous wastes must be treated before deposition of their residues. Municipal waste
incinerators are expensive due to the high temperatures of incineration needed. Cement
plants use incinerating temperatures high enough to burn most hazardous wastes and
produce non-hazardous ashes and residues. Provided that transport facilities for wastes
exist, a low cost option to treat municipal and industrial hazardous wastes would be
burning the wastes in existing cement plants at the high temperatures that are used
there.
In Pakistan most used tyres from motor vehicles are currently sent to landfill or are
burned in the open air. Open burning of used tyres in urban areas and on waste
deposits leads to high emissions of PM and should therefore be avoided. Their
incineration in a cement kiln avoids this problem.
Transboundary air pollution
The transboundary movement of air pollution across borders may cause adverse effects
in countries other than the country of origin. With advanced monitoring and modelling
technology there is more evidence that pollution emitted in one part of the world can
create adverse effects in other parts. Pollutants with a potential for regional and
intercontinental transport include: fine particles; acidifying substances (SO2, NOx); O3
and its precursors (VOC and NOx); heavy metals (mercury); and persistent organic
pollutants (POPs).
Pollutant levels at a location are determined by a combination of processes, including
the intensity of local source emissions, the atmospheric capacity to dilute the emission,

30
the natural removal processes, the physical and chemical transformation of pollutants,
and the amount transported from upwind regions. Dust from the Sahara regularly
causes a number of high PM events in Europe and even reaches Central and South
America, and occasionally the State of Florida. Emissions from human activities in
populated cities may be transported over large distances.
Within Southern Asia, the major transboundary air pollution issues of concern include:
regional haze from forest fires, atmospheric brown cloud (ABC), acid deposition and
regional dust. In addition, trace elements from coal combustion, particularly mercury
(Hg), have a high potential for long-range transport (UNEP and C4 2002; UNEP 2002;
Pottinger et al., 2004).
Regional haze from forest fires
Haze is the suspension of extremely small (dry) particles in the atmosphere which are
invisible to the naked eye. However, they are numerous enough to give the atmosphere
an appearance of opalescence together with reduced visibility (ISO, 1994). Sub-micron
particles effectively scatter and absorb sunlight and affect cloud formation, which may
introduce a range of effects from visibility reduction to climate change.
Smog is fog which has a high content of air pollutants (WMO, 1992). Smoke is an
aerosol originating from combustion, thermal decomposition or thermal evaporation. Its
particles may be solid (magnesium oxide smoke) or liquid (tobacco smoke) (IUPAC,
1997). The International Standard definition of smoke is that of a visible aerosol usually
resulting from combustion (ISO, 1994) or as a suspension in the atmosphere of small
particles produced by combustion (WMO, 1992).
Urban and other emissions observed in the IndoEx campaign (UNEP and C4, 2002) led to
massive thick aerosol layers covering much of Southern Asia and the Indian Ocean.
Tropospheric ozone pollution
Tropospheric ozone pollution is a transboundary in nature. Available data shows that
ambient concentrations of O3 are causing both visible injury and economic damage to
crops, forests and natural ecosystems (Heck et al., 1998; Emberson et al., 2003). It is
also clear that injurious effects of O3 on vegetation frequently occur as a result of
cumulative exposures over many days, weeks and months rather than during a few
hours of peak ozone days (Heck et al., 1999). O3 concentrations in the South Asian
region are currently unknown but modelling suggests that O3 can be at levels in Pakistan
31
that can cause crop yield reductions. O3 actually damages plants by inhibiting their
ability to open the microscopic pores (stomata) on their leaves and breathe (Roach,
1999).
Ozone pollution originating in urban areas can extend into surrounding rural and
forested areas that are hundreds of kilometres downwind. Episodes of elevated ozone
concentrations are associated with warm, slow moving high pressure systems and have
concentrations between 60 and 100 µg/m3. O3 is a powerful photochemical oxidant that
damages rubber, plastic, and all plant and animal life. O3 impacts on human health
include a number of morbidity and mortality risks associated with lung inflammation.
Other respiratory ailments including asthma, emphysema, and bronchitis represent the
primary health problems associated with human exposure to ground level ozone (WHO,
2000). Children are especially susceptible to O3 related illnesses because on average
they spend more time outdoors than adults and their airways are narrower than adults.
It also reacts with hydrocarbons from automobile exhaust and evaporated gasoline to
form secondary organic pollutants such as peroxyacyl nitrates that are very irritating to
the eyes and throat (WHO, 2000; 2005).
The only solution to reduce O3 concentrations is to reduce its precursor air pollutants
NO, NO2 and hydrocarbons.
Measures to reduce emissions which contribute to transboundary pollution
AQM strategies need to consider air emissions which contribute transboundary air
pollution and global climate change. Transbounday air pollution includes regional haze
from forest fires, atmospheric brown cloud (ABC), acid deposition, regional dust and
importation of hazardous waste. Measures will be in addition to and complement
measures to reduce sectoral emissions. Table 6 presents key measures that can be
taken to reduce the contribution to transboundary air pollution.

32
Table 6: Measures to reduce transboundary air pollution
Measure Description
Use of low-sulphur fossil
fuels (low sulphur coal
and oil, and natural gas).
Combustion of low sulphur fuels in industries and motor
vehicles reduces the emission of ultra fine sulphates which
are a serious threat to human health.
Use of low excess air NOx
burners in industries can
help to reduce NOx
emissions during
combustion.
This is a cost-effective method to reduce NOx emissions in
existing gas- or oil-fired plants and is essentially a change in
operating procedures. The polluter pays principle should
always apply but in the case of transboundary pollution
agreements among countries are needed.
Implement measures to
achieve co-benefits in the
reduction of urban air
pollutants and GHG
emissions
Many measures of air pollution reduction also reduce GHG
emissions. Such measures include cleaner production
technologies, cleaner fuels and vehicles, and demand
management of goods and services.
Use the Clean
Development Mechanism
(CDM) as an instrument
to implement co-benefit
measures
The use of the CDM can lead to increased energy efficiency
and conservation; transfer of technologies and financial
resources; local environmental and human health benefits.
Subsequent benefits will include sustainable energy
production; private and public sector capacity development;
and poverty alleviation and equity realisation through
income and employment generation.
Measures all emission sources
Table 7 presents the key low cost measures that can be taken to reduce polluting air
emissions from all sources in Karachi.
World Health Organization air quality guidelines
The World Health Organization (WHO) has derived air quality guideline (AQG) values
and exposure times for approximately 50 non-carcinogenic compounds and unit risk
(UR) values for approximately 30 carcinogenic pollutants (WHO, 2000). A few of these
AQG values – for SO2, O3 and PM - have been recently updated (WHO, 2005). The AQG
values of WHO are derived in expert consultations in which the globally available
literature on air pollution induced adverse health impacts is compiled, reviewed,
evaluated and AQG and UR values developed on the basis of the exposure-response
relationships reported in the literature.

33
Table 7: Measures to reduce polluting air emissions from all sources in Karachi
Measure Description
Using WHO air quality
guidelines to set air
quality standards.
The WHO air quality guidelines(AQG) can be utilized for
setting air quality standards (AQS) in a country because the
criteria for the derivation of AQG values are also valid for
setting AQS. Use of the WHO AQG values to set AQS is a low
cost option for developing countries in SSA.
Use of a simple
integrated model for air
quality management.
The Simple Integrated Model for Better Air Quality (SIM-AIR)
is a relatively new interactive model to examine emissions,
ambient air quality and health.
Non-carcinogenic AQG values reflect a low risk of incidence of adverse health effects if
the AQG values are complied with. If the AQG values are exceeded this does not
necessarily mean that adverse effects occur in a population but only that the risk for
such effects increases. The AQG can be utilised for setting national air quality standards.
Experience from developed countries may be used to collect information on the
acceptable number of times standards are exceeded. A participatory approach in setting
standards which involves stakeholders (e.g. industry, local authorities, NGOs, media and
the general public) assures - as far as possible - social equity or fairness to the parties
involved. The provision of sufficient information and transparency in standard setting
procedures ensures that stakeholders understand the environmental, health and socio-
economic impacts of such standards.
Setting air quality standards on the basis of WHO AQG values does not mean that the
adopted standards have to have the same WHO values. Rather air quality standards
have to be set considering the prevailing exposure levels and the environmental, socio-
cultural and economic conditions in a country. WHO’s AQG values, therefore, should be
considered as target values, only to be implemented stepwise. Presently, in most
countries air quality standards are above the WHO AQG values. For PM the WHO has
developed a procedure of setting intermediate air quality standard values which can be
implemented in the medium- to long-term (WHO, 2005).
Use of the WHO AQG values to set air quality standards is a low cost option for Pakistan.
34
Use of a simple integrated model for air quality management
The Simple Integrated Model for Better Air Quality (SIM-AIR) is a relatively new
interactive model to examine emissions, ambient air quality, and health. While it relies
on some of the basic approaches and emission factors contained in AP-42, CORINAIR,
and RIAS, it is based on an integrated AQM approach and provides a user-friendly
visualisation of rapid assessment of pollution data and control options. The SIM-AIR
integrated approach has a number of advantages:
allows definition of all major types of urban emission sources, such as point,
mobile, and area;
provides default emission factors where available (users can change these
factors based on local context, or use CORINAIR, AP-42 or RIAS emission
factors);
interfaces an emission computation model with key technology and management
options (e.g. fuel change, conversion of two stroke to four stroke engines etc.);
links emissions to ambient air quality through an externally created or supplied
source-receptor matrix (this allows user to apply an urban air quality model of
their choice. SIM-AIR is thus independent of the air quality model);
allows estimation of economic impacts on health. The user can edit exposure-
damage relationships according to local knowledge;
allows input of cost data for a broad range of AQM options;
encourages rapid assessment of management options in terms of cost
effectiveness;
provides an optimisation scheme to identify most cost-effective option
combinations.
SIM-AIR uses a “main” worksheet and eight other “theme” worksheets to display the
output in Excel format. The eight themes include emission distribution of non-transport
sources, vehicle data, emissions inventory, a menu of options, health impacts, transfer
coefficients to compute ambient concentrations, ambient concentrations, and, finally, a
help worksheet. The result is that for any grid of the study area, the input data contains
information on emission distribution, ambient concentration, health impacts, and
management options.
35
The SIM-AIR model is primarily a training tool and should not be used as the only
support system for decision making. However, as a training tool, it helps to understand
how different management options can influence health impacts.
8 Implementation in Karachi
A good overall environmental policy, supported by all responsible government
departments, can lead to sound and rational AQM in Karachi. AQM should be seen as an
objective for sustainable development. The implementation of a sound and rational AQM
within the overall policy framework, as well as in specific policies such as land use
planning, energy, transport and industrial development, will reduce the adverse impacts
of air pollution on human health and the environment. An integrated AQM process can
inform, educate and train all stakeholders and strengthen stakeholder participation in all
aspects related to air quality, e.g. adverse health and environmental impacts, prevention
and reduction of air pollution.
There should be an increased commitment to AQM and its enforcement from all
stakeholders, strengthening the legal basis of AQM in national laws and regulations and
strengthening the capacity of responsible agencies to effectively enforce AQM policies.
Existing international and regional guidelines, conventions and treaties related to AQM,
transboundary air pollution and global climate change should be adopted and
implemented. These will reduce the threats emerging from air pollution (e.g. the
adoption of WHO Air Quality Guidelines as a long-term goal and interim ambient
standards based on local conditions, experience and capabilities). Strengthening regional
cooperation and sharing information on all aspects of air quality will help to solve both
national and supranational challenges.
Setting of targets and establishing indicators for acceptable air quality in Pakistan can
improve the quality of the air, thereby reducing impacts on human health and the
environment. WHO AQG may be used in setting standards and averaging times. The
criteria for the derivation of air quality guidelines set by WHO are also valid for setting
standards. Experience from developed countries may be used to collect information on
the number of standard exceeding values not leading to adverse health or
environmental effects.
The provision of sufficient information and transparency in standard setting procedures
ensures that stakeholders understand the environmental, health and socio-economic
impacts of such standards. A participatory approach in setting standards which involves

36
stakeholders (e.g. industry, local authorities, NGOs, media and the general public) will
ensure assures social equity or fairness to all the parties involved. Strengthening the
commitment and role of the media can assist in identifying air quality-related problems
at an early stage. They can assist in communicating this information to the general
public and outlining the necessary action required.
Regulations on emission standards for mobile and stationary sources, air quality
standards, viable dispersion models and reliable monitoring procedures will ensure
rational and sound AQM. This includes, where appropriate, the adoption of emission
standards based on developed countries’ experiences. Best available control technology
avoids the problem of inequities among countries and prevents ‘social dumping’.
A regular review of AQM policies and legislation such as updating emission and air
quality standards and assessing the success and efficiency of AQM measures is
recommended. The establishment of an accredited body for evaluation of the efficiency
of programmes related to AQM can help in this assessment.
Regulations for frequent reporting of policy enforcement of AQM will give politicians and
managers responsibility for the implementation of the necessary information to define
the next steps in AQM.
Establishing national and regional accredited agencies for verification of data on
emissions, dispersion models (and their outputs), air pollutant concentrations and health
and environmental parameters will lead to data of known quality and enhanced reliability
of information. While collaboration and information sharing in AQM issues among all
responsible agencies is the best means to achieve the AQM goals at minimal cost.
A Clean Air Implementation Plan (CAIP) is a means of improving urban air quality in
Karachi and a convenient way of reporting on the different activities in AQM, such as:
estimating and/or monitoring emissions;
dispersion modelling;
air quality monitoring;
testing compliance with emission and air quality standards;
outlining measures to reduce emissions from mobile, stationary and area
sources; and
surveillance of health and environmental impacts.

37
The adoption of a CAIP as an instrument for implementing effective environmental
policy can assist in achieving policy goals in a structured and transparent manner. CAIPs
have been adopted and successfully implemented in developed countries
Tailored CAIP for Karachi could include:
a rapid assessment of the most important sources;
monitoring results from a minimal set of air pollutant concentration monitors;
simulation of the spatial distribution of air pollutant concentrations, using simple
dispersion models;
comparison with air quality standards;
assessment of adverse health and environmental impacts;
control measures to address pollution from mobile, stationary and area sources
and their costs; and
assessment of the internal and external costs and benefits of AQM.
CAIPs contribute to public information and awareness raising. CAIPs with rapid
assessment procedures are especially suited for countries and cities with relatively little
AQM capacity and where no established procedure exists for AQM. It is advantageous
to:
implement the CAIPs in incremental steps, tailored to the goals, policies, needs,
capabilities and resources available in the country;
validate the data for CAIPs through a national accredited body;
make information from CAIPs widely available; and
select an air quality champion for the dissemination of AQM information.

38
References
ADB (2003) Reducing vehicle emissions in Asia. Asian Development Bank, Manila.
http://www.adb.org/documents/guidelines/Vehicle_Emissions/reducing_emissionsasp#conten
ts
ADB 2005a Karachi Mega Cities Preparation Project. August 2005. Asian Development Bank,
Manila. http://www.adb.org/Documents/Produced-Under-TA/38405/38405-PAK-DPTA.pdf
and http://www.encyclopedia.com/topic/Karachi.aspx
ADB 2005b Technical Assistance, Islamic Republic of Pakistan: Preparing the Mega City
Sustainable Development Project. December 2005. Asian Development Bank, Manila.
http://www.adb.org/Documents/TARs/PAK/38408-PAK-TAR.pdf
ADB 2006a Paving Way for Karachi's Megacity Development. Asian Development Bank, Manila.
http://www.adb.org/Media/Articles/2006/9245_Pakistan_urban_development/default.asp
ADB 2006b Proposed Technical Assistance Loan to Islamic Republic of Pakistan, Mega City
Development Project, Project Number: 38405, January 2006. Asian Development Bank, Manila.
http://www.adb.org/documents/rrps/pak/38405-rrp-pak.pdf
Aziz JA 2006 Towards establishing air quality guidelines for Pakistan. Eastern MediterraneanHealth Journal 12: 886-893.
Dockery, D., Pope, A. and Xu, X. (1993) An association between air pollution and mortality in six
US cities. New England Journal of Medicine, 329: 1753-1759
EC 2000 Directive 2000/69/EC of the European Parliament and of the Council of 16 November
2000 relating to limit values for benzene and carbon monoxide in ambient air. Official Journal
of the European Communities L 313/12-21. http://eur-
lex.europa.eu/LexUriServ/LexUriServ.do?uri=OJ:L:2000:313:0012:0021:EN:PDF
Emberson L, Ashmore M, Murray F (eds.) 2003 Air Pollution Impacts on Crops and forests – A
Global Assessment.Air Pollution Reviews – Volume 4, Imperial College Press, London
GOV_PK 2005 Brief on Solid Waste Management in Pakistan. Government of Pakistan, Islamabad.
http:// www.environment.gov.pk/PRO_PDF/PositionPaper/Brief-SWM-%20Pak.pdf
Gwilliam, K., Kojima, M., and Johnson, T. (2004) Reducing air pollution from urban transport.
World Bank, Washington. Available from: http://www.cleanairnet.org/cai/1403/article-
60384.html
Hasan A 2007 Housing imperatives for Karachi. Dawn Newspaper, 28 November 2007, Pakistan.
http://www.aku.edu/ismc/pdfs/hasan_281107.pdf
http://www.anzorenaselavip.net/download/april08/033%20-
%20034%20%20Pak%20Housing%20Imperatives.doc
39
Heck WW, Furiness CS, Cowling EB and Sims CK 1998 Effects of ozone on crops, forest and
natural ecosystem: assessment of research needs. In EM: Magazine for Environmental
Managers, pp 11 - 22.
HEI (2004) Health effects of outdoor air pollution in developing countries of Asia: a literature
review, Health Effects Institute, Special Report 15, Boston
ISO (1994) Air quality – General aspects – Vocabulary. ISO 4225:1994. International
Organization for Standardization, Geneva
IUPAC (1997) Compendium of Chemical Terminology – IUPAC Recommendations, compiled by
McNaught, A.D. and Wilson, A. International Union of Pure and Applied Chemistry, Blackwell
Science Ltd, Oxford
Pak-EPA 2006 Air Pollution. Pakistan Environmental Protection Agency, Islamabad.
http://www.environment.gov.pk/PRO_PDF/PositionPaper/Air%20Pollution.pdf
Pak-EPA 2008 Pakistan Environmental Protection Agency, Islamabad.
http://www.environment.gov.pk/
PCFV 2008a Asia-Pacific Lead Matrix. Last updated in August 2008. Partnership for Clean Fuels
and Vehicles. http://www.unep.org/pcfv/PDF/LeadMatrix-Asia-PacificAug08.pdf
PCFV 2008b Diesel Fuel Sulphur Levels: Asia Pacific. Last updated in August 2008. Partnership for
Clean Fuels and Vehicles. http://www.unep.org/pcfv/PDF/Asia-PacificSulphurMap-Aug08.pdf
Pope, C.A. III, Burnett, R.T., Thun, M.J., Calle, E.E., Krewski, D., Ito, K., Thurston, G.D. (2002)
Lung cancer, cardiopulmonary mortality, and long-term exposure to fine particulate air
pollution. Journal of the American Medical Association, 287: 1132-1141
Pottinger, M., Stecklow, S. and Fialka, J.J. (2004) Invisible Export – A Hidden Cost of China’s
Growth: Mercury Migration. The Wall Street Journal, 20 December 2004.
http://yaleglobal.yale.edu/display.article?id=5058
Roach J (1999) Ozone Inhibits Plants' Ability to Breathe
http://healthandenergy.com/ozone_damages_plants.htm
SACTRA (1999) Transport and the economy. Standing Advisory Committee for Trunk Road
Assessment, Department for Transport, London.
http://www.dft.gov.uk/pgr/economics/sactra/transportandtheeconomyfullre3148
SF 2004 A Strategic Framework for Air Quality Management in Asia. Air Pollution in the Mega
cities of Asia (APMA) Project, Stockholm Environment Institute, York, Clean Air Initiative for
Asian Cities (CAI-Asia), Manila. http://www.cleanairnet.org/caiasia/1412/articles-
58180_StrategicFramework.pdf

40
SUPARCO 2005 Baseline (Ambient Air Quality) Study of Six Major Cities of Pakistan. Pakistan
Space & Upper Atmosphere Research Commission (SUPARCO), Karachi.
http://www.suparco.gov.pk/pages/spas-project08.asp
SUPARCO 2008 Private communication
UN 2008 World Urbanization Prospects: The 2007 Revision Population Database.
http://esa.un.org/unup/index.asp
UNEP 2002 Global Mercury Assessment. United Nations Environment Programme Chemicals,
Geneva. http://www.chem.unep.ch/MERCURY/Report/Final%20Assessment%20report.htm
UNEP and C4 2002 Asian Brown Cloud: Climate and other Environmental impacts. United Nations
Environment Programme, Nairobi. Center for Clouds, Chemistry and Climate, Scripps
Institution of Oceanography, University of California, San Diego, La Jolla, CA
www.rrcap.unep.org/issues/air/impactstudy/index.cfm and
www.scientificjournals.com/sj/espr/Pdf/aId/5339
UNIDO 2000 Industrial Policy and the environment in Pakistan. NC/PAK/97/018. United Nations
Industrial Development Organization, New York.
USEPA 1998 Transportation related documents, United States Environmental Protection Agency,
Office of Transportation and Air Quality, Washington DC.
http://www.epa.gov/otaq/stateresources/policy/pag_transp.htm#tcm
USEPA 2008 Technology Transfer Network, Air Toxics Website. United States Environmental
Protection Agency, Washington DC. http://www.epa.gov/ttn/atw/hlthef/benzene.html
WB 2006 Pakistan Strategic Country Environmental Assessment Report. (In Two volumes)
Volume 1: Main Report. The World Bank, Washington D.C.
http://web.worldbank.org/WBSITE/EXTERNAL/COUNTRIES/SOUTHASIAEXT/0,,contentMDK:214
59418~pagePK:146736~piPK:146830~theSitePK:223547,00.html and
http://www.environment.gov.pk/PRO_PDF/PositionPaper/Air%20Pollution.pdf
WHO 2000 Guidelines for Air Quality, WHO/SDE/OEH/00.02, World Health Organization, Geneva.
http://whqlibdoc.who.int/hq/2000/WHO_SDE_OEH_00.02_pp1-104.pdf
http://whqlibdoc.who.int/hq/2000/WHO_SDE_OEH_00.02_pp105-190.pdf
WHO (2002) Reducing risks, promoting healthy life. The World Health Report 2002, World Health
Organization, Geneva. http://www.who.int/whr/2002/en/index.html
WHO (2005) ‘WHO Air Quality Guidelines Global Update 2005. Particulate matter, ozone, nitrogen
dioxide and sulphur dioxide. Regional Office for Europe, World Health Organization,
Copenhagen. http://www.euro.who.int/Document/E90038.pdf
41
WHO 2006 Environmental burden of disease: Country profiles. World Health Organization,
Geneva. http://www.who.int/quantifying_ehimpacts/countryprofiles/en/index.html
WMO 1992 International Meteorological Vocabulary. WMO-No. 182. Secretariat of the World
Meteorological Organization, Geneva.