A Story About FPSO Project...
22
A Story About FPSO Project Performance Prepared by Neeraj Nandurdikar and Jonathan Walker
Transcript of A Story About FPSO Project...

A Story About FPSO Project Performance
Prepared by Neeraj Nandurdikar and Jonathan Walker

CONFIDENTIAL – UIBC 2012 2 INDEPENDENT PROJECT ANALYSIS
FPSO Performance…a Decade Later
• IPA explored the performance of floating production systems (FPS), and specifically of floating production storage and offloading (FPSO) vessels vs. other concepts
• Sample of 44 completed FPS projects, FPSOs represented half the sample
• FPSOs had the worst outcomes compared to any concepts evaluated, driven by poor practices and very aggressive schedules
In 2002:
• Increased sample to 134 completed FPS projects, FPSOs represents 60 percent of the sample
• Over the past decade, all evidence suggests no change in FPSO performance, and possibly, worsening of the outcomes
• Goal is to establish the current performance of FPSOs, as compared to other FPSs, and understand the root causes
In 2012:

CONFIDENTIAL – UIBC 2012 3 INDEPENDENT PROJECT ANALYSIS
Outline
• Database• FPSO vs. FPS Performance and Drivers
• Performance Difference by FPSO Execution Strategies
– Conversion vs. New Build
– Owned vs. Leased
• Drivers of FPSO Definition
• Conclusions and Path Forward
CONFIDENTIAL – UIBC 2012 4 INDEPENDENT PROJECT ANALYSIS
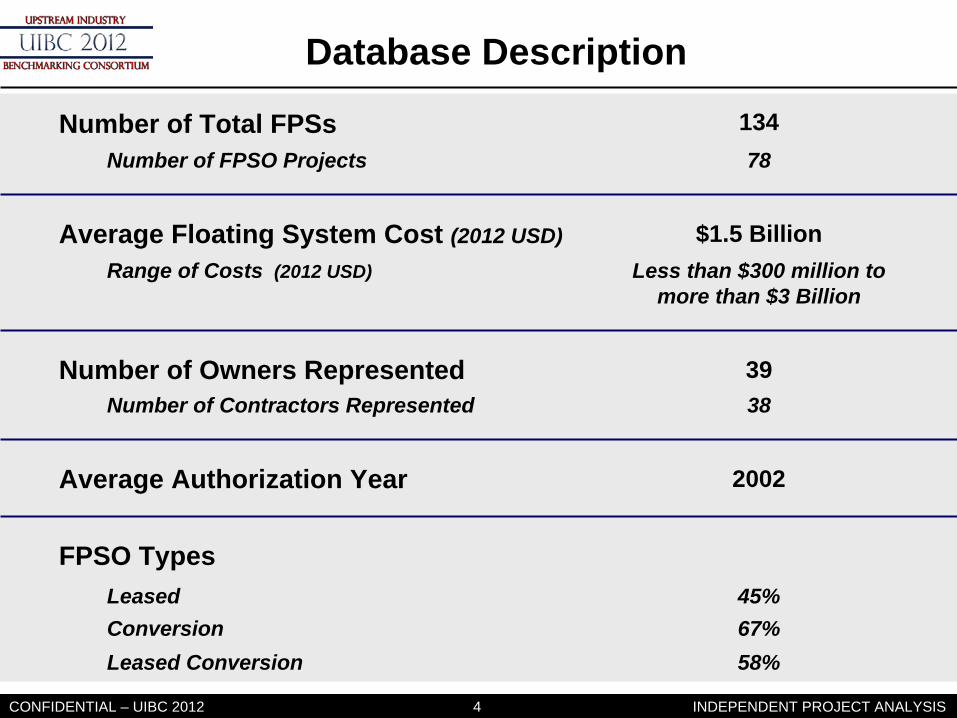
Database Description
Average Floating System Cost (2012 USD) $1.5 BillionRange of Costs (2012 USD) Less than $300 million to
more than $3 Billion
Average Authorization Year 2002
Number of Total FPSs 134Number of FPSO Projects 78
Number of Owners Represented 39Number of Contractors Represented 38
FPSO TypesLeased 45%Conversion 67%Leased Conversion 58%

CONFIDENTIAL – UIBC 2012 5 INDEPENDENT PROJECT ANALYSIS
Outline
• Database
• FPSO vs. FPS Performance and Drivers• Performance Difference by FPSO Execution Strategies
– Conversion vs. New Build
– Owned vs. Leased
• Drivers of FPSO Definition
• Conclusions and Path Forward

CONFIDENTIAL – UIBC 2012 6 INDEPENDENT PROJECT ANALYSIS
FPSO Projects Are Not Significantly Different Than Other FPSs
Database CharacteristicsDatabase CharacteristicsFPSOFPSO Other FPSsOther FPSs
Number of ProjectsNumber of Projects 7878 5656
Average Project Cost Average Project Cost (2012 MM USD)(2012 MM USD) $1.7 Billion$1.7 Billion $1.2 Billion$1.2 Billion
Average Number of WellsAverage Number of Wells 2828 1717
Average Reserve Size Average Reserve Size (mmboe)(mmboe) 380380 340340
Number of Owners RepresentedNumber of Owners Represented 2828 1616
Types of Operators RepresentedTypes of Operators Represented29% Major29% Major
32% Independent32% Independent39% NOC39% NOC
42% Major42% Major30% Independent30% Independent
28% NOC28% NOC
Average Throughput Average Throughput (kbpd)(kbpd) 176176 110110

CONFIDENTIAL – UIBC 2012 7 INDEPENDENT PROJECT ANALYSIS
90%80%
50%
10%1.00
70%30%
20%
60%20%
60%
0.90
100%
Operability Operability ProblemsProblems
Production Production AttainmentAttainment
Schedule IndexSchedule Index Schedule SlipSchedule Slip
Other FPSsFPSOs
Cost GrowthCost Growth
80%
40%
70%
10%
40%
0%
0%
-10%
30%
1.10
0.80
1.20
FPSOs Perform Significantly Worse Than Other FPSs

CONFIDENTIAL – UIBC 2012 8 INDEPENDENT PROJECT ANALYSIS
Why Are So Many FPSOs Poorly Defined?
• Owners define high level functional requirements and expect the contractor(s) to do the rest
• A common approach is through FEED competition resulting in a winning bidder and their FEED package being chosen
– Expectation is to have a complete FEED package given that it is paid for and competitive
• In some cases, the owner organizations consciously decided not to get “too much involved” during basic engineering
• This approach may make sense for leased FPSOs; however, we see this approach even on owned FPSOs?!
Functional Specification!

CONFIDENTIAL – UIBC 2012 9 INDEPENDENT PROJECT ANALYSIS
Outline
• Database
• FPSO vs. FPS Performance and Drivers
• Performance Difference by FPSO Execution Strategies
– Conversion vs. New Build– Owned vs. Leased
• Drivers of FPSO Definition
• Conclusions and Path Forward
CONFIDENTIAL – UIBC 2012 10 INDEPENDENT PROJECT ANALYSIS
1.00
60%
10%
30%
10%
20%
80%
60%
Production Production AttainmentAttainment
50%
70%20%
70%
0.90
90%
Operability Operability ProblemsProblems
Schedule IndexSchedule Index Schedule SlipSchedule Slip
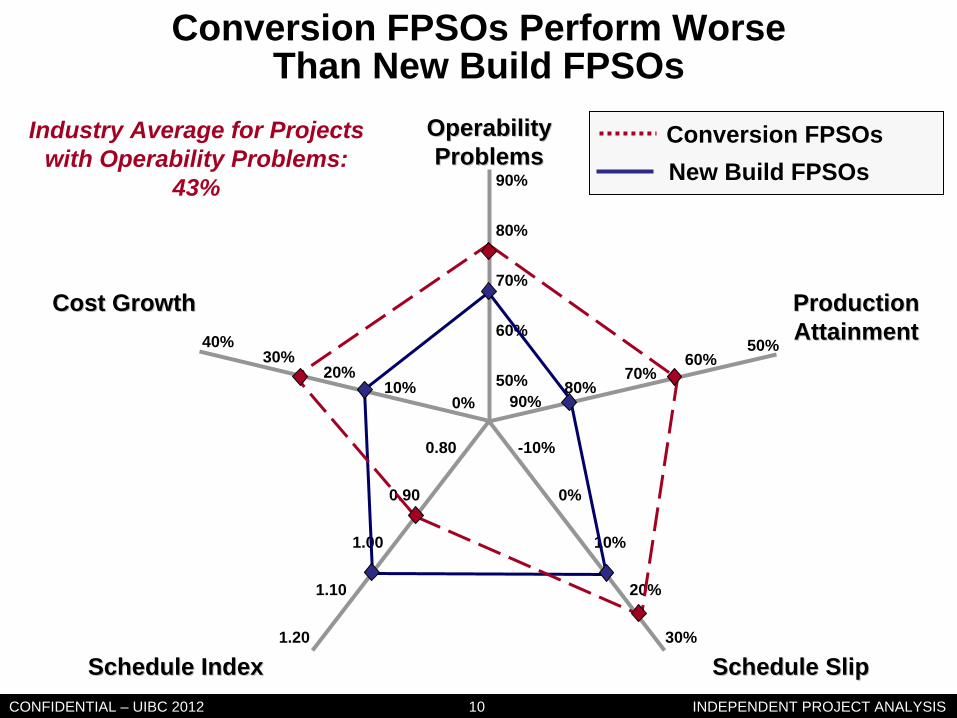
New Build FPSOsConversion FPSOs
Cost GrowthCost Growth
90%
50%
80%
40%
0%
0%
-10%
30%
1.10
0.80
1.20
Conversion FPSOs Perform Worse Than New Build FPSOs
Industry Average for Projects with Operability Problems:
43%

CONFIDENTIAL – UIBC 2012 11 INDEPENDENT PROJECT ANALYSIS
Reasons for Pursuing a Conversion Option
• Several of the conversion FPSOs are associated with shorter field life; often associated with license term expiration
– This drives the need to reduce the risk, speed up making conversion strategy an attractive option
• Marginally economic projects requiring reduction of capital expenditure
– Contractors promising “access to a hull that’s available” and appealing to one thing owners love – speed!!
• Conversion FPSO projects plan for a 20 percent faster schedule than new builds (Pr<0.001)

CONFIDENTIAL – UIBC 2012 12 INDEPENDENT PROJECT ANALYSIS
Well Defined Conversion FPSO Is a Rare Commodity
0%
10%
20%
30%
40%
50%
60%
1 2 3 4 5
Facilities FEL Definition at Sanction
Perc
enta
ge o
f Pro
ject
s New Build FPSOs Conversion FPSOs
Fair Not DoneBest Good Poor

CONFIDENTIAL – UIBC 2012 13 INDEPENDENT PROJECT ANALYSIS
Outline
• Database
• FPSO vs. FPS Performance and Drivers
• Performance Difference by FPSO Execution Strategies
– Conversion vs. New Build
– Owned vs. Leased
• Drivers of FPSO Definition
• Conclusions and Path Forward

CONFIDENTIAL – UIBC 2012 14 INDEPENDENT PROJECT ANALYSIS
1.00
60%
60%
80%
10%
20%
80%
60%
Production Production AttainmentAttainment
50%
70%70%
70%
0.90
90%
Operability Operability ProblemsProblems
Schedule IndexSchedule Index Schedule SlipSchedule Slip
OwnedLeased
Late Late ChangesChanges
90%
50%
80%
90%
50%
0%
-10%
30%
1.10
0.80
1.20
Leased FPSOs Achilles Heel of The Industry!

CONFIDENTIAL – UIBC 2012 15 INDEPENDENT PROJECT ANALYSIS
Owned Leased Owned Leased
Engineering and PEP Are Different
Project Execution PlanningProject Execution PlanningEngineering DefinitionEngineering Definition
Ass
umed
Prel
imin
ary
Def
initi
ve
Lim
ited
Stud
yA
dvan
ced
Stud
yFu
ll D
esig
n Sp
ec.
Pr < 0.005Pr < 0.02

CONFIDENTIAL – UIBC 2012 16 INDEPENDENT PROJECT ANALYSIS
Outline
• Database
• FPSO vs. FPS Performance and Drivers
• Performance Difference by FPSO Execution Strategies
– Conversion vs. New Build
– Owned vs. Leased
• Drivers of FPSO Definition• Conclusions and Path Forward

CONFIDENTIAL – UIBC 2012 17 INDEPENDENT PROJECT ANALYSIS
0.60
0.70
0.80
0.90
1.00
1.10
Other FPSs Owned FPSO Leased FPSO
FPSO Projects Are More Schedule Aggressive Than Other FPSs
Sche
dule
Agg
ress
iven
ess
Mor
eLe
ss

CONFIDENTIAL – UIBC 2012 18 INDEPENDENT PROJECT ANALYSIS
Use of Incentives to Overcome Lack of Definition
• Knowing that our FEL is not well defined we are probably anticipating production or operability problems
• The correct solution, of course, is to improve the definition and get operations input
• Instead, we use operability incentives, which penalize the contractor, in the event that production/operability targets are not met
• This actually worsens the situation for the contractor and it does not pay off in the end
• There is no relation between production attainment or operability problems and use of operability incentives 0%
10%
20%
30%
40%
50%
60%
70%
80%
90%
100%
Operability Incentives
FPSO
Other FPSs
Leased FPSO
Owned FPSO

CONFIDENTIAL – UIBC 2012 19 INDEPENDENT PROJECT ANALYSIS
Outline
• Database
• FPSO vs. FPS Performance and Drivers
• Performance Difference by FPSO Execution Strategies
– Conversion vs. New Build
– Owned vs. Leased
• Drivers of FPSO Definition
• Conclusions and Path Forward

CONFIDENTIAL – UIBC 2012 20 INDEPENDENT PROJECT ANALYSIS
FPSO Performance is Poor Across All Execution Strategies
• Conversion leased combination is the worst of all strategies• Owned conversions are slightly better, while owned new
builds seem to be best within FPSOs, but not as good as FPSs
• Of course, the immediate reaction is to blame the strategy and/or the contractor
• But is this an appropriate response?
ConversionConversionNew BuildNew Build
LeasedLeased
OwnedOwned

CONFIDENTIAL – UIBC 2012 21 INDEPENDENT PROJECT ANALYSIS
Don’t Blame the Strategy Blame the Tactics
• One could argue that in marginally economic projects, pursuing capital reduction by way of conversion or lease, is a rational behavior
• Pursuing very aggressive schedules, however, is not rational
• Doing so on the back of very poor front-end definition is even more irrational
– Functional specification and not fully defined execution planning is essentially a hands off approach

Thank You!