A Stereoscopic PIV Study of a Near-Field Wingtip Vortex - AIAA
13
1 A Stereoscopic PIV Study of a Near-field Wingtip Vortex Hirofumi Igarashi, Paul A. Durbin, Hongwei Ma and Hui Hu () Department of Aerospace Engineering, Iowa State University, Ames, Iowa, 50011 Email: [email protected] Abstract An experimental study was conducted to investigate the wing-tip vortex generated from a rectangular NACA0012 airfoil model. A high-resolution Stereoscopic Particle Image Velocimetry (SPIV) system was used to conduct detailed flow field measurements to quantify the transient behavior of the wing-tip vortex in the near field. The characteristics of the vortex wandering phenomena, i.e., the slow side-to-side movement of the wing-tip vortex core, were revealed in great detail based on the SPIV measurement results. Introduction The behavior of strong, coherent wingtip vortex structures is of great importance to various commercial and military applications. One well-known problem is the hazardous effect of trailing wingtip vortices on flight safety and airport capacity. From a military standpoint, there are many issues associated with the effects of wingtip vortex structures on dynamics of towed vehicles, tail buffeting, and icing arrays. Blade/vortex interaction on helicopter blades can impact performance and cause undesirable noise and vibration. The study of wingtip vortices is not only of great engineering importance but also of great scientific interest. It continues to be a perplexing problem for computational scientists because of the presence of large gradients of velocity and pressure in all three dimensions, especially in the near field, at high Reynolds numbers. A good physical understanding is essential in order to guide a variety of applications. Thus, a detailed knowledge of the transient behavior of wing-tip vortex dynamics in the near field is highly desired. Numerous experimental, theoretical and computational investigations have been conducted in recent years to improve the basic understanding of wing-tip vortex structures, as well as its control. Devenport et al. (1996) investigated vortex structure in the range of X/C = 4 to 29 downstream of a NACA 0012 airfoil with a blunt tip, at Re = 5.3 ×10 5 . These authors used a miniature, four-sensor hot-wire probe, and showed a deficit profile of approximately 84% of the free-stream velocity. They reported that the flow outside the vortex core was dominated by the remainder of the wing wake, which wound into an ever increasing spiral, and the turbulence stress levels varied along the wake spiral in response to the varying rate of strain imposed by the vortex. Chow et al. (1997) investigated the wing-tip vortex flow of a NACA 0012 airfoil model with a rounded tip at Re = 4.6×10 6 and α =10 o making measurements with a seven-hole pressure probe and with a triple-hot-wire probe. They indicated a high level of axial velocity, in excess of 48th AIAA Aerospace Sciences Meeting Including the New Horizons Forum and Aerospace Exposition 4 - 7 January 2010, Orlando, Florida AIAA 2010-1029 Copyright © 2010 by Hirofumi Igarashi, Paul A. Durbin, Hongwei Ma and Hui Hu . Published by the American Institute of Aeronautics and Astronautics, Inc., with permission.
Transcript of A Stereoscopic PIV Study of a Near-Field Wingtip Vortex - AIAA

1
A Stereoscopic PIV Study of a Near-field Wingtip Vortex
Hirofumi Igarashi, Paul A. Durbin, Hongwei Ma and Hui Hu ( )
Department of Aerospace Engineering, Iowa State University, Ames, Iowa, 50011
Email: [email protected]
Abstract An experimental study was conducted to investigate the wing-tip vortex generated from a rectangular NACA0012 airfoil model. A high-resolution Stereoscopic Particle Image Velocimetry (SPIV) system was used to conduct detailed flow field measurements to quantify the transient behavior of the wing-tip vortex in the near field. The characteristics of the vortex wandering phenomena, i.e., the slow side-to-side movement of the wing-tip vortex core, were revealed in great detail based on the SPIV measurement results.
Introduction The behavior of strong, coherent wingtip vortex structures is of great importance to various commercial and military applications. One well-known problem is the hazardous effect of trailing wingtip vortices on flight safety and airport capacity. From a military standpoint, there are many issues associated with the effects of wingtip vortex structures on dynamics of towed vehicles, tail buffeting, and icing arrays. Blade/vortex interaction on helicopter blades can impact performance and cause undesirable noise and vibration. The study of wingtip vortices is not only of great engineering importance but also of great scientific interest. It continues to be a perplexing problem for computational scientists because of the presence of large gradients of velocity and pressure in all three dimensions, especially in the near field, at high Reynolds numbers.
A good physical understanding is essential in order to guide a variety of applications. Thus, a detailed knowledge of the transient behavior of wing-tip vortex dynamics in the near field is highly desired. Numerous experimental, theoretical and computational investigations have been conducted in recent years to improve the basic understanding of wing-tip vortex structures, as well as its control. Devenport et al. (1996) investigated vortex structure in the range of X/C = 4 to 29 downstream of a NACA 0012 airfoil with a blunt tip, at Re = 5.3 ×10⁵. These authors used a miniature, four-sensor hot-wire probe, and showed a deficit profile of approximately 84% of the free-stream velocity. They reported that the flow outside the vortex core was dominated by the remainder of the wing wake, which wound into an ever increasing spiral, and the turbulence stress levels varied along the wake spiral in response to the varying rate of strain imposed by the vortex. Chow et al. (1997) investigated the wing-tip vortex flow of a NACA 0012 airfoil model with a rounded tip at Re = 4.6×10⁶ and α =10o making measurements with a seven-hole pressure probe and with a triple-hot-wire probe. They indicated a high level of axial velocity, in excess of
48th AIAA Aerospace Sciences Meeting Including the New Horizons Forum and Aerospace Exposition4 - 7 January 2010, Orlando, Florida
AIAA 2010-1029
Copyright © 2010 by Hirofumi Igarashi, Paul A. Durbin, Hongwei Ma and Hui Hu . Published by the American Institute of Aeronautics and Astronautics, Inc., with permission.

2
1.7 U∞, at all measurement locations. They also reported that the turbulence intensity in the vortex can be as high as 24%, but it decayed quickly with streamwise distance because of the stabilizing effect of the nearly solid-body rotation in the vortex-core. Ramaprian & Zheng (1997) observed no axial velocity excess for a tip vortex generated by a rectangular, square-tipped NACA 0015 wing with Re=1.8×10⁵ at α =10o. They used a three-component laser Doppler anemometer. The inner part of the vortex was, however, found to be nearly axisymmetric within X/C = 2.0 and exhibited a universal structure of asymptotic trailing vortices. More recently, Birch & Lee (2004) examined the flow structure both along the tip and in the near field (up to X/C =2.5) behind a square-tipped, rectangular NACA 0015 wing at Re = 2.1×10⁵ for angles of attack ranging from 2 to 19 degrees. Their measurements were produced from a miniature, seven-hole pressure probe and a triple-hot-wire probe. The circulation was observed to have a local maximum at X/C = 0.05 and remained virtually unchanged up to X/C = 2.5. The vortex flow was self-similar and axisymmetric for X/C ≥ 0.5. The lift-induced drag was also computed and compared with the wind-tunnel force-balance data.
Vortex wandering, the slow side-to-side movement of the wing-tip vortex core, has been found to be a universal feature of wind-tunnel-generated wing-tip vortex structures. Jaquin et al. (2001) proposed four possible causes for vortex wandering: the vortex could be un-stabilized by wind-tunnel free-stream unsteadiness, turbulence in the surrounding shear layer, co-operative instabilities, or propagation of unsteadiness from the model. In either case its most significant effect is to obscure point-wise measurements by smearing the vortex core. Corsigilia et al. (1973) reported that vortex wandering could be overwhelming, with the wandering amplitude being several times of vortex core diameter. Devenport et al. (1996) developed an analytical technique to correct mean-velocity profiles measured with a fixed hot-wire probe, thereby providing quantitative estimates of wandering amplitude and its contributions to Reynolds stress. This process involves forming a “corrected” mean velocity field from the measured version, using guessed levels of wandering amplitude. The corrected field is then artificially subjected to wandering, described by a bi-variate Gaussian probability density function (PDF) for vortex position, and the resulting Reynolds stresses at the vortex center are compared with the actual measured values. The wandering amplitudes are then adjusted iteratively until the calculated and measured values converge. Using their wandering correction theory, they found that the amplitude of wandering varied linearly between 0.1 and 0.4 vortex core radii at stream-wise distances of 5 to 36 chord-lengths, and at its highest level, wandering was responsible for a 12% and 15% error in the measured core radii and peak tangential velocity respectively. They concluded that the vortex core in their experiments was laminar and that velocity fluctuations in the vortex core region were entirely due to wandering. Rokhsaz (2000) investigated wandering of a tip-vortex from a rectangular flat plate airfoil in a water tunnel and showed that wandering increased with angle of attack and therefore vortex strength, the opposite to the finding of Devenport et al. (1996) who showed a 15% reduction in wandering amplitude with an increase in vortex strength of 85%.
These studies have uncovered useful information, but some of the inconsistencies noted above raise questions. The majority of the previous studies used point-wise flow measurement techniques such as pressure probes, hot-wire anemometry, and laser Doppler anemometer. A common shortcoming of such point-wise measurements is the inability to provide spatial structure of the unsteady vortices. Full field measurements are needed to effectively reveal the transient behavior of the wing-tip vortex structures. Temporally-synchronized and spatially-resolved flow field measurements are highly desirable in order to elucidate underlying physics.

3
Advanced flow diagnostic techniques such as high-resolution stereoscopic Particle Image Velocimetry (SPIV) used in the present study are capable of providing such information. Based on the flow field measurements with a conventional two-dimensional PIV system, Heyes et al. (2004) evaluated wandering effects by recentering PIV data. They found that the Devenport et al. (1996) assumption of using a bi-variate normal probability density function could be valid, and their corrections were in good agreement with those predicted by the Devenport et al. (1996) method. They found a 12.5% over-prediction of the core radius and a 6% under-prediction of the peak tangential velocity. The errors were larger for lower angles of attack. They also found that the wandering amplitude increases linearly with streamwise distance; a linear reduction was found by increasing the angle of attack, so that they concluded that the mechanism responsible for wandering is not self-induced, as had been proposed by Rokhsaz et al. (2000), but rather that the vortex is responding to an external perturbation, as for instance the background turbulence level, to which the tip vortex becomes less susceptible as the vortex strength is increased.
It should be noted the PIV measurement results reported in Heyes et al. (2004) were obtained by using a conventional 2-D PIV system. It is well known that a conventional 2-D PIV system is only capable of recording the projection of velocity into the plane of the laser sheet. That means the out-of-plane velocity component is lost while the in-plane components may be affected by an unrecoverable error due to the perspective transformation (Prasad & Adrian, 1993). For the highly three-dimensional flow fields like wingtip vortex, the two-dimensional measurement results may not be able to reveal their three-dimensional features successfully. In the present study, a high-resolution Stereoscopic Particle Image Velocimetry (SPIV) system, which is capable of achieving quantitative measurements of all three components of instantaneous flow velocity vectors, is used to conduct detailed flow field measurements to quantify the transient behavior of the wing-tip vortex generated from a rectangular NACA0012 airfoil. Because the field is instantaneous, wandering does not smear the vortex. The trajectory of the wing-tip vortex structures in the cross planes at different downstream locations will be revealed directly as a time sequence of the instantaneous SPIV measurements. The underlying physics and characteristics of vortex wandering is revealed in great detail.
Experimental Setup and Stereoscopic PIV System
The experimental study was conducted in a closed-circuit low-speed wind tunnel located in the Aerospace Engineering Department of Iowa State University. The tunnel has a test section with a 1.0 × 1.0 ft (30 × 30 cm) cross section and the walls of the test section are optically transparent. The tunnel has a contraction section upstream of the test section with honeycombs, screen structures and a cooling system installed ahead of the contraction section to provide uniform low turbulent incoming flow into the test section. The standard deviation of velocity fluctuations at the test section entrance was found to be about 0.8% of the free-stream velocity, as measured by a hotwire anemometer.
The test model used in the present study was a zero-sweep, untwisted half wing, with a NACA0012 symmetric profile. The wing had a rectangular planform with a semi-span b=0.1524m and a chord c=0.1016m and a plane tip with sharp edges. Its root was mounted on one side of the wind tunnel wall. The angle of attack of the tested wing could be changed using a rotary table mounted outside the wind tunnel with the axis of rotation passing through the

4
airfoil’s aerodynamic center (quarter-chord point). The wing was mounted through the wind tunnel wall such that its quarter-chord axis was along the centerline of the wind tunnel. Following the work of Bailey & Tavoularis (2008), a boundary layer trip wire was attached on the suction surface of the airfoil, 0.10c away from the leading edge, to induce transition, thus reducing the possibility of separation and sensitivity to free-stream conditions. For the present study, the angle of attack of the tested wing was changed from 0 to 20 degrees (i.e.,
.deg20~0=α ). During the experiments, the wind-tunnel speed was adjusted from 5.0m/s ~ 35 m/s, which corresponds to a chord Reynolds number .1033.2~1033.0Re 55 ××=C
Figure 1: Schematic of the experimental setup
Figure 1 shows the schematic of the experimental setup used in the present study for the stereoscopic PIV measurements. The flow was seeded with 1~5 μm oil droplets. Illumination was provided by a double-pulsed Nd:YAG laser (NewWave Gemini 200) adjusted on the second harmonic and emitting two pulses of 200 mJ at the wavelength of 532 nm with a repetition rate of 10 Hz. The laser beam was shaped to a sheet by a set of mirrors, spherical and cylindrical lenses. The thickness of the laser sheet in the measurement region is about 1.0 mm. Two high-resolution 12-bit (1600 x 1200 pixel) CCD camera (PCO1600, CookeCorp) were used to perform stereoscopic PIV image recording. The two CCD cameras were arranged in an angular displacement configuration to get a large overlapped view. With the installation of tilt-axis mounts, the lenses and camera bodies were adjusted to satisfy the Scheimpflug condition (Prasad&Jensen, 1995). In the present study, the distance between the illuminating laser sheet and image recording planes of the CCD cameras is about 1000mm, and the angle between the view axial of the two cameras is about 60 degrees. For such an arrangement, the size of the stereoscopic PIV measurement window is about 80mm by 60mm. The CCD cameras and double-pulsed Nd:YAG lasers were connected to a workstation (host computer) via a Digital Delay
5
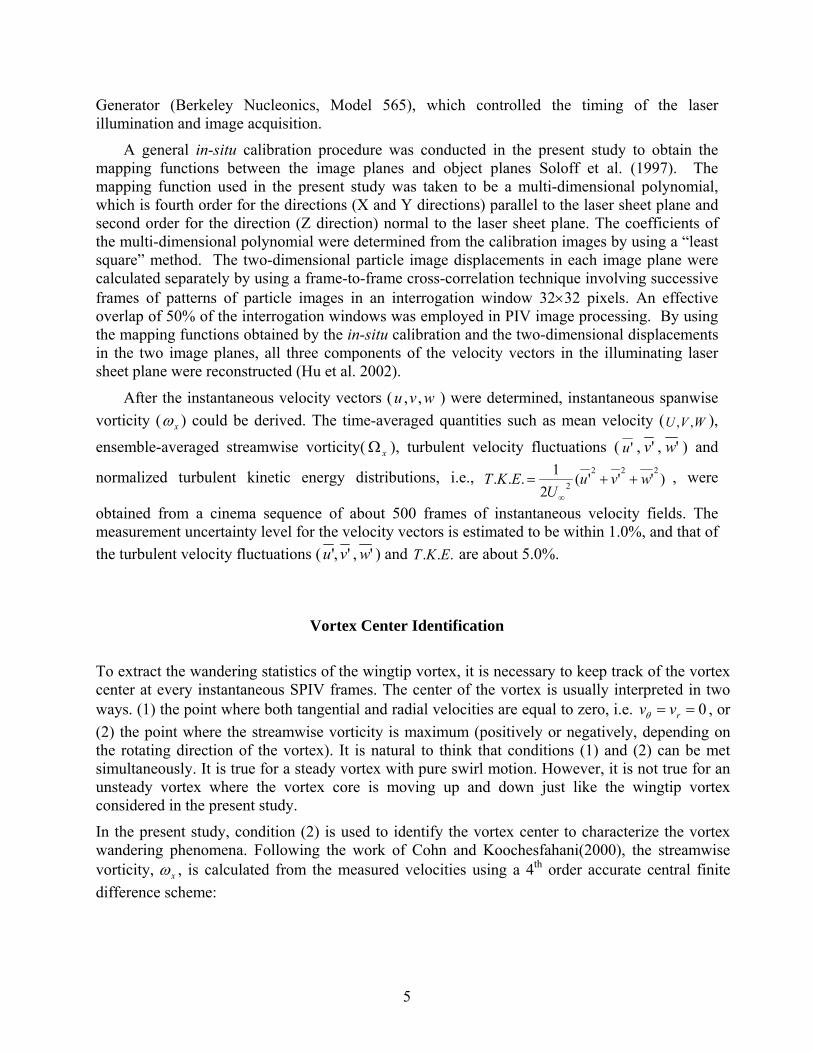
Generator (Berkeley Nucleonics, Model 565), which controlled the timing of the laser illumination and image acquisition.
A general in-situ calibration procedure was conducted in the present study to obtain the mapping functions between the image planes and object planes Soloff et al. (1997). The mapping function used in the present study was taken to be a multi-dimensional polynomial, which is fourth order for the directions (X and Y directions) parallel to the laser sheet plane and second order for the direction (Z direction) normal to the laser sheet plane. The coefficients of the multi-dimensional polynomial were determined from the calibration images by using a “least square” method. The two-dimensional particle image displacements in each image plane were calculated separately by using a frame-to-frame cross-correlation technique involving successive frames of patterns of particle images in an interrogation window 32×32 pixels. An effective overlap of 50% of the interrogation windows was employed in PIV image processing. By using the mapping functions obtained by the in-situ calibration and the two-dimensional displacements in the two image planes, all three components of the velocity vectors in the illuminating laser sheet plane were reconstructed (Hu et al. 2002).
After the instantaneous velocity vectors ( wvu ,, ) were determined, instantaneous spanwise vorticity ( xω ) could be derived. The time-averaged quantities such as mean velocity ( WVU ,, ),
ensemble-averaged streamwise vorticity( xΩ ), turbulent velocity fluctuations ( 'u , 'v , 'w ) and
normalized turbulent kinetic energy distributions, i.e., )'''(2
1...222
2 wvuU
EKT ++=∞
, were
obtained from a cinema sequence of about 500 frames of instantaneous velocity fields. The measurement uncertainty level for the velocity vectors is estimated to be within 1.0%, and that of the turbulent velocity fluctuations ( ',' vu , 'w ) and ... EKT are about 5.0%.
Vortex Center Identification
To extract the wandering statistics of the wingtip vortex, it is necessary to keep track of the vortex center at every instantaneous SPIV frames. The center of the vortex is usually interpreted in two ways. (1) the point where both tangential and radial velocities are equal to zero, i.e. 0== rvvθ , or (2) the point where the streamwise vorticity is maximum (positively or negatively, depending on the rotating direction of the vortex). It is natural to think that conditions (1) and (2) can be met simultaneously. It is true for a steady vortex with pure swirl motion. However, it is not true for an unsteady vortex where the vortex core is moving up and down just like the wingtip vortex considered in the present study.
In the present study, condition (2) is used to identify the vortex center to characterize the vortex wandering phenomena. Following the work of Cohn and Koochesfahani(2000), the streamwise vorticity, xω , is calculated from the measured velocities using a 4th order accurate central finite difference scheme:

6
jijix z
vyw
,,
⎟⎠⎞
⎜⎝⎛∂∂
−⎟⎟⎠
⎞⎜⎜⎝
⎛∂∂
=ω (1)
Where
ywwww
yw jijijiji
ji Δ
+−+−=⎟⎟
⎠
⎞⎜⎜⎝
⎛∂∂ −−++
1288 ,2,1,1,2
,
(2)
and
zvvvv
zv jijijiji
ji Δ
+−+−=⎟
⎠⎞
⎜⎝⎛∂∂ −−++
1288 ,2,1,1,2
,
(3)
Using Eq.(2) and (3) alone, the location of the identified vorticity peak falls on to the grid point. A 2-dimensional 2nd order polynomial function was used to fit the measured vortex field in the neighborhood the vorticity peak location in order to improve the accuracy to indentify the center of the vortex at the sub-grid interpolation level, which shown below.
FEzDyCyzBzAyzyR +++++= 22),( (4)
where six unknown coefficients were determined by taking the six nearest grid pints near the measured vorticity peak. The partial derivatives of Eq(4) were taken and set equal to zero in order to derive the location of the vorticity peak.
02 =++=∂∂ DCzAy
yR (5)
and
02 =++=∂∂ ECyBz
zR (6)
The accurate vortex center can be determined by solving the system of equations (5) and (6).

7
Experimental Results and Discussion
a). 1.0 chord length downstream d). 2.0 chord length downstream
c). 3.0 chord length downstream d). 4.0 chord length downstream
Figure 2: Stereoscopic PIV measurements to reveal the evolution of the wingtip vortex at 4 different downstream locations ( 51052.0Re ×=C , .deg0.5=α )
Figure 2 shows the evolution of the wingtip vortex at four different downstream locations where the color contour represents the normalized streamwise velocity. The interaction of the wake of the wing and the tip vortex is clearly revealed. At 1.0 chord length downstream (Figure 2a), the vortex center is observed around mmz 5.0−= and the wake of the airfoil is located about mmz 0.20−= . As the vortex progresses downstream, the vortex center location stays fairly the same, whereas the wake of the wing decays rapidly. The contour indicates that the vortex core has the velocity deficit of more than 20%. Also, this deficit region becomes smaller as the vortex moves downstream.

8
(a). .deg0.0=α (b). .deg0.2=α
(c). .deg0.4=α (d). .deg0.6=α
(e). .deg0.8=α (f). .deg0.10=α
Figure 3: Stereoscopic PIV measurements to reveal the normalized T.K.E. evolution at 6 different angles of attack ( 51015.1Re ×=C ,X/ 0.4=c ).

9
Figure 3 shows the evolution of the tip-vortex with angles of attack with the measurement plane at 4.0 chordlength downstream. As the angle of attack increased, the wake from the wing moves down and the T.K.E. within the wake increases. For all positive angles of attack, the vortex center seems to have the largest T.K.E. value and the turbulent region increase as the angle of attack.
-1.0
-0.5
0
0.5
1.0
1.5
2.0
0 2 4 6 8 10 12 14
σz
σy
ρ
Angle of Attacke (deg)
-6
-5
-4
-3
-2
-1
0 2 4 6 8 10 12 14
Angle of Attack (deg)V
ortic
ity
(a). Wandering amplitude and correlation (b).Vorticity
Figure 4: Wandering amplitude and vorticity with angle of attack ( 51015.1Re ×=C , 0.4=c ).
Figure 4 shows the wandering amplitude and vorticity with angle of attack at four chord lengths downstream. As described in Birch (2004), the vorticity increases as the angle of attack (Figure 4b). The vorticity magnitude increases about five times as the angle of attack increased from 2 to 12 degrees. The corresponding wandering amplitude is shown in Figure 4a. From 2 to 6 deg, the wandering amplitude in both y and z-directions decreases. At higher angles of attack, from 6 to 12 degrees, the wandering amplitude increases in both directions; however, the amplitude in y-direction increases sharply, whereas the z-direction amplitude increases rather gradually. The two figures show that, at lower angle of attack, 50 % increase in the vorticity results in a 70% decrease in wandering amplitude. And for the higher angles of attack, the wandering amplitude increases 50% with the 25% increase in vorticity. Rokhsaz (2000) and Devenport et al. (1996) reported that wandering amplitude increases with increasing angle of attack and decreasing angle of attack, respectively; however, figure 4 shows that the wandering could increase or decrease with increasing angle of attack.

10
0
0.25
0.50
0.75
1.00
0 1 2 3 4 5
σz
σy
ρ
Downstream (chord length)
Wan
derin
g A
mpl
itude
-2.0
-1.8
-1.6
-1.4
-1.2
-1.0
0 1 2 3 4 5
Downstream (Chord Length)
Vor
ticity
(a). Wandering amplitude and correlation (b).Vorticity
Figure 5: Wandering amplitude and vorticity with downstream ( 51053.0Re ×=C , 0.5=α ). .
Figure 5 shows the downstream effect on the wandering amplitudes and maximum vorticity. The general trend indicates that the maximum vorticity decreases by about 25% as the distance increasing from 1 to 4 chord lengths downstream. The amplitudes of the wandering (figure 5a), stay constant and they are about the same for both y and z-directions. Small change, about 20%, in vorticity seems to have a little or no effect on the wandering amplitudes.
-1.0
-0.5
0
0.5
1.0
-1.0 -0.5 0 0.5 1.0
y/r
z/r
-1.0
-0.5
0
0.5
1.0
-1.0 -0.5 0 0.5 1.0
y/r
z/r
(a). vortex center projection in y-z plane.
11
-1.00
-0.75
-0.50
-0.25
0
0.25
0.50
0.75
1.00
0 20 40 60 80 100 120
Time (sec)
y/r
-1.00
-0.75
-0.50
-0.25
0
0.25
0.50
0.75
1.00
0 20 40 60 80 100 120
Time (sec)
y/r
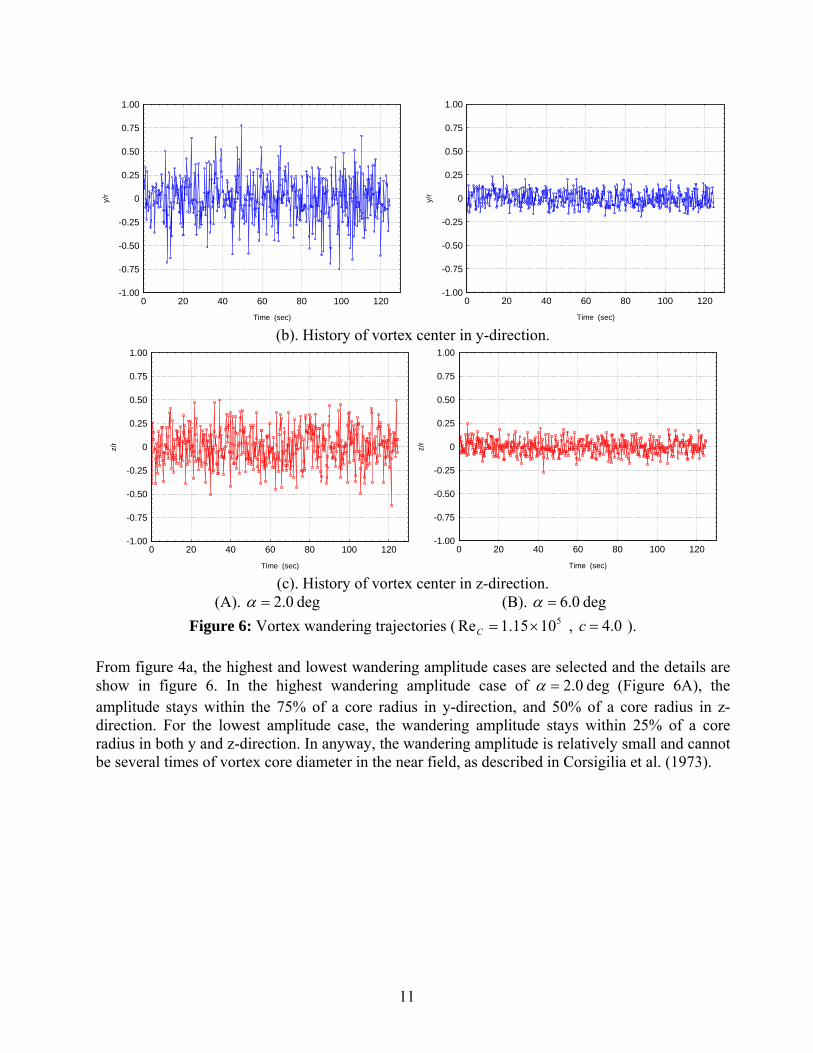
(b). History of vortex center in y-direction.
-1.00
-0.75
-0.50
-0.25
0
0.25
0.50
0.75
1.00
0 20 40 60 80 100 120
Time (sec)
z/r
-1.00
-0.75
-0.50
-0.25
0
0.25
0.50
0.75
1.00
0 20 40 60 80 100 120
Time (sec)
z/r
(c). History of vortex center in z-direction.
(A). deg0.2=α (B). deg0.6=α Figure 6: Vortex wandering trajectories ( 51015.1Re ×=C , 0.4=c ).
From figure 4a, the highest and lowest wandering amplitude cases are selected and the details are show in figure 6. In the highest wandering amplitude case of deg0.2=α (Figure 6A), the amplitude stays within the 75% of a core radius in y-direction, and 50% of a core radius in z-direction. For the lowest amplitude case, the wandering amplitude stays within 25% of a core radius in both y and z-direction. In anyway, the wandering amplitude is relatively small and cannot be several times of vortex core diameter in the near field, as described in Corsigilia et al. (1973).

12
Conclusion
In the present study, a high-resolution Stereoscopic Particle Image Velocimetry (SPIV) system, which is capable of achieving quantitative measurements of all three components of instantaneous flow velocity vectors, was used to conduct detailed flow field measurements to quantify the transient behavior of the wing-tip vortex generated from a rectangular NACA0012 airfoil. By tracking of the vortex center at every instantaneous frames, the characteristic of the vortex wandering phenomena was described quantified in detail. While the present SPIV measurement results confirmed the findings of previous studies about the characteristics of the wingtip vortex in the near, the direct relationship between the vorticity and wandering amplitude was not observed based on the present SPIV measurement results.
Acknowledgments
The authors want to thank Mr. William Rickard of Iowa State University for his help and support in conducting the wind tunnel experiments. This work is sponsored by the AFOSR, grant FA9550-08-1-0294.
13
Reference
[1] Bailey, S. C. C. and Tavoularis, S., “Measurements of the velocity field of a wing-tip vortex, wandering in grid turbulence,” J. Fluid Mech., 601, 281-315 (2008).
[2] Birch, D., Lee, T., Mokhtarian, F. and Kafyeke, F., “The structure and induced drag of a tip vortex,” J. Aircraft., 41(5), 1138-1145 (2004).
[3] Chow, J. S., Zilliac, G. G. & Bradshaws, P., “Mean and turbulence measurements in the near field of a wingtip vortex,” AIAA J., 35, 1561–1567 (1997).
[4] Cohn, R. K. and Koochesfahani, M. M., “The accuracy of remapping irregularly spaced velocity data onto a regular grid and the computation of vorticity,” Experiments in Fluids, Suppl. S61-S69 (2000).
[5] Corsiglia, V. R., Schwind, R. G. & Chigier, N. A., “Rapid scanning, three-dimensional hotwire anemometer surveys of wing-tip vortices,” J. Aircraft, 10, 752–757 (1973).
[6] Devenport, W. J., Rife, M. C., Liapis, S. I. & Follin, G. J., “The structure and development of a wing-tip vortex,” J. Fluid Mech., 312, 67–106 (1996).
[7] Heyes, A. L., Hones, R. F. & Smith, D. A. R., “Wandering of wing-tip vortices,” In Proc. 12th Intl Symp. On the Applications of Laser Techniques to Fluid Mechanics, Lisborn, Portugal (2004).
[8] Hu, H., Saga, T., Kobayashi, T., Taniguchi, N., "A Study on a Lobed Jet Mixing Flow by Using Stereoscopic PIV Technique," Physics of Fluids, Vol.13, No. 11, 3425-3441, (2001).
[9] Jaquin L, Fabre D, Geffroy P, Coustols E, “The properties of a transport aircraft wake in the extended near field: An experimental study,” AIAA conference proceedings, 2001-1038. (2001).
[10] Prasad A. K. and Adrian R. J., “Stereoscopic Particle Image Velocimetry Applied to Fluid Flows,” Experiments in Flows, 15, 49-60 (1993).
[11] Prasad, A. K. and Jensen, K., “Scheimpflug stereocamera for particle image velocimetry in liquid flows,” Appl. Opt., 34, 7092 (1995).
[12] Ramaprian, B. R. & Zheng, Y., “Measurements in rollup region of the tip vortex from a rectangular wing,” AIAA J., 35, 1837–1843 (1997).
[13] Rokhsaz, K., Foster, S. R. & Miller, L. S., “Exploratory study of aircraft wake vortex filaments in a water tunnel,” J. Aircraft., 37, 1022–1027 (2000).
[14] Soloff, S. M., Adrian, R. J., and Liu, Z. C., “Distortion compensation for generalized stereoscopic particle image velocimetry,” Meas. Sci. Technol., 8, 1441 (1997).