A Statistical Model for Multiparty Electoral Data JONATHAN ...A Statistical Model for Multiparty...
18
American Political Science Review Vol. 93, No. 1 March 1999 A Statistical Model for Multiparty Electoral Data JONATHAN N. KATZ University of Chicago GARY KING Haward University W e propose a comprehensive statistical model for analyzing multiparty, district-level elections. This model, which provides a tool for comparative politics research analogous to that which regression analysis provides in the American two-party context, can be used to explain or predict how geographic distributions of electoral results depend upon economic conditions, neighborhood ethnic compositions, campaign spending, and other features of the election campaign or aggregate areas. We also provide new graphical representations for data exploration, model evaluation, and substantive interpretation. We illustrate the use of this model by attempting to resolve a controversy over the size of and trend in the electoral advantage of incumbency in Britain. Contraiy to previous analyses, all based on measures now known to be biased, we demonstrate that the advantage is small but meaningfkl, varies substantially across the parties, and is not growing. Finally, we show how to estimate the party from which each party's advantage is predominantly drawn. w e propose the first internally consistent statis- tical model for analyzing multiparty, district- level aggregate election data. Our model can be applied directly to explain or predict how the geographic distribution of electoral results depends upon economic conditions, neighborhood ethnic com- positions, campaign spending, or other features of the election campaign or characteristics of the aggregate areas. We also provide several new graphical represen- tations for help in data exploration, model evaluation, and substantive interpretation.1 Our general model is intended to address three serious lacunae in the study of comparative politics. First, most literatures focusing on non-American elec- tions are dominated by survey data alone rather than also including studies of real election results.2 Survey Jonathan Katz is Assistant Professor of Political Science, University of Chicago, 5828 South University Avenue, Chicago, IL 60637 ([email protected]). Gary King is Professor of Government, Harvard University, Cambridge, MA 02138 ([email protected], http://GKing.Harvard.edu). An earlier version of this paper was presented at the 1997 meetings of the Midwest Political Science Association, Chicago, and won the Pi Sigma Alpha Award for the best paper presented there. Our thanks to Jim Alt, Larry Bartels, Neal Beck, Gary Cox, Nick Cox, Mo Fiorina, M. F. Fuller, Dave Grether, Mike Herron, James Honaker, Chuanhai Liu, Ken Scheve, Ken Shepsle, and Bob Sherman for helpful suggestions; Josh Tucker for useful suggestions and research assistance; Gary Cox for his British election data; and Selina Chen for her help and expertise in collecting additional British data. Burt Monroe saw the virtues of the compositional data analysis literature at essentially the same time as we did, and we appreciate his comments. For research support, Jonathan N. Katz thanks the Haynes Foundation, and Gary King thanks the National Science Foundation (SBR-9729884), the Centers for Disease Control and Prevention (Division of Diabetes Translation), the National Insti- tutes on Aging, the World Health Organization, and the Global Forum for Health Research. All information, data, and software necessary to replicate the results in this article are available in a replication data set to be deposited in the ICPSR's Publication Related Archive upon publication (ICPSR PRA #1190). Our model can also be used to evaluate features of electoral systems, such as whether the districting system is fair to all the political parties and electorally responsive, although we leave details of this task to future work. A few examples of the good survey analyses conducted in multi- party democracies include those in England (e.g., Goodhart and research has enormous advantages for studying indi- vidual-level preferences, but as analyses of random selections of isolated individuals from unknown geo- graphical locations, they necessarily miss much of electoral politics. As such, they are often best comple- mented with studies of aggregate electoral returns. Second, with surprisingly few exceptions, electoral analyses in comparative politics based on real election returns use national rather than regional, district, or precinct-level data.3 This approach has the advantage of allowing more countries to be included in the analysis without much data collection effort, but it also has serious disadvantages. Aggregate national-level studies prevent researchers from learning where votes come from and why, and they generally result in studies based on small numbers of observations and little variation on many relevant dimensions. Studies of postwar OECD countries usually contain only about a dozen observations (see Paldam 1991,18,Table I), and analvses of former communist countries could include onlithree or four free elections. This is often insuffi- cient information with which to parse out many of the interesting effects, and it ignores the substantial infor- mation content in the often vast differences across different regions of a country. Finally, the vast majority of electoral studies in multiparty democracies dichotomize the electoral sys- tem into a pseudo-two-party contest. Researchers an- alyze the vote for the incumbent party versus all others grouped together, or the vote for a-particular group, such as left-wing parties, versus the combination of all Bhansali 1970), Mexico (Dominguez and McCann 1996), Poland (Przeworski 1996), Peru (Stokes 1996), Russia (White et al. 1997), Denmark (Miller and Listhaug 1985), Italy (Bellucci 1984), and West Germany (Frey and Schneider 1980) as well as multicountry studies (Lewis-Beck 1988), among many others. Such national-level studies have used data from France (Rosa and Amson 1976), Japan (Inoguchi 1980), England (Whiteley 1980), and Italy (Bellucci 1984); time-series of cross-sectional data from multi- ple countries (Host and Paldam 1990; Paldam 1986,1991; Powell and Whitten 1993); and single cross-sections of multiple countries (Lewis-Beck and Bellucci 1982), among many others. Subnational analyses include Bellucci (1984, 1991), Conford, Dorling, and Tether (1995), Rattinger (1991), Slider (1994).
Transcript of A Statistical Model for Multiparty Electoral Data JONATHAN ...A Statistical Model for Multiparty...

American Political Science Review Vol. 93, No. 1 March 1999
A Statistical Model for Multiparty Electoral Data JONATHAN N. KATZ University of Chicago GARY KING Haward University
W e propose a comprehensive statistical model for analyzing multiparty, district-level elections. This model, which provides a tool for comparative politics research analogous to that which regression analysis provides in the American two-party context, can be used to explain or predict how
geographic distributions of electoral results depend upon economic conditions, neighborhood ethnic compositions, campaign spending, and other features of the election campaign or aggregate areas. We also provide new graphical representations for data exploration, model evaluation, and substantive interpretation. We illustrate the use of this model by attempting to resolve a controversy over the size of and trend in the electoral advantage of incumbency in Britain. Contraiy to previous analyses, all based on measures now known to be biased, we demonstrate that the advantage is small but meaningfkl, varies substantially across the parties, and is not growing. Finally, we show how to estimate the party from which each party's advantage is predominantly drawn.
w e propose the first internally consistent statis- tical model for analyzing multiparty, district- level aggregate election data. Our model can
be applied directly to explain or predict how the geographic distribution of electoral results depends upon economic conditions, neighborhood ethnic com- positions, campaign spending, or other features of the election campaign or characteristics of the aggregate areas. We also provide several new graphical represen- tations for help in data exploration, model evaluation, and substantive interpretation.1
Our general model is intended to address three serious lacunae in the study of comparative politics. First, most literatures focusing on non-American elec- tions are dominated by survey data alone rather than also including studies of real election results.2 Survey
Jonathan Katz is Assistant Professor of Political Science, University of Chicago, 5828 South University Avenue, Chicago, IL 60637 ([email protected]). Gary King is Professor of Government, Harvard University, Cambridge, MA 02138 ([email protected], http://GKing.Harvard.edu).
An earlier version of this paper was presented at the 1997 meetings of the Midwest Political Science Association, Chicago, and won the Pi Sigma Alpha Award for the best paper presented there. Our thanks to Jim Alt, Larry Bartels, Neal Beck, Gary Cox, Nick Cox, Mo Fiorina, M. F. Fuller, Dave Grether, Mike Herron, James Honaker, Chuanhai Liu, Ken Scheve, Ken Shepsle, and Bob Sherman for helpful suggestions; Josh Tucker for useful suggestions and research assistance; Gary Cox for his British election data; and Selina Chen for her help and expertise in collecting additional British data. Burt Monroe saw the virtues of the compositional data analysis literature at essentially the same time as we did, and we appreciate his comments. For research support, Jonathan N. Katz thanks the Haynes Foundation, and Gary King thanks the National Science Foundation (SBR-9729884), the Centers for Disease Control and Prevention (Division of Diabetes Translation), the National Insti- tutes on Aging, the World Health Organization, and the Global Forum for Health Research. All information, data, and software necessary to replicate the results in this article are available in a replication data set to be deposited in the ICPSR's Publication Related Archive upon publication (ICPSR PRA #1190).
Our model can also be used to evaluate features of electoral systems, such as whether the districting system is fair to all the political parties and electorally responsive, although we leave details of this task to future work.
A few examples of the good survey analyses conducted in multi- party democracies include those in England (e.g., Goodhart and
research has enormous advantages for studying indi- vidual-level preferences, but as analyses of random selections of isolated individuals from unknown geo- graphical locations, they necessarily miss much of electoral politics. As such, they are often best comple- mented with studies of aggregate electoral returns.
Second, with surprisingly few exceptions, electoral analyses in comparative politics based on real election returns use national rather than regional, district, or precinct-level data.3 This approach has the advantage of allowing more countries to be included in the analysis without much data collection effort, but it also has serious disadvantages. Aggregate national-level studies prevent researchers from learning where votes come from and why, and they generally result in studies based on small numbers of observations and little variation on many relevant dimensions. Studies of postwar OECD countries usually contain only about a dozen observations (see Paldam 1991,18, Table I), and analvses of former communist countries could include onlithree or four free elections. This is often insuffi- cient information with which to parse out many of the interesting effects, and it ignores the substantial infor- mation content in the often vast differences across different regions of a country.
Finally, the vast majority of electoral studies in multiparty democracies dichotomize the electoral sys- tem into a pseudo-two-party contest. Researchers an- alyze the vote for the incumbent party versus all others grouped together, or the vote for a-particular group, such as left-wing parties, versus the combination of all
Bhansali 1970), Mexico (Dominguez and McCann 1996), Poland (Przeworski 1996), Peru (Stokes 1996), Russia (White et al. 1997), Denmark (Miller and Listhaug 1985), Italy (Bellucci 1984), and West Germany (Frey and Schneider 1980) as well as multicountry studies (Lewis-Beck 1988), among many others.
Such national-level studies have used data from France (Rosa and Amson 1976), Japan (Inoguchi 1980), England (Whiteley 1980), and Italy (Bellucci 1984); time-series of cross-sectional data from multi- ple countries (Host and Paldam 1990; Paldam 1986,1991; Powell and Whitten 1993); and single cross-sections of multiple countries (Lewis-Beck and Bellucci 1982), among many others. Subnational analyses include Bellucci (1984, 1991), Conford, Dorling, and Tether (1995), Rattinger (1991), Slider (1994).

A Statistical Model for Multiparty Electoral Data March 1999
the others. This procedure has the advantage of en- abling the use of standard statistical methods, but since these methods are best applied to the study of two- party systems (largely in U.S. data), two serious prob- lems result: bias and information loss. The procedure is biased whenever all parties do not field candidates in every election district. For example, even when the governing party contests every election, different num- bers of parties composing the "other" category will generally have large effects on a variable such as the percentage of the vote for the governing party. Because the vote a party expects to receive will normally be related to whether it runs a candidate, the observed variable will systematically overstate the true underly- ing support for the governing party when its true support is highest. For example, when the governing party is expected to do so well that it scares off opposition parties from running their own candidates, the fraction of the vote actually received by the gov- erning party will exceed its true support in the elector- ate. This, and other similar problems, can combine to induce severe bias in inferences based on such data.
Moreover, even if partially contested elections hap- pen to cause no bias in a particular case, important information, critical to comparative politics, is always lost by these methods. For example, when the eco- nomic pain caused by promarket reforms in postcom- munist countries results in the reformers being thrown out of office (Przeworski 1991), or when the increasing salience of ethnic divisions upsets the political order (Horowitz 1985, 1993; Offe 1992; Tucker 1996), which parties benefit? How do the electoral fortunes of each of the parties depend on the degree of economic hardship or ethnic divisions? Answering these ques- tions about multiparty systems requires statistical mod- els that permit multiparty outcomes. Shoehorning a complex multiparty democracy into a fake two-party system in order to perform an analysis that looks like those conducted in American politics takes the wrong lessons from that subfield. Making methodological decisions merely to accommodate the requirements of familiar statistical methods risks missing the most distinctive and interesting aspects of the electoral system under analysis. The bottom line is that multi- party systems require the development of multiparty statistical models. It would appear that much substan- tive knowledge can be gained, and bias reduced, by designing models of electoral systems with the special features of these systems in mind.
Although we intend our model to be applicable to a wide variety of multiparty electoral data, we apply it here to resolve one important scholarly controversy: the size of and trend in the electoral advantage of incumbency in the United Kingdom. For decades, the conventional wisdom has been that U.K. incumbency advantage is small to nonexistent and not increasing, but this conclusion has come under strong attack recently by researchers whose results seem to show that incumbency advantage is moderate to large and grow- ing fast. Unfortunately, it turns out that all estimates given in the literature are based on measures now
known to be biased. In partial agreement and disagree- ment with the substantive results from both sides, we demonstrate that the incumbency advantage is small but markedly different for each of Britain's three major parties. Our methods also provide information that others have not attempted to estimate, such as the party from which each party's incumbency advantage is primarily drawn. The study of incumbency advantage in the United States has been greatly enhanced by a quarter-century of scholarly work that has increased the precision and accuracy of estimates in this two- party system, and we hope a similar gain will result in electoral studies of multiparty democracies, such as the United Kingdom.
From a methodological perspective, analyses of ag- gregate electoral data fall into two fundamental cate- gories that should be carefully distinguished-contex- tual effects and ecological inferences. Research questions about the relationships; among aggregate variables require a model of contextual effects, such as that offered here (or, e.g., Huckfeldt and Sprague 1993). In contrast, research questions about the char- acteristics of the individuals who make up aggregate electoral data require ecological inferences and the special models designed for this purpose (see King 1997). For example, a study of the effect on the vote for more liberal parties of having a college in town is a contextual effect, for which the model we propose is directly useful. In contrast, using aggregate electoral data to study whether college students are more likely than others to vote for liberal political parties requires an ecological inference. Our statistical model applies to questions at the district level, such as incumbency advantage estimates or predicting which candidate will win. Formal models of individual behavior may be of interest for some purposes, but they are not always necessary in cases like these. For much of our discus- sion, we make the common assumption that candidates are strategic and well informed. Our working (testable) assumption about voters is that, conditional on the candidates, their voting behavior follows regular pat- terns of some sort.
In the sections that follow, we briefly describe our motivating substantive problem, discuss the more gen- eral characteristics of multiparty electoral data, sum- marize the problems that need to be resolved in order to develop a general statistical model for these data, introduce a simple version of the model for cases in which all parties contest, introduce assumptions to deal with partially contested elections, and show how to estimate the model and compute quantities of interest from these estimates. We present substantive results as the model is developed.
INCUMBENCY ADVANTAGE IN GREAT BRITAIN Until the 1980s, scholars generally agreed that British elections were decided by national and not local forces. The electoral advantage of incumbency was thought to

American Political Science Review Vol. 93. No. 1
be essentially nonexistent in Britain.4 For example, Butler and Stokes (1969, 6) repeatedly emphasize "the importance of national political issues and events as opposed to more local influences on the choice of the individual elector." They even go so far as to conclude (p. 8) that "so important are the [national] parties in giving meaning to contests in the individual parliamen- tary constituencies in Britain that for many voters candidates have no identity other then their partisan one" (see also Butler and Kavanagh 1980, 292).
The few numerical estimates of incumbency advan- tage in Britain come from a newer liteiature that contradicts this conventional wisdom. For example, Curtice and Steed (1980, 1983) find the "sophomore surge" for Labour-the average difference in the vote for Labour in open seats it wins and the vote in the subsequent election for the now-incumbent Labour party candidate-was about 1,500 votes (about 3.8%) in the 1979 and 1983 elections. Norton and Wood (1990) modify sophomore surge by correcting for re- gional swings and find a surge of 1.6% for the Conser- vatives and a remarkable 7.8% for Labour. Finally, Wood and Norton (1992), along with the prominent survey-based analyses of Cain, Ferejohn, and Fiorina (1987), also strongly argue for the proposition that incumbency advantage is increasing.
Although the idea of sophomore surge, on which most measures are based, is very intuitive, Gelman and King (1990) prove that it gives biased estimates of the causal effect of incumbency. In fact, in Britain, the problem may actually be worse than in two-party systems: Because most British elections have very few sophomores (usually only about two dozen), the mea- sure discards more than 95% of the district observa- tions and is therefore exceptionally inefficient. More- over, the measure is usually applied without controls and without any feature of the statistical model which recognizes that the system being analyzed has more than two parties.
Thus, we have .on one side the conventional wisdom, based on many years of traditional analyses, that incumbents have no electoral advantage. On the other side, we have a growing systematic quantitative litera- ture which argues that the incumbency advantage is moderate to large and steadily growing. We hope to resolve this scholarly dispute.
Our data for this article include constituency-level election results from England for 1959 to 1992. We also have more limited data from the 1955 elections, which we use whenever possible. Geographic districts in England are called "constituencies," but we use the two words interchangeably because our model applies more generally. For convenience, we usually refer to
The concept of the "personal vote" is used in Britain to include any local, candidate-specific effects, but for empirical analyses it is normally treated synonymously with incumbency advantage. In the United States the personal vote is considered to be the fraction of the incumbent's advantage attributable to the person rather than the party. For this article, we use only the total effect and refer to it as the "incumbency advantage," as is most common in the American political science literature (see Gelman and King 1990 for a formal definition).
the Liberal Party and its alliance with the Social Democratic Party more simply as the Alliance.5
CHARACTERISTICS OF MULTIPARTY DATA We now identify the statistically important character- istics of multiparty electoral data. We first do so in simple algebraic terms and then translate the algebra into a useful graphic display.
Let Vij denote the proportion of the yote (the underline denotes our mnemonic labeling convention) in district i (i = 1, . . . , n) for party j (j = 1, . . . , J). Two fundamental features of multiparty voting data are that each proportion falls within the unit interval
V-,. E [0, 11 for all i and j, (1)
and the set of vote proportions for all the parties in a district sum to one:
J
Vij = 1 for all i. (2) j=1
Thus, an important criterion of a good (and logically possible) statistical model of multiparty voting data is that it satisfies the constraints in equations 1 and 2. Variables that meet these constraints fall in a region generally referred to as the simplex.
We now illustrate this simplex sample space graph- ically for the two- and then the three-party case. For each case, we apply a simple trick to reduce the number of dimensions required, making the graphical presen- tation more manageable and ultimately informative, without losing information. The graphic version of these relationships will also be useful for exploring the data and understanding the model fit.
For the two-party example, we use ViD for the Democratic and ViR for the Republican shares of the vote in district i for candidates for the U.S. House of Representatives. Obviously, we can easily represent both variables by just one, say, ViD, since the other is merely ViR = 1 - ViD. Figure 1A plots ViD by ViR. Because of the constraint in equation 2, all district vote fractions fall on a single line segment, and due to the constraint in equation 1, the line ends at the axes. Thus, all the points in the two-dimensional plane in Figure 1A fall on a simpler one-dimensional line segment. Presenting this line segment in Figure 1B reduces the problem from two to one dimension without losing any information.
Figure 2 provides analogous information for three parties. Figure 2A plots in three dimensions the three variables from the British electoral system, Vie, ViL, and Vd, for the Conservative, Labour, and Alliance vote proportions, respectively. The constraints in equa-
5 We began with the data set "British General Elections, 1955-1992," (version 8, August 1993), constructed by D.F.L. Dorling of the University of Newcastle, extracted data from England only, updated it, and added information on incumbency status. The number of observations in our data for each election year are: 1955, 460; 1959, 460; 1964, 455; 1966, 488; 1970, 471; 1974 (Feb.), 463; 1974 (Oct.), 491; 1979, 467; 1983, 491; 1987, 522; and 1992, 521.

A Statistical Model for Multiparty Electoral Data March 1999
FIGURE 1. The Sim~lex for Two Parties
A. 2 Parties, 2 Dimensions
0 .25 .5 -75 1 ViD
B. 2 Parties, 1 Dimension
Mote: This figure explains graphically how to reduce two vote variables to one dimension. Graph A portrays the familiar relationship between the vote for the Republicans (V,,) and Democrats (V,,) in the U.S. two-party system; because of the constraints of equations 1 and 2, all soints fall on a line segment and can be portrayed more simply as Braph B.
tion 2 imply that valid points must fall on the plane cutting through the three-dimensional space. The con- straints in equation 1 require this plane to end at each of the three axes. The resulting area that satisfies both constraints is the equilateral triangle shaded in A.
Because all the points in three dimensions fall in a two-dimensional area, we can save space by presenting the triangle alone in two dimensions, which we do in Figure 2B. This graph is a version of a ternary diagram (or trilinear, triaxial, or barycentric plot; see Upton 1989, 1994), to which we have added several new features. In this triangle, each dot fully characterizes a single constituency result from the 1979 British elec-
tion. Roughly speaking, the closer a dot is to a vertex (with a party's label, C, L, or A), the higher is the vote total for that party; more precisely, a vote total for a party equals the perpendicular distance from the side of the triangle opposite to the labeled vertex, as calibrated on the scales we have added. That is. the vertical positions of the dots in the figure indicate the values of Vic, as indicated on the scale on the left. As a dot falls farther from the side opposite the L vertex, the larger is the 6, variable (as can be seen by comparing the point to the scale at the top).
For exam~le. in addition to the real data. we have added one (hypothetical) election result as a small box in the bottom left of Figure 2B. In order to clarify how to read the voting results in this district. we added dashed lines conn&ting this point to the three axes. In this district, the Conservatives received 25% of the vote, as can be seen by following the dashed line from the box to the left axis that calibrates V,,. The dashed line traces the shortest distance from 'the axis to the point, that is, a line perpendicular to the axis. The same district also gave 25% of its vote to the Labour Party (see the dashed line that heads northward to the V,, axis) and half its votes to the Alliance (as can be determined from the dashed line that heads down to the right to meet the V, axis). The electoral results for all the real districts, represented by dots, also can be read by tracing out perpendicular lines to each axis. With all this precision available when needed, it is still
' worth remembering the easier rough way to interpret this ternary diagram: The closer a point is to a vertex of the triangle, the more votes that district gave to the party whose label appears there.
We have removed most of the sides of the triangle in order to make visible districts with zero votes for one of the parties. For example, districts uncontested by the Alliance fall on the right side of the triangle, where the bottom axis reveals that V, = 0. Substantively, these partially contested districts appear to be generated by a different process than the mass of (fully contested) districts that fall inside the triangle. This can be seen since the distribution of points does not gradually get smaller (or larger) as it approaches the side of the triangle; instead, there appears to be an area without dots, indicating every party that merely appears on the ballot receives at least 15-20% of the vote.
We have also added lines that divide the triangle into thirds. We call these win lines, since they indicate which party wins, depending on the region in which a point falls. For example, if a point falls in the region at the top of the graph, the Conservatives win a plurality of the votes and (by the electoral rules) the seat for that constituency. Points that fall within the left region are wins for the Alliance, and those in the right go to the Labour Party. The same logic applies to multiparty elections with J > 3 parties, even though graphical displays become more unwieldy.
PROBLEMS TO RESOLVE Standard regression-type models applied to multiparty electoral data usually generate nonsensical results. For

American Political Science Review Vol. 93, No. 1
FIGURE 2. The Simplex for Three Parties
A. 3 Parties, 3 Dimensions B. 3 Parties, 2 Dimensions
0
Note: In a manner analogous to Figure 1, this figure reduces three vote variables to two dimensions. Graph A portrays the relationship among the votes for the Conservative (V,/,,), labour (Vi,), and Alliance (V,) parties; because of the constraints of equations 1 and 2, all points fall on an equilateral triangle that is the intersection of a plane with the three dimensional figure. Graph B portrays this more simply in two dimensions in a version of what is known as a "ternary diagram." Values of the three variables can be read by where the dots fall perpendicular to the three numbered axes. The little square point (with dotted lines referencing the axes) is the example discussed in the text.
example, one common approach is to use the vote for each party as a dependent variable (fraction for the Conservatives, fraction for the Labour Party, etc.) and to regress each on a set of explanatory variables. These J regressions are run separately, or via a "seemingly unrelated" system of equations. Since neither con- straint from equations 1 and 2 is satisfied, this ap- proach generally fails to give sensible results. That is, the results often imply that some parties will get fewer than zero votes, or that the sum of votes for all parties will be greater or less than 100%. Moreover, even when point predictions happen to fall within the constraints of the simplex, the full probabilistic implications of the model are virtually always logically impossible, as some of the predictive density always falls outside the sim- plex. Some of the few who recognize this problem transform Kj to an unbounded scale (separately for each party j), such as with a logistic function, and then apply separate or seeming unrelated regressions, but this, too, is insufficient: The results will satisfy equation 1 but not equation 2. Similarly, running only J - 1 regressions and computing the predictions for ViJ from the others satisfies equation 2 but not equation 1. Various other ad hoc approaches can be taken to correct different parts of the problem, but especially
because computing most quantities of interest requires the full probabilistic model, we decided to pursue a more general approach.
The model we develop can be considered a general- ization of two independent lines of statistical research. The first line includes models for "compositional data" (Aitchison 1986), a term that describes data sets with multiple outcome variables that sum to unity for each observation. A few of the many examples of composi- tional data from other fields include soil samples in geology and pedology (with measurements of the frac- tions of sand, silt, and clay), rock samples in geochem-
' istry (with fractions of alkali, Fe203, and M,O), and blood measurements in biology (proportions of white blood cell types measured for each patient). Composi- tional data are also common in political science and economics (as in multiparty voting data, the allocation of ministerial portfolios among political parties, trade flows or international conflict directed from each na- tion to several others, or proportions of budget expen- ditures in each of several categories), but researchers in these fields have not taken advantage of the connection to this more general statistical approach. That is un- fortunate, because compositional data seem to be closely related to the raison d'&tre of political science

A Statistical Model for Multiparty Electoral Data March 1999
research: If politics is the authoritative allocation of resources, then fractions of resources received by each group are exactly compositional data.
The key contribution of this literature is statistical models that allow only possible outcomes to occur. That is, predictions or simulations from such a model satisfy equations 1 and 2 or, in other words, have positive density only over the simplex. The most influ- ential models of compositional data are due primarily to Aitchison (1986), who criticized earlier models based on Dirichlet distributions (see citations in Aitchi- son 1986, 61-2), since those models require the ratios of "compositions" (votes for each party in our applica- tion) to be independent. Aitchison avoided this unre- alistic assumption by applying the normal distribution to the log-ratios of the individual components. This procedure starts with the multivariate normal fit to the unconstrained real plane and then maps it into the simplex via the multivariate logistic transformation. This works in the same way as, for example, the log-normal maps the real number line onto the positive real numbers.
The second line of research that we generalize are models of votes and seats for two-party systems (Gelman and King 1991, 1994a, 1994b; King 1989a; King and Browning 1987; King and Gelman 1991) and for multiparty systems (King 1990). Like compositional models, some of these vote and seat models also transform votes (in different ways) using logistic trans-. formations and then stochastically model the trans- formed variables. The resulting statistical models differ in a variety of ways, but they also constrain the result to the proper sample space so that equations 1 and 2 are satisfied.
Unfortunately, the models from neither line of re- search will work without modification for multiparty voting data. One problem is that our extensive evalu- ations of the assumptions of normality underlying the models proposed for compositional data (which we present belowj indicate that they do not fit real election data. Another problem is that these models also do not capture a fundamental feature of voting data: the pattern of "missing data" that occurs when at least one party receives zero votes in a district, as when it presents no candidate for election in a district. Zero vote totals in electoral data constitute politically crucial information and therefore must be treated very differ- ently from examples in which zeros entries are consid- ered indicators of missing data, due to slight measure- ment error (as when instruments for measuring the compositions of soil samples miss the always-present traces of some elements). The models discussed above for analyses of seats and votes fit two-party systems well and (King 1990) they can fit multiparty data on seats given votes, and some of these include special features for uncontested districts, but they are not directly applicable to explaining or predicting multiparty elec- toral data.
Thus, a proper model of multiparty voting data must have the following special features. It must have posi-
tive density only over the simplex and must use a distribution more flexible than the multivariate normal, which does not fit real voting data. It also must allow covariates (explanatory variables). Below, we provide this basic model for fully contested district elections. The model also must provide special features to deal with uncontested and partially contested seats, which we do in the subsequent section. The complete likeli- hood function is then given.
Finally, a proper model must allow for estimates of precisely the quantities of scholarly interest, and these may differ across applications. That is, we should not have to teach readers to interpret the arcane results of statistical models; rather, the models should be modi- fied to produce results in the form of most natural interest to substantively oriented political scientists. For example, the raw coefficients estimated by models of compositional data are not the quantities of interest for any political or, indeed, virtuallx any nonpolitical application. We use methods of simulation, described below, to compute estimates of a wide range of theo- retically interesting quantities. These methods are crit- ical to political science applications of this new model. We also believe the methods will enable those in other scholarly disciplines, who use somewhat related models for very different purposes, to compute numerical quantities of more interest to their research than the usual results of compositional data models.
THE BASIC MODEL FOR FULLY CONTESTED ELECTIONS In this section, we only consider district elections in which all parties contest and every party gets at least one vote: Vij E (0, 1) for all i and j. Because, in practice, no officially registered candidate who appears on the ballot ever gets fewer than 15-20% of the vote in our data, the only real assumption here is that all parties contest all district elections. We generalize this model to deal with partially contested elections in the next section.
Let Vi = (Vil, . . . , Vi(j-,)) be a (J - 1) X 1 vector for each district i (i = 1, . . . , n). This vector contains all the information in the individual vote fractions, since the votes for party J can be computed determin- istically from the others:
The model we are about to propose is "symmetric" in the sense that changing the party labeled J does not affect anything of substantive importance.
Aitchison (1986) proposes that compositional data like Vi be modeled with his additive logistic normal distribution. This distribution can be formed as follows. First let Yi be the vector of J - 1 log-ratios Yij = ln(VijlViJ), for party j (j = 1 . . . , J - 1) relative to party J . Then assume that the (J - 1) X 1 vector Yi =
(Yil, . . . , Yi(,-,)) is multivariate normal with mean

American Political Science Review Vol. 93, No. 1
vector p and variance matrix Z. To get to the observed votes, use the multivariate logistic transformation:
Although compositional data analysts have found this specification to be useful for their applications, we demonstrate below that it is inappropriate for multi- party voting data. In our data, a majority of districts tend to be more highly clustered, and a minority much more widely dispersed, than the multivariate normal implies.
Political scientists modeling seats and votes have avoided this distributional problem by combining mix- tures of independent normals and appropriately cho- sen covariates, but these solutions are insufficient for a general approach to multiparty voting data.
We now derive a new model that solves these problems. We label the distribution the additive logistic Student t (LT) distribution, which we demonstrate is superior when used to fit political data to the additive logistic normal, which it includes as a limiting special case. To derive the LT distribution, first let Yi be multivariate Student t (Johnson and Kotz 1972) and then apply the transformation in equation 4:
= T[ln(Vi/Vir>l pi, Z]lnJ-l Vii j= 1
where the extra factor in the denominator is the Jacobian of the transformation (required when creat- ing a new distribution from an existing one through a deterministic transformation), the expected value and variance of Y,,. are pq and 2v/(v-2), and v (v > 0) is the degrees of freedom parameter. The (J - 1) X (J - 1) parameter Z is known as the scatter matrix. This distribution happens to be equivalent to the predictive distribution, under certain conditions, when using the additive logistic normal (see Aitchison 1986, 174).
This model differs from the additive logistic normal when v < w, and it differs more the smaller is v. We find in practice that our estimates of v are fairly small, and thus the LT distribution differs significantly from the additive logistic normal.6 For example, Figure 3 gives two ternary diagrams with normal (for A) and t (for B) confidence regions fit to real electoral data
SO that we consider only cases in which the moments exist on the logistic scale, we impose the technical restriction that v > 2. This assumption, while not necessary for our model or estimator (since the moments of the additive logistic t are always finite), does make estimation and simulation simpler. Given that our estimates of v stay far from the boundary (even when permitted to do otherwise), this technical assumption is unambiguously supported by our data.
FIGURE 3. The Fit of the Logistic Normal and Logistic t Distribtions
A. Normal Based Confidence Regions
B. t Based Confidence Regions
Note: Both graphs give a ternary diagram for 1970 British House of Commons electoral data, with uncontested districts deleted, and 50% and 95% confidence regions based on the additive logistic normal in (A) and additive logistic t in (B). The better fit to the t distribution is indicated by the approximately 50% and 95% of the constituencies that fall within the 50% and 95% confidence region, respectively, for thet distribution, but only 64% and 91 % for the normal. Note also how the inner region is much narrower, and the outer region is wider, for the t than the normal.

A Statistical Model for Multiparty Electoral Data March 1999
(from 1970). For both, the inner loop is the 50% confidence region; if the model is appropriate, half the points should fall within it. In fact, 66.7% fall within the normal-based region, whereas 48.5% fall within the t-based region. A similar situation, but slightly less extreme, holds for the 95% confidence region, which is the outer loop in both graphs. (Because of the large number of constituencies, the figure is more useful for understanding the differences in how the two models fit these data and the nature of confidence regions on the simplex, rather than making it easy to count points within each region.) This demonstrate~s clearly the advantage of the t distribution for British electoral data.7
When v is sufficiently large, the normal and t distri- butions are identical. This means that our generaliza- tion has great potential benefits, because it fits a much wider range of data more common in multiparty de- mocracies, and it is also essentially costless (i.e., except for the trivial efficiency loss caused by estimating the extra degrees of freedom parameter). Given this risk profile, there seems little reason not to use this more general model.
The generalization that the additive logistic t pro- vides would be traditionally described (by using the general textbook description for t-based distributions) as allowing for "fatter tailsn-a small number of con- stituencies surprisingly (according to the normal) far from the center of the distribution. This description is accurate, but perhaps a more informative characteriza-' tion is the other half of the story: When v is small, most of the constituencies are surprisingly (according to the normal) heavily clustered together (compare the inner confidence region in the two graphs in Figure 3). That is, what the traditional description of t-based distribu- tions misses is that when v is small, a t distribution with the same variance as a normal has both fat tails and heavier cluster around the mode. The two features must exist simultaneously to counterbalance each other, in order that the result is a proper distribution. Our reason for also emphasizing the heavy cluster is that this describes more of the points than focusing on the relatively small number of outliers in the tails.
As can be seen by the counts of districts within the confidence regions in Figure 3, the additive logistic t model fits the data better than the additive logistic normal. The substantive reason is that most constitu- encies in England have vote fractions that are very similar to one another, but a smaller set of constituen- cies are quite far from this main cluster.
In Figure 4 we present summaries of the fit of the two distributions for all the elections in our data. It shows for each election year the percentage of districts that fall within the 50%, 80%, and 95% confidence regions. Figure 4A shows that for the additive logistic normal model, the actual fractions of points within each of these regions (indicated by solid lines) vary
7 The fit of the model could be closer to a normal after conditioning on explanatory variables, but our studies indicate that this is not usually the case with our multiparty data. We present the simple case in Figure 3, without covariates, for ease of presentation.
quite a distance from the theoretically correct (straight dotted) lines. (For visual clarity, the solid lines connect the points at the elections, where the estimation was actually conducted.) In contrast, the actual and theo- retical values are very close for the additive logistic t, portrayed in Figure 4B. The normal seems to fit better for more recent elections than it once did, but there is no reason to think that this trend will continue.
For applications, we let the means of the log-ratios be linear functions of vectors of explanatory variables:
where Xij is a pj x 1 vector of explanatory variables, and p, are parameters to be estimated. For most applications the explanatory variables will be the same for all j, but this is not required. The parameters pj, 2, and v are of little direct interest, but we show below how to compute quantities of interest from them.
ASSUMPTIONS FOR PARTLY CONTESTED DISTRICTS
We now introduce methods of generalizing the basic model to allow for districts in which some parties do not contest the outcome.
We follow King and Gelman (1991) by setting as the goal of estimation the effective vote-values of VU that we would observe if all J parties contested the election in district i. In districts with all parties contesting, the effective vote is the observed vote. In partly contested districts, the effective vote for all parties is unobserved but can be estimated. (That is, in districts in which any party chooses not to contest, we lose information about the effective vote proportion for all parties, since those that contest might get different vote fractions if they were to face more competition.)
The effective vote concept covers all "national" political parties, even if they do not contest all elec- tions. We distinguish regional parties and do not try to estimate strained counterfactuals, such as what would happen if the Scottish nationalists ran in English constituencies. Regional parties are easy to include in our model, but for expository purposes we omit this issue here.
In order to analyze the effective vote in districts not fully contested, some assumptions must be made. We introduce several designed for electoral systems in which the candidates and parties decide for themselves whether to contest a district election.8 A reasonable assumption under these circumstances is that a non- contesting party would not have won if it had nomi- nated a candidate. After all, if they would have won, they probably would have nominated someone in the
Other assumptions would be necessary when, for example, a progovernment election commission prevents opposition parties from entering a race because they might win, as occurs in some fledgling Eastern European democracies. Similarly, when a small party makes a deal with a larger party not to contest in certain areas (as in the recent New Zealand elections), these assumptions would not hold. Our model could be modified accordingly. In all cases, scholars should tune the model assumptions to what we know about the details of party politics.

American Political Science Review Vol. 93, No. 1
FIGURE 4. Confidence Region Coverage
A. Coverage of Normal Confidence Regions
Year
B. Coverage of t Confidence Regions
Note: These graphs summarize the fit of the additive logistic normal (A) and additive logistic t (B) distributions for all U.K. elections in our data set. For each election, the solid lines mark the percentage of coverage for the 50%, 80%, and 95% confidence regions (where dotted lines are drawn). The better fit of the t distribution is indicated by the actual number of constituencies within each region (indicated by the solid line) staying much closer to the dotted line for the t than for the normal.
first place. Even if this assumption is false, it is unlikely that did nominate candidates, and so we expand the that any statistical analyst can devise a more realistic assumption to this more encompassing version. We assumption than the noncontesting party is effectively recognize that this broader assumption occasionally able to do for us. may not hold. In other words, it is conceivable that the
It also seems highly likely that the noncontesting noncontesting party, if it ran, might get more votes party would have received fewer votes than the parties (and yet still lose) than one of the parties that chose to

A Statistical Model for Multiparty Electoral Data March 1999
run. Yet, even if this assumption were violated, the degree of violation would very rarely be large enough to make a substantive difference. Moreover, the alter- native possible assumptions are more arbitrary and would be difficult to justify.
Other assumptions could be chosen, based on mod- els of candidate entry and exit for different electoral svstems or on different features of the British electoral system (such as the loss of a monetary deposit by candidates who do not receive a certain fraction of the vote). Our methods for deriving the model below under our chosen assumptions can be easily modified to handle these alternatives.
If covariates that predict which parties contest in each constituency are available, then they can be used in interactions with indicator variables that code for the patterns of uncontestedness in order to avoid assump- tions about parameter equivalence between district elections that are fully and partly contested. In most cases, these variables will be useful but not necessary. An alternative is to develop full-blown models that predict which parties contest in each district as sepa- rate equations. Although future researchers may wish to consider this approach, we do not pursue it because it is unnecessary, would make the model less robust, and would require data that are very hard to obtain in most applications.
We make no assumption analogous to "indepen- dence of irrelevant alternatives," as is sometimes nec- essary for individual-level, survey-based statistical models of multiparty voter choice (see Alvarez and Nagler n.d.). That is, our assumptions, and the model built from them, allow the entry or exit of a party into a district election contest to affect the relative vote totals of the parties already in the race.
ESTIMATION In this section, we propose methods of estimating the parameters of the model, P = {Pj}, Z, and v. In the next section, we explain how to compute quantities of interest given these results.
If all districts are contested by all parties, we can estimate the parameters by maximum likelihood. That is, we would maximize the log of the additive logistic t distribution in equation 5, summed over all observa- tions, with respect to the parameters. Complications arise in partly contested districts, however. One attrac- tive approach for missing data problems such as this is to use Markov Chain Monte Carlo (MCMC) methods (see Tanner 1997). For example, impute the missing data given a guess for the parameters; then estimate the parameters given these "completed" data via max- imum likelihood; then use these better parameter estimates to impute more realistic values for the miss- ing data; and so on, until (stochastic) convergence.
We implemented a version of the MCMC approach, but in our experience and with our three-party data, this procedure is relatively slow, primarily because each of the two steps in every iteration is itself iterative. We offer a direct likelihood approach that is approximately twenty times faster. Our studies indicate that this
alternative is faster for smaller numbers of parties, but the MCMC approach may be more computationally efficient for larger numbers of parties.
Our description of the direct likelihood approach begins by denoting the set of parties contesting the election in district i as Pi, a set that can take on seven patterns: (1, 2, 3), (2, 31, (1, 3), (1, 21, {I), (21, and {3>.9
When the effective vote is observed for all parties, the likelihood is the probability density of the observed variables. For simplicity, we write the likelihood as a function of Y, rather than V,, although the two give equivalent results. For districts with fully contested elections, the observed vote (V:l, V:,, V:3) equals the effective vote (Vil, Viz, Vi3). Thus, Yil = 1n(VillK3) and Y,, = ln(Vi,IK3) are both observed, and the likelihood function is the bivariate t probability density:
with parameters
(and where ul, u,, and p make up the scatter matrix). This density differs from the additive logistic t for Vi in equation 5 by a constant factor (the Jacobian of the transformation), which thus establishes the equiva- lence of writing the likelihood as a function of either Vi or Y,.
When some of the effective votes are not observed (due to noncontesting parties), our assumptions desig- nate a region in which the vote variable falls, in which case the likelihood is the area (or volume) under the probability density corresponding to this known region. The Appendix derives the likelihood function for these cases.
The complete likelihood function is the product of the likelihoods for the fully contested case in equation 7 as well as the partially contested cases derived in the Appendix and given in equations 12,15, 16, 17,18, and 19:
where we define the product over a null set (when no district election of the type exists) as equaling unity. We also substitute pil = XilPl and piz = Xi& to introduce (overlapping, identical, or different sets of) covariates Xi, and Xi,. For our present application, we define Xi, and Xi, to include a lag of Yil, a lag of Y,,, and three indicator variables to represent incumbency status for each party. We have conducted many other runs with demographics and other variables included, but, as is consistent with the results from analyses in the United States and other democracies, these tend to have only minor effects on our estimates of incumbency advantage. Since our goal is to estimate the total causal effect of incumbency status, we exclude covariates that
9 Suppose they held an election and nobody ran? We ignore this amusing eighth possible pattern, despite its occasional appearance in some very low-visibility local U.S. elections. In general, the number of patterns of missing data is 2J.

American Political Science Review Vol. 93, No. 1
are consequences of this key causal variable (for the same reason that in estimating the effect of an individ- ual's unemployment on his or her vote, we would not wish to control for voting intentions five minutes before walking into the voting booth; see Cox and Katz 1996; Gelman and King 1990; and King, Keohane, and Verba 1994, 173-5).
To facilitate maximization, and to make the asymp- totic normal approximations we use below feasible with fewer observations, it is helpful to reparameterize so that all parameters are unbounded (ranging between -a and w), as p1 and p, already are. Thus, the full set of transformations is:
where the form of the equation for $, is the inverse of Fisher's Z transformation (keeping p between - 1 and 1 no matter what value $, takes) and that for $, constrains v to be greater than two in order to guaran- tee that the moments of the distribution on the logistic scale exist.
To summarize all our knowledge about and uncer- tainty in the parameter vector
we maximize the likelihood function. This gives us an asymptotic normal posterior distribution with the max- imum likelihood point estimates as a mean vector and, as usual, the inverse of the negative of the Hessian as the variance matrix10
Because maximum likelihood is invariant to repa- rameterization (see King 1989b), the same point esti- mates are obtained whether we estimate $ and trans- form to get $ or estimate $ directly. We also use the standard empirical Bayes approach to specify normal priors (i.e., the hyperparameters are estimated from the means and variances of the maximum likelihood estimates across our ten election years). Our empirical results below are qualitatively the same as with straightforward maximum likelihood, but, as usual, empirical Bayes helps to reduce the random variability across and within years.
COMPUTING QUANTITIES OF INTEREST Because the point of developing a model of voting in a multiparty democracy is to explain and predict election
lo We verified this asymptotic normal approximation by comparisons with the exact (i.e., fmite sample) posterior distribution, thus avoid- ing the large-n assumption altogether. We did this with the technique of importance sampling, an iterative simulation method based on a probabilistic rejection algorithm (see Tanner 1997). Our experiments indicate that the point estimates we report below are correct, and the standard errors are if anything conservative (is., somewhat larger than they should be). Because importance sampling is very compu- tationally intensive and hence would be more difficult for others to apply, and since we found that the two approaches did not suggest any real substantive differences in our data, the analyses below are based on the asymptotic normal approximation.
results, our model ought to be capable of computing quantities on the scale of reported votes. That is, the estimated $ parameters that result from maximizing the likelihood are important, but they are of little direct interest. For starters, they are reparameterized for estimation via equation 10. But even transforming back to the original $ scale, by inverting these equations, is not very helpful since the estimation was done on the additive logistic scale rather than on the scale of substantive interest-the votes. The quantities of direct substantive interest are complicated functions of these parameters.
Computing some of these quantities of interest is possible analytically (through Taylor series approxima- tions and the like), but it would be difficult. Computing many others is impossible. We simplify these problems by substituting computer time for human effort via an increasingly popular technique called random simula- tion (also called stochastic simulation, Monte Carlo simulation, etc.) (see Gelman et al. 19'95; Jackman 1996; Tanner 1997). Because simulation can generate results with any desired degree of precision, the tech- nique entails no compromises (given a sufficiently powerful computer). The methods for interpretation and presentation we use here are also applicable in the context of most other statistical models (see King, Tomz, and Wittenberg 1998).
We describe the calculation of three quantities of interest in this section, a predicted vote, an expected Vote, and a causal effect. With each, we use a combi- nation of classical and Bayesian techniques. We save the calculation of other quantities, such as bias and responsiveness, for a future article.
Predicted Vote The quantity of interest here is the probability distri- bution describing the predicted allocation of votes in a district conditional on a fixed value for each of the explanatory variables. The prediction is therefore a probability distribution over the simplex.
Our first requirement is a method for drawing one random election result from the approximate posterior distribution given the estimated model, which we label (ppl, rp,, Vp3), where p is prediction and the tilde indicates that the values have been simulated. We draw this simulated district election result given a set of values for the explanatory variables Xpl and X , (each being row vectors). To accomplish t h ~ s we fofiow this algorithm:
Maximize the likelihood function in equation 9 (with the empirical Bayes priors), and r~cord the vector of maximum likelihood estimates, $, and the variance matrix, V(C$). Take one random draw of $, which we designate as 6, from a mu1tivaria;e Annormal distribution with mean $ and variance V($). Reparameterize from 6 to (J by using equation 10, where we use Xpl and Xp, in computing ppl and PP2.

A Statistical Model for Multiparty Electoral Data March 1999
4. Draw ypl and Yp2 randomly from a bivariate t distribution with parameters +.
5. Compute ppl, P ,, and T/,! deterministically from Fpl and Fp2 by t$ multivar~ate logistic transforma- tion in equation 4.
To compute the distribution of election results given X,, we repeat steps 2-5 of this algorithm M times (we find that M = 1,000 is sufficient for most purposes). Then our approximate posterior distribution of Vpl is merely a histogram of the simulated values. A point estimate of the three-party vote results can be com- puted by taking the numerical average of the simula- tions for each party. A standard error can be computed by taking the standard deviation of the simulations for each party. Similarly, a (say) 80% confidence interval can be computed by sorting the values in numerical order and taking the values at the 10th and 90th percentiles. The full approximate posterior distribution may be calculated by a two-dimensional histogram over the simplex.
For an example of simulating predictive quantities of interest, we give an inference about a predicted value from a typical open seat. To be specific, we first estimated the model for 1987 with lags of Y,, and Y,, and two indicators for incumbency status. We included all variables in both equations. We then set the explan- atory variables (Xpl and X,,) such that no candidate standing for election is a member of the House of Commons, and the previous vote (i.e., in 1983) is equql to the average vote across constituencies (V,, = 0.46, V = 0.28, and VpA = 0.26). We then applied the ahirithm above to yield 500 simulations of the three vote vectors.
We use two graphical methods for portraying the results from this prediction, both shown in Figure 5. Figure 5A plots the 500 simulations in one ternary diagram. The simulations are all predictions for a single district and thus vary only due to uncertainty in the prediction; the collection of dots in this figure then portrays the full nature of the probabilistic prediction about where the point (given the values of the explan- atory variables) is likely to be. That is, we have higher confidence that the actual district vote in the average open seat district will be where the heavy cluster of t i e dots falls, and the result will fall with smaller probabil- ity where there are fewer dots. Substantively, the result shows that this typical district is very likely to be won by the Conservatives, since most of the points fall into the upper third of the triangle. (The actual probability that this district will be won by the Conservatives equals ihe fraction of simulated dots that fall in this top region, defined bv the win lines.)
Figure 5B gives density estimates (smooth versions of histograms) for each of the three vote variables. This graph helps emphasize the separate, but still obviously related, nature of the three variables. Each density estimate portrayed in the graph is an approximate posterior distribution of that quantity (i.e., it can be thought of as a pile of predictions or simulations), indicating where the future value of that vote is likely to be. Judging from the very little overlap in the
FIGURE 5. Simulations of a Predicted Value
A. Ternary Plot of Predicted Votes
Note: This figure interprets the results of a model by computing the distributional implications of a single prediction (for an open seat in the constituency with the average vote). Graph A plots 500 simulations from this prediction on a ternary diagram; Graph B gives density estimates of the simulations from the same three vote variables. According to the prediction, the district's vote heavily favors the Conservatives.
B. Density Plot of Predicted Votes 14
distributions, it is highly likely that the Conservatives will out-poll the Labour and Alliance parties. The Labour Party will likely do better than the Alliance in this constituency, but because of the heavy overlap in these two distributions, this inference is less certain. Note that all information in B can also be found in A, although the images emphasize different aspects of the data.
In an application with a variety of explanatory vari-
12- ' P A 'PL 'PC
American Political Science Review Vol. 93, No. 1
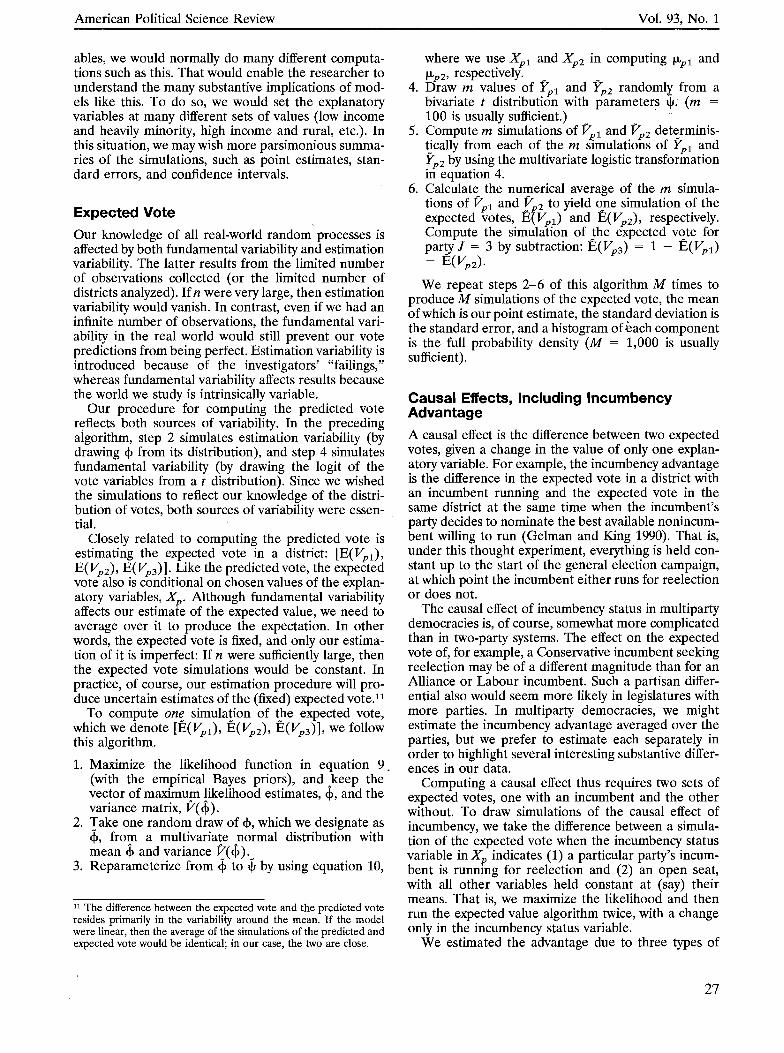
ables, we would normally do many different computa- tions such as this. That would enable the researcher to understand the many substantive implications of mod- els like this. To do so, we would set the explanatory variables at many different sets of values (low income and heavily minority, high income and rural, etc.). In this situation, we may wish more parsimonious summa- ries of the simulations, such as point estimates, stan- dard errors, and confidence intervals.
Expected Vote Our knowledge of all real-world random processes is affected by both fundamental variability and estimation variability. The latter results from the limited number of observations collected (or the limited number of districts analyzed). If n were very large, then estimation variability would vanish. In contrast, even if we had an infinite number of observations, the fundamental vari- ability in the real world would still prevent our vote predictions from being perfect. Estimation variability is introduced because of the investigators' "failings," whereas fundamental variability affects results because the world we study is intrinsically variable.
Our procedure for computing the predicted vote reflects both sources of variability. In the preceding algorithm, step 2 simulates estimation variability (by drawing + from its distribution), and step 4 simulates fundamental variability (by drawing the logit of the vote variables from a t distribution). Since we wished the simulations to reflect our knowledge of the distri- bution of votes, both sources of variability were essen- tial.
Closely related to computing the predicted vote is estimating the expected vote in a district: [E(Vpl), E(Vp2), E(Vp3)]. Like the predicted vote, the expected vote also is conditional on chosen values of the explan- atory variables, X,. Although fundamental variability affects our estimate of the expected value, we need to average over it to produce the expectation. In other words, the expected vote is fixed, and only our estima- tion of it is imperfect: If n were sufficiently large, then the expected vote simulations would be constant. In practice, of course, our estimation procedure will pro- duce uncertain estimates of the (fixed) expected vote.11
To compute one simulation of the expected vote, which we denote [E(v,,), E(v,,), E(vP3)], we follow this algorithm.
1. Maximize the likelihood function in equation 9 . (with the empirical Bayes priors), and keep the vector of maximum iikelihood estimates, +, and the variance matrix, V(+) .
2. Take one random draw of +, which we designate as 6 , from a multivariate nnormal distribution with mean + and variance V(+).
3. Reparameterize from 6 to t$ by using equation 10,
l1 The difference between the expected vote and the predicted vote resides primarily in the variability around the mean. If the model were linear, then the average of the simulations of the predicted and expected vote would be identical; in our case, the two are close.
where we use X,, and Xp2 in computing ppl and pp2, respectively.
4. Draw m values of Fpl and Fp2 randomly from a bivariate t distribution with parameters I$. (m = 100 is usually sufficient.)
5. Compute m simulations of vel and vp2 detcrminis- tically from each of the m simulations of Ypl and Fp2 by using the multivariate logistic transformation in equation 4.
6. Calculate the numerical average of the m simula- tions of vpl and rp2 to yield one simulation of the expected votes, E(Vpl) and E(v,,), respectively. Compute the simulation of !he expected vote for party J = 3 by subtraction: E(V,,) = 1 - E(Vp1) - E(VP2).
We repeat steps 2-6 of this algorithm M times to produce M simulations of the expected vote, the mean of which is our point estimate, the standard deviation is the standard error, and a histogram ofkach component is the full probability density (M = 1,000 is usually sufficient).
Causal Effects, Including Incumbency Advantage A causal effect is the difference between two expected votes, given a change in the value of only one explan- atory variable. For example, the incumbency advantage is the difference in the expected vote in a district with an incumbent running and the expected vote in the same district at the same time when the incumbent's party decides to nominate the best available nonincum- bent willing to run (Gelman and King 1990). That is, under this thought experiment, everything is held con- stant up to the start of the general election campaign, at which point the incumbent either runs for reelection or does not.
The causal effect of incumbency status in multiparty democracies is, of course, somewhat more complicated than in two-party systems. The effect on the expected vote of, for example, a Conservative incumbent seeking reelection may be of a different magnitude than for an Alliance or Labour incumbent. Such a partisan differ- ential also would seem more likely in legislatures with more parties. In multiparty democracies, we might estimate the incumbency advantage averaged over the parties, but we prefer to estimate each separately in order to highlight several interesting substantive differ- ences in our data.
Computing a causal effect thus requires two sets of expected votes, one with an incumbent and the other without. To draw simulations of the causal effect of incumbency, we take the difference between a simula- tion of the expected vote when the incumbency status variable in Xp indicates (1) a particular party's incum- bent is running for reelection and (2) an open seat, with all other variables held constant at (say) their means. That is, we maximize the likelihood and then run the expected value algorithm twice, with a change only in the incumbency status variable.
We estimated the advantage due to three types of

A Statistical Model for Multiparty Electoral Data March 1999
FIGURE 6. Incumbency Advantage
Effect of Conservative lncumbent
59 64 66 70 74(F) 74(0) 79 83 87 92 S.E.
Effect of Labour lncumbent
-1.0 I C A
59 64 66 70 74(F) 74(0) 79 83 87 92 S.E.
Effect of Alliance lncumbent
59 64 66 70 74(F) . 7 4 0 79 83 87 92 S.E.
Note: The vertical distance of each arrow above the line indicates the advantage of running an incumbent, as compared to a nonincumbent, to the party indicated. The direction of the arrow shows from which of the other parties support is being drawn (as indicated by the ends of the standard error bars, at the right). Note that the scale, in percentage points for all three parties, is larger for the Alliance graph than for the other two.
changes in incumbency status-open seat to a Conser- vative incumbent, an open seat to a Labour incumbent, and an open seat to an Alliance incumbent-in each of the ten election years from 1959 to 1992. The addi- tional complication is that for one year, and for one type of incumbency effect, we need to record changes to all three vote variables. To display all this informa- tion succinctly, we have devised a new graphical dis- play. Figure 6 presents the raw results for each year and type of effect. The top panel shows the effect of a Conservative incumbent, and each arrow in the large left portion of this graphic is the change from an open seat-which we construct so that it begins at the point on the line at the year indicated-to where the ex- pected vote would be with a Conservative incumbent, as if each were part of a ternary diagram. Hence, the higher each arrow extends vertically (i.e., not the length of the arrow, although the two are obviously related), the larger is the incumbency advantage to the Conser- vatives. The left axis is in percentage points of incum- bency advantage.
The direction each arrow leans indicates from which party the Conservatives draw votes when they run an incumbent versus running another candidate in an open contest, with the vertices of the implicit ternary
diagram indicated around the standard errors at the right. (Note also that there is a standard error in each direction, indicated by the length of each of the stan- dard error arrows at the right.12) For example, the arrow for 1964 Alliance incumbents leans away from the bottom left, which means Alliance incumbents get electoral advantage by drawing votes disproportion- ately from Labour Party candidates (L in the standard error part of the graph on the right). (Arrows at angles between the extremes indicated on the standard error graph draw from a proportionate combination of the two other parties.) Thus, in the top panel, since all the arrows lean at least somewhat to the right, Conserva- tive incumbents derive their advantage by drawing more from the Alliance than from the Labour Party. To our knowledge, this type of effect has not been estimated in the elections literature of any country.
The most striking observation about Figure 6 is the unambiguous positive effect of incumbency, for all ten
12 Because the Alliance receives many fewer votes on average than the other parties, the maximum range of votes that could be drawn from the Alliance to form an incumbency advantage for any other party's incumbent is quite small. As a result, the Alliance standard errors in figures 6 and 7 are smaller than for the Conservatives or Labour.

American Political Science Review Vol. 93, No. 1
FIGURE 7. Average Incumbency Advantage
Conse wative
Average S.E.
Labour
Average S.E.
Average S.E.
Note: This figure gives the incumbency advantage averaged over all the years portrayed in Figure 6, for which the interpretation is analogous. Note the scale for the Alliance graph, which is larger than the others.
elections and all three parties over half a century of British politics. This is indicated by all 30 arrows pointing above the zero line. Most of the individual effects in Figure 6 are larger than their standard errors. When pooled, the average effects for each party's incumbent are from two to five times their standard errors, and hence by any relevant statistical standard they are clearly greater than zero.
Figure 7 gives these average effects for each party. (As always, the standard error of an average is smaller than the standard error of its independent component
parts.) The summary in Figure 7 indicates that the average incumbency effect is about half a percentage point for the Conservatives and twice that for Labour. In fact, in every one of the ten elections shown in Figure 6, the Labour incumbency effect is larger than the Conservative effect. Our interpretation of this disparity (which is necessarily more speculative than our results) is that Labour incumbents have a working- class constituency that benefits more from government services than Conservative voters. Incumbents have the discretion to influence the position of people on vari- ous types of lists for social services, such as to get into, or renovate, council housing. Conservative incumbents have fewer such opportunities to serve their relatively more wealthy constituents, so their incumbency advan- tage should not be as large.
Alliance incumbents receive an advantage of three percentage points (thrice the Labour advantage). This is less than the incumbency advantage af 8-9 percent- age points in the U.S. House of Representatives (Gelman and King 1990), but it is only slightly smaller than the average advantage in the House in the mid- 1960s or in most American state legislatures today (King 1991). This effect is in part because the counter- factual involved in an open seat versus an Alliance incumbent is much less likely in parts of Britain than the analogous counterfactual involved for estimating major party incumbency effects. An Alliance incum- bent implies that the major party hold on the political ' system has been broken, and voters take this cue to
reevaluate their votes. Expressed another way, the collective action problem of moderate voters who prefer the Alliance but do not want to waste their vote is solved with an Alliance incumbent in office. They have less reason to vote strategically ("tactically," as it is called in Britain) and instead cast their vote for their sincere preference. Much more than the major parties, the Alliance runs local, almost U.S.-style, candidate- centered campaigns (sometimes nominating well- known nonpolitical personalities), rather than national, party-oriented campaigns. The result, we believe, is the large Alliance incumbency advantage.
Taken together, our findings support the claims of the new quantitative literature on the existence of the incumbency effect in Britain, but the size of the effect for all three parties is substantially smaller than previ- ous biased methods had indicated. That is, our method is not biased and is also sufficiently powerful to be able to distinguish a small (but politically meaningful) effect from none at all. Our method is also able to discern distinctly different incumbency effects across the three parties.
There appears to be a hint in the top panel of Figure 6 that the Conservative incumbency advantage may be growing slightly, but formal statistical tests clearly reject this possible trend. Moreover, Labour or Alli- ance incumbency effects display no such apparent pattern. Thus, we find no support for the other claim of the new quantitative literature, which argues, against the conventional wisdom, that the incumbency advan- tage has been dramatically increasing in recent years.
When the Conservatives run an incumbent (as com-

A Statistical Model for Multiparty Electoral Data March 1999
pared to no incumbent running), they pull most of their extra incumbency advantage from the Alliance. As explained, this can be seen because the arrow in the first panel of Figure 7 and all ten arrows in the first panel of Figure 6 lean to the right-away from the "A" in the standard error diagram. Our interpretation of this clear result is that the Alliance is a transitional option for voters on the way to supporting one of the major parties; only 20% of voters stick with the Alli- ance for more than one election (Butler and Stokes 1969,315-38). Presumably because the Labour incum- bency advantage stems more from constituency service than does the Conservatives' advantage (and because there are usually as many Conservative voters who could benefit from a Labour member's constituency services as there are voters for the much smaller Alliance who could benefit), Labour incumbents pull approximately equally from the Conservatives and the Alliance (see Cain, Ferejohn, and Fiorina, 1987).l3
CONCLUQING REMARKS Our results may help resolve an ongoing debate in the British elections literature. The conventional position is that incumbency has never been an advantage. In contrast, a newer literature holds that incumbency advantage is moderate to large and is growing. With our approach, we find that both sides are right to an extent. That is, the incumbency advantage in England is small but meaningfully above zero. There is no evidence, however, that it is trending in any direction. In addition, our model detects important differences among the parties, with the incumbency advantage for Labour being about twice that for the Conservatives, and the advantage for the Alliance triple that of Labour.
We have developed and presented our statistical model for three parties and applied it to the British electoral system. The model and estimation procedures are all directly applicable to electoral systems with any number of parties. Further research will be necessary to implement the more general version of our model. Our analytical approach, while much faster for three parties, does not scale up as well as a more general MCMC approach. Our experiments with MCMC ap- plied to this problem convince us that it will scale fairly well. Priors may be needed, given the large number of parameters relative to a smaller number of districts, but there is substantial information in multiparty elec- toral systems that would be extraordinarily valuable to researchers in comparative politics, so this extension seems well worth the effort. Our graphical displays obviously do not generalize directly to more than four parties, but with judicious use of color, shading, and
l3 The Alliance does not predictably draw more from either major party. There is one other feature of the last panel of Figure 6, however, that may reflect a systematic pattern: Alliance incumbency advantage was drawn almost exclusively from the Labour Party between 1959 and 1970, but this abruptly changed, and votes started to be drawn in different ways from Labour and the Conservatives over the subsequent six elections. Since this "pattern" is based on only four elections, further research is required before drawing firm substantive conclusions as to its cause.
perspective, we have found it possible to display results for up to eight parties, depending on how complicated and empirically clear the relationships are in the data.
Many opportunities for future research remain, three of which we note here. First, we can easily extend the interpretation of the model to include other quantities of interest, such as bias and responsiveness of the electoral system, which are important and controversial issues in Britain and elsewhere. This can be done by clearly defining the quantity to be computed and then making slight modifications of the algorithms described above.
Second, some two-party models of seats and votes have in recent incarnations included random effects terms, which are more highly modeled versions of what our empirical Bayes approach accomplishes for the multiparty case. These terms help keep the estimates reasonable even if certain types of explanatory vari- ables are not observed and included in the model. They are especially well suited to modelsn of legislatures, since the structure of the random effects model can reflect the panel structure of the data.
Finally, electoral systems vary considerably across countries. All but two countries have districts of some kind, and most elect legislators to more than one seat in a district. Modifications to fit all the different types of electoral systems will require some detailed work, but these should be achievable by straightforward extensions of the model presented here.
APPENDIX: THE LIKELIHOOD FUNCTION FOR PARTIALLY CONTESTED DISTRICTS
Districts with Two of Three Parties Contesting First consider elections in which the parties contesting in district i include Pi = ( 2 , 3). The effective votes for all three parties, Vil, Vi2, and Vi3, are unobserved. Nevertheless, our assumptions for less-than-fully contested elections intro- duced above imply that we have some information about these quantities. In particular, we know that Vil < min (Viz, Vi3) and therefore Yi, < min (0, Yi2) or, equivalently, Yl < 0 and Yl < Y2. Thus, the likelihood function for this case is as follows:
where F, is the cumulative distribution function of the (univariate) t ,
is the conditional mean of Yi2 given Yil, and
is the conditional variance. These conditional t distributions are analogous and mathematically similar to the more com-

American Political Science Review Vol. 93, No. 1
monly known conditional normals (see Liu 1994). The func- tion in equation 12 is easily calculated by one-dimensional numerical integration.
By a parallel logic, the likelihood function for district elections in which parties 1 and 3 contest is:
When parties 1 and 2 contest, but party 3 is missing, a slight computational difference occurs because Vi3 appears in the denominator of both Yil and Yi2. As a result, we know, by our assumption, that Vi3 < min (Vi,, ViJ, which translates into Yi, > 0 and Yi2 > 0. Hence:
where F, is the cumulative distribution function of (in this context) the bivariate t . To compute this function, we follow the standard procedure of applying one-dimensional numer- ical integration after factoring the joint t distribution into a marginal and conditional-directly analogous to equation 12.
Districts with One of Three Parties Contesting When only party 1 contests (and hence automatically wins), we have no information about Yi2, but we know that Yil > 0. We use this information to form the likelihood function:
Similarly, the likelihood function for the remaining two cases is
and
REFERENCES Aitchison, J. 1986. The Statistical Analysis of Compositional Data.
London: Chapman and Hall. Alvarez, R. Michael, and Jonathan Nagler. N.d. "When Politics and
Models Collide: Estimating Models of Multi-Party Elections." American Journal of Political Science. Forthcoming.
Bellucci, Paolo. 1984. "The Effect of Aggregate Economic Condi- tions on the Political Preferences of the Italian Electorate, 1953- 1979." European Journal of Political Research l2(4):387- 401.
Bellucci, Paolo. 1991. "Italian Economic Voting: A Deviant Case or Making a Better Theory?" In Economics and Politics: The Calculus of Support, ed. Helmut Norpoth, Michael S. Lewis-Beck, and Jean-Dominique Lafay. Ann Arbor: University of Michigan Press. Pp. 63-81.
Butler, David E., and Dennis Kavanagh. 1980. The British General Election of 1979. London: Macmillan.
Butler, David E., and Donald Stokes. 1969. Political Change in Britain: Forces Shaping Electoral Choice. New York: St. Martin's.
Cain, Bruce, John Ferejohn, and Morris Fiorina. 1987. The Personal Vote: Constituency Service and Electoral Independence. Cambridge: Harvard University Press.
Cornford, J. R., Dorling, D. F. L., and Tether, B. S. 1995. "Historical Precedent and British Electoral Prospects." Electoral Studies 14(2):123-42.
Cox, Gary, and Jonathan N. Katz. 1996. "Why Did the Incumbency Advantage in U.S. House Elections Grow?" American Journal of Political Science 40(2):478-97.
Curtice, John, and Michael Steed. 1980. "An Analysis of Voting." In The British General Election of 1979, ed. David E. Butler and Dennis Kavanagh. London: Macmillan. Pp. 390-431.
Curtice, John, and Michael Steed. 1983. "The Voting Analyzed." In The British General Election of 1983, ed. David E. Butler and Dennis Kavanagh. London: Macmillan. Pp. 333-73.
Dominguez, Jorge, and James McCann. 1996. Democratizing Mexico: Public Opinion and Electoral Choices. Baltimore, MD: Johns Hopkins University Press.
Frey, Bruno, and Fredrick Schneider. 1980. " ~ o ~ i l a r i t y Functions: The Case of the U.S. and West Germany. Models of Political Economy." In Models of Political Economy, ed. Paul Whiteley. London: Sage. Pp. 47-84.
Gelman, Andrew, John B. Carlin, Hal S. Stern, and Donald B. Rubin. 1995. Bayesian Data Analysis. New York: Chapman and Hall.
Gelman, Andrew, and Gary King. 1990. "Estimating Incumbency Advantage without Bias." American Journal of ~olitical Science 34(November):1142-64.
Gelman, Andrew, and Gary King. 1991. "Systemic Consequences of Incumbency Advantage in the U.S. House." American Journal of . Political Science 35(February):110-38.
Gelman, Andrew, and Gary King. 1994a. "Enhancing Democracy Through Legislative Redistricting." American Political Sctence Review 88(September):541-59.
Gelman, Andrew, and Gary King. 1994b. "A Unified Method of Evaluating Electoral Systems and Redistricting Plans." American Journal of Political Science 38(May):514-54.
Goodhart, C. A. E., and R. J. Bhansali. 1970. "Political Economy." Political Studies 18(1):43-106.
Horowitz, Donald L. 1985. Ethnic Groups in ConJEict. Berkeley: University of California Press.
Horowitz, Donald L. 1993. "Democracy in Divided Societies." Journal of Democracy 4(4):18-38.
Host, Viggon, and Martin Paldam. 1990. "An International Element in the Vote?" European Journal of Political Research 18(2):221-39.
Huckfeldt, Robert, and John Sprague. 1993. "Citizens, Contexts, and Politics." In Political Science: The State of the Discipline, II, ed. Ada Finifter. Washington, DC: American Political Science Association. Pp. 281-303.
Inoguchi, Takashi. 1980. "Economic Conditions and Mass Support in Japan, 1960-76." In Models of Political Economy, ed. Paul White- ley. London: Sage. Pp. 121-51.
Jaclunan, Simon. 1996. "Bayesian Tools for Social Scientists." Pre- sented at the annual meetings of the American Political Science Association, San Francisco.
Johnson, Norman Lloyd, and Samuel Kotz. 1972. Distributions in Statistics: Continuous Multivariate Distributions. New York: Wiley.
King, Gary. 1989a. "Representation Through Legislative Redistrict- ing: A Stochastic Model." American Journal of Political Science 33(November):787-824.
King, Gary. 1989b. Unifying Political Methodology: The Likelihood Theory of Statistical Inference. New York: Cambridge University Press.
King, Gary. 1990. "Electoral Responsiveness and Partisan Bias in Multiparty Democracies." Legislative Studies Quarterly 15(May): 159-81.
King, Gary. 1991. "Constituency Service and Incumbency Advan- tage." British Journal of Political Science 21(January):119-28.

A Statistical Model for Multiparty Electoral Data March 1999
King, Gary. 1997. A Solution to the Ecological Inference Problem: Reconstructing Individual Behavior jkom Aggregate Data. Princeton, NJ: Princeton University Press.
King, Gary, and Robert X. Browning. 1987. "Democratic Represen- tation and Partisan Bias in Congressional Elections." American Political Science Review 81(December):1251-73.
King, Gary, and Andrew Gelman. 1991. "Systemic Consequences of Incumbency Advantage in the US. House." American Journal of Political Science 35(February):110-38.
King, Gary, Robert 0. Keohane, and Sidney Verba. 1994. Designing Social Inquiry: Scienti3c Inference in Qualitative Research. Prince- ton, NJ: Princeton University Press.
King, Gary, Michael Tomz, and Jason Wittenberg. 1998. "Making the Most of Statistical Analyses: Improving Interpretation and Presentation." Presented at the annual meetings of the American Political Science Association, Washington, DC. http://ghg.Harvard. edu/preprints.shtml (February 10, 1999).
Lewis-Beck, Michael S. 1988. Economics and Elections: The Major Western Democracies. Ann Arbor: University of Michigan Press.
Lewis-Beck, Michael S., and Paolo Bellucci. 1982. "Economic Influ- ences on Legislative Elections in Multi-Party Systems: France and Italy." Political Behavior 4(1):93-107.
Liu, Chuanhai. 1994. "Statistical Analysis Using the Multivariate t Distribution," Ph.D. diss. Department of Statistics, Harvard Uni- versity.
Miller, A. H., and Ola Listhaug. 1985. "Economic Effects and the Voting in Norway." In Economic Conditions and Electoral Out- comes, ed. Michael S. Lewis-Beck and Heinz Eulau. New York: Agathon. Pp. 125-43.
Norton, Philip, and David Wood. 1990. "Constituency Service by Members of Parliament: Does It Contribute to a Personal Vote?" Parliamentary Affairs 43(April):196-208.
Offe, Claus. 1992. "Strong Causes, Weak Cures." East European Constitutional Review 1(1):21-3.
Paldam, Martin. 1986. "The Distribution of Election Results and the
Lewis-Beck, and Jean-Dominique Lafay. Ann Arbor: University of Michigan Press. Pp. 9-31.
Powell, G. B., and G. D. Whitten. 1993. "A Cross-National Analysis of Economic Voting: Taking Account of the Political Context." American Journal of Political Science 37(2):391-414.
Przeworski, Adam. 1991. Democracy and the Market. New York: Cambridge University Press.
Przeworski, Adam. 1996. "Public Support for Economic Reforms in Poland." Comparative Political Studies 29(5):520-43.
Rattinger, Hans. 1991. "Unemployment and Elections in West Germany." In The Economics of Politics: The Calculus of Support, ed. Helmut Norpoth, Michael S. Lewis-Beck, and Jean-Dominique Lafay. Ann Arbor: University of Michigan Press. Pp. 49-62.
Rosa, J.-J., and Daniel Amson. 1976. "Conditions Economiques et Elections." Revue Francaise de Science Politique 26(6):1101-19.
Slider, Darrell. 1994. "Political Tendencies in Russia's Regions: Evidence from the 1993 Parliamentary Elections." Slavic Review 53(3):711-32.
Stokes, S. C. 1996. "Economic Reform and Public Opinion in Peru, 1990-95." Comparative Political Studies 29(5):544-65.
Tanner, Martin A. 1997. Tools for Statistical Inference: Methods for the Exploration of Posterior Distributions and Likelihood Functions, 3d ed. New York: Springer-Verlag.
Tucker, Joshua. 1996. "The White Fear ~ ~ ~ o t h e s i s Meets Vladimir Zhironovsky: Ethnic Composition of Regions and Voting Patterns in the 1993 Russian Duma Elections." Presented at the annual meetings of the Northeastern Political Science Association, Bos- ton.
Upton, Graham J. G. 1989. "The Components of Voting Change in England, 1983-1987." Electoral Studies 8(1):59-74.
Upton, Graham J. G. 1994. "Picturing the 1992 British General Election." Journal of the Royal Statistical Society, Series A, General 157(Part 2):231-52.
White, Stephen, Richard Rose, and Ian McAllister. 1997. How Russia Votes. Chatham. NJ: Chatham House.
Two Explanations of the Cost of Ruling." Europaische Zeitschvift . Whiteley, Paul. 1980. "Politico-Econometric Estimation in Britain: fur Politische OkonomielEuropean Journal of Political Economy An Alternative Explanation." In Models of Political Economy, ed. 2(1):5-24. Paul Whiteley. London: Sage. Pp. 85-100.
Paldam, Martin. 1991. "How Robust Is the Vote Function?: A Study Wood, David, and Philip Norton. 1992. "Do Candidates Matter? of Seventeen Nations over Four Decades." In The Economics of Constituency-Specific Vote Changes for Incumbent MPs, 1983- Politics: The Calculus of Support, ed. Helmut Norpoth, Michael S. 1987." Political Studies 40(June):227-38.