A statistical investigation of biodiesel physical and chemical
50
A statistical investigation of biodiesel physical and chemical properties, and their correlation with the degree of unsaturation Evangelos G. Giakoumis Internal Combustion Engines Laboratory, Thermal Engineering Department, School of Mechanical Engineering, National Technical University of Athens, Athens, Greece Published in “Renewable Energy”, Vol. 50, pp. 858-878, 2013 doi: 10.1016/j.renene.2012.07.040 ABSTRACT In the present work, a detailed statistical investigation is conducted in order to a) assess the average values of all properties (incl. fatty acid composition) of the most investigated biodiesels and b) quantify the effects of feedstock unsaturation on the physical and chemical properties of the derived methyl ester. To this aim, the available literature on biodiesel properties and fatty acid composition was gathered (more than 750 papers published in international Journals and Conferences), and the reported measurements are statistically analyzed with respect to the feedstock and its chemical composition and structure; in total, 26 different biodiesel feedstocks are studied, comprising of twenty-two edible and non-edible vegetable oils and four animal fats. From the analysis, collective results and statistical data are derived for each property that are then compared with the European and American specifications. The effects of unsaturation are investigated with separate best-fit linear curves provided for each interesting property with respect to the average number of double bonds. The various trends observed are discussed and explained based on fundamental aspects of fuel chemistry and on the consequences they have on real engine operation. Keywords: Biodiesel; Fatty acid composition; Degree of unsaturation; Statistical analysis; Properties Tel.: +30 210 772 1360; fax: +30 210 772 1343. E-mail address: [email protected] (E.G. Giakoumis)
Transcript of A statistical investigation of biodiesel physical and chemical
A statistical investigation of biodiesel physical and
chemical properties, and their correlation with the
degree of unsaturation
Evangelos G. Giakoumis
Internal Combustion Engines Laboratory, Thermal Engineering Department,
School of Mechanical Engineering, National Technical University of Athens, Athens, Greece
Published in “Renewable Energy”, Vol. 50, pp. 858-878, 2013
doi: 10.1016/j.renene.2012.07.040
ABSTRACT
In the present work, a detailed statistical investigation is conducted in order to a) assess
the average values of all properties (incl. fatty acid composition) of the most investigated
biodiesels and b) quantify the effects of feedstock unsaturation on the physical and
chemical properties of the derived methyl ester. To this aim, the available literature on
biodiesel properties and fatty acid composition was gathered (more than 750 papers
published in international Journals and Conferences), and the reported measurements are
statistically analyzed with respect to the feedstock and its chemical composition and
structure; in total, 26 different biodiesel feedstocks are studied, comprising of twenty-two
edible and non-edible vegetable oils and four animal fats. From the analysis, collective
results and statistical data are derived for each property that are then compared with the
European and American specifications. The effects of unsaturation are investigated with
separate best-fit linear curves provided for each interesting property with respect to the
average number of double bonds. The various trends observed are discussed and
explained based on fundamental aspects of fuel chemistry and on the consequences they
have on real engine operation.
Keywords: Biodiesel; Fatty acid composition; Degree of unsaturation; Statistical analysis;
Properties
Tel.: +30 210 772 1360; fax: +30 210 772 1343. E-mail address: [email protected] (E.G. Giakoumis)
2
1. Introduction
Biofuels made from agricultural products reduce the dependence on oil imports and
support local agricultural industries, while offering serious benefits in terms of
sustainability, reduced pollutant and greenhouse gas emissions, and increased energy
diversity and economic security [1]. Among the biofuels currently in use or under
consideration, biodiesel (methyl or ethyl ester) is considered as a very promising fuel for
the transportation sector since it possesses similar properties with diesel fuel, it can be
blended with diesel practically at any proportion and can be used without changes in the
existing distribution infrastructure.
The major biodiesel advantage relative to diesel fuel is its renewability. Life-cycle
analyses have shown that the source-to-wheel CO2 emissions from neat biodiesel
combustion account for at least 60% savings with respect to petroleum diesel fuel,
whereas for the most popular B20 blend it is of the order of 15−20% [2,3]. To this aim, the
European Parliament has passed Directive 2009/28/EC [4] on the promotion of the use of
energy from renewable sources that contains a specific mandate for Member States to
include 10% (by energy content) of renewable fuel in the transport sector by 2020. In
parallel in the US, the Energy Independence and Security Act of 2007 (EISA) increased
four-fold the volume of renewable fuel required to be blended into transportation fuel, from
34 billion liters in 2008 to 136 billion liters by 2022.
Nonetheless, although the renewability of biodiesel is an extremely hopeful fact in
view of the increasing global warming contribution from the transportation sector, other
issues should not be ignored such as food prices and biodiversity. Not surprisingly,
concerns over the latter issues have sparked the research on second-generation
biodiesels (and biofuels in general) from non-edible sources such as jatropha, castor or
microalgae [5–7].
Biodiesel is produced by transesterification of vegetable oils, animal fats or recycled
cooking oils, and consists of long-chain alkyl esters, which contain two oxygen atoms per
molecule [8–11]. The reversible reaction proceeds with a catalyst (usually KOH or NaOH)
or even without catalyst by using primary or secondary monohydric aliphatic alcohols; the
glycerol-based tri-esters that make up the fats and oils are converted into mono-esters
yielding free glycerol as a byproduct:
Triglycerides + Monohydric alcohol Mono-alkyl esters + Glycerol

3
The more widely used biodiesels are rapeseed methyl ester (RME) in Europe and
soybean methyl ester or methyl soyate (SME) in the US, but there are many other popular
feedstocks such as palm (PME, particularly in Asia), sunflower, cottonseed, yellow grease
and tallow methyl esters. These are collectively known as fatty acid methyl esters (FAME),
since methanol is primarily employed in the transesterification process due to its low cost
compared with the other alcohols. It is well established today that biodiesel-blended fuels
succeed to a large extent in reducing the amount of emitted PM or the smokiness from
diesel engines. In general, similar positive effects have been noticed as regards HC and
CO emissions (although contradicting results have been reported too, particularly if
measurements after the diesel oxidation catalyst are considered), whereas a usually
moderately negative impact is experienced with regard to NOx [2,8,12]. Other notable
advantages of FAMEs over their mineral diesel counterpart are their biodegradability,
safer storage due to higher flash point, better lubricity and low toxicity.
One of the peculiarities of biodiesel with respect to other biofuels is the fact that it
can be produced from a variety of feedstocks. Since each originating oil or fat is
characterized by different (fatty acid) composition, it is not surprising that the properties of
the final ester will differ substantially from place to place, based largely on the feedstock
used but also on the alcohol employed in the esterification and the exact chemical process
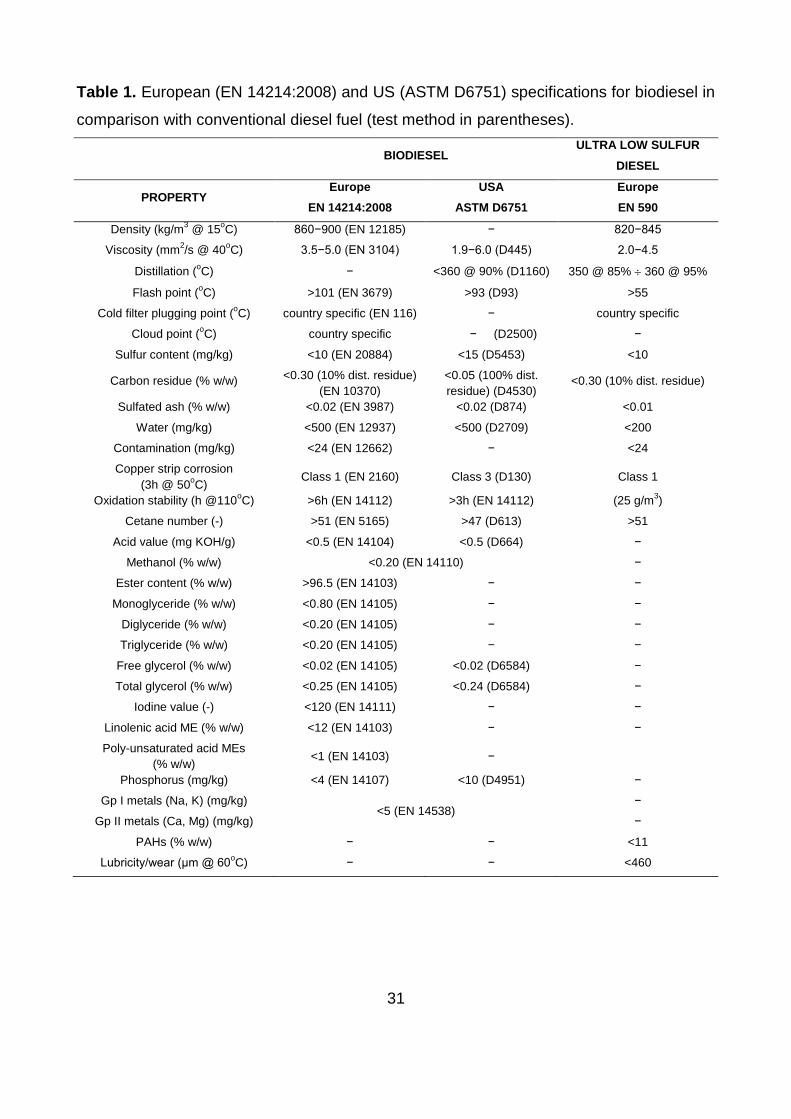
followed [13]. To this aim, both the European Union (EU) and the US have issued
specifications that should be met by the methyl esters intended for use in compression
ignition engines; Table 1 summarizes these acceptable limits in comparison to their
conventional diesel oil ones. With respect to these specifications, the major technical
problems associated with the use of biodiesel as a fuel for diesel engines, apart for the
higher production cost (largely owing to the high cost of the feedstock), are its
susceptibility to oxidation as well as its poor low-temperature properties, requiring
additives in the form of anti-oxidants and cold-flow improvers.
Past research, either in the form of experimental/simulation [e.g. 14–18], or statistical
[19] investigations, has highlighted some important aspects regarding the inter-
dependence between biodiesel composition and (some of) its physical and chemical
properties. The target of the present work is to expand on these analyses as regards a)
the sample of biodiesel feedstocks taken under consideration, b) the number of the
investigated methyl ester properties, and c) the amount of studies reviewed. To this aim
our intent was to gather the biodiesel physical and chemical properties and the respective
4
feedstocks‟ fatty acid compositions from the largest amount of studies possible and for the
widest range of feedstocks so far, and to analyze them statistically in order to:
Assess the average fatty acid composition of each originating biodiesel
feedstock,
Evaluate the basic statistical values of each property, and compare these values
to the European and US specifications for each methyl ester, and
Correlate the most important methyl ester properties with the degree of
unsaturation of the feedstocks in order to provide possible best-fit relations
useful for simulations by researchers and long-term planning by administrations
and international institutions.
2. Methodology
In order to analyze statistically the physical and chemical properties of biodiesel from
various feedstocks, a huge amount of data was carefully collected from papers published
in international Journals, Conferences and reports issued by renowned research centers.
Practically, the whole electronic databases of Elsevier, American Chemical Society, SAGE
Publishing, Taylor and Francis, Wiley International, IEEE and Springer were „scanned‟ for
interesting papers, with a noteworthy amount of datasets contributed from papers
presented in SAE International, ASABE and various other indexed Conferences around
the world. All in all, the total number of collected papers used in the statistical investigation
was more than 750, all published during the last three decades, (mostly during the last
decade), and comprising more than 30 different biodiesel feedstocks.
Fig. 1 demonstrates the absolute number (upper sub-diagram) and the percentage
(lower sub-diagram) of the various biodiesel datasets included in the current analysis
classified with respect to the originating feedstock. In the end, 26 feedstocks were chosen
for the statistical investigation, namely four animal fats (beef tallow, chicken, lard and fish),
twenty-one oils derived from various plants (canola, castor, coconut, corn (maize),
cottonseed, croton, hazelnut, karanja (honge), jatropha, linseed (flax), mahua, neem,
olive, palm, peanut, rapeseed, rice bran, rubber seed, safflower, soybean and sunflower),
as well as waste cooking oil. These 26 feedstocks eventually provided 945 different data
series of biodiesel properties and 700 data series of fatty acid compositions. On the
5
whole, the dataset contains a good mix of American, European and Asian animal or
vegetable feedstocks, with both edible and non-edible oils included.
From Fig. 1 it is made obvious that the most popular feedstock is soy, which
comprises almost one fifth (18.1%) of the investigations worldwide. This is most probably
due to its relatively low cost, since the corresponding yield falls short (sometimes by a lot)
to other feedstocks such as palm, coconut, jatropha or castor [20]. It is also interesting
that SME has been investigated practically worldwide (although the majority of the
research has been conducted in America) and with a continuous interest over the last
three decades. Rapeseed and the closely related canola (10.4+3.1=13.5%) are the next
most common feedstocks, with a considerable interest also found in palm (7.8%), the non-
edible jatropha (6.9%; mainly during the last years in India), waste cooking (9.5%) and
sunflower (5.6%). On the other hand, the cumulative percentage of all animal fats
(including fish) is of the order of 8.1%, with the majority of the research (50%) focused on
beef tallow. The non-edible karanja with 3.8% (primarily during the last few years),
cottonseed with 3.1% (more popular in the Mediterranean countries), as well as castor
(3.3%), rice bran (2.5%), coconut (2.4%), corn (used for ethanol production too − 2.0%),
linseed (1.9%), safflower (1.8%) and mahua and neem (each 1.5%) comprise smaller but
still important shares of the worldwide biodiesel research. Various other feedstocks such
as polanga (calophyllum inophyllum), grape seed, tobacco seed, jojoba (simmondsia
chinensis), chinese pistache (pistachio chinensis), hemp (cannabis sativa), babassu
(orbignya oleifera), sesame (sesamum indicum) and mustard, classified as „other‟ in Fig.
1, were not included in the statistical analysis that follows since it was not possible to
gather at least five different data series of their respective biodiesel properties.
During the data collection, particular effort was paid to avoid duplicate entries, and in
general, to only include data from those researchers who actually measured themselves
the values reported, following the internationally accepted experimental standards.
Although the initial intent was to include all property values found, it was inevitable that
some markedly „extreme‟ data should ultimately be excluded from the database. For
example, if the majority of the researchers had measured the density of a specific FAME
to range from 860 to 880 kg/m3 and one particular researcher had reported a value of 840
or 910 kg/m3, then this value was excluded from the database. If, however, more than 2
different researchers confirmed such extreme values, then these were retained in the
database, and this is ultimately reflected in the corresponding high values of the derived

6
standard deviations. Moreover, and this is primarily valid for density and viscosity, some
researchers did not provide data for these two properties at the universally requested
temperatures of 15 and 40oC respectively; these values too were excluded from the
analysis. Since many of the biodiesel properties depend apart from the originating oil, also
on the alcohol used in the transesterification process (e.g. the iodine value, with ethyl
esters having lower iodine values than methyl esters of the same fat or oil), only methyl
ester (and not ethyl ester) property values are included in the analysis that follows.
In total, 39 different biodiesel properties were registered during the data collection
process, namely kinematic viscosity; density; cetane number; lower and higher heating
values; iodine number; flash point; cold flow properties (pour, cloud and CFP point);
weight percentage and number of atoms of carbon, hydrogen and oxygen; acid value;
oxidation stability; weight content of sulfur, carbon residue, ash, water, methanol, ester;
distillation temperatures (initial, 10%, 50%, 90% and final); molecular weight;
stoichiometric air-fuel ratio; boiling point; surface tension; heat of evaporation; amount of
mono-, di-, tri-glycerides; free and total glycerol. The most investigated properties were
found to be: viscosity (680 observations), density (663), cetane number (474), flash point
(445), cloud point (315), sulfur content (294), higher heating value (291), acid value (275),
pour point (265), lower heating value (257), iodine number (195) and cold filter plugging
point (188).
3. Results and discussion
3.1. Overall results
The chemical composition of biodiesel is dependent upon the length and degree of
unsaturation of the fatty acid alkyl chains. With few exceptions (e.g. fish oil), the carboxylic
(fatty) acids are all straight-chain compounds ranging in size from 8−20 carbons. Acids
may be saturated (cannot chemically add hydrogen), which means that they contain only
single bonds, or unsaturated (can be hydrogenated), which means that they contain at
least one double bond. For each double bond, one hydrogen molecule can be added per
fatty acid [3,8]. Tables 2a and 2b summarize the average values and standard deviations
of the fatty acid composition from all analyzed vegetable oils (Table 2a) and animal fats
7
(Table 2b); the number of observations used are also provided in the last column. Further,
Figs 2 and 3 graphically illustrate the most important values from Table 2.
The most obvious comment regarding Tables 2a and 2b is the high standard
deviation observed for almost all the fatty acids that are found in the waste cooking oil.
This is not surprising since used cooking oil may originate from a large variety of
vegetable oils depending on the specific region of the research. Equally high are the
standard deviations noticed in fish oil, again owing to the variety of the originating
feedstock (salmon, mackerel, sardines etc). Similar observations were true for the initially
employed category „ground-animal fat‟, which was then split into three sub-categories,
beef tallow, chicken fat and lard. Some researchers did not specify the exact origin of the
animal fat used; these cases, although registered in the database, were not included in
the feedstock-based analysis that follows; for what is worth, the line „animal fat‟ in Table
2b includes all derived entries, i.e. beef tallow, chicken, lard and undefined. Despite this
stricter classification, tallow fat (popular in many countries worldwide) still exhibits rather
high variation in its fatty acid composition, indicative of the different animal breeding and
nutrition habits employed. Not surprisingly, the fatty acid composition of all three examined
ground-animal fats present similarities (in palmitic, oleic and linolenic acid composition),
with the one derived from chicken being richer in the unsaturated palmitoleic and linoleic
acids, and tallow richer in the saturated stearic acid. As regards the vegetable oils, it is the
sunflower that seems to be prone to variation in its composition (sunflower has been the
subject of research in many countries worldwide, hence the disparity in its oil composition
mirrors different soils, cultivations and growth conditions). On the other hand, the three
most intensely investigated feedstocks soybean, rapeseed and palm oil present the
highest cohesion in their fatty acid composition.
Although for the majority of the examined feedstocks the primary unsaturated acids
are oleic, linoleic and linolenic (Fig. 3), there are some noteworthy exceptions. For
example, castor is rich in the mono-unsaturated ricinoleic acid (contains hydroxyl), which
is responsible for the FAME‟s high viscosity and density. Fish, on the other hand, is rich in
poly-unsaturated acids of longer than 18 carbon atoms chain, comprising up to 6 double
bonds (Table 2b). Apart from castor, anther feedstock that is well known to differentiate as
regards its composition (and some of the corresponding biodiesel properties as will be
discussed later in the text) is coconut. The lower sub-diagram of Fig. 2 that illustrates the
weight percentage of the saturated fatty acids, reveals that coconut is almost 90%
8
saturated. The next highest values come from palm (49%), beef tallow (48%), mahua
(46%) and lard (41%). Interestingly, all three ground-animal fats have a degree of
saturation that is higher than the overall average value. On the other hand, the highest
percentages of mono-unsaturated fatty acids are noticed in castor (91%), hazelnut (80%),
olive oil (76%), rapeseed/canola (63–64%) and karanja (55%), whereas the highest
percentages of poly-unsaturated fatty acids are to be found in croton (83%), safflower
(75%), linseed (71%), sunflower (68%), soybean (60%), corn (58%), rubber seed (56%)
and cottonseed (55%). An even more detailed picture of the most important fatty acids
weight percentage in the 26 studied feedstocks (and mainly of the unsaturated ones) is
further demonstrated in Fig. 3. It can be observed that croton, corn, cottonseed, safflower,
soybean and sunflower are primarily rich in linoleic (18:2) acid, whereas linseed and
rubber seed, and to a lesser extent rapeseed and canola, in linolenic (18:3). Consistent
with the remarks made earlier, fish oil is the only one of the 26 studied feedstocks that is
rich in poly-unsaturated acids of 20, 21 and 22 carbon atoms chains.
Finally, Table 3 summarizes, and Fig. 4 graphically illustrates, the most important
physical and chemical properties of all biodiesels investigated. As mentioned earlier, 39
properties were registered in total. Since many of them, however, depend on the
transesterification reaction rather than the feedstock itself (e.g. amount of mono-, di-, tri-
glycerides, free and total glycerol, carbon content, moisture, ash content, ester content
etc), only the most important feedstock-related ones, for which a relatively large number of
entries was available are summarized in Table 3 and depicted in Fig. 4. Standard
deviations are also designated graphically in Fig. 4 highlighting the high, in some cases,
disparity in the reported results owing to differentiations in the composition of the parent
oil, the purity of the final ester and sometimes also in the measuring procedure. These
properties will be discussed in more detail in the next section with respect to the
unsaturation level of the originating feedstock. In Fig. 4, the respective European and US
specification limits are also provided in order to initially assess those feedstocks that seem
to fall outside the acceptable range.
3.2. Unsaturation effects
A very influencing parameter of biodiesel (feedstock) is its degree of unsaturation,
with a usual measure being the iodine number. Table 4 elaborates on the degree of
9
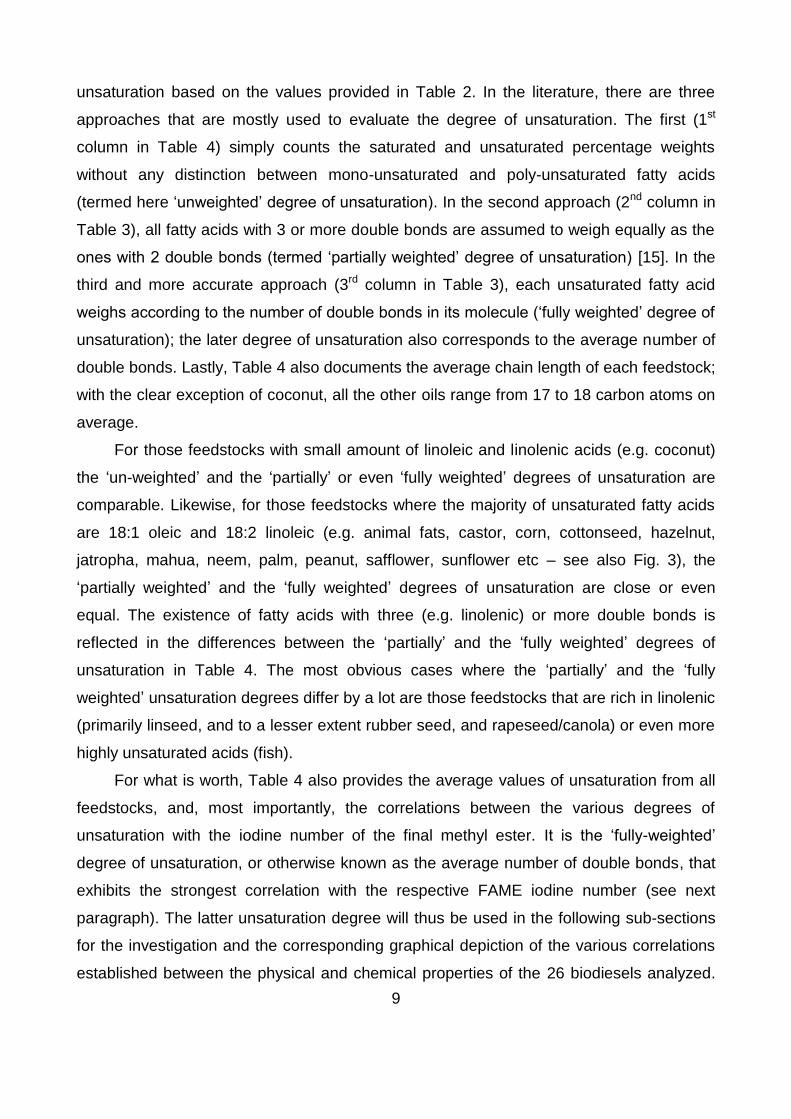
unsaturation based on the values provided in Table 2. In the literature, there are three
approaches that are mostly used to evaluate the degree of unsaturation. The first (1st
column in Table 4) simply counts the saturated and unsaturated percentage weights
without any distinction between mono-unsaturated and poly-unsaturated fatty acids
(termed here „unweighted‟ degree of unsaturation). In the second approach (2nd column in
Table 3), all fatty acids with 3 or more double bonds are assumed to weigh equally as the
ones with 2 double bonds (termed „partially weighted‟ degree of unsaturation) [15]. In the
third and more accurate approach (3rd column in Table 3), each unsaturated fatty acid
weighs according to the number of double bonds in its molecule („fully weighted‟ degree of
unsaturation); the later degree of unsaturation also corresponds to the average number of
double bonds. Lastly, Table 4 also documents the average chain length of each feedstock;
with the clear exception of coconut, all the other oils range from 17 to 18 carbon atoms on
average.
For those feedstocks with small amount of linoleic and linolenic acids (e.g. coconut)
the „un-weighted‟ and the „partially‟ or even „fully weighted‟ degrees of unsaturation are
comparable. Likewise, for those feedstocks where the majority of unsaturated fatty acids
are 18:1 oleic and 18:2 linoleic (e.g. animal fats, castor, corn, cottonseed, hazelnut,
jatropha, mahua, neem, palm, peanut, safflower, sunflower etc – see also Fig. 3), the
„partially weighted‟ and the „fully weighted‟ degrees of unsaturation are close or even
equal. The existence of fatty acids with three (e.g. linolenic) or more double bonds is
reflected in the differences between the „partially‟ and the „fully weighted‟ degrees of
unsaturation in Table 4. The most obvious cases where the „partially‟ and the „fully
weighted‟ unsaturation degrees differ by a lot are those feedstocks that are rich in linolenic
(primarily linseed, and to a lesser extent rubber seed, and rapeseed/canola) or even more
highly unsaturated acids (fish).
For what is worth, Table 4 also provides the average values of unsaturation from all
feedstocks, and, most importantly, the correlations between the various degrees of
unsaturation with the iodine number of the final methyl ester. It is the „fully-weighted‟
degree of unsaturation, or otherwise known as the average number of double bonds, that
exhibits the strongest correlation with the respective FAME iodine number (see next
paragraph). The latter unsaturation degree will thus be used in the following sub-sections
for the investigation and the corresponding graphical depiction of the various correlations
established between the physical and chemical properties of the 26 biodiesels analyzed.

10
To this aim, the results presented in Table 5 will also contribute; in this table, the Pearson
correlation coefficients are demonstrated that were found to be valid for the inter-
dependence between the various examined properties.
3.2.1. Iodine value
The iodine number (IN, or iodine value IV) is a parameter used to determine the
degree of unsaturation in a vegetable oil or animal fat. This number indicates the mass of
iodine (I2) in grams that is necessary to completely saturate, by means of a stoichiometric
reaction, the molecules of 100g of a given oil [21]. The (average) iodine values of the
examined feedstocks range from 7.8 (for the most saturated ME, coconut) to 184.5 (for the
most unsaturated one, linseed), with an overall average value of 98.4. There is no
specification in the US for the IN, but European specifications require that biodiesels used
in compression ignition engines have a (rather low) maximum value of IN of the order of
120. The idea behind this specification is that high fuel iodine values indicate propensity
for polymerization resulting in deposit formation [8]. This means that many of the
investigated FAMEs have to be excluded from use in pure form in Europe, namely croton,
fish, linseed, rubber seed and safflower, whereas corn, soybean and sunflower are only
marginally accepted (see Fig. 4); moreover, the most popular in Europe rapeseed ME,
having an average IV of 112, is actually quite close to the specification limit.
As it is illustrated in Fig. 5, there exists a very strong correlation between IN and
unsaturation degree, confirming the results of previous research on smaller samples
[14,15,19]; in fact, it is the 3 „extreme‟ feedstocks (the most saturated, coconut, and the
most unsaturated, fish and linseed) that only differentiate from the almost perfect linear
relationship between average number of double bonds and IN. The respective linear best-
fit relation is also provided inside this figure. High INs have been also linked with storage
stability problems [16], a fact however, that could not be confirmed by the present
statistical investigation, at least partly owing to the great disparity of the reported oxidation
stability values between the various researchers (Table 3 and Section 3.2.10).
3.2.2. Cetane number
One of the most influential properties of the diesel fuel is the dimensionless cetane
number (CN), which represents the ignitability of the fuel, particularly critical during cold
starting conditions. Low cetane numbers lead to long ignition delay, i.e. long time between
fuel injection and start of combustion. Consequently, the lower the CN the more abrupt the
11
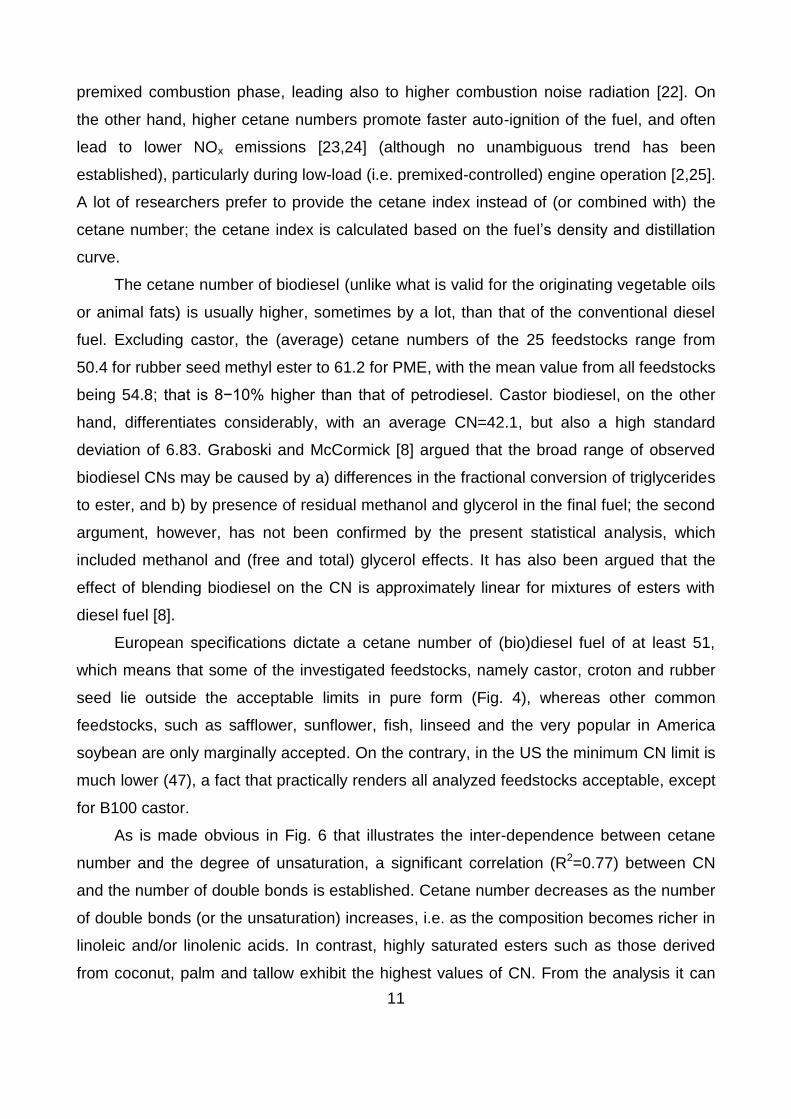
premixed combustion phase, leading also to higher combustion noise radiation [22]. On
the other hand, higher cetane numbers promote faster auto-ignition of the fuel, and often
lead to lower NOx emissions [23,24] (although no unambiguous trend has been
established), particularly during low-load (i.e. premixed-controlled) engine operation [2,25].
A lot of researchers prefer to provide the cetane index instead of (or combined with) the
cetane number; the cetane index is calculated based on the fuel‟s density and distillation
curve.
The cetane number of biodiesel (unlike what is valid for the originating vegetable oils
or animal fats) is usually higher, sometimes by a lot, than that of the conventional diesel
fuel. Excluding castor, the (average) cetane numbers of the 25 feedstocks range from
50.4 for rubber seed methyl ester to 61.2 for PME, with the mean value from all feedstocks
being 54.8; that is 8−10% higher than that of petrodiesel. Castor biodiesel, on the other
hand, differentiates considerably, with an average CN=42.1, but also a high standard
deviation of 6.83. Graboski and McCormick [8] argued that the broad range of observed
biodiesel CNs may be caused by a) differences in the fractional conversion of triglycerides
to ester, and b) by presence of residual methanol and glycerol in the final fuel; the second
argument, however, has not been confirmed by the present statistical analysis, which
included methanol and (free and total) glycerol effects. It has also been argued that the
effect of blending biodiesel on the CN is approximately linear for mixtures of esters with
diesel fuel [8].
European specifications dictate a cetane number of (bio)diesel fuel of at least 51,
which means that some of the investigated feedstocks, namely castor, croton and rubber
seed lie outside the acceptable limits in pure form (Fig. 4), whereas other common
feedstocks, such as safflower, sunflower, fish, linseed and the very popular in America
soybean are only marginally accepted. On the contrary, in the US the minimum CN limit is
much lower (47), a fact that practically renders all analyzed feedstocks acceptable, except
for B100 castor.
As is made obvious in Fig. 6 that illustrates the inter-dependence between cetane
number and the degree of unsaturation, a significant correlation (R2=0.77) between CN
and the number of double bonds is established. Cetane number decreases as the number
of double bonds (or the unsaturation) increases, i.e. as the composition becomes richer in
linoleic and/or linolenic acids. In contrast, highly saturated esters such as those derived
from coconut, palm and tallow exhibit the highest values of CN. From the analysis it can
12
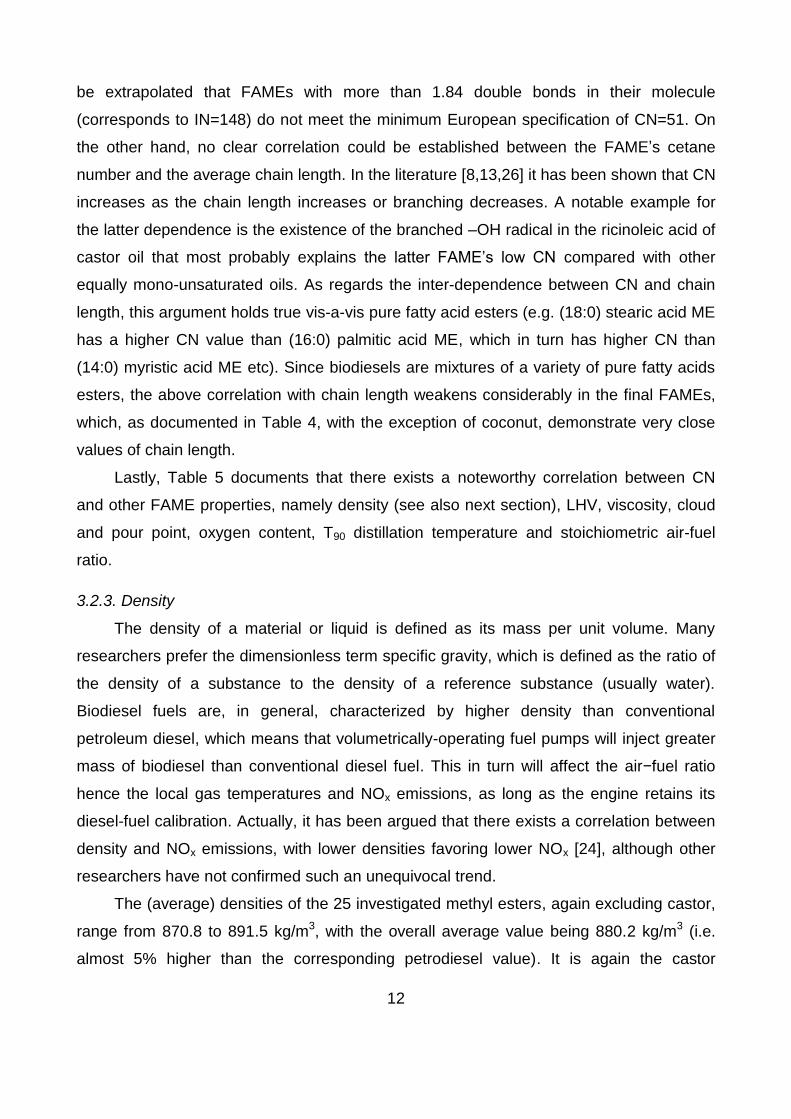
be extrapolated that FAMEs with more than 1.84 double bonds in their molecule
(corresponds to IN=148) do not meet the minimum European specification of CN=51. On
the other hand, no clear correlation could be established between the FAME‟s cetane
number and the average chain length. In the literature [8,13,26] it has been shown that CN
increases as the chain length increases or branching decreases. A notable example for
the latter dependence is the existence of the branched –OH radical in the ricinoleic acid of
castor oil that most probably explains the latter FAME‟s low CN compared with other
equally mono-unsaturated oils. As regards the inter-dependence between CN and chain
length, this argument holds true vis-a-vis pure fatty acid esters (e.g. (18:0) stearic acid ME
has a higher CN value than (16:0) palmitic acid ME, which in turn has higher CN than
(14:0) myristic acid ME etc). Since biodiesels are mixtures of a variety of pure fatty acids
esters, the above correlation with chain length weakens considerably in the final FAMEs,
which, as documented in Table 4, with the exception of coconut, demonstrate very close
values of chain length.
Lastly, Table 5 documents that there exists a noteworthy correlation between CN
and other FAME properties, namely density (see also next section), LHV, viscosity, cloud
and pour point, oxygen content, T90 distillation temperature and stoichiometric air-fuel
ratio.
3.2.3. Density
The density of a material or liquid is defined as its mass per unit volume. Many
researchers prefer the dimensionless term specific gravity, which is defined as the ratio of
the density of a substance to the density of a reference substance (usually water).
Biodiesel fuels are, in general, characterized by higher density than conventional
petroleum diesel, which means that volumetrically-operating fuel pumps will inject greater
mass of biodiesel than conventional diesel fuel. This in turn will affect the air−fuel ratio
hence the local gas temperatures and NOx emissions, as long as the engine retains its
diesel-fuel calibration. Actually, it has been argued that there exists a correlation between
density and NOx emissions, with lower densities favoring lower NOx [24], although other
researchers have not confirmed such an unequivocal trend.
The (average) densities of the 25 investigated methyl esters, again excluding castor,
range from 870.8 to 891.5 kg/m3, with the overall average value being 880.2 kg/m3 (i.e.
almost 5% higher than the corresponding petrodiesel value). It is again the castor

13
biodiesel that differentiates considerably from the other feedstocks, with an average
density of the order of 917.6 kg/m3. In the US, there is no specification for biodiesel
density; in the EU on the other hand, the acceptable range is quite wide (860–900 kg/m3),
and this is met by all examined methyl esters except for the pure castor biodiesel.
Fig. 7 demonstrates the strong correlation between density and the degree of
unsaturation, with a clearly high coefficient of determination (R2=0.86). Density increases
with the increase in the number of double bonds, which means that the more unsaturated
the originating oil, the higher the density of the derived methyl ester, and the greater the
fuel mass that will be injected if a diesel-tuned engine is run on biodiesel. This strong
correlation is maintained to a large extent (R2=0.58) even if we move from the average
values (Fig. 7) to the individual ones (Fig. 8) from all available pairs of density-IN in the
database (158 observations from 25 feedstocks). As was also the case with cetane
number, no correlation could be established between density and the FAME‟s average
chain length, even if the „extreme‟ values of coconut and castor are excluded [19]. The
correlation, however, between density and cetane number (R2=0.57) from all investigated
feedstocks is presented in Fig. 9, with higher densities imparting lower cetane numbers.
Moreover, and according to Table 5, a significant correlation is valid between density
and both heating values, viscosity, cloud and pour point, carbon content, T90 distillation
temperature and stoichiometric air-fuel ratio.
3.2.4. Heating value
The lower (LHV) and the higher (HHV) heating values are measures of a fuel‟s heat
of combustion, with the difference between them being the water‟s heat of vaporization.
Biodiesel contains on average 10−12% w/w oxygen, which leads to proportionally lower
energy density and heating value, thus more fuel needs to be injected in order to achieve
the same engine power output. It is rather well established today from the extensive
experimentation that the decrease in PM/smoke emissions with the use of biodiesel (or
from other biofuels such as alcohols) derives from the higher oxygen content of the
biofuel-diesel fuel blend that enhances the in-cylinder soot oxidation rate. The higher the
oxygen content, hence the lower the heating value, the higher the potential for PM
reduction [1–3]. On the other hand, the fact that greater mass of biodiesel needs to be
injected in order to achieve the same engine power as with conventional diesel fuel is
responsible for an increase in NOx emissions in EGR equipped engines/vehicles; the latter
14
engines rely on the mass flow signal in order to determine the appropriate EGR valve
position [27].
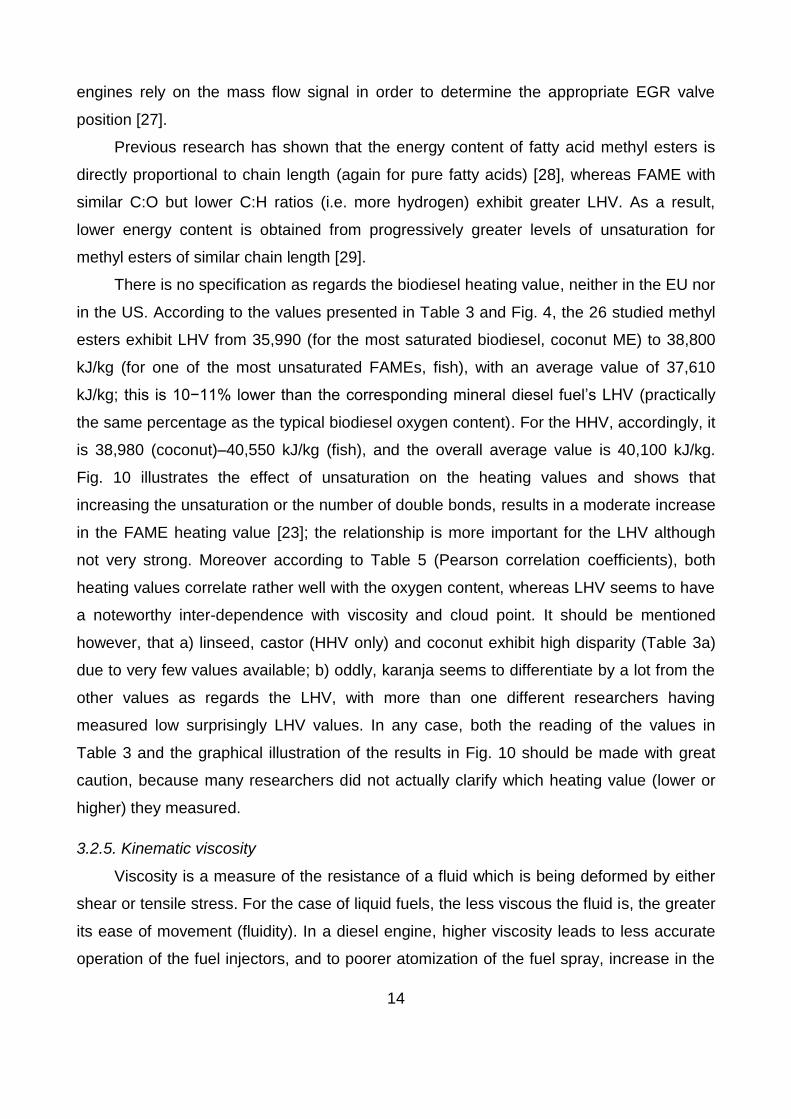
Previous research has shown that the energy content of fatty acid methyl esters is
directly proportional to chain length (again for pure fatty acids) [28], whereas FAME with
similar C:O but lower C:H ratios (i.e. more hydrogen) exhibit greater LHV. As a result,
lower energy content is obtained from progressively greater levels of unsaturation for
methyl esters of similar chain length [29].
There is no specification as regards the biodiesel heating value, neither in the EU nor
in the US. According to the values presented in Table 3 and Fig. 4, the 26 studied methyl
esters exhibit LHV from 35,990 (for the most saturated biodiesel, coconut ME) to 38,800
kJ/kg (for one of the most unsaturated FAMEs, fish), with an average value of 37,610
kJ/kg; this is 10−11% lower than the corresponding mineral diesel fuel‟s LHV (practically
the same percentage as the typical biodiesel oxygen content). For the HHV, accordingly, it
is 38,980 (coconut)–40,550 kJ/kg (fish), and the overall average value is 40,100 kJ/kg.
Fig. 10 illustrates the effect of unsaturation on the heating values and shows that
increasing the unsaturation or the number of double bonds, results in a moderate increase
in the FAME heating value [23]; the relationship is more important for the LHV although
not very strong. Moreover according to Table 5 (Pearson correlation coefficients), both
heating values correlate rather well with the oxygen content, whereas LHV seems to have
a noteworthy inter-dependence with viscosity and cloud point. It should be mentioned
however, that a) linseed, castor (HHV only) and coconut exhibit high disparity (Table 3a)
due to very few values available; b) oddly, karanja seems to differentiate by a lot from the
other values as regards the LHV, with more than one different researchers having
measured low surprisingly LHV values. In any case, both the reading of the values in
Table 3 and the graphical illustration of the results in Fig. 10 should be made with great
caution, because many researchers did not actually clarify which heating value (lower or
higher) they measured.
3.2.5. Kinematic viscosity
Viscosity is a measure of the resistance of a fluid which is being deformed by either
shear or tensile stress. For the case of liquid fuels, the less viscous the fluid is, the greater
its ease of movement (fluidity). In a diesel engine, higher viscosity leads to less accurate
operation of the fuel injectors, and to poorer atomization of the fuel spray, increase in the

15
Sauter mean diameter of the fuel droplets and of the jet break-up time; these inefficiencies
are exaggerated during cold starting. Moreover, the reduced fuel leakage losses in the
(mechanical) fuel pump owing to higher kinematic viscosity lead also to higher injection
pressures and, hence, mass of injected fuel [11].
Vegetable oils have high viscosity (one order of magnitude higher than the
acceptable diesel fuel values), which means that they cannot be used safely as fuels in a
compression ignition engine, at least not without prior heating (viscosity decreases
exponentially with increasing temperature), and only for relatively small blending ratios.
The transesterification process, on the other hand, reduces considerably the viscosity of
the FAME to levels comparable to (but still higher than) that of petrodiesel.
The (average) viscosity values of the 25 examined feedstocks, excluding castor,
range from 2.78 mm2/s (for the most saturated coconut ME; actually, this is the only one of
the investigated methyl esters with a kinematic viscosity very close to that of the mineral
diesel fuel) to 5.06 mm2/s (for mahua ME), with the mean value from all feedstocks being
4.55 mm2/s. European specifications dictate an acceptable biodiesel viscosity range
between 3.5 and 5 mm2/s, which means that it is the above mentioned two extremes (but
also marginally olive and karanja) that should be excluded in B100 form. In the US on the
contrary, the specified range is much wider (1.9–6 mm2/s), a fact that renders all 25
analyzed feedstocks acceptable. Apart from coconut, another ME whose viscosity
differentiates by a lot from the other feedstocks is castor. Castor biodiesel is rich in
ricinoleic acid (contains OH) that significantly increases the viscosity of the final ester. For
castor ME, the average kinematic viscosity from the reviewed studies was found to be
14.5 mm2/s, i.e. almost three times higher than that of the majority of the MEs reported in
Table 3 and Fig. 4.
As is made clear in Fig. 11 that illustrates the inter-dependence between kinematic
viscosity and the degree of unsaturation, a correlation exists (although not as strong as
those observed for CN or density) between kinematic viscosity and the average number of
double bonds. It should be pointed out that for the results depicted in Fig. 11, 24 methyl
esters have been taken under consideration (coconut and castor were excluded since
their values fall way beyond the ones from the other feedstocks). Confirming the results of
previous research [30], the higher the saturation of the FAME, the higher the
corresponding kinematic viscosity. If the feedstocks that present the highest disparity
(mahua, safflower, olive, karanja, rubber seed) are excluded, then for the remaining 19
16
feedstocks, a promising correlation exists too between viscosity and density (Fig. 12), at
least equally strong as the one between viscosity and unsaturation. Although the
existence of double bonds reduces viscosity, it has been argued that it is actually the cis
double bonds that are more responsible for lower viscosities than their trans counterparts
(the latter are usually found in used cooking oils) [31].
Viscosity is also known to increase with increasing chain length [18,32], whereas
branching seems to play a secondary role [31]. Although, the majority of the examined
MEs have a chain length between 17 and 18 carbon atoms (and they actually have
comparable viscosities as is illustrated in Fig. 11), coconut ME, which is the only biodiesel
that drastically differentiates as regards the number of carbon atoms (13.12),
unsurprisingly exhibits also the lowest viscosity.
Lastly, Table 5 documents that apart from IN and density, there exists a noteworthy
correlation between viscosity and CN, density, LHV, carbon content, T90 distillation
temperature and stoichiometric air-fuel ratio.
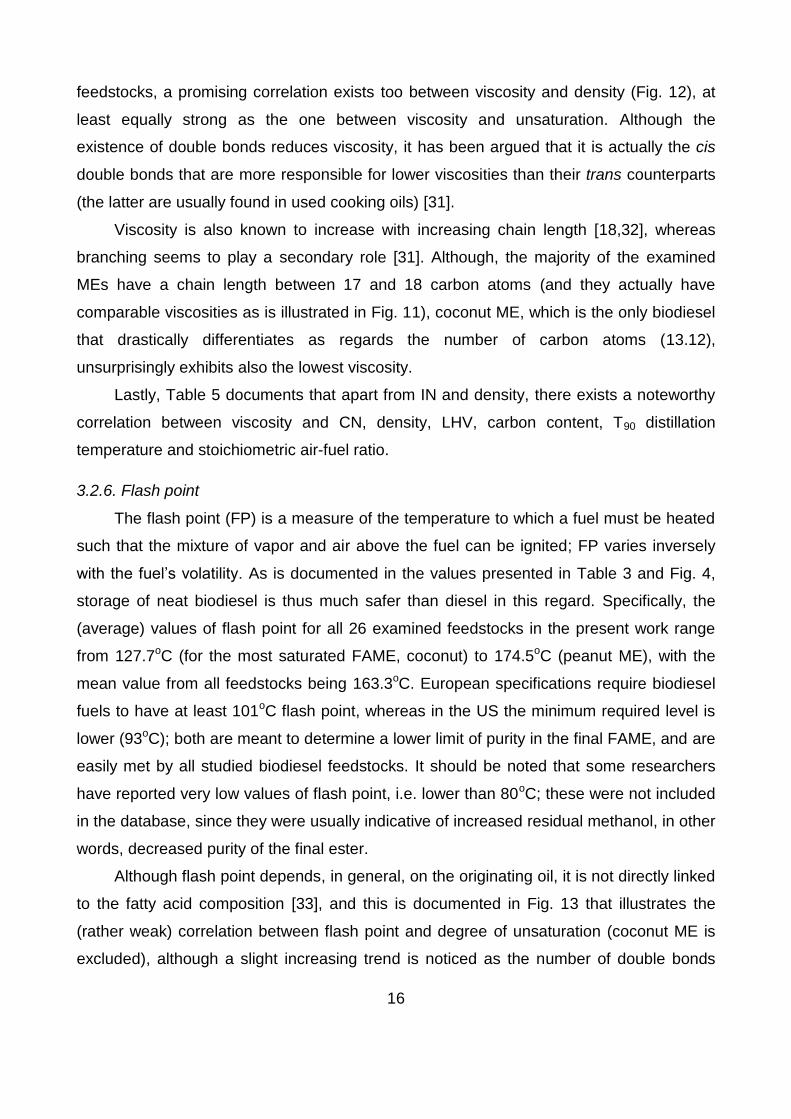
3.2.6. Flash point
The flash point (FP) is a measure of the temperature to which a fuel must be heated
such that the mixture of vapor and air above the fuel can be ignited; FP varies inversely
with the fuel‟s volatility. As is documented in the values presented in Table 3 and Fig. 4,
storage of neat biodiesel is thus much safer than diesel in this regard. Specifically, the
(average) values of flash point for all 26 examined feedstocks in the present work range
from 127.7oC (for the most saturated FAME, coconut) to 174.5oC (peanut ME), with the
mean value from all feedstocks being 163.3oC. European specifications require biodiesel
fuels to have at least 101oC flash point, whereas in the US the minimum required level is
lower (93oC); both are meant to determine a lower limit of purity in the final FAME, and are
easily met by all studied biodiesel feedstocks. It should be noted that some researchers
have reported very low values of flash point, i.e. lower than 80oC; these were not included
in the database, since they were usually indicative of increased residual methanol, in other
words, decreased purity of the final ester.
Although flash point depends, in general, on the originating oil, it is not directly linked
to the fatty acid composition [33], and this is documented in Fig. 13 that illustrates the
(rather weak) correlation between flash point and degree of unsaturation (coconut ME is
excluded), although a slight increasing trend is noticed as the number of double bonds

17
increases. Apart from coconut, it is the values from mahua, peanut and croton that
primarily seem to differentiate by a lot from the general trend. Closer examination of the
flash point standard deviations in Table 3 reveals that the disparity in the reported FP
values is high for the majority of the methyl esters studied (most probably owing to varying
methanol fluctuation in the final ester), and this seems to explain the weak correlation
demonstrated in Fig. 13. Moreover as is documented in Table 5, FP was not found to
correlate well with any other property.
3.2.7. Low-temperature flow properties
The key flow properties for winter fuel specification are cloud and pour point. Cloud
point (CP) is the temperature at which wax form a cloudy appearance. It is measured as
the temperature of first formation of wax as the fuel is cooled. Pour point (PP) is the lowest
temperature at which the fuel becomes semi solid and loses its flow characteristics being
no longer pumpable; hence it is a measure of the fuel gelling point. The pour point is
always lower than the cloud point. The cloud point is not generally affected by additives
called flow improvers. However, flow-improver additives can decrease the size, or inhibit
the formation, of the wax crystallites formed upon cooling the fuel, and thus lower the
temperature at which wax plugging becomes a problem [8]. Poor cold flow properties may
result in fuel line and pump blockage, ultimately leading to fuel starvation. These problems
are particularly enhanced during cold starting particularly at low ambient temperatures.
The two cold flow properties are highly inter-dependent, as is demonstrated in Fig. 14 that
depicts all 170 available pairs of CP and PP values in the database; if only the average
CP and PP values from the 26 biodiesels are taken under consideration, the correlation is
even higher (R2=0.90; Pearson correlation coefficient 0.92).
There are no European or US specifications for low temperature properties (each
country is free to determine its own limits according to local weather conditions), but it is
well known that biodiesel fuels suffer from cold flow properties way more (i.e. they are
higher) than mineral diesel fuel. The (average) values of CP for the 26 examined
feedstocks in the present work confirm this fact; they range from −15.1oC (castor ME;
however with 12.5oC standard deviation, which indicates contradicting results) to 13.8oC
(tallow ME), with the mean value from all feedstocks being 2.1oC (almost 20oC higher than
for conventional diesel fuel). For PP, it is −23.4oC (again castor ME; standard deviation
3.9oC) up to 11.8oC (palm ME), with an overall mean value of −2oC (more than 30oC
18
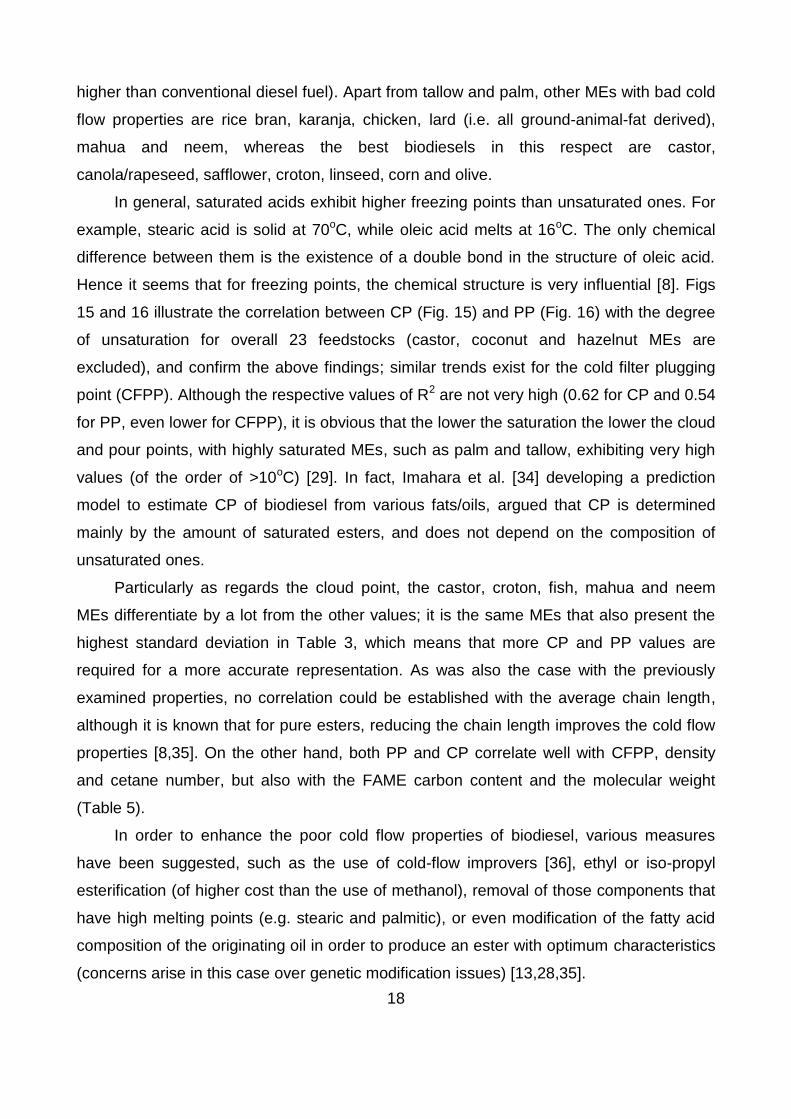
higher than conventional diesel fuel). Apart from tallow and palm, other MEs with bad cold
flow properties are rice bran, karanja, chicken, lard (i.e. all ground-animal-fat derived),
mahua and neem, whereas the best biodiesels in this respect are castor,
canola/rapeseed, safflower, croton, linseed, corn and olive.
In general, saturated acids exhibit higher freezing points than unsaturated ones. For
example, stearic acid is solid at 70oC, while oleic acid melts at 16oC. The only chemical
difference between them is the existence of a double bond in the structure of oleic acid.
Hence it seems that for freezing points, the chemical structure is very influential [8]. Figs
15 and 16 illustrate the correlation between CP (Fig. 15) and PP (Fig. 16) with the degree
of unsaturation for overall 23 feedstocks (castor, coconut and hazelnut MEs are
excluded), and confirm the above findings; similar trends exist for the cold filter plugging
point (CFPP). Although the respective values of R2 are not very high (0.62 for CP and 0.54
for PP, even lower for CFPP), it is obvious that the lower the saturation the lower the cloud
and pour points, with highly saturated MEs, such as palm and tallow, exhibiting very high
values (of the order of >10oC) [29]. In fact, Imahara et al. [34] developing a prediction
model to estimate CP of biodiesel from various fats/oils, argued that CP is determined
mainly by the amount of saturated esters, and does not depend on the composition of
unsaturated ones.
Particularly as regards the cloud point, the castor, croton, fish, mahua and neem
MEs differentiate by a lot from the other values; it is the same MEs that also present the
highest standard deviation in Table 3, which means that more CP and PP values are
required for a more accurate representation. As was also the case with the previously
examined properties, no correlation could be established with the average chain length,
although it is known that for pure esters, reducing the chain length improves the cold flow
properties [8,35]. On the other hand, both PP and CP correlate well with CFPP, density
and cetane number, but also with the FAME carbon content and the molecular weight
(Table 5).
In order to enhance the poor cold flow properties of biodiesel, various measures
have been suggested, such as the use of cold-flow improvers [36], ethyl or iso-propyl
esterification (of higher cost than the use of methanol), removal of those components that
have high melting points (e.g. stearic and palmitic), or even modification of the fatty acid
composition of the originating oil in order to produce an ester with optimum characteristics
(concerns arise in this case over genetic modification issues) [13,28,35].
19
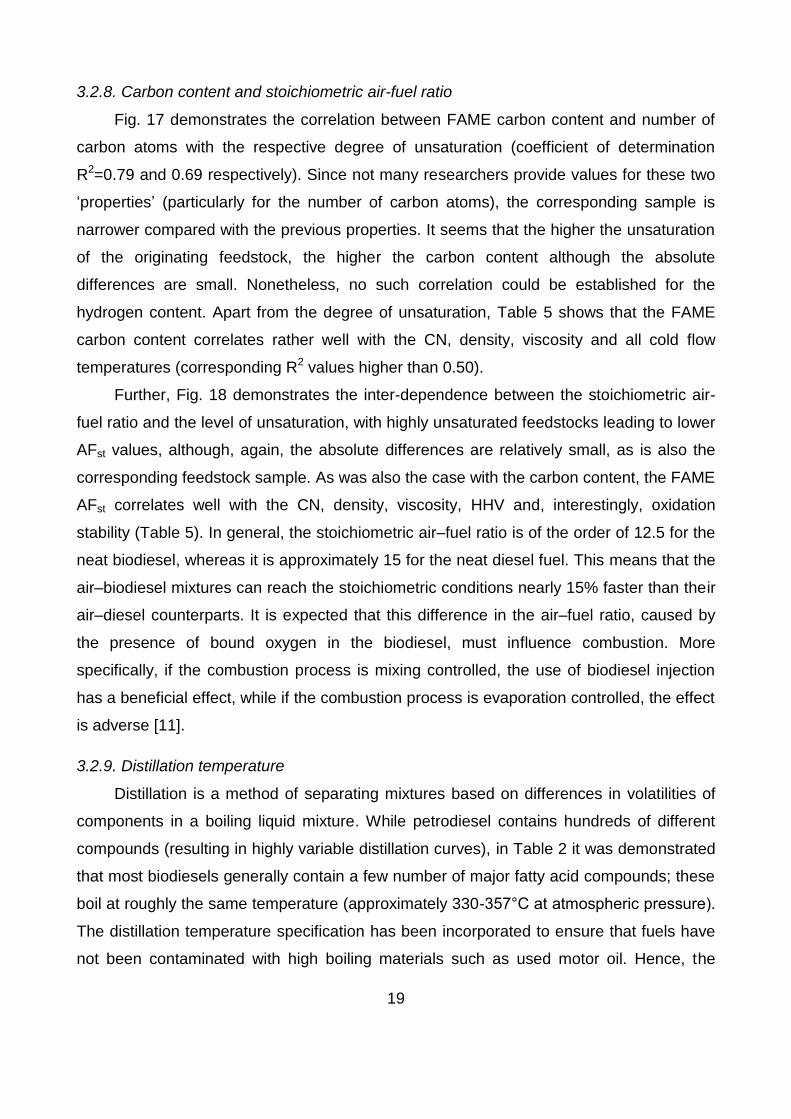
3.2.8. Carbon content and stoichiometric air-fuel ratio
Fig. 17 demonstrates the correlation between FAME carbon content and number of
carbon atoms with the respective degree of unsaturation (coefficient of determination
R2=0.79 and 0.69 respectively). Since not many researchers provide values for these two
„properties‟ (particularly for the number of carbon atoms), the corresponding sample is
narrower compared with the previous properties. It seems that the higher the unsaturation
of the originating feedstock, the higher the carbon content although the absolute
differences are small. Nonetheless, no such correlation could be established for the
hydrogen content. Apart from the degree of unsaturation, Table 5 shows that the FAME
carbon content correlates rather well with the CN, density, viscosity and all cold flow
temperatures (corresponding R2 values higher than 0.50).
Further, Fig. 18 demonstrates the inter-dependence between the stoichiometric air-
fuel ratio and the level of unsaturation, with highly unsaturated feedstocks leading to lower
AFst values, although, again, the absolute differences are relatively small, as is also the
corresponding feedstock sample. As was also the case with the carbon content, the FAME
AFst correlates well with the CN, density, viscosity, HHV and, interestingly, oxidation
stability (Table 5). In general, the stoichiometric air–fuel ratio is of the order of 12.5 for the
neat biodiesel, whereas it is approximately 15 for the neat diesel fuel. This means that the
air–biodiesel mixtures can reach the stoichiometric conditions nearly 15% faster than their
air–diesel counterparts. It is expected that this difference in the air–fuel ratio, caused by
the presence of bound oxygen in the biodiesel, must influence combustion. More
specifically, if the combustion process is mixing controlled, the use of biodiesel injection
has a beneficial effect, while if the combustion process is evaporation controlled, the effect
is adverse [11].
3.2.9. Distillation temperature
Distillation is a method of separating mixtures based on differences in volatilities of
components in a boiling liquid mixture. While petrodiesel contains hundreds of different
compounds (resulting in highly variable distillation curves), in Table 2 it was demonstrated
that most biodiesels generally contain a few number of major fatty acid compounds; these
boil at roughly the same temperature (approximately 330-357°C at atmospheric pressure).
The distillation temperature specification has been incorporated to ensure that fuels have
not been contaminated with high boiling materials such as used motor oil. Hence, the
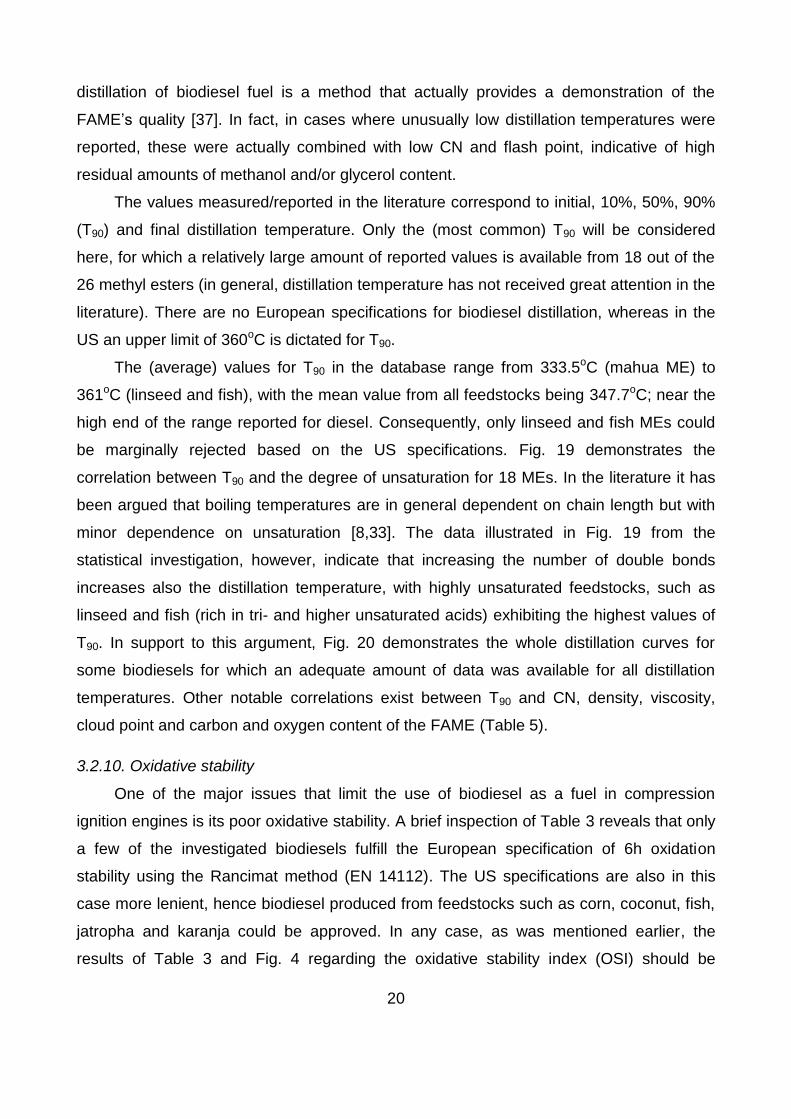
20
distillation of biodiesel fuel is a method that actually provides a demonstration of the
FAME‟s quality [37]. In fact, in cases where unusually low distillation temperatures were
reported, these were actually combined with low CN and flash point, indicative of high
residual amounts of methanol and/or glycerol content.
The values measured/reported in the literature correspond to initial, 10%, 50%, 90%
(T90) and final distillation temperature. Only the (most common) T90 will be considered
here, for which a relatively large amount of reported values is available from 18 out of the
26 methyl esters (in general, distillation temperature has not received great attention in the
literature). There are no European specifications for biodiesel distillation, whereas in the
US an upper limit of 360oC is dictated for T90.
The (average) values for T90 in the database range from 333.5oC (mahua ME) to
361oC (linseed and fish), with the mean value from all feedstocks being 347.7oC; near the
high end of the range reported for diesel. Consequently, only linseed and fish MEs could
be marginally rejected based on the US specifications. Fig. 19 demonstrates the
correlation between T90 and the degree of unsaturation for 18 MEs. In the literature it has
been argued that boiling temperatures are in general dependent on chain length but with
minor dependence on unsaturation [8,33]. The data illustrated in Fig. 19 from the
statistical investigation, however, indicate that increasing the number of double bonds
increases also the distillation temperature, with highly unsaturated feedstocks, such as
linseed and fish (rich in tri- and higher unsaturated acids) exhibiting the highest values of
T90. In support to this argument, Fig. 20 demonstrates the whole distillation curves for
some biodiesels for which an adequate amount of data was available for all distillation
temperatures. Other notable correlations exist between T90 and CN, density, viscosity,
cloud point and carbon and oxygen content of the FAME (Table 5).
3.2.10. Oxidative stability
One of the major issues that limit the use of biodiesel as a fuel in compression
ignition engines is its poor oxidative stability. A brief inspection of Table 3 reveals that only
a few of the investigated biodiesels fulfill the European specification of 6h oxidation
stability using the Rancimat method (EN 14112). The US specifications are also in this
case more lenient, hence biodiesel produced from feedstocks such as corn, coconut, fish,
jatropha and karanja could be approved. In any case, as was mentioned earlier, the
results of Table 3 and Fig. 4 regarding the oxidative stability index (OSI) should be

21
interpreted carefully since many researchers used additives or did not apply the same
esterification clean-up or storage conditions, all of which influence considerably the
oxidation values.
In general, it is the poly-unsaturated methyl esters such as croton, safflower,
soybean, linseed, and sunflower, rich in linoleic and linolenic acids, that are prone to
oxidative degradation [13,35,38]. On the contrary saturated fatty acids such as coconut,
palm and animal fat are oxidatively more stable. The oxidation process is further
enhanced by factors such as presence of air and/or metals, and high storage
temperatures. The auto-oxidation of unsaturated fatty compounds proceeds with different
rates depending on the number and position of double bonds. The CH2 positions allylic to
double bonds in the fatty acid chains are those susceptible to oxidation. The bis-allylic
positions in poly-unsaturated fatty acids, such as linoleic acid (double bonds at C-9 and C-
12, giving one bis-allylic position at C-11) and linolenic acid (double bonds at C-9, C-12,
and C-15, giving two bis-allylic positions at C-11 and C-14), are even more prone to
autoxidation than allylic positions [35]. Relative rates of oxidation have been reported to
be 1 for oleates, 41 for linoleates, and 98 for linolenates [39]. However, the unsaturation
degree is not the only variable affecting the oxidation stability. The presence of water and
other compounds derived either from external contamination or from thermal degradation
(the last two being more likely in the case of oils that have been used for cooking) may
also promote oxidation. Also the reduction in the natural anti-oxidants when the oil is
subjected to a frying process contributes to the lower oxidation stability of waste cooking
oils esters documented in Table 3 [40].
A rather promising in terms of oxidation stability feedstock seems to be castor, which
has been measured by many researchers to exhibit high OSI values (even of the order of
tens of hours). This is most probably associated with the fact that cold-extracted castor oil
has relatively high content of natural anti-oxidants [33]. Another promising alternative has
been proposed by Sarin et al. [41], who found that the oxidation stability of jatropha ME
can be improved through blending with the more oxidatively stable palm ME.
4. Summary and conclusion
A huge amount of data published in International Journals, Conferences and from
renowned research centers was gathered and analyzed as regards the biodiesel physical
22
and chemical properties and the respective fatty acid composition. Overall, 26 biodiesel
feedstocks were investigated from data reported in more than 750 paper/reports published
during the last 3 decades. From the data gathered, average values and standard
deviations were provided for all interesting oil/fats fatty acid compositions and for the
respective biodiesels‟ physical and chemical properties with reference to the specifications
valid in the EU and the US. The most important (feedstock-related) properties of biodiesel
were discussed with respect to the real engine operation and the possible inefficiencies
they may induce. Moreover, they were correlated with the degree of unsaturation of the
parent oil/fat, providing also linear best-fit curves that are believed to prove useful in future
simulation studies as well as long-term planning by institutions and administrations. The
degree of unsaturation (average number of double bonds) was found to correlate
excellently with the iodine number; a high statistical correlation (R2>0.60) was also
established for cetane number, density, pour point, carbon content, number of carbon
atoms, stoichiometric air-fuel ratio and T90 distillate temperature. Smaller but still
significant correlations were established between unsaturation and kinematic viscosity,
lower and higher heating values, cloud point and flash point.
Since the composition of the parent oil/fat was found to affect the final ester‟s
properties decisively, a question arises as to which is the biodiesel feedstock with the best
properties, or whether it is more preferable to use saturated or unsaturated oils for the
production of methyl esters. Although production cost, apart from the chemical properties,
plays a pivotal role here, it is not easy to answer this question in a single and irrevocable
manner. Saturated feedstocks (such as those derived from coconut, palm and tallow)
excel in cetane number and oxidation stability (and usually lower NOx emissions), while
exhibiting poor cold flow properties, higher kinematic viscosity, lower (but still high
enough) flash point and lower heating value. In contrast, increasing the unsaturation
decreases the kinematic viscosity, improves the cold flow properties (additives are most
probably still required) and increases moderately the heating value, but also lowers the
CN and deteriorates the oxidation stability. Interestingly, it is the most unsaturated
feedstocks that are susceptible to rejection based on the existing specification limits.
Specifically, and based on the linear best-fit curves derived, feedstocks with more than
1.47 double bonds in their molecule (corn, croton, fish, linseed, rubber seed, safflower,
sunflower, soybean) have to be excluded in Europe in pure form on the grounds of IN
higher than 120. Further, if the number of double bonds is higher than 1.84 (corresponds
23
to IN>148), then the minimum European limit of CN=51 is not probably met, whereas for
more than 2.15 double bonds (IN>171; linseed only) it seems that the American upper
limit of T90 might not be met too.
There are two feedstocks that differentiate by a lot from the others, i.e. coconut and
castor. Coconut ME is the most saturated biodiesel, and is characterized by low viscosity
and high cetane number. Castor, on the other hand, although exhibiting excellent
oxidation stability and at the same time has very good cold flow properties, fails to fulfill
three major fuel specifications namely, cetane number, viscosity and density. Interestingly,
the most popular ME worldwide, SME, should be rejected in pure form in Europe since it
does not meet the (rather strict) IN, the oxidation stability and usually the CN specification.
Other feedstocks that do not (or only marginally) fulfill at least two specifications in the EU
or the US are the most unsaturated ones, namely linseed, fish, safflower, sunflower rubber
seed and croton. In any case, the use of the more realistic smaller biodiesel ratios, e.g. up
to 20% v/v in the fuel blend, tends to reduce considerably the differences between the
various feedstocks, and renders practically all biodiesel blends acceptable, with the
possible exception of castor.
24
References
[1] Hansen AC, Kyritsis DC, Lee CF. Characteristics of biofuels and renewable fuel standards.
In: Vertes AA, Qureshi N, Blaschek HP, Yukawa H, editors. Biomass to biofuels -
Strategies for global industries. Oxford: Blackwell Publishing; 2009.
[2] Giakoumis EG, Rakopoulos CD, Dimaratos AM, Rakopoulos DC. Exhaust emissions of
diesel engines operating under transient conditions with biodiesel fuel blends”, Progr
Energy Combust Sci 2012 (doi:10.1016/j.pecs.2012.05.002).
[3] Agarwal AK. Biofuels (alcohols and biodiesel) applications as fuels in internal combustion
engines. Progr Energy Combust Sci 2007;32:233−71.
[4] Directive 2009/28/EC of the European Parliament and of the Council on the promotion of
the use of energy from renewable sources, 2009.
[5] Komninos NP, Rakopoulos CD. Modeling HCCI combustion of biofuels: A review. Renew
Sustain Energy Rev 2012;16:1588–610.
[6] Gallagher BJ. The economics of producing biodiesel from algae. Renew Energy 2011;36:
158–62.
[7] Pinzi S, Garcia IL, Lopez-Gimenez FJ, Luque de Castro MD, Dorado G, Dorado MP. The
ideal vegetable oil-based biodiesel composition: A review of social, economic and technical
implications. Energy Fuels 2009;23:2325–41.
[8] Graboski MS, McCormick RL. Combustion of fat and vegetable oil derived fuels in diesel
engines. Progr Energy Combust Sci 1998;24:125−64.
[9] Demirbas A. Biodiesel production from vegetable oils via catalytic and non-catalytic
supercritical methanol transesterification methods. Progr Energy Combust Sci
2005;31:466−87.
[10] Gog A, Roman M, Toca M, Paizs C, Irimie FD. Biodiesel production using enzymatic
transesterification – Current state and perspectives. Renew Energy 2012;39:10–16.
[11] Rakopoulos CD, Antonopoulos KA, Rakopoulos DC, Hountalas DT, Giakoumis EG.
Comparative performance and emissions study of a direct injection diesel engine using
blends of diesel fuel with vegetable oils or biodiesels of various origins. Energy Convers
Manage 2006;47:3272−87.
[12] US Environmental Protection Agency. A comprehensive analysis of biodiesel impacts on
exhaust emissions. Draft Technical Report. EPA 420-P-02-001, US, EPA, Washington DC,
USA 2002.
[13] Knothe G. Dependence of biodiesel fuel properties on the structure of fatty acid alkyl
esters. Fuel Process Technol 2005;86:1059–70.

25
[14] Gopinath A, Puhan S, Nagarajan G. Theoretical modeling of iodine value and
saponification value of biodiesel fuels from their fatty acid composition. Renew Energy
2009;34:1806–11.
[15] Ramos MJ, Fernandez CM, Casas A, Rodriguez L, Perez A. Influence of fatty acid
composition of raw materials on biodiesel properties. Biores Technol 2009;100:261–8.
[16] Pinzi S, Leiva D, Arzamendi G, Gandia LM, Dorado MP. Multiple response optimization of
vegetable oils fatty acid composition to improve biodiesel physical properties. Biores
Technol 2011;102:7280–8.
[17] Demirbas A. Relationships derived from physical properties of vegetable oil and biodiesel
fuels. Fuel 2008;87:1743−8.
[18] Ramirez-Verduzco LF, Rodriguez- Rodriguez JE, Jaramillo-Jacob ADR. Prediction of
cetane number, kinematic viscosity, density, and higher heating value of biodiesel from its
fatty acid methyl ester composition. Fuel 2012;91:102–11.
[19] Hoekman SK, Broch A, Robbins C, Ceniceros E, Natarajan M. Review of biodiesel
composition, properties and specifications. Renew Sustain Enegy Rev 2012;16:143–69.
[20] Gui MM, Li KT, Bhatia S. Feasibility of edible oil vs. non-edible oil vs. waste edible oil as
biodiesel feedstock. Energy 2008;33:1646−53.
[21] Lapuerta M, Rodriguez-Fernandez J, de Mora EF. Correlation for the estimation of the
cetane number of biodiesel fuels and implications on the iodine number. Energy Policy
2009;37:4337–44.
[22] Giakoumis EG, Rakopoulos CD, Dimaratos AM, Rakopoulos DC. Combustion noise
radiation during acceleration of a turbocharged diesel engine operating with biodiesel or n-
butanol diesel fuel blends. IMechE 2012;226 (Part D);226:971–86.
[23] Peterson CL, Taberski JS, Thompson JC, Chase CL. The effects of biodiesel feedstock on
regulated emissions in chassis dynamometer tests of a pickup truck. Trans ASABE
2000;43:1371–81.
[24] McCormick RL, Graboski MS, Alleman TL, Herring AM. Impact of biodiesel source material
and chemical structure on emissions of criteria pollutants from a heavy-duty engine.
Environ Sci Technol 2001;35:1742–7.
[25] Zhang Y, Boehman AL. Impact of biodiesel on NOx emissions in a common rail direct
injection diesel engine. Energy Fuels 2007;21:2003–12.
[26] Klopfenstein WE. Effect of molecular weights of fatty acid esters on cetane numbers as
diesel fuels. J Am Oil Chem Soc 1985;62:1029–31.
[27] Rakopoulos CD, Giakoumis EG. Diesel engine transient operation. London: Springer;
2009.

26
[28] Knothe G. “Designer” biodiesel: optimizing fatty ester composition to improve fuel
properties. Energy Fuels 2008;22:1358–64.
[29] Moser BR, Williams A, Haas MJ, McCormick RL. Exhaust emissions and fuel properties of
partially hydrogenated soybean oil methyl esters blended with ultra low sulfur diesel fuel.
Fuel Process Technol 2009;9:1122−8.
[30] Allen CAW, Watts KC, Ackman RG, Pegg MJ. Predicting the viscosity of biodiesel fuels
from their fatty acid ester composition. Fuel 1999;78:1319−26.
[31] Knothe G, Steidler KR. Kinematic viscosity of biodiesel fuel components and related
compounds. Influence of compound structure and comparison to petrodiesel fuel
components. Fuel 2005;84:1059–65.
[32] Rodrigues JA, Cardoso FP, Lachter ER, Estevao LRM, Lima E, Nascimento RSV.
Correlating chemical structure and physical properties of vegetable oil esters. J Am Oil
Chem Soc 2006;83:353–7.
[33] Berman P, Nizri S, Wiesman Z. Castor oil biodiesel and its blends as alternative fuel.
Biomass Bioenergy 2011;35:2861−6.
[34] Imahara H, Minami E, Saka S. Thermodynamic study on cloud point of biodiesel with its
fatty acid composition. Fuel 2006;85:1666-70.
[35] Knothe G. Improving biodiesel fuel properties by modifying fatty ester composition. Energy
Environ Sci 2009;2:759–66.
[36] Bhale PV, Deshpande NV, Thombre SB. Improving the low temperature properties of
biodiesel fuel. Renew Energy 2009;34:794–800.
[37] Smith BL. Ott LS, Bruno TJ. Composition-explicit distillation curves of commercial biodiesel
fuels: comparison of petroleum-derived fuel with B20 and B100. Ind Eng Chem Res
2008;47:5832–40.
[38] Moser BR. Comparative oxidative stability of fatty acid alkyl esters by accelerated methods.
J Am Oil Chem Soc 2009;86:699–706.
[39] Holman RA, Elmer OC. The rates of oxidation of unsaturated fatty acids and esters. J Am
Oil Chem Soc 1947;24:127–9.
[40] Lapuerta M, Rodriguez-Fernandez J, Ramos A, Alvarez B. Effect of the test temperature
and anti-oxidant addition on the oxidation stability of commercial biodiesel fuels. Fuel
2012;93:391−6.
[41] Sarin R, Sharma M, Sinharay S, Malhotra RK. Jatropha-palm biodiesel blends: An optimum
mix for Asia. Fuel 2007;86:1365–71.
27
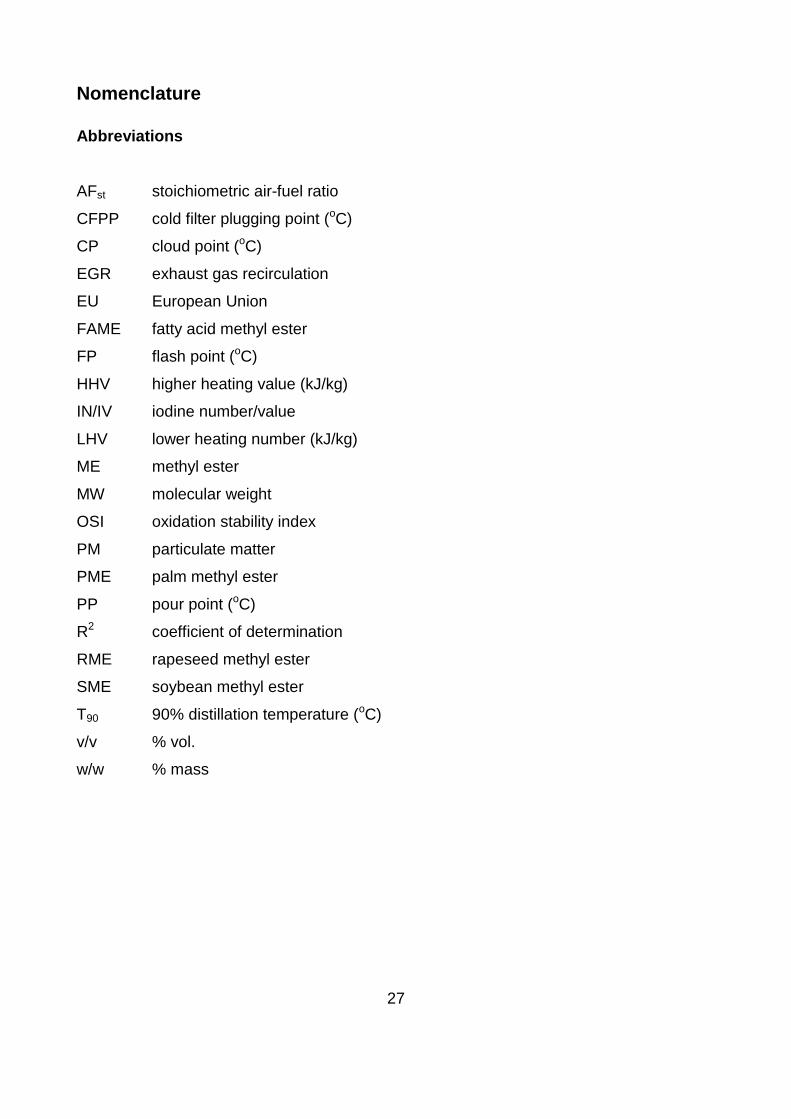
Nomenclature
Abbreviations
AFst stoichiometric air-fuel ratio
CFPP cold filter plugging point (oC)
CP cloud point (oC)
EGR exhaust gas recirculation
EU European Union
FAME fatty acid methyl ester
FP flash point (oC)
HHV higher heating value (kJ/kg)
IN/IV iodine number/value
LHV lower heating number (kJ/kg)
ME methyl ester
MW molecular weight
OSI oxidation stability index
PM particulate matter
PME palm methyl ester
PP pour point (oC)
R2 coefficient of determination
RME rapeseed methyl ester
SME soybean methyl ester
T90 90% distillation temperature (oC)
v/v % vol.
w/w % mass

28
Table Captions
Table 1. European (EN 14214:2008) and US (ASTM D6751) specifications for biodiesel in
comparison with conventional diesel fuel (test method in parentheses).
Table 2a. Fatty acid weight percentage in all analyzed vegetable oils (standard deviation
in parentheses; absence of standard deviation indicates only one available value; only
fatty acids with at least 0.05 percentage weight are referenced).
Table 2b. Fatty acid weight percentage in all analyzed animal fats (standard deviation in
parentheses; only fatty acids with at least 0.05 percentage weight are referenced).
Table 3. Summarization of various biodiesel physical and chemical properties for all
analyzed feedstocks (standard deviation in parentheses).
Table 4. Degree of unsaturation of the fatty acid oils considered, as well as its correlation
with the FAME iodine number.
Table 5. Pearson coefficients for the correlations between the various FAME physical and
chemical properties (light blue highlighted values have a coefficient higher than 0.80, and
light green highlighted values have a coefficient between 0.60 and 0.79).
29
Figure Captions
Fig. 1. Number of observations (upper diagram) and percentage (lower diagram) of
biodiesel datasets analyzed in the current study.
Fig. 2. Comparative illustration of saturated, mono- and poly-unsaturated percentage
weights in all analyzed feedstocks (solid line corresponds to average values).
Fig. 3. Comparative illustration of specific fatty acids percentage weight in all analyzed
feedstocks (solid line corresponds to average values).
Fig. 4. Comparative illustration of various biodiesel properties average values and
corresponding standard deviations for all analyzed feedstocks; biodiesels are presented in
order of increasing unsaturation.
Fig. 5. Correlation between oil/fat unsaturation level and FAME average iodine number
from all 26 investigated feedstocks.
Fig. 6. Correlation between oil/fat unsaturation level and FAME average cetane number
from 25 investigated feedstocks (castor excluded).
Fig. 7. Correlation between oil/fat unsaturation level and FAME average density from 25
investigated feedstocks (castor excluded).
Fig. 8. Correlation between FAME iodine number and density from 25 investigated
feedstocks (158 observations excluding castor).
Fig. 9. Correlation between FAME average density and cetane number from 25
investigated feedstocks (castor excluded).
Fig. 10. Correlation between oil/fat unsaturation level and FAME average lower/higher
heating values from all 26 investigated feedstocks.
Fig. 11. Correlation between oil/fat unsaturation level and FAME average kinematic
viscosity from 24 investigated feedstocks (castor and coconut excluded).
Fig. 12. Correlation between FAME average density and kinematic viscosity from 19
investigated feedstocks.
Fig. 13. Correlation between oil/fat unsaturation level and FAME average flash point from
all 26 investigated feedstocks.
Fig. 14. Correlation between FAME pour and cloud point from all 26 investigated
feedstocks (170 observations).

30
Fig. 15. Correlation between oil/fat unsaturation level and FAME average cloud point from
23 investigated feedstocks (castor, coconut and hazelnut excluded).
Fig. 16. Correlation between oil/fat unsaturation level and FAME average pour point from
23 investigated feedstocks (castor, coconut and hazelnut values).
Fig. 17. Correlation between oil/fat unsaturation level and FAME average carbon content
and number of carbon atoms.
Fig. 18. Correlation between oil/fat unsaturation level and FAME average stoichiometric
air-fuel ratio from 7 investigated feedstocks.
Fig. 19. Correlation between oil/fat unsaturation level and FAME average T90 distillation
temperature from 18 investigated feedstocks.
Fig. 20. Distillation curves for six biodiesels (sunflower SuME; corn CRME; rapeseed
RME; soybean SME; beef tallow BTME, and palm PME).
31
Table 1. European (EN 14214:2008) and US (ASTM D6751) specifications for biodiesel in
comparison with conventional diesel fuel (test method in parentheses).
BIODIESEL ULTRA LOW SULFUR
DIESEL
PROPERTY Europe
EN 14214:2008
USA
ASTM D6751
Europe
EN 590
Density (kg/m3 @ 15
oC) 860−900 (EN 12185) − 820−845
Viscosity (mm2/s @ 40
oC) 3.5−5.0 (EN 3104) 1.9−6.0 (D445) 2.0−4.5
Distillation (oC) − <360 @ 90% (D1160) 350 @ 85% 360 @ 95%
Flash point (oC) >101 (EN 3679) >93 (D93) >55
Cold filter plugging point (oC) country specific (EN 116) − country specific
Cloud point (oC) country specific − (D2500) −
Sulfur content (mg/kg) <10 (EN 20884) <15 (D5453) <10
Carbon residue (% w/w) <0.30 (10% dist. residue)
(EN 10370)
<0.05 (100% dist.
residue) (D4530) <0.30 (10% dist. residue)
Sulfated ash (% w/w) <0.02 (EN 3987) <0.02 (D874) <0.01
Water (mg/kg) <500 (EN 12937) <500 (D2709) <200
Contamination (mg/kg) <24 (EN 12662) − <24
Copper strip corrosion
(3h @ 50oC)
Class 1 (EN 2160) Class 3 (D130) Class 1
Oxidation stability (h @110oC) >6h (EN 14112) >3h (EN 14112) (25 g/m
3)
Cetane number (-) >51 (EN 5165) >47 (D613) >51
Acid value (mg KOH/g) <0.5 (EN 14104) <0.5 (D664) −
Methanol (% w/w) <0.20 (EN 14110) −
Ester content (% w/w) >96.5 (EN 14103) − −
Monoglyceride (% w/w) <0.80 (EN 14105) − −
Diglyceride (% w/w) <0.20 (EN 14105) − −
Triglyceride (% w/w) <0.20 (EN 14105) − −
Free glycerol (% w/w) <0.02 (EN 14105) <0.02 (D6584) −
Total glycerol (% w/w) <0.25 (EN 14105) <0.24 (D6584) −
Iodine value (-) <120 (EN 14111) − −
Linolenic acid ME (% w/w) <12 (EN 14103) − −
Poly-unsaturated acid MEs
(% w/w) <1 (EN 14103) −
Phosphorus (mg/kg) <4 (EN 14107) <10 (D4951) −
Gp I metals (Na, K) (mg/kg) <5 (EN 14538)
−
Gp II metals (Ca, Mg) (mg/kg) −
PAHs (% w/w) − − <11
Lubricity/wear (μm @ 60oC) − − <460

8:0
C8H16O2 10:0
C10H20O2 12:0
C12H24O2 14:0
C14H28O2 16:0
C16H32O2 16:1
C16H30O2 17:0
C17H34O2 18:0
C18H36O2 18:1
C18H34O2 18:1 OH C18H34O3
18:2 C18H32O2
18:3 C18H30O2
20:0 C20H40O2
20:1 C20H38O2
22:0 C22H44O2
22:1 C22H42O2
24:0 C24H48O2
Coun
t
Mol. weight (kg/kmol)
144.21 172.26 200.32 228.37 256.42 254.41 270.45 284.48 282.46 298.46 280.45 278.43 312.53 310.51 340.58 338.57 368.63
Formal (common) name
Octa
noic
(C
ap
rylic
)
Deca
no
ic
(Cap
ric)
Do
de
ca
no
ic
(La
uric)
Tetr
ade
-
ca
noic
(Myristic)
Hexa
de
-
ca
noic
(Pa
lmitic
)
cis
-9 H
exa
-
de
cen
oic
(Pa
lmito
leic
)
He
pta
-
de
can
oic
(Marg
aric)
Octa
-
de
can
oic
(Ste
aric)
cis
-9 O
cta
-
de
cen
oic
(Ole
ic)
12-h
yd
roxy,
cis
-9 O
cta
-
de
cen
oic
(Ric
inole
ic)
cis
-9, cis
-12
Octa
deca-
die
no
ic
(Lin
ole
ic)
cis
-9,c
is-1
2,
cis
-15 O
cta
-
de
catr
ien
oic
(Lin
ole
nic
)
Eic
osan
oic
(Ara
ch
idic
)
cis
-11
Eic
osen
oic
(Go
ndo
ic)
Docosa
no
ic
(Be
he
nic
)
cis
-13
Docose
no
ic
(Eru
cic
)
Tetr
a-
cosa
noic
(Lig
noce
ric)
Animal Fat or Vegetable Oil
Canola − − − − 4.51
(0.82) 0.36
(0.34) 0.14
(0.71) 2.00
(0.63) 60.33 (2.05)
− 21.24 (1.55)
9.49 (1.60)
0.62 (0.37)
1.49 (0.83)
0.35 (0.10)
0.42 (0.29)
0.16 (0.11)
28
Castor (ricinus communis)
− − − − 1.38
(0.50) − −
1.11 (0.42)
3.35 (0.70)
88.07 (1.85)
4.84 (0.76)
0.56 (0.34)
0.25 (0.08)
0.42 (0.14)
− − − 17
Coconut (cocos nucifera)
6.46 (2.11)
5.62 (1.34)
46.91 (5.45)
18.74 (1.34)
9.69 (1.52)
0.11 (0.10)
− 2.83
(0.58) 6.83
(1.71) −
2.21 (1.30)
− 0.10
(0.06) − − − − 29
Corn (zea mays)
− − − − 11.81 (1.07)
0.12 (0.20)
− 2.13
(0.45) 27.35 (2.84)
− 57.74 (3.88)
0.63 (0.40)
0.34 (0.29)
0.33 (0.51)
− − 0.14
(0.05) 32
Cottonseed (gossypium)
− − − 0.72
(0.49) 25.93 (2.64)
0.36 (0.36)
− 1.74
(0.87) 15.98 (2.63)
− 55.12 (2.97)
0.16 (0.18)
0.22 (0.45)
0.07 0.11
(0.16) − − 24
Croton (codiaeum variegatum)
0.10 7.25
(2.81) 0.10 0.10
3.43 (0.95)
10.80 (1.56)
− 77.25 (6.85)
5.40 (2.12)
0.10 4
Hazelnut (hazel corylus)
6.32
(1.97) 0.30
(0.09)
3.71 (1.95)
79.17 (2.14)
− 10.67 (4.30)
0.15 (0.13)
0.10 (0.10)
0.10 (0.17)
5
Jatropha (jatropha curcas)
− − − 0.15
(0.29) 14.42 (1.94)
0.69 (0.36)
0.08 (0.06)
5.82 (1.77)
42.81 (3.50)
− 35.38 (4.87)
0.23 (0.26)
0.09 (0.09)
0.10 (0.09)
0.14 (0.23)
− 1.47
(2.28) 40
Karanja (pongamia pinnata)
− − − − 10.89 (1.59)
− − 7.89
(1.78) 53.56 (3.59)
− 21.34 (4.13)
2.09 (1.71)
1.82 (1.22)
1.15 (0.99)
4.11 (1.23)
− 1.33
(1.17) 13
Linseed (linum
usitatissimum) − − − −
5.18 (0.88)
0.10 (0.11)
− 3.26
(1.11) 19.04 (2.23)
− 16.12 (1.72)
54.54 (5.93)
0.09 (0.10)
0.07 (0.10)
0.10 (0.06)
0.20 (0.40)
− 19
Mahua (madhuca indica)
− − − 0.15
(0.10) 22.23 (2.40)
− − 22.49 (3.65)
39.01 (4.11)
− 14.87 (2.11)
0.10 (0.17)
1.01 (0.55)
− − − − 10
Neem (azadirachta indica)
0.40
(0.57) 0.18
(0.28) 17.57 (1.14)
16.60 (1.92)
45.83 (5.16)
− 17.79 (3.70)
0.72 (0.69)
1.18 0.15
(0.21) 10
Olive (olea europaea)
− − − 0.05
(0.07) 11.47 (2.33)
0.90 (0.49)
0.07 (0.05)
2.83 (0.75)
74.52 (3.58)
− 9.54
(3.07) 0.51
(0.29) 0.49
(0.15) 0.29
(0.25) 0.16
(0.07) −
0.17 (0.17)
31
Palm (arecaceae)
0.08 (0.05)
0.06 (0.05)
0.37 (0.28)
1.13 (0.96)
42.39 (2.81)
0.17 (0.12)
0.06 (0.06)
4.20 (0.86)
40.91 (2.97)
− 9.97
(1.54) 0.29
(0.20) 0.29
(0.13) 0.16
(0.06) − −
0.05 (0.05)
51
Peanut (arachis hypogaea)
− − − − 10.33 (2.41)
− − 2.79
(0.58) 47.63 (4.77)
− 31.52 (2.99)
0.64 (0.58)
1.07 (0.41)
1.48 (0.91)
2.86 (0.78)
0.10 (0.11)
1.30 (0.69)
16
Rapeseed
(brassica napus) − − −
0.04 (0.04)
4.07 (0.82)
0.23 (0.11)
0.07 (0.12)
1.55 (0.48)
62.24 (2.28)
− 20.61 (1.63)
8.72 (1.42)
0.87 (0.79)
1.09 (0.74)
0.27 (0.26)
0.71 (0.90)
− 47
Rice bran (oryza sativa)
− − 0.08
(0.09) 0.45
(0.38) 18.12 (3.30)
0.20 (0.09)
− 2.17
(0.99) 42.35 (6.02)
− 34.84 (2.72)
0.93 (0.62)
0.45 (0.26)
0.22 (0.16)
0.21 (0.09)
− 0.16
(0.30) 19
Rubberseed (hevea
brasiliensis)
0.51 (0.95)
9.39 (1.13)
0.13 (0.12)
9.41
(1.13) 24.22 (2.12)
− 38.12 (2.38)
17.54 (3.27)
0.28 (0.29)
0.12 (0.10)
0.08 (0.08)
7
Safflower (cartha-
mus tinctorius) − − −
0.08 (0.10)
7.42 (1.34)
0.05 (0.06)
− 2.38
(0.55) 14.41 (2.59)
− 75.31 (3.44)
0.09 (0.09)
− − − − − 22
Soybean (glycine max)
− − 0.08
(0.14) 0.12
(0.20) 11.44 (1.80)
0.16 (0.25)
− 4.14
(0.75) 23.47 (1.85)
− 53.46 (2.31)
6.64 (2.03)
0.33 (0.25)
0.22 (0.24)
0.27 (0.22)
0.07 0.13
(0.13) 91
Sunflower (helianthus annuus)
− − − 0.04
(0.05) 6.26
(1.83) 0.06
(0.07) −
3.93 (1.18)
20.77 (5.93)
67.75 (6.63)
0.15 (0.35)
0.23 (0.17)
0.13 (0.11)
0.70 (0.31)
− 0.26
(0.09) 42
Waste cooking − − 0.20
(0.42) 0.67
(0.59) 15.69 (8.55)
0.73 (0.68)
0.20 (0.13)
6.14 (3.55)
42.84 (10.42)
− 29.36
(14.78) 2.03
(2.40) 0.39
(0.23) 0.56
(0.27) 0.44
(0.31) 0.15
(0.12) 0.30
(0.18) 56
Table 2a. Fatty acid weight percentage in all analyzed vegetable oils (standard deviation in parentheses; absence of standard deviation indicates only
one available value; only fatty acids with at least 0.05 percentage weight are referenced).
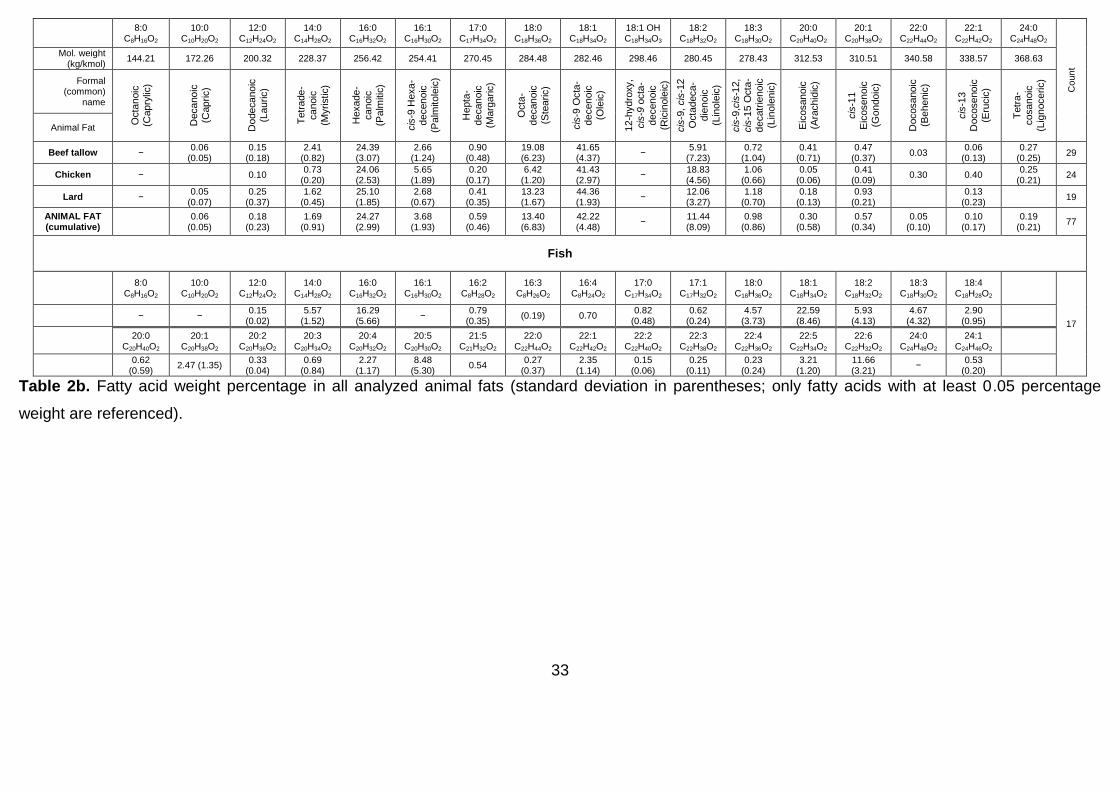
33
8:0
C8H16O2 10:0
C10H20O2 12:0
C12H24O2 14:0
C14H28O2 16:0
C16H32O2 16:1
C16H30O2 17:0
C17H34O2 18:0
C18H36O2 18:1
C18H34O2 18:1 OH C18H34O3
18:2 C18H32O2
18:3 C18H30O2
20:0 C20H40O2
20:1 C20H38O2
22:0 C22H44O2
22:1 C22H42O2
24:0 C24H48O2
Coun
t
Mol. weight (kg/kmol)
144.21 172.26 200.32 228.37 256.42 254.41 270.45 284.48 282.46 298.46 280.45 278.43 312.53 310.51 340.58 338.57 368.63
Formal (common)
name
Octa
noic
(Cap
rylic
)
Deca
no
ic
(Cap
ric)
Do
de
ca
no
ic
(La
uric)
Tetr
ade
-
ca
noic
(Myristic)
Hexa
de
-
ca
noic
(Pa
lmitic
)
cis
-9 H
exa
-
de
cen
oic
(Pa
lmito
leic
)
He
pta
-
de
can
oic
(Marg
aric)
Octa
-
de
can
oic
(Ste
aric)
cis
-9 O
cta
-
de
cen
oic
(Ole
ic)
12-h
yd
roxy,
cis
-9 o
cta
-
de
cen
oic
(Ric
inole
ic)
cis
-9, cis
-12
Octa
deca-
die
no
ic
(Lin
ole
ic)
cis
-9,c
is-1
2,
cis
-15 O
cta
-
de
catr
ien
oic
(Lin
ole
nic
)
Eic
osan
oic
(Ara
ch
idic
)
cis
-11
Eic
osen
oic
(Go
ndo
ic)
Docosa
no
ic
(Be
he
nic
)
cis
-13
Docose
no
ic
(Eru
cic
)
Tetr
a-
cosa
noic
(Lig
noce
ric)
Animal Fat
Beef tallow − 0.06
(0.05) 0.15
(0.18) 2.41
(0.82) 24.39 (3.07)
2.66 (1.24)
0.90 (0.48)
19.08 (6.23)
41.65 (4.37)
− 5.91
(7.23) 0.72
(1.04) 0.41
(0.71) 0.47
(0.37) 0.03
0.06 (0.13)
0.27 (0.25)
29
Chicken − 0.10 0.73
(0.20) 24.06 (2.53)
5.65 (1.89)
0.20 (0.17)
6.42 (1.20)
41.43 (2.97)
− 18.83 (4.56)
1.06 (0.66)
0.05 (0.06)
0.41 (0.09)
0.30 0.40 0.25
(0.21) 24
Lard − 0.05
(0.07) 0.25
(0.37) 1.62
(0.45) 25.10 (1.85)
2.68 (0.67)
0.41 (0.35)
13.23 (1.67)
44.36 (1.93)
− 12.06 (3.27)
1.18 (0.70)
0.18 (0.13)
0.93 (0.21)
0.13
(0.23) 19
ANIMAL FAT (cumulative)
0.06
(0.05) 0.18
(0.23) 1.69
(0.91) 24.27 (2.99)
3.68 (1.93)
0.59 (0.46)
13.40 (6.83)
42.22 (4.48)
− 11.44 (8.09)
0.98 (0.86)
0.30 (0.58)
0.57 (0.34)
0.05 (0.10)
0.10 (0.17)
0.19 (0.21)
77
Fish
8:0
C8H16O2 10:0
C10H20O2 12:0
C12H24O2 14:0
C14H28O2 16:0
C16H32O2 16:1
C16H30O2 16:2
C8H28O2 16:3
C8H26O2 16:4
C8H24O2 17:0
C17H34O2 17:1
C17H32O2 18:0
C18H36O2 18:1
C18H34O2 18:2
C18H32O2 18:3
C18H30O2 18:4
C18H28O2
17 − −
0.15 (0.02)
5.57 (1.52)
16.29 (5.66)
− 0.79
(0.35) (0.19) 0.70
0.82 (0.48)
0.62 (0.24)
4.57 (3.73)
22.59 (8.46)
5.93 (4.13)
4.67 (4.32)
2.90 (0.95)
20:0
C20H40O2 20:1
C20H38O2 20:2
C20H36O2 20:3
C20H34O2 20:4
C20H32O2 20:5
C20H30O2
21:5 C21H32O2
22:0 C22H44O2
22:1 C22H42O2
22:2 C22H40O2
22:3 C22H38O2
22:4 C22H36O2
22:5 C22H34O2
22:6 C22H32O2
24:0 C24H48O2
24:1 C24H46O2
0.62
(0.59) 2.47 (1.35)
0.33 (0.04)
0.69 (0.84)
2.27 (1.17)
8.48 (5.30)
0.54 0.27
(0.37) 2.35
(1.14) 0.15
(0.06) 0.25
(0.11) 0.23
(0.24) 3.21
(1.20) 11.66 (3.21)
− 0.53
(0.20)
Table 2b. Fatty acid weight percentage in all analyzed animal fats (standard deviation in parentheses; only fatty acids with at least 0.05 percentage
weight are referenced).
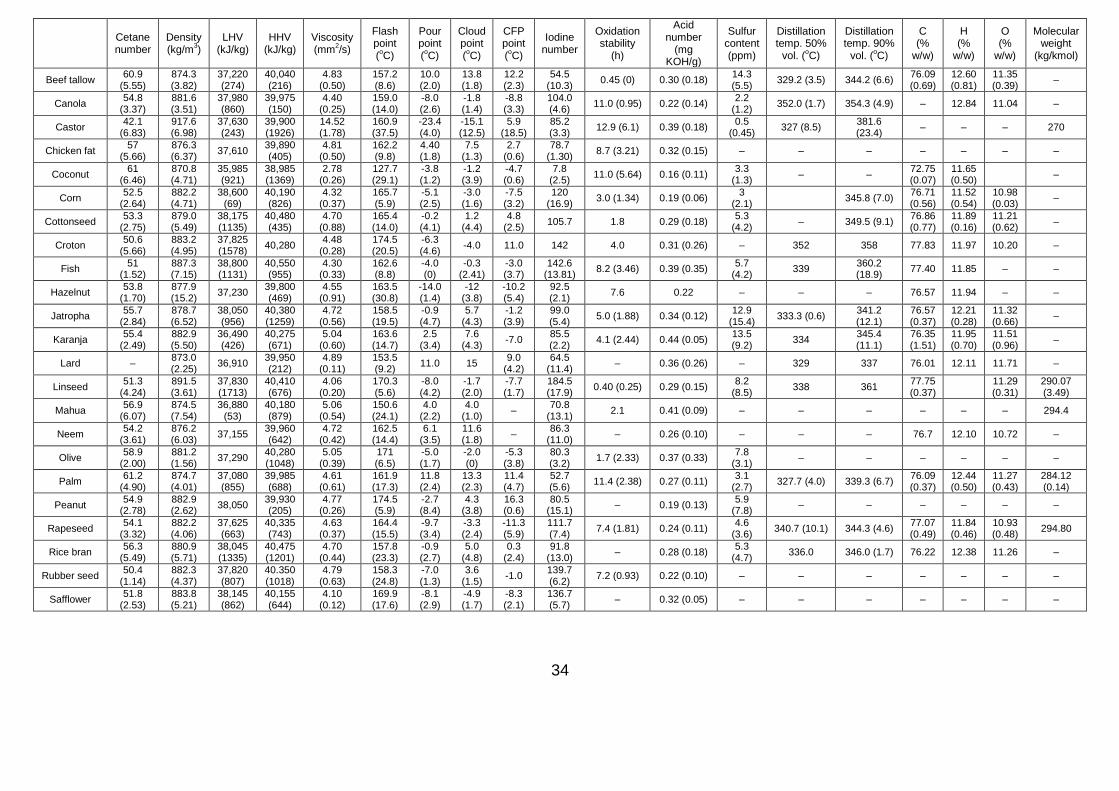
34
Cetane number
Density (kg/m
3)
LHV (kJ/kg)
HHV (kJ/kg)
Viscosity (mm
2/s)
Flash point (oC)
Pour point (oC)
Cloud point (oC)
CFP point (oC)
Iodine number
Oxidation stability
(h)
Acid number
(mg KOH/g)
Sulfur content (ppm)
Distillation temp. 50%
vol. (oC)
Distillation temp. 90%
vol. (oC)
C (%
w/w)
H (%
w/w)
O (%
w/w)
Molecular weight
(kg/kmol)
Beef tallow 60.9
(5.55) 874.3 (3.82)
37,220 (274)
40,040 (216)
4.83 (0.50)
157.2 (8.6)
10.0 (2.0)
13.8 (1.8)
12.2 (2.3)
54.5 (10.3)
0.45 (0) 0.30 (0.18) 14.3 (5.5)
329.2 (3.5) 344.2 (6.6) 76.09 (0.69)
12.60 (0.81)
11.35 (0.39)
–
Canola 54.8
(3.37) 881.6 (3.51)
37,980 (860)
39,975 (150)
4.40 (0.25)
159.0 (14.0)
-8.0 (2.6)
-1.8 (1.4)
-8.8 (3.3)
104.0 (4.6)
11.0 (0.95) 0.22 (0.14) 2.2
(1.2) 352.0 (1.7) 354.3 (4.9) – 12.84 11.04 –
Castor 42.1
(6.83) 917.6 (6.98)
37,630 (243)
39,900 (1926)
14.52 (1.78)
160.9 (37.5)
-23.4 (4.0)
-15.1 (12.5)
5.9 (18.5)
85.2 (3.3)
12.9 (6.1) 0.39 (0.18) 0.5
(0.45) 327 (8.5)
381.6 (23.4)
– – – 270
Chicken fat 57
(5.66) 876.3 (6.37)
37,610 39,890 (405)
4.81 (0.50)
162.2 (9.8)
4.40 (1.8)
7.5 (1.3)
2.7 (0.6)
78.7 (1.30)
8.7 (3.21) 0.32 (0.15) – – – – – – –
Coconut 61
(6.46) 870.8 (4.71)
35,985 (921)
38,985 (1369)
2.78 (0.26)
127.7 (29.1)
-3.8 (1.2)
-1.2 (3.9)
-4.7 (0.6)
7.8 (2.5)
11.0 (5.64) 0.16 (0.11) 3.3
(1.3) – –
72.75 (0.07)
11.65 (0.50)
–
Corn 52.5
(2.64) 882.2 (4.71)
38,600 (69)
40,190 (826)
4.32 (0.37)
165.7 (5.9)
-5.1 (2.5)
-3.0 (1.6)
-7.5 (3.2)
120 (16.9)
3.0 (1.34) 0.19 (0.06) 3
(2.1) 345.8 (7.0)
76.71 (0.56)
11.52 (0.54)
10.98 (0.03)
–
Cottonseed 53.3
(2.75) 879.0 (5.49)
38,175 (1135)
40,480 (435)
4.70 (0.88)
165.4 (14.0)
-0.2 (4.1)
1.2 (4.4)
4.8 (2.5)
105.7 1.8 0.29 (0.18) 5.3
(4.2) – 349.5 (9.1)
76.86 (0.77)
11.89 (0.16)
11.21 (0.62)
–
Croton 50.6
(5.66) 883.2 (4.95)
37,825 (1578)
40,280 4.48
(0.28) 174.5 (20.5)
-6.3 (4.6)
-4.0 11.0 142 4.0 0.31 (0.26) – 352 358 77.83 11.97 10.20 –
Fish 51
(1.52) 887.3 (7.15)
38,800 (1131)
40,550 (955)
4.30 (0.33)
162.6 (8.8)
-4.0 (0)
-0.3 (2.41)
-3.0 (3.7)
142.6 (13.81)
8.2 (3.46) 0.39 (0.35) 5.7
(4.2) 339
360.2 (18.9)
77.40 11.85 – –
Hazelnut 53.8
(1.70) 877.9 (15.2)
37,230 39,800 (469)
4.55 (0.91)
163.5 (30.8)
-14.0 (1.4)
-12 (3.8)
-10.2 (5.4)
92.5 (2.1)
7.6 0.22 – – – 76.57 11.94 – –
Jatropha 55.7
(2.84) 878.7 (6.52)
38,050 (956)
40,380 (1259)
4.72 (0.56)
158.5 (19.5)
-0.9 (4.7)
5.7 (4.3)
-1.2 (3.9)
99.0 (5.4)
5.0 (1.88) 0.34 (0.12) 12.9
(15.4) 333.3 (0.6)
341.2 (12.1)
76.57 (0.37)
12.21 (0.28)
11.32 (0.66)
–
Karanja 55.4
(2.49) 882.9 (5.50)
36,490 (426)
40,275 (671)
5.04 (0.60)
163.6 (14.7)
2.5 (3.4)
7.6 (4.3)
-7.0 85.5 (2.2)
4.1 (2.44) 0.44 (0.05) 13.5 (9.2)
334 345.4 (11.1)
76.35 (1.51)
11.95 (0.70)
11.51 (0.96)
–
Lard – 873.0 (2.25)
36,910 39,950 (212)
4.89 (0.11)
153.5 (9.2)
11.0 15 9.0
(4.2) 64.5
(11.4) – 0.36 (0.26) – 329 337 76.01 12.11 11.71 –
Linseed 51.3
(4.24) 891.5 (3.61)
37,830 (1713)
40,410 (676)
4.06 (0.20)
170.3 (5.6)
-8.0 (4.2)
-1.7 (2.0)
-7.7 (1.7)
184.5 (17.9)
0.40 (0.25) 0.29 (0.15) 8.2
(8.5) 338 361
77.75 (0.37)
11.29 (0.31)
290.07 (3.49)
Mahua 56.9
(6.07) 874.5 (7.54)
36,880 (53)
40,180 (879)
5.06 (0.54)
150.6 (24.1)
4.0 (2.2)
4.0 (1.0)
– 70.8
(13.1) 2.1 0.41 (0.09) – – – – – – 294.4
Neem 54.2
(3.61) 876.2 (6.03)
37,155 39,960 (642)
4.72 (0.42)
162.5 (14.4)
6.1 (3.5)
11.6 (1.8)
– 86.3
(11.0) – 0.26 (0.10) – – – 76.7 12.10 10.72 –
Olive 58.9
(2.00) 881.2 (1.56)
37,290 40,280 (1048)
5.05 (0.39)
171 (6.5)
-5.0 (1.7)
-2.0 (0)
-5.3 (3.8)
80.3 (3.2)
1.7 (2.33) 0.37 (0.33) 7.8
(3.1) – – – – – –
Palm 61.2
(4.90) 874.7 (4.01)
37,080 (855)
39,985 (688)
4.61 (0.61)
161.9 (17.3)
11.8 (2.4)
13.3 (2.3)
11.4 (4.7)
52.7 (5.6)
11.4 (2.38) 0.27 (0.11) 3.1
(2.7) 327.7 (4.0) 339.3 (6.7)
76.09 (0.37)
12.44 (0.50)
11.27 (0.43)
284.12 (0.14)
Peanut 54.9
(2.78) 882.9 (2.62)
38,050 39,930 (205)
4.77 (0.26)
174.5 (5.9)
-2.7 (8.4)
4.3 (3.8)
16.3 (0.6)
80.5 (15.1)
– 0.19 (0.13) 5.9
(7.8) – – – – – –
Rapeseed 54.1
(3.32) 882.2 (4.06)
37,625 (663)
40,335 (743)
4.63 (0.37)
164.4 (15.5)
-9.7 (3.4)
-3.3 (2.4)
-11.3 (5.9)
111.7 (7.4)
7.4 (1.81) 0.24 (0.11) 4.6
(3.6) 340.7 (10.1) 344.3 (4.6)
77.07 (0.49)
11.84 (0.46)
10.93 (0.48)
294.80
Rice bran 56.3
(5.49) 880.9 (5.71)
38,045 (1335)
40,475 (1201)
4.70 (0.44)
157.8 (23.3)
-0.9 (2.7)
5.0 (4.8)
0.3 (2.4)
91.8 (13.0)
– 0.28 (0.18) 5.3
(4.7) 336.0 346.0 (1.7) 76.22 12.38 11.26 –
Rubber seed 50.4
(1.14) 882.3 (4.37)
37,820 (807)
40.350 (1018)
4.79 (0.63)
158.3 (24.8)
-7.0 (1.3)
3.6 (1.5)
-1.0 139.7 (6.2)
7.2 (0.93) 0.22 (0.10) – – – – – – –
Safflower 51.8
(2.53) 883.8 (5.21)
38,145 (862)
40,155 (644)
4.10 (0.12)
169.9 (17.6)
-8.1 (2.9)
-4.9 (1.7)
-8.3 (2.1)
136.7 (5.7)
– 0.32 (0.05) – – – – – – –

35
Cetane number
Density (kg/m
3)
LHV (kJ/kg)
HHV (kJ/kg)
Viscosity (mm
2/s)
Flash point (oC)
Pour point (oC)
Cloud point (oC)
CFP point (oC)
Iodine number
Oxidation stability
(h)
Acid number
(mg KOH/g)
Sulfur content (ppm)
Distillation temp. 50%
vol. (oC)
Distillation temp. 90%
vol. (oC)
C (%
w/w)
H (%
w/w)
O (%
w/w)
Molecular weight
(kg/kmol)
Soybean 51.8
(3.93) 882.8 (5.12)
37,750 (944)
40,020 (671)
4.29 (0.37)
158.8 (19.5)
-3.0 (2.7)
0.1 (2.0)
-3.6 (3.4)
126.0 (6.9)
5.0 (2.59) 0.32 (0.28) 2.7
(3.8) 336.3 (6.1) 345.0 (6.6)
77.03 (0.50)
11.90 (0.31)
10.95 (0.52)
290.83 (2.17)
Sunflower 51.9
(4.73) 882.9 (4.70)
37,800 (895)
40,000 (647)
4.53 (0.51)
172.0 (7.9)
-3.8 (2.3)
0.9 (2.4)
-3.5 (2.0)
128.6 (2.1)
1.3 (0.42) 0.32 (0.14) 355.7 (7.2) 356.5 (2.1) 76.90 (0.37)
11.84 (0.29)
10.98 (0.15)
294.05 (0.50)
Waste cooking
56.2 (3.91)
880.6 (6.04)
37,880 (1088)
39,805 (607)
4.75 (0.46)
161.7 (19.0)
-0.3 (5.5)
5.3 (5.1)
-2.8 (3.3)
85.1 (17.1)
5.0 (3.28) 0.41 (0.14) 8.6
(14.6) 340.4 (6.7) 350.3 (8.6)
76.90 (0.55)
12.02 (0.44)
10.77 (0.47)
289.31 (3.86)
Table 3. Summarization of various biodiesel physical and chemical properties for all analyzed feedstocks (standard deviation in parentheses).

Table 4. Degree of unsaturation of the fatty acid oils considered, and its correlation with
the FAME iodine number.
Animal fat
or vegetable oil
„Unweighted‟ degree
of unsaturation (%) *
„Partially
weighted‟
degree of
unsaturation **
„Fully weighted‟
degree of unsatura-
tion (average number
of double bonds) ***
Chain
length
FAME
iodine
number
Beef tallow 0.52 0.58 0.59 17.37 54.5
Chicken fat 0.68 0.88 0.89 17.42 78.7
Canola 0.92 1.24 1.33 17.99 104
Castor 0.97 1.03 1.03 17.99 85.2
Coconut 0.09 0.12 0.12 13.12 7.8
Corn 0.86 1.45 1.45 17.79 120.3
Cottonseed 0.71 1.27 1.27 17.46 105.7
Croton 0.90 1.76 1.74 17.86 142
Fish 0.96 1.15 2.10 16.72 142.6
Hazelnut 0.90 1.01 1.01 17.87 92.5
Jatropha 0.78 1.15 1.15 17.79 99
Karanja 0.75 1.02 1.04 18.08 85.2
Lard 0.60 0.74 0.74 17.40 64.5
Linseed 0.91 1.61 2.15 17.91 184.5
Mahua 0.54 0.69 0.69 17.57 70.8
Neem 0.64 0.83 0.83 17.66 86.3
Olive 0.85 0.96 0.97 17.79 80.3
Palm 0.51 0.62 0.62 17.08 53.1
Peanut 0.82 1.16 1.16 18.04 80.5
Rapeseed 0.93 1.24 1.32 18.08 111.7
Rice bran 0.78 1.14 1.15 17.64 93.2
Rubber seed 0.80 1.36 1.54 17.80 139.7
Safflower 0.90 1.65 1.65 17.85 136.7
Soybean 0.84 1.44 1.51 17.79 126.2
Sunflower 0.89 1.57 1.57 17.92 128.6
Waste cooking 0.76 1.07 1.09 17.69 85.2
Ground-animal fat
(cumulative) 0.60 0.73 0.74 17.40 65.9
Vegetable oil (cumulative) 0.78 1.16 1.20 17.58 101.6
Overall average values 0.76 1.10 1.18 17.53 98.4
Correlation
with iodine number R
2=0.612 R
2=0.836 R
2=0.942 R
2=0.295 −
* All unsaturated fatty acids assumed to have the same percentage weight
** All unsaturated XX:y (y2) fatty acids have a percentage weight of 2
*** XX:2 fatty acids have a weight percentage of 2, XX:3 fatty acids a weight percentage of 3 etc
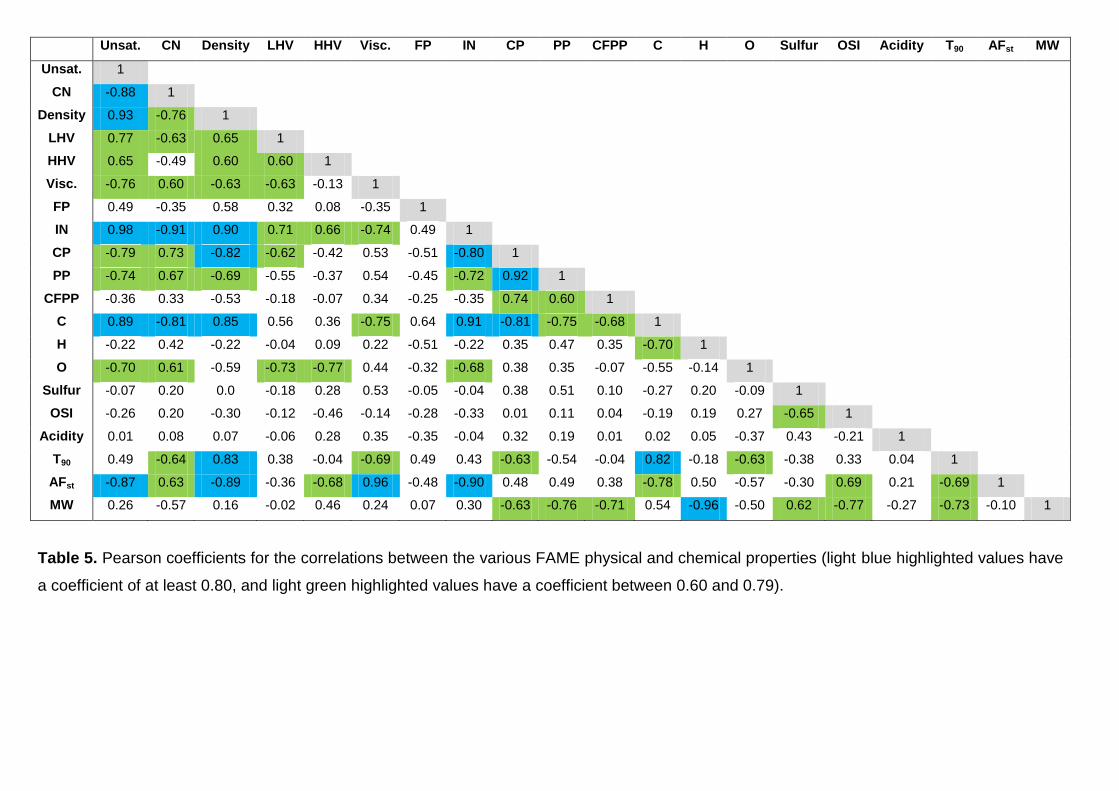
Unsat. CN Density LHV HHV Visc. FP IN CP PP CFPP C H O Sulfur OSI Acidity T90 AFst MW
Unsat. 1
CN -0.88 1
Density 0.93 -0.76 1
LHV 0.77 -0.63 0.65 1
HHV 0.65 -0.49 0.60 0.60 1
Visc. -0.76 0.60 -0.63 -0.63 -0.13 1
FP 0.49 -0.35 0.58 0.32 0.08 -0.35 1
IN 0.98 -0.91 0.90 0.71 0.66 -0.74 0.49 1
CP -0.79 0.73 -0.82 -0.62 -0.42 0.53 -0.51 -0.80 1
PP -0.74 0.67 -0.69 -0.55 -0.37 0.54 -0.45 -0.72 0.92 1
CFPP -0.36 0.33 -0.53 -0.18 -0.07 0.34 -0.25 -0.35 0.74 0.60 1
C 0.89 -0.81 0.85 0.56 0.36 -0.75 0.64 0.91 -0.81 -0.75 -0.68 1
H -0.22 0.42 -0.22 -0.04 0.09 0.22 -0.51 -0.22 0.35 0.47 0.35 -0.70 1
O -0.70 0.61 -0.59 -0.73 -0.77 0.44 -0.32 -0.68 0.38 0.35 -0.07 -0.55 -0.14 1
Sulfur -0.07 0.20 0.0 -0.18 0.28 0.53 -0.05 -0.04 0.38 0.51 0.10 -0.27 0.20 -0.09 1
OSI -0.26 0.20 -0.30 -0.12 -0.46 -0.14 -0.28 -0.33 0.01 0.11 0.04 -0.19 0.19 0.27 -0.65 1
Acidity 0.01 0.08 0.07 -0.06 0.28 0.35 -0.35 -0.04 0.32 0.19 0.01 0.02 0.05 -0.37 0.43 -0.21 1
T90 0.49 -0.64 0.83 0.38 -0.04 -0.69 0.49 0.43 -0.63 -0.54 -0.04 0.82 -0.18 -0.63 -0.38 0.33 0.04 1
AFst -0.87 0.63 -0.89 -0.36 -0.68 0.96 -0.48 -0.90 0.48 0.49 0.38 -0.78 0.50 -0.57 -0.30 0.69 0.21 -0.69 1
MW 0.26 -0.57 0.16 -0.02 0.46 0.24 0.07 0.30 -0.63 -0.76 -0.71 0.54 -0.96 -0.50 0.62 -0.77 -0.27 -0.73 -0.10 1
Table 5. Pearson coefficients for the correlations between the various FAME physical and chemical properties (light blue highlighted values have
a coefficient of at least 0.80, and light green highlighted values have a coefficient between 0.60 and 0.79).

Fig. 1. Number of observations (upper diagram) and percentage (lower diagram) of
biodiesel datasets analyzed in the current study.
Beef tallow4.1%
Canola3.1%
Castor3.3%
Chicken fat1.3%
Coconut2.4%
Corn2.0%
Cottonseed3.1%
Croton0.7%
Fish2.0%
Hazelnut0.7%
Jatropha6.9%
Karanja3.8%
Lard0.7%
Linseed1.9%
Mahua1.5%
Neem1.5%
Olive0.6%
Palm7.8%Peanut
1.6%
Rapeseed10.4%Rice bran
2.5%
Rubber seed1.3%
Safflower1.8%
Soybean18.1%
Sunflower5.6%
Waste cooking9.5%
Other1.9%
Beef tallow; 39
Canola; 29
Castor; 31
Chicken fat; 12
Coconut; 23
Corn; 19
Cottonseed; 29
Croton; 7
Fish; 19
Hazelnut; 7
Jatropha; 66
Karanja; 36
Lard; 7
Linseed; 18
Mahua; 14
Neem; 14
Olive; 6
Palm; 74
Peanut; 15
Rapeseed; 99
Rice bran; 24
Rubber seed; 12
Safflower; 17
Soybean; 172
Sunflower; 53
Waste cooking;
90
Other; 18

39
Fig. 2. Comparative illustration of saturated, mono- and poly-unsaturated percentage
weights in all analyzed feedstocks (horizontal line corresponds to average values).
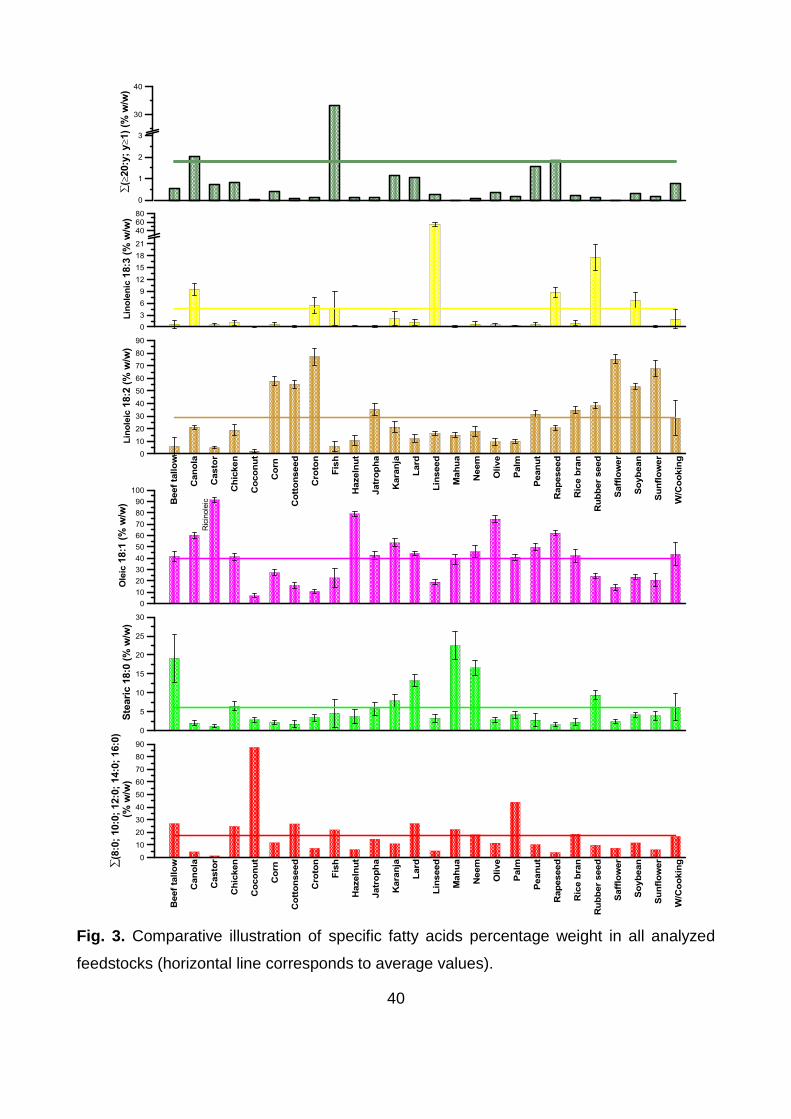
40
Fig. 3. Comparative illustration of specific fatty acids percentage weight in all analyzed
feedstocks (horizontal line corresponds to average values).

41
Fig. 4. Comparative illustration of various biodiesel properties average values and
corresponding standard deviations for all analyzed feedstocks; biodiesels are presented in
order of increasing unsaturation.

42
Fig. 4 (continued). Comparative illustration of various biodiesel properties average values
and corresponding standard deviations for all analyzed feedstocks; biodiesels are
presented in order of increasing unsaturation.
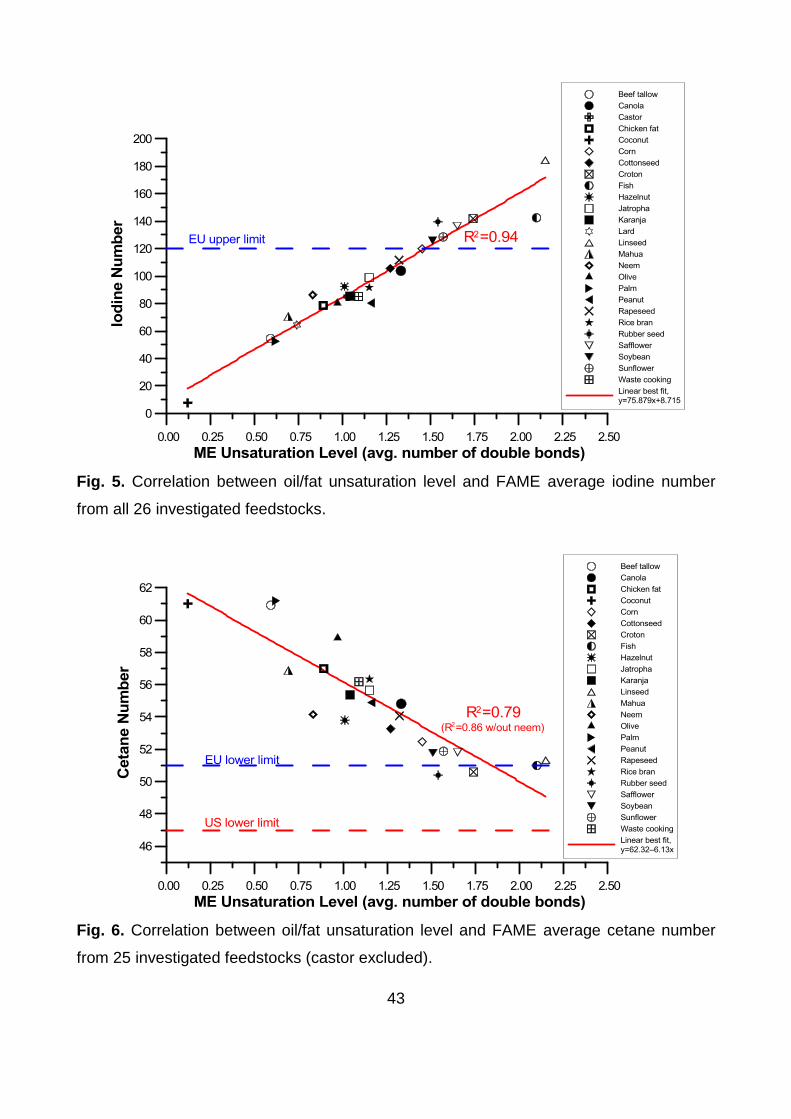
43
Fig. 5. Correlation between oil/fat unsaturation level and FAME average iodine number
from all 26 investigated feedstocks.
Fig. 6. Correlation between oil/fat unsaturation level and FAME average cetane number
from 25 investigated feedstocks (castor excluded).
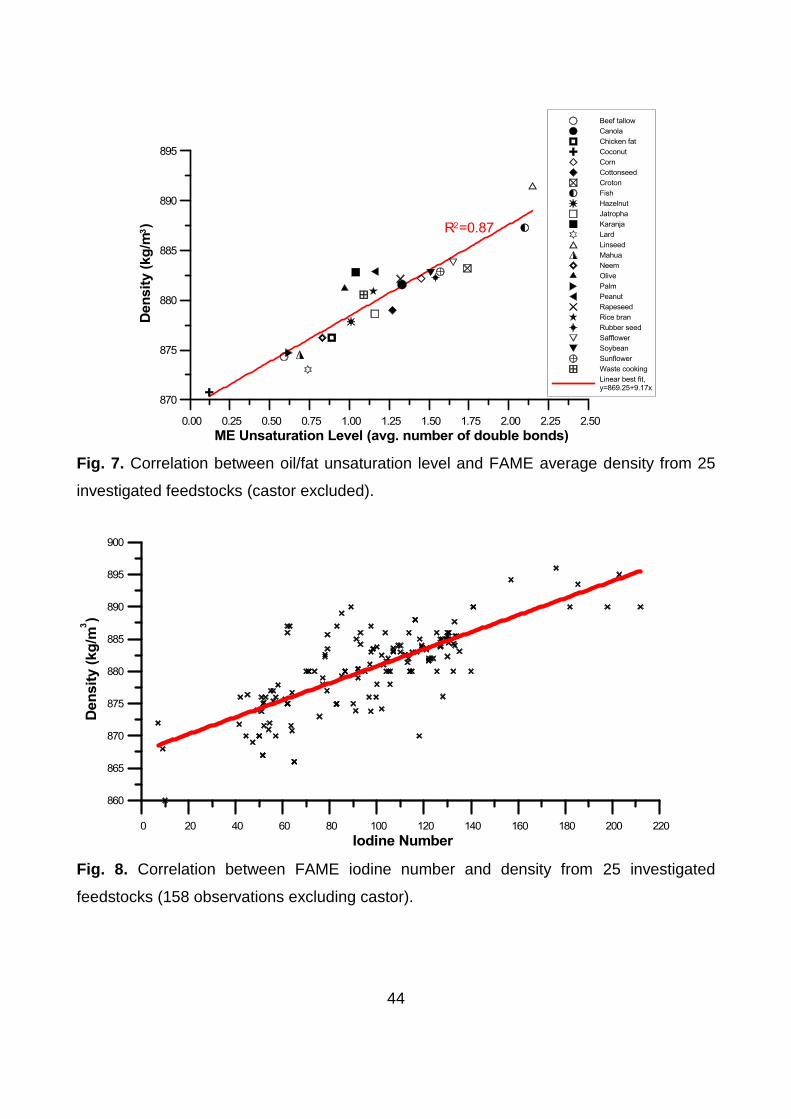
44
Fig. 7. Correlation between oil/fat unsaturation level and FAME average density from 25
investigated feedstocks (castor excluded).
Fig. 8. Correlation between FAME iodine number and density from 25 investigated
feedstocks (158 observations excluding castor).

45
Fig. 9. Correlation between FAME average density and cetane number from 25
investigated feedstocks (castor excluded).
Fig. 10. Correlation between oil/fat unsaturation level and FAME average lower/higher
heating values from all 26 investigated feedstocks.
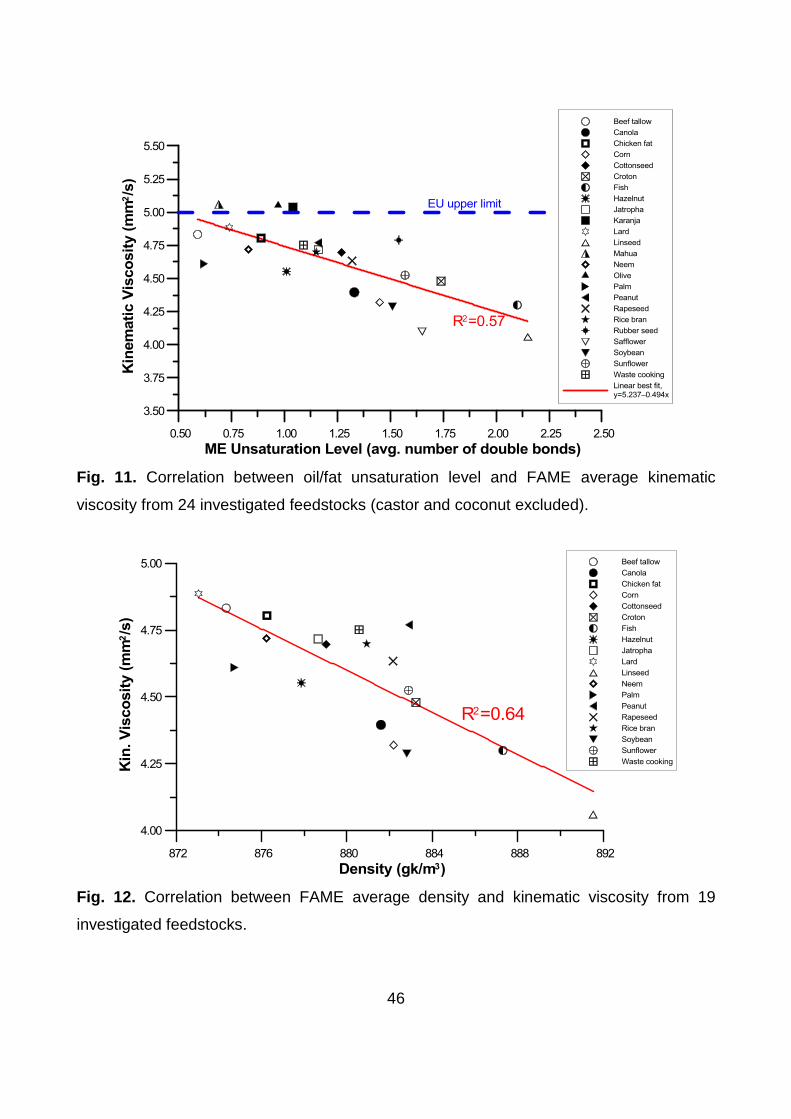
46
Fig. 11. Correlation between oil/fat unsaturation level and FAME average kinematic
viscosity from 24 investigated feedstocks (castor and coconut excluded).
Fig. 12. Correlation between FAME average density and kinematic viscosity from 19
investigated feedstocks.

47
Fig. 13. Correlation between oil/fat unsaturation level and FAME average flash point from
all 26 investigated feedstocks.
Fig. 14. Correlation between FAME pour and cloud point from all 26 investigated
feedstocks (170 observations).

48
Fig. 15. Correlation between oil/fat unsaturation level and FAME average cloud point from
23 investigated feedstocks (castor, coconut and hazelnut excluded).
Fig. 16. Correlation between oil/fat unsaturation level and FAME average pour point from
23 investigated feedstocks (castor, coconut and hazelnut values).
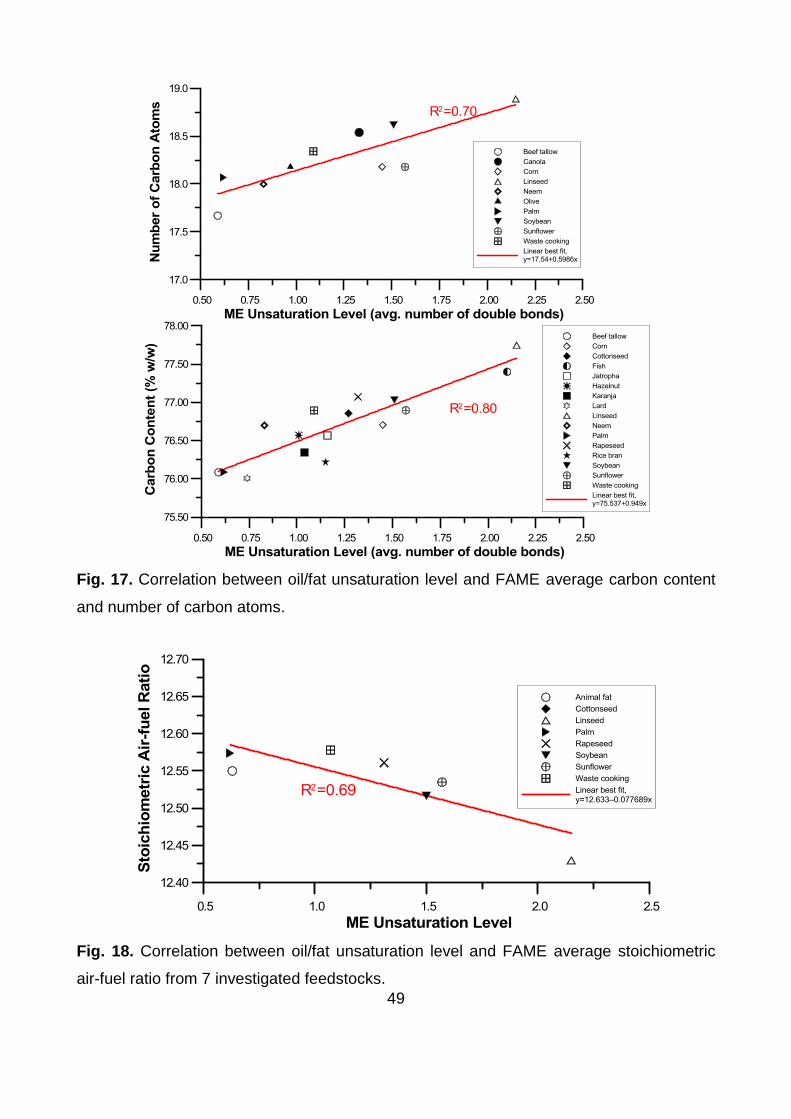
49
Fig. 17. Correlation between oil/fat unsaturation level and FAME average carbon content
and number of carbon atoms.
Fig. 18. Correlation between oil/fat unsaturation level and FAME average stoichiometric
air-fuel ratio from 7 investigated feedstocks.
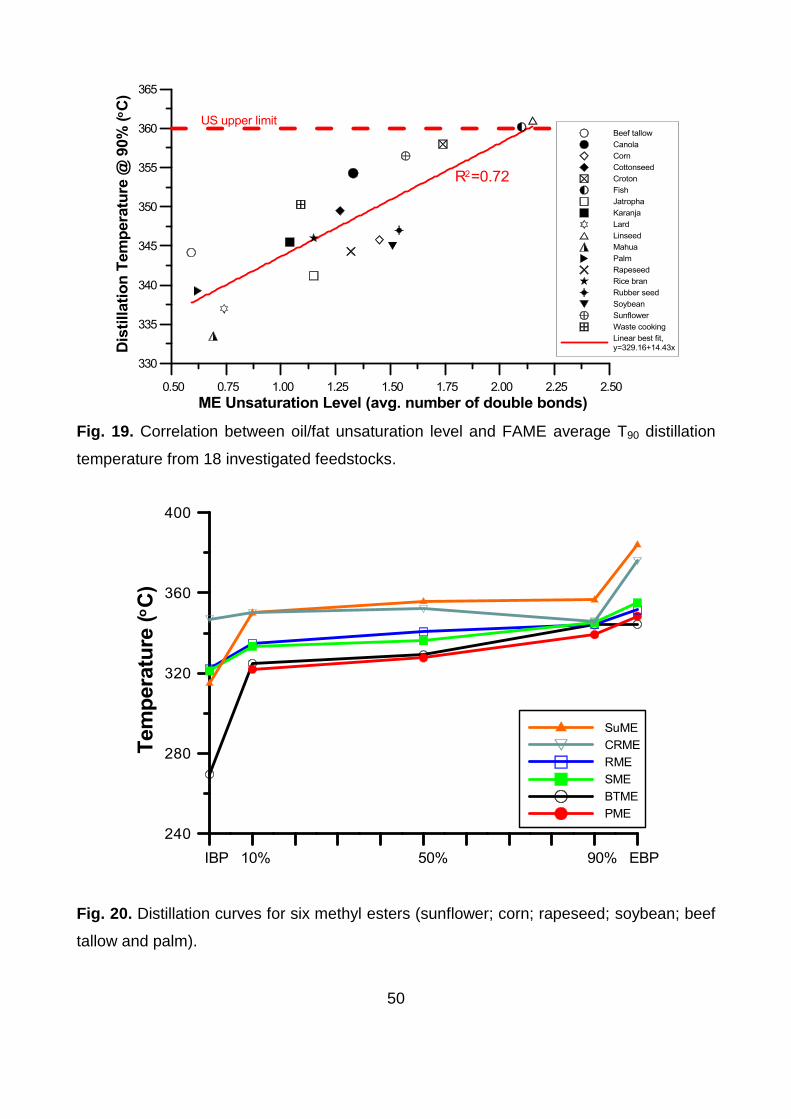
50
Fig. 19. Correlation between oil/fat unsaturation level and FAME average T90 distillation
temperature from 18 investigated feedstocks.
Fig. 20. Distillation curves for six methyl esters (sunflower; corn; rapeseed; soybean; beef
tallow and palm).


![EXPERIMENTAL INVESTIGATION REVIEW OF BIODIESEL USAGE … · tion, properties, and usage of biodiesel fuels in a Diesel engine [18-24]. In general, biodiesel is a sustainable, nontoxic,](https://static.fdocuments.in/doc/165x107/6057cdd9c828af729f46c0dd/experimental-investigation-review-of-biodiesel-usage-tion-properties-and-usage.jpg)