A Spatially Intelligent Public Participation System for the Environmental Impact Assessment Process
27
ISPRS Int. J. Geo-Inf. 2013, 2, 480-506; doi:10.3390/ijgi2020480 ISPRS International Journal of Geo-Information ISSN 2220-9964 www.mdpi.com/journal/ijgi/ Article A Spatially Intelligent Public Participation System for the Environmental Impact Assessment Process Lei Lei * and Brian Hilton School of Information Systems and Technology, Claremont Graduate University, Claremont, CA 91711, USA; E-Mail: [email protected] * Author to whom correspondence should be addressed; E-Mail: [email protected]; Tel.: +1-909-267-4880; Fax: +1-909-793-3112. Received: 25 March 2013; in revised form: 5 May 2013 / Accepted: 7 May 2013 / Published: 27 May 2013 Abstract: An environmental impact assessment (EIA) is a decision-making process that evaluates the possible significant effects that a proposed project may exert on the environment. The EIA scoping and reviewing stages often involve public participation. Although its importance has long been recognized, public participation in the EIA process is often regarded as ineffective, due to time, budget, resource, technical and procedural constraints, as well as the complexity of environmental information. Geographic Information System (GIS) and Volunteer Geographic Information (VGI) have the potential to contribute to data collection, sharing and presentation, utilize local user-generated content to benefit decision-making and increase public outreach. This research integrated GIS, VGI, social media tools, data mining and mobile technology to design a spatially intelligent framework that presented and shared EIA information effectively to the public. A spatially intelligent public participative system (SIPPS) was also developed as a proof-of-concept of the framework. The research selected the Tehachapi Renewable Transmission Project (TRTP) as the pilot study area. Survey questionnaires were designed to collect feedback and conduct evaluation. Results show that SIPPS was able to improve the effectiveness of public participation, promote environmental awareness and achieve good system usability. Keywords: GIS; VGI; public participation; environmental impact assessment OPEN ACCESS
Transcript of A Spatially Intelligent Public Participation System for the Environmental Impact Assessment Process

ISPRS Int. J. Geo-Inf. 2013, 2, 480-506; doi:10.3390/ijgi2020480
ISPRS International
Journal of
Geo-Information ISSN 2220-9964
www.mdpi.com/journal/ijgi/
Article
A Spatially Intelligent Public Participation System for
the Environmental Impact Assessment Process
Lei Lei * and Brian Hilton
School of Information Systems and Technology, Claremont Graduate University, Claremont,
CA 91711, USA; E-Mail: [email protected]
* Author to whom correspondence should be addressed; E-Mail: [email protected];
Tel.: +1-909-267-4880; Fax: +1-909-793-3112.
Received: 25 March 2013; in revised form: 5 May 2013 / Accepted: 7 May 2013 /
Published: 27 May 2013
Abstract: An environmental impact assessment (EIA) is a decision-making process that
evaluates the possible significant effects that a proposed project may exert on the
environment. The EIA scoping and reviewing stages often involve public participation.
Although its importance has long been recognized, public participation in the EIA process
is often regarded as ineffective, due to time, budget, resource, technical and procedural
constraints, as well as the complexity of environmental information. Geographic
Information System (GIS) and Volunteer Geographic Information (VGI) have the potential
to contribute to data collection, sharing and presentation, utilize local user-generated content
to benefit decision-making and increase public outreach. This research integrated GIS,
VGI, social media tools, data mining and mobile technology to design a spatially
intelligent framework that presented and shared EIA information effectively to the public.
A spatially intelligent public participative system (SIPPS) was also developed as a
proof-of-concept of the framework. The research selected the Tehachapi Renewable
Transmission Project (TRTP) as the pilot study area. Survey questionnaires were designed
to collect feedback and conduct evaluation. Results show that SIPPS was able to improve
the effectiveness of public participation, promote environmental awareness and achieve
good system usability.
Keywords: GIS; VGI; public participation; environmental impact assessment
OPEN ACCESS

ISPRS Int. J. Geo-Inf. 2013, 2 481
1. Introduction
An environmental impact assessment (EIA) is a decision-making process that systematically
evaluates the possible significant (negative or positive) effects that a proposed project action may exert
on the natural, social and human environment of a particular geographic area. The assessment results
are often included in a document known as an environmental impact statement (EIS). An EIS usually
includes, but is not limited to, the following topics: the environmental objectives and regulations, the
baseline conditions of the existing environment, the proposed project and alternatives, impact analysis
on the affected environment and consequences, public comments and comment analysis, mitigations
and recommendations and other monitoring measures. The EIA process consists of multiple stages,
and citizens normally participate in EIA at the stage of scoping and public reviewing. The scoping
stage provides an opportunity for the pubic to express what they would like the EIS to address and the
reviewing stage allows the public to comment on the draft EIS before the final EIS is generated. Other
name variations, such as environmental impact report (EIR), have been used; for consistency, this study
uses the term ―EIA‖ to represent similar processes and ―EIS‖ to represent similar documents hereafter.
Although the importance of involving the public to participate in the EIA process has long been
recognized [1], it is often regarded as ineffective, due to material, technical and process complexity, as
well as the nature of environmental information [2]. How to improve the effectiveness of public
participation in the EIA process continues to draw the attention of researchers [1]. Traditional methods
for the public to participate in EIA include public meetings, telephone interviews, emails and
surveys [3,4]. Information technology and geographic information system (GIS) are considered two
major vehicles that have brought innovation to the conventional approaches [4]. The term ―public
participation geographic information systems (PPGIS)‖ first appeared in a GIS workshop organized by
the National Center for Geographic Information and Analysis (NCGIA). The primary goal was to
identify GIS solutions to empower the less privileged groups and incorporate socially differentiated
local knowledge [5]. Since then, PPGIS has evolved towards the direction of leveraging GIS to engage
the public in policy-making, support non-governmental organizations (NGOs), grassroots groups and
community-based organizations (CBOs) [6]. Many PPGIS environmental information systems have
been developed [7–9]. However, researchers pointed out that previous work often attached importance
to the aspects of environmental modeling, analysis or implementation techniques and rarely discussed
the design and system usability with regard to involving the public more actively and effectively in
EIA [10]. According to Sieber, one of the major challenges for PPGIS is how to effectively and
accurately present the available data and the results retrieved from the underlying modeling and
quantitative analysis in a GIS-based environmental system such that the public would understand them
correctly and be willing to participate [6].
Recently, the advancement of Internet technology and the proliferation of Web 2.0 has brought new
behaviors to a geographically-enabled information society and has infused public participation with
new energy. The phenomena fall into six major yet overlapping categories [11]: (1) user-generated
content, which refers to digital information, such as videos, photos, blogs, news feeds and podcasts,
created by the web users and normally shared with other users [12]; (2) leveraging the collective
wisdom of the crowd to identify a design or solution (e.g., crowdsourcing) [13,14]; (3) large-scale data
of multi-dimensional complexity that often require massive storage space and powerful database

ISPRS Int. J. Geo-Inf. 2013, 2 482
searching, processing and analysis capabilities; (4) participatory frameworks, which associate citizens’
local knowledge and observations with geospatial footprints (e.g., an address) [11,15]; (5) prevalent
virtual community and social media involvement that encourage user interaction through online
platforms, such as message boards, chat rooms or social networking sites; and lastly, (6) harnessing
geospatial technology to benefit non-expert users or communities [16]. With the empowerment of
these evolving categories, users are more likely and willing to be engaged in generating and
consuming web-based geospatial contents [17]. This, in turn, leads to another new phenomenon which
has been termed ―volunteered geographic information‖ (VGI) [18,19]. Researchers have also used
―neogeography‖ [16,20,21], ―cybercartography‖ [22] or ―asserted geographic information‖ (in the
sense that its content is asserted by its creator without citation, reference or screening of another
authority) [18] to describe similar activities. For the sake of consistency, this paper will use the term
―VGI‖ hereafter.
The growth of VGI contributes to the gathering, sharing and visualization of geographic
information. Unlike the traditional top-down approach that generates or distributes paper-based or
web-based geospatial contents from authoritative or professional sources (e.g., governmental
agencies), VGI adopts a bottom-up approach that engages a large number of citizens and shifts the role
of users from mere ―data consumers to active participants and providers‖ of user-generated
content [23]. This shift can leverage local intelligence to benefit local government, state agencies and
CBOs in improving decision quality, reducing process time, promoting cost-effectiveness, maintaining
transparency and legitimacy and ultimately contributing to the development of a civil society [24].
The importance of VGI in environmental areas has also been recognized by scholars. Research
suggests that VGI can contribute to reflecting public environmental concerns [25], promoting
environmental awareness [26], providing environmental policy makers with local and timely data [26]
and expediting new public policy changes on small scales in environmental monitoring activities [27].
Particularly relevant to GIS and public participation, citizens can now access variations of VGI to
contribute information located on a map through web-based mapping application interfaces [28]. For
example, Werts developed a WebGIS framework to increase public participation in soil and water
conservation [26]. Another example is OakMapper (http://www.oakmapper.org/) that allows people to
report tree disease information and obtain an overview of the tree health status across California using
an online mapping tool [29]. With the help of VGI, agencies and organizations are now able to gather
geographic information with local intelligence that may not be available otherwise.
As mentioned previously, public comments are often submitted to the EIA lead agency via mail,
email, phone or fax in many EIA projects. These comments consist of text mostly and the volume can
grow rapidly during the draft EIS phase. After receiving the comments, agency staff need to screen,
consolidate and analyze them based on the National Environmental Policy Act of 1969 (NEPA) and/or
the EIA lead agency’s approach and respond to each of the individual comments (NEPA §1503.4(a),
http://ceq.hss.doe.gov/nepa/regs/ceq/1503.htm). In many cases, there is no effective automated
mechanism for decision makers to explore and extract meaningful information from raw comments.
This problem can be alleviated by data mining. Data mining is a technique that aims at automatically
extracting data and discovering implicit patterns and trends from large data sets or databases [30].
Those patterns and trends often represent intelligent information related to relevance, innovativeness
and interestingness. Data mining usually consists of three kinds of tasks: information retrieval,

ISPRS Int. J. Geo-Inf. 2013, 2 483
named-entity recognition and information extraction [31]. Spatial data mining often takes place when
data mining algorithms are applied to geospatial information. Geospatial information retrieval and
extraction has recently been identified by the National Geospatial-Intelligence Agency (NGA) as one
of the key research areas in the next 15 years [15]. Benefits of data mining include improving
data collection efficiency, reducing efforts and costs, enhancing data quality and coherence of
assessments [32] and supporting good strategic identification in decision-making [33].
The primary objective of this study was to develop a spatially intelligent solution to improve the
effectiveness of public participation in the EIA process. Criteria to define effectiveness are presented
later in Section 5.1. The secondary objective was to leverage the solution to raise the environmental
awareness of the public and contribute to the knowledge base regarding public participation in policy
making in general. The research integrated GIS, VGI, social media tools, data mining and mobile
technology to design a spatially enabled framework that presented and shared EIA information
effectively to the public. A prototype spatially intelligent public participative system (SIPPS) was also
developed as a proof-of-concept of the framework.
2. Study Area Selection
Since environmental issues cover a wide range of topics and various EIAs target specific
environmental problems, this research selected one EIA project as a case study area and used the EIA
associated environmental information to design the solution framework and the prototype system. This
section reviews the selected EIA project and the problems associated with its current system.
2.1. California Energy Problem and Study Site Selection
This research selected the Tehachapi Renewable Transmission Project (TRTP) as the study area.
TRTP was first proposed by Southern California Edison (SCE) in 2007 as part of SCE’s effort to fulfill
the requirements imposed by California’s Renewables Portfolio Standard (RPS) and the final EIS for
TRTP was completed in September 2010. RPS was initially established by the California Public
Utilities Commission (CPUC) and the California Energy Commission in 2002 with the major goal of
providing affordable, reliable and clean energy to meet the needs of the increasing state population in
the next 20 years. The RPS program required investor-owned utilities, electricity service providers and
community choice aggregators to increase procurement from eligible renewable energy resources to
33% of total procurement by 2020. TRTP proposed to integrate new wind generation in the Tehachapi
Wind Resource Area (TWRA) and would construct, operate, relocate and maintain transmission
infrastructure along about 173 miles of new and existing right-of-way across Kern County, Los
Angeles County, Angeles National Forest and San Bernardino County in Southern California. The
proposed activities could have significant impacts on the environment, and the proposal was therefore
required by NEPA to conduct an EIA. The USDA Forest Service (USFS) was the federal lead agency
and the CPUC was the state lead agency. They worked collaboratively with other responsible agencies
and citizens to collect information and prepare the draft and final EIS.
TRTP was selected as the prototype in this study, due to the following considerations: First, it is the
first major transmission project in California being constructed specifically to access multiple
renewable generators in a remote renewable-rich resource area. Second, TRTP has been a very

ISPRS Int. J. Geo-Inf. 2013, 2 484
controversial project since its initiation. Compared to other SCE renewable energy transmission projects, it
received more public comments than any other projects listed on SCE’s website (http://www.sce.com/
PowerandEnvironment/Transmission/ProjectsByCounty/projects-by-county.htm). The EIA process for
TRTP was lengthy and involved many back-and-forth conversations and negotiations among agencies,
SCE and the public. The combination of these factors makes TRTP a great prototype case for this
study while maintaining the generalizability of the findings.
2.2. Existing Website Problems
CPUC has an existing FTP website to host the TRTP EIA documents and public comments
(ftp://ftp.cpuc.ca.gov/gopher-data/environ/tehachapi_renewables/TRTP.htm). This website is, however,
ineffective in multiple senses. First, it is primarily a static document repository with a flat file structure
and overwhelming data. It does not adopt any available VGI technology to alleviate the cognitive
difficulty that decision makers and public users might encounter. All the project maps are static PDF
files and none of their potential impacts are displayed directly on the maps. Ideally, EIA should be a
comprehensive interactive process beyond a mere documentation warehouse. However, citizens played
the role of a passive recipient on this website rather than an active participant and could hardly interact
with either the decision makers or other citizens. Second, the comment submission process is not
automated. Raw public comments were collected via fax, phone, email and mail or at the public
meetings using physical forms and each comment is listed as a single PDF file online. If a user wants
to see the comments, they would have to laboriously click and open each PDF one by one. Third, the
website has a disconnected workflow, and the components on the website fail to support each other.
For example, the comments cannot be directly viewed on the map viewer and the map viewer never
presents any demographic information about the participants, and thus, it is difficult to obtain the
overall EIA status and understand the spatial distribution of public participants. Overall, the existing
website was not designed in a manner to engage the public effectively. The framework proposed in this
study can alleviate those problems.
3. Conceptual Framework Design
This section presents a spatially intelligent conceptual framework that integrates GIS, VGI, data
mining and mobile technology to improve the effectiveness of public participation in EIA. The
framework is designed for two intended groups of users: (1) citizens who view the environmental
information, review other users’ comments, identify possible alternatives or potential impacts and
provide their own feedback to the EIA lead agency; (2) decision makers such as agency staff who not
only access all the functionality available to citizens, but also have the task of analyzing and
responding to comments, evaluating project alternatives and consequences, generating status reports
and making final decisions on projects.
The framework includes five components: a spatial component, an analysis component, a comment
component, a data mining component and a mobile component. The first four components are
designed to be accessible to users through a web browser on a personal computer and the mobile
component provides an additional dimension for the public to participate through mobile devices.

ISPRS Int. J. Geo-Inf. 2013, 2 485
Figure 1 shows the concept of operation for the proposed framework. In Figure 1, each green box
represents a component and each pink box represents the output from the corresponding component.
Figure 1. Conceptual framework for SIPPS.
Each component has its unique capabilities:
The spatial component visualizes the EIA data on a map viewer to assist scoping and planning
and distributes the EIA geospatial information through a graphical user interface (GUI) to improve
public outreach. This component will allow a user to dynamically navigate maps, view and toggle
environmental information layers related to an EIA project, locate geographic objects (e.g., a
proposed power station) on the map and review object attributes (e.g., the height of a power tower)
in a pop-up window. One of the most critical activities in the EIA scoping phase is to identify
potential alternatives [34]. Adequate consideration of various alternatives can mitigate possible
bias, improve process transparency, increase stakeholders’ confidence and contribute to a balanced
decision-making process. With the help of the spatial component, stakeholders will be able to assist
in the identification of potential impacts using feature editing tools and maps from the area (e.g., a
public user may use the tool to draw a new polyline in a different place on the map to indicate
another possible electric power transmission segment that would meet the same purpose and need
for the TRTP project).
The analysis component supports planning and discloses further intelligence that may not be
otherwise obvious to increase environmental awareness. The analysis component will enable target
users to perform scenario analysis and what-if analysis, weigh environmental factors for different

ISPRS Int. J. Geo-Inf. 2013, 2 486
project alternatives and outcomes and contemplate how a selected location they care about is
spatially related to and potentially affected by the proposed EIA activities such as the construction
of power transmission lines.
The comment component provides a platform for comment collection, review and management.
This component will allow a public user to review existing comments posted by other citizens,
interact with other user comments, rate comments and post new comments specific to geographic
locations on the map. Comments are no longer limited to text, but can also be user-generated
content, such as PDF files, pictures, audio files or videos that can be uploaded to associate with
comments on the map. This component will also facilitate decision makers to categorize comments,
update comment status (e.g., status for submitted, reviewed and responded comments), respond to
comments and review the spatial and temporal relationship among comments to obtain a holistic
view. In addition, social media tools (e.g., YouTube, Flickr and Twitter) are included in the
comment component to facilitate information sharing. With the increasing influence of VGI,
information from virtual communities and social media networks becomes an important part of
local intelligence and contributes to the aggregation of web maps and user-generated content. This
part in the component will retrieve live feeds that contain keywords about the selected EIA project
from YouTube, Flickr and Twitter and display the feeds dynamically with their spatial footprints
on the map viewer. In this way, users can easily access the component to discover project events
and activities through social media posts.
The data mining component will use data mining algorithms such as clustering analysis to
support comment analysis. By reviewing the results and graphs generated in data mining, decision
makers will be able to have a better understanding about the micro-culture and composition of the
local community, classify diverse interests and concerns and identify potential patterns and
underlying issues that may not be easily seen through pure textual files. In this way, fairness and
trust is enhanced.
The mobile component will engage the public through another dimension. With the help of the
mobile component, public users will be able to use a mobile platform to view the proposed EIA
activities, perform basic map navigation, identify geographic objects and their attributes, review
and post comments and associate the user-generated content such as a mobile picture taken via
their mobile camera to their comments.
4. Prototype Development
Based on the conceptual framework presented in Section 3, a web-based application prototype
system was developed as a proof-of-concept. The development process consisted of two stages: data
collection and processing and application implementation.
4.1. Data Collection and Processing
Two types of data were collected in this study: spatial data and public comments. The following
spatial data were gathered in the context of the TRTP project: basemaps and demographic digital maps
that cover the project impacted areas, spatial locations of the TRTP power transmission segments and
substations, spatial relationships such as buffers and viewsheds of the project activities in relation to

ISPRS Int. J. Geo-Inf. 2013, 2 487
the surrounding environment, and other publicly available spatial information such as soil or natural
resources that were identified in the TRTP EIA scoping phase. In this study, the basemaps and
demographic maps were retrieved from the map services posted in ArcGIS Online
(www.arcgisonline.com). The TRTP power segments and substations were manually digitized as
spatial features based on the static maps provided in the final TRTP EIS using ArcInfo 10.0. Spatial
relationships were generated based on the power line segments using ArcInfo 10.0 Geoprocessing
toolboxes. Raw data of other supportive spatial information were downloaded from publicly accessible
government geospatial data portals. They were initially in heterogeneous formats and were then
transformed to a consistent spatial reference such that they can be overlaid and displayed correctly
within one single dynamic map viewer. A geodatabase was also designed in the study to capture the
functional artifacts, workflows and data constraints.
The comment data were obtained from two sources: an Excel spreadsheet containing 233 public
comments with user addresses and additional information was obtained from SCE; the PDF comment
files were downloaded from the existing TRTP EIA website. As previously mentioned, many of the
PDF files listed on the website were scanned from hand-written physical forms. This makes it difficult
for machines to recognize and for users to review. To solve this problem, the comment data were
cleaned, geocoded and migrated to the geodatabase designed for this study.
4.2. Application Design and Implementation
During the design of the application prototype, this study initially created several high-level use
cases, sequence diagrams and mockup wireframes for the conceptual framework. Feedback was
collected from a small focus group, and the GUI was refined in several iterative cycles before the
design was finalized. The prototype application was eventually implemented using a free JavaScript API
template downloaded from Esri’s Local Government Resource Center (http://localgovtemplates2.esri.com/
MapsAndApps/). Additional technology, including ArcGIS Server 10.0 and SQL Server 2008
Standard R2 were utilized for map service publishing and geodatabase configuration. The prototype
application is currently hosted on a virtual machine at Claremont Graduate University
(http://134.173.236.123/PublicInfoCenter/default.htm).
For the five components outlined in the conceptual framework, the spatial component, the comment
component and the analysis component were instantiated on the application end user interface
(Figure 2 shows the instantiation for each of them); the data mining component was made available
through the backend geodatabase and geoprocessing tools; the mobile component was implemented
through a mobile project created in ArcGIS Mobile 10.0 and configured with the EIA project spatial
data. The user guide is also available through the help icon in the application.
5. Evaluation and Survey Design
After the application system was developed, an evaluation was conducted to determine if the
expected research goals were achieved. This section addresses the evaluation criteria, the survey
design and distribution process.

ISPRS Int. J. Geo-Inf. 2013, 2 488
Figure 2. Examples of the five components in SIPPS. (a) Spatial component example: a
public user can select a basemap (e.g., population density) from six options and review it
with other Environmental Impact Assessment (EIA) project information; (b) analysis
component example: a user can view multiple buffer rings on the map and click on a location
within the buffer to find out the distance from proposed project activities; (c) comment
component example: each red circle on the map represents a public comment; a user can
click red circles to review the comments submitted by others; (d) comment component
example: a user can submit a new comment with a picture attachment; (e) comment
component example: relevant live feeds from YouTube, Twitter and Flickr are retrieved
dynamically and displayed on the map; (f) mobile component example: a public user can
review EIA project data and post comments using a mobile device.
(a)
(b)
(c)

ISPRS Int. J. Geo-Inf. 2013, 2 489
Figure 2. Cont.
(d)
(e)
(f)
5.1. Evaluation Criteria
The term ―public participation‖ has various definitions depending on the areas and context [35], but
they all touch upon three distinct, yet interrelated, aspects of public rights: (1) the right of ―access to
ISPRS Int. J. Geo-Inf. 2013, 2 490
information‖, (2) the right of ―participation in decision-making‖ and (3) the right of ―access to
justice‖ [36]. Evaluation of the effectiveness of public participation can be difficult. Previous literature
points out that outcome and evaluation comprise two of the least understood aspects of PPGIS and that
metrics of PPGIS effectiveness have not been explored extensively by researchers [6]. Definitions of
effectiveness also vary. This study followed the definition outlined by Del Furia and Wallace-Jones:
―public involvement is effective when the goals of involving the public in the EIA procedure
are satisfied‖ [1] (p. 460).
This study considered three aspects when evaluating the effectiveness of the prototype system:
(1) the effectiveness of the prototype system in engaging public participation compared to the traditional
methods such as email and physical meetings; (2) the empowerment capability of the system in
educating the general public and promoting their environmental awareness; (3) system usability.
In selecting the indicators for evaluating the effectiveness of public participation in EIA, this study
considered three models from the literature. The first was proposed by Del Furia and Wallace-Jones [1].
The model suggested that the indicators chosen to evaluate the effectiveness of public participation in
EIA should be directly observable, objectively measurable or consist of evidence indicating that public
participation is pursued towards the goals of understanding the perception of proposed activities and
reaching consensus. Four themes were identified to influence the effectiveness of public participation
in EIA: the nature of the public involved, the amount of power the public is attributed in the
decision-making process by the techniques and methods used, the stage when the public is involved in
the procedure and the ability to manage conflict. The second model considered by this study is
De Steiguer’s framework that evaluated the effectiveness and acceptability of the public participation
process and included empowerment as a major factor in evaluating the effectiveness [37]. The
framework was based on four criteria: accessibility, fairness, comprehensibility and empowerment.
Thirdly, the analytical strategic environmental assessment (ANSEA) framework was considered by the
study, because it presented a methodology to evaluate the decision-making process and has been
recognized as a potential paradigm shift that drove environmental assessments to focus on analyzing
decision processes rather than the environmental consequences of decisions [38]. ANSEA criteria
included comprehensiveness, timeliness, transparency, participation and credibility [38]. In addition,
since a web-based prototype application was developed to assess the concept of the research
framework and was used as a platform to collect user feedback, the study also considered system
usability as part of the evaluation criteria. The System Usability Scale (SUS) was selected to evaluate
the usability of the prototype system because it provides a high-level subjective view of usability and
is often used in comparing and evaluating usability between systems [39]. SUS generally consists of
ten questions on a Likert scale of 1–5 and generates a single final score on a scale of 0–100. The final score
represents the overall usability of a system, and a higher score usually indicates better system usability.
5.2. Survey Design and Distribution
Based on a combination and transformation of the indicators and evaluation criteria outlined
previously, a survey questionnaire was designed to collect user feedback. The survey includes a
consent form, a brief introduction about the research objective and the TRTP project background and
four major sets of questions. The four question sets include: (1) Basic demographic information of the
ISPRS Int. J. Geo-Inf. 2013, 2 491
survey participants, which can be used later to analyze user characteristics, background and potential
segmentation. (2) A series of scenarios and tasks that comprise the main component of the survey. The
purpose is to help participants understand system functionality and evaluate the system more
accurately. Each scenario includes two parts: a step-by-step text description of a function in the context
of why it is useful and when it could be used and a diagram that demonstrates the workflow for users
to perform the function. After reading each scenario, a participant was asked to complete a task related
to their own situation (e.g., searching for a home address) and answer a few questions to evaluate the
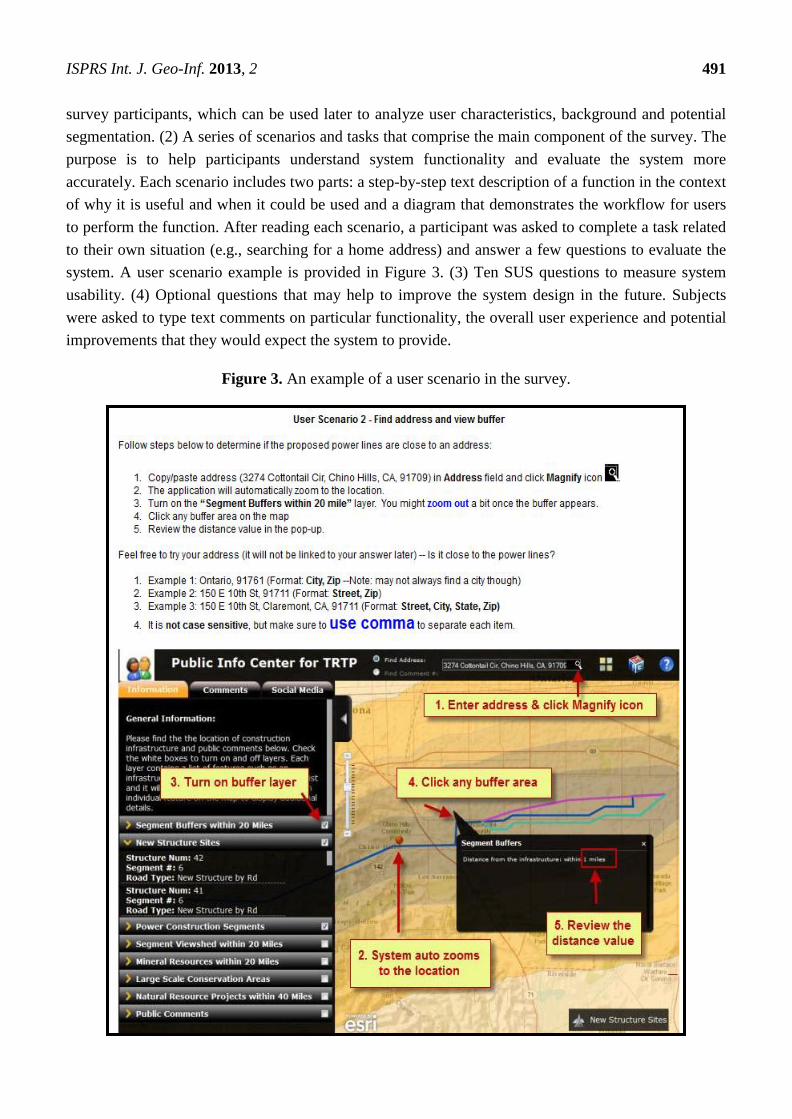
system. A user scenario example is provided in Figure 3. (3) Ten SUS questions to measure system
usability. (4) Optional questions that may help to improve the system design in the future. Subjects
were asked to type text comments on particular functionality, the overall user experience and potential
improvements that they would expect the system to provide.
Figure 3. An example of a user scenario in the survey.

ISPRS Int. J. Geo-Inf. 2013, 2 492
The survey was made available using an online survey tool—Qualtrics. To recruit general public
users, the study selected students and staff at Claremont Graduate University (CGU) and members of
the Los Angeles Chapter of the Sierra Club on a random basis. Email requests, including the link to the
online survey questionnaire, were sent out to the campus server list to recruit participants. The research
team also attended several classes in fall 2012 to present the study to students. In each class attended,
an overview presentation about the research problems, a demonstration of the existing TRTP website
and the new prototype system and a Q & A session were provided before the participants started the
survey. The online survey link was also posted on the Facebook Page of the Sierra Club in Los
Angeles to solicit feedback (after receiving consent from the Sierra Club). Participation was voluntary
and confidentiality of participants was ensured.
6. Results and Analysis
The study received 97 responses through the online survey questionnaire. Out of the 97 respondents,
12 of them only finished the demographic questions, but not the scenario questions. Therefore, they
were excluded, due to incompleteness, and the analysis below is primarily focused on the remaining 85
valid complete responses. Answers in some of the questions were re-coded so that the order or the
content of the survey answers would be more meaningful. The sections below present the feedback and
findings discovered from the survey conducted with public users.
6.1. Results for Demographic Questions
This section presents the results for the demographic questions. Age: 70% of the participants were
younger than 30, and only 2% were older than 56. Gender: 67% of the respondents were female, and
33% were male. In terms of educational level, 98% of the participants held graduate degrees or were
pursuing graduate degrees. When asked about their confidence level in using computers and the
Internet, 96% of the participants felt confident or very confident.
Since GIS and VGI are two of the major technologies used in this study, previous GIS experience
and social media usage were regarded as factors that could impact user evaluation of the prototype
system. The survey results showed that 71% of the respondents had heard about GIS before. When
asked the question ―How often do you use social media tools, such as Facebook, Twitter or Flickr‖,
80% indicated daily usage. As previously suggested, the sample population in this study consisted of a
young generation with higher education and confidence in computers and use of the Internet. Those
characteristics largely explain why daily usage of social media tools was selected as the dominant
answer. Again, statistics indicate that a web-based information system with VGI and social media
elements embedded can better suit the needs of this generation by providing equitable and immediate
data access using limited resources [26].
Since the research is related to EIA, the participants were asked to rate their familiarity with the
basic EIA process. The result shows that 74% of the respondents were not familiar with the basic
process of EIA. This reflects a pressing need to educate the general public on the EIA process, which
is also one of the objectives of this study. Furthermore, when asked the primary reason to not
participate in an EIA, 68% of the subjects selected that they were unaware of when and where to
participate in an EIA, and 21% chose that they did not have time to participate (see Figure 4). In the

ISPRS Int. J. Geo-Inf. 2013, 2 493
―Others (specify)‖ option, six participants answered that they did not know what an EIA was and two
indicated that they had never been asked to participate in an EIA. Again, the responses reflect
inadequate information distribution and dissemination in the EIA process and suggest that information
accessibility and time efficiency are two major factors that need to be improved towards promoting
public participation and environmental awareness.
Figure 4. Frequency table for Question 8: If you do not want to participate in an EIA, what
is the primary reason (check all that apply)?
6.2. Results for Scenario Questions
Table 1 provides a summary of the descriptive statistics for all the scenario questions in this survey.
Note that scenario questions were designed on a Likert scale of 1–4, with 1 being ―strongly disagree‖
and 4 being ―strongly agree‖. The ―neutral‖ option was purposely omitted, as the study wanted to
encourage the respondents to make a specific choice. In Table 1, Question 16 (willingness to
participate), 20 (transparency), 23 (willingness to comment), 28 (information accessibility) and 29
(effectiveness in promoting environmental awareness) depict a mean value greater than or equal to 3.0.
This indicates that the survey respondents on average agreed that the prototype system developed for
this study improved the effectiveness of public participation in these aspects.
Table 1. Descriptive statistics for the scenario questions.
Scenario Questions Mean Std. Deviation
10. The power segments information is useful to me in understanding
the project. 2.44 0.763
11. Viewing the buffer information helps me to understand the project. 2.75 0.722
12. Viewing the viewshed information helps me to understand the project. 2.73 0.697
13. The layers information helps me to understand the project and its
potential impact. 2.88 0.680
14. Viewing the Social Vulnerability Index Map helps me in understanding
the potential impact of the project. 3.00 0.690
15. Reviewing my neighbors’ comments improves my understanding about
the project. 2.99 0.645
16. Knowing that I can review my neighbor’s comments makes me more
willing to participate in the commenting process. 3.07 0.632
17. Knowing that I can share my comments with the public will promote
my participation in the project. 2.96 0.715

ISPRS Int. J. Geo-Inf. 2013, 2 494
Table 1. Cont.
Scenario Questions Mean Std. Deviation
18. Compared to the old system, this application helps me interact with
other public citizens. 2.89 0.598
19. Compared to the old system, I am more willing to mention or share this
application with my family and friends. 2.86 0.620
20. Sharing comments will improve the transparency of the project
EIA process. 3.19 0.607
22. I am more willing to submit my comments using this application than
using emails. 2.81 0.699
23. I am more willing to submit my comments using this application than
attending physical meetings. 3.28 0.750
24. I feel more flexible in expressing my ideas on the proposed project
using this application than using emails. 2.84 0.769
25. I will save more time in the EIA participation process using the
application than using email. 2.93 0.784
26. The information retrieved from the social media network improves my
understanding about the project. 2.78 0.713
27. Including the social media tools in the application makes me more
willing to participate in the project. 2.78 0.822
28. Compared to an FTP site, I am more able to access the TRTP
information with this website. 3.00 0.673
29. I think a website like this will be effective in promoting
environmental awareness. 3.07 0.651
A correlation analysis was also conducted on the scenario questions. A selection of findings at the
significance level of p < 0.01 are presented:
1. Questions 11, 12, 28 are all positively correlated to Question 25. Questions 11 and 12 ask if
providing buffer and viewshed information helps public users to improve their understanding
about the EIA project. Question 28 compares information accessibility between this prototype
website and the old TRTP project site, and Question 25 asks if using the new system will save
more time than email for a citizen to participate in the EIA process. The interpretation is that
the respondents agreed that a web-based application with better information accessibility and
presentation was likely to save them more time than emails in their EIA participation process.
As previously shown in Figure 4, 68% of the respondents did not know where and when an
EIA took place and 21% selected time as the primary reason to not participate in EIAs. This
suggests that the traditional participative methods failed to deliver satisfactory information
accessibility and time efficiency to the public users. With the old TRTP system, it was time
consuming for the public users to explore the lengthy EIA documents to obtain the specific
information they look for; with emails, they had to describe their particular situations in
abstract text. On the contrary, with the help of the new system, participants can now easily
review digital maps to capture a quick snapshot of the most concerned topics or locations and
then submit comments by simply clicking their concerned location on the map and filling out
the comment form electronically. Again the correlation suggests that the prototype system has
improved the information accessibility and time efficiency and, thus, the effectiveness of
public participation.
ISPRS Int. J. Geo-Inf. 2013, 2 495
2. Questions 12 and 26 are positively correlated to Question 28. Questions 12 and 26 are related
to providing viewshed information and social media feeds to public users, and Question 28
compares information accessibility of the new system with that of the original project website.
As previously mentioned in Section 6.1, 80% of the participants reported daily usage of social
media tools. Those tools can be a major information intake source in the user’s daily
information ingestion pattern; reading social media information may even become a habit.
Literature also suggested that many public service activities and environmental agencies are
currently faced with the challenge of budget cuts and personnel reduction, which led to a
limited public outreach [26]. A more active virtual community enabled by VGI and social
media tools is able to mitigate the burden on public outreach and benefit data collection and
information dissemination. Since the original TRTP EIA project site does not provide any
information such as viewshed and social media feeds to the public users, including this
additional information in the new system fits the daily information absorbing pattern of the
participants and, thus, improves information accessibility by providing instantaneous data
access in the EIA process.
Question 14 is positively correlated to Question 27 at the p < 0.01 level and to all of the
other scenario questions at the p < 0.05 level. Question 14 asks whether viewing the Social
Vulnerability Index Map is helpful for participants to understand the potential impact of the
project. Social vulnerability refers to sensitivity to the exposure, due to characteristics such
as age, low income, disability or home value [40]. This index helps to identify the areas of
relatively greater potential social economic impact from disaster or hazards on a county or
state level. The strong correlation between Question 14 and all other scenario questions can
be an indication that there is a concern for the EIA project’s social-economic impacts on
people’s perception towards risks and hazards surrounding them. Therefore, providing the
public with this information addresses this concern and will motivate people to participate
in EIA projects.
Questions 15–19 and 26 are all pertinent to sharing and interaction (through reviewing
neighbor comments, posting new comments, reaching out to family and friends or social
media tools), and they are positively correlated as well. This is an indication that providing
the public with the capability to review and share information in an interactive manner is an
effective way to improve public participation.
3. Questions 23 and 24 are positively correlated to Question 27. Questions 23 and 24 compare
flexibility and the comment submission method of the new system with the traditional public
participative methods (email and physical meetings), and Question 27 asks if including the
social media tools in the application increases user willingness to participate in the project. The
interpretation is that the users who agreed that including social media tools increased their
willingness to participate were more likely to agree that the new system was better than email
or physical meetings for them to participate in EIA. This interpretation again indicates that
including social media tools may promote user preference of the prototype over the traditional
participative methods and, thus, boost public participation in the EIA process.

ISPRS Int. J. Geo-Inf. 2013, 2 496
6.3. Results for SUS Questions
In the SUS analysis, the odd-numbered questions are phrased to describe system strengths, while
the even-numbered questions are phrased to describe system weakness, and as a result, the mean value
for the odd-numbered questions (Q31,33,35,37,39) should be reviewed differently than that of the
even-numbered questions (Q32,34,36,38,40): For the odd-numbered questions, a higher mean value
indicates better system usability; for the even-numbered questions, a lower mean implies less user
difficulties with a system (i.e., better system usability). Table 2 shows the frequency summary of the
answers to the SUS questions. It is broken down into two parts: on one hand, the mean values for all
the odd-numbered questions are over 2.8, and the mean values for Questions 33, 35 and 39 are over
3.0. These scores represent positive signs of system usability; the respondents agreed that the prototype
system was easy to use (Q33), functionally well integrated (Q35) and built up their confidence in the
system (Q39). On the other hand, two observations are noticed for the even-numbered questions:
(1) more respondents disagreed than agreed that the new system required technical support (Q34), was
inconsistent (Q34) or cumbersome to use (Q38). This is another indication of achieving good system
usability. (2) Regarding the complexity of the system (Q32) and that one needed to learn a lot before
continuing using the system (Q40), the number of respondents who disagreed and agreed on each side
was about the same.
Table 2. Frequency summary of the answers to system usability scale questions.
Question Strongly
Disagree Disagree Neutral Agree
Strongly
Agree
Total
Responses Mean
31. I think that I would like to
use this system frequently. 11 19 33 20 2 85 2.8
33. I thought the system was
easy to use. 6 13 27 34 5 85 3.22
35. I found the various
functions in this system were
well integrated.
2 6 26 47 4 85 3.53
37. I would imagine that most
people would learn to use this
system very quickly.
8 27 19 29 2 85 2.88
39. I felt very confident using
the system. 6 21 29 24 5 85 3.01
32. I found the system
unnecessarily complex. 9 20 26 25 5 85 2.96
34. I think that I would need
the support of a technical
person to be able to use this
system.
10 33 20 19 3 85 2.67
36. I thought there was too
much inconsistency in this
system.
7 41 26 8 3 85 2.52
38. I found the system very
cumbersome to use. 8 29 27 17 4 85 2.76
40. I needed to learn a lot of
things before I could get going
with this system.
7 26 18 25 9 85 3.04

ISPRS Int. J. Geo-Inf. 2013, 2 497
The final SUS score is also calculated, and the prototype system received a score of 53.96. In
general, a SUS score over 50.9 indicates good system usability [39]. Thus, it is considered that the
system usability of the prototype system achieved a satisfactory level.
6.4. Optional Questions Results
In addition to the questions mentioned above, the survey participants were asked to rate their
opinion on the impact of the TRPT proposed activities on the environment before and after they visited
the new website. The purpose of the two questions was to evaluate the educational and empowering
capability of the system and seek any possible change. As mentioned previously, one of the objectives
to engage the public in the EIA process is to create a knowledge base for informing and educating
people, and thus, empowerment was proposed as a criterion to evaluate the system. Figure 5 shows the
responses. It is noticed that before visiting the prototype system, 54% of the respondents (46) believed
that the TRTP project was not an issue and only 26% of respondents (22) believed that it had moderate
or severe impact on the environment. The mean value 1.81 also suggested that the project was on
average considered to have less than a minor impact on the environment. After visiting the website,
80% of the respondents (68) believed that the project had moderate or severe impact on the
environment and the mean value increased to 3.04. This indicates that the new prototype system has
successfully served the purpose of educating public users in understanding the selected EIA and
promoted their general environmental awareness towards the goal of empowerment.
The survey also asked the subjects if their home address was close to the proposed project activities,
if closeness changed their stand about the EIA project and to define closeness. Figure 6 shows that
76% agreed that closeness changed their position about the project after reviewing the relative location
of their home to the project. The rationale is that if a user realizes that an EIA project is in close
proximity (e.g., close to the user’s house), it is more likely that that they will attach more importance
to the project. Moreover, Figure 7 shows that 94% considered the distance of less than or equal to ten
miles as ―close‖, and the mean value is 5.45 miles. This result suggests that the population who is most
likely to participate in an EIA is distributed within the radius of ten miles from the proposed project
activities. Consequently, if an EIA wants to promote public participation, information dissemination
activities should target the public users within this distance.
Figure 5. The responses to Question 30: What was your opinion on the impact of the
TRTP proposed activities on the environment? (Coding: 1—Not an issue; 2—Minor
impact; 3—Moderate impact; 4—Major impact; 5—Severe impact).

ISPRS Int. J. Geo-Inf. 2013, 2 498
Figure 6. The response to Question 2b-1: Does closeness change your stand about
the project?
Figure 7. Frequency summary of the responses to Question 2b-2: Define closeness.
6.5. Reliability Analysis
To evaluate whether the questionnaire measured the effectiveness of public participation in a reliable
manner, a Cronbach’s alpha was calculated to determine the extent to which the scenario questions in the
questionnaire were related to each other. Generally, a Cronbach’s alpha value above 0.7 is acceptable,
and a higher value is considered to have better reliability. The 20 scenario questions in the survey
received a Cronbach’s alpha value of 0.863, which suggests a good level of internal consistency.
7. Limitations and Remarks
The study has received not only positive feedback, but also raised interesting questions. A few
participants expressed concerns about the quality of comments and social media contents collected
from the SIPPS prototype system. Comments submitted electronically can be redundant, irrelevant or
even malicious. Similarly, the social media contents displayed on the application map viewer are
dynamically retrieved from the corresponding social media networks and can contain inappropriate or
irrelevant information. A more fundamental problem related to this is the credibility of VGI. VGI
content generally consists of three forms: personal opinions (e.g., user comments), objective or factual
information (e.g., a photo or video pointing to a particular location), and measurements (e.g., GPS
readings) [41]. Although VGI has the strength of collecting local information from a large number of
2 (7%)
6 (21%)
2 (7%)
9 (31%)
8 (28%)
1 (3%)
1 (3%)
0 2 4 6 8 10
1
2
3
5
10
20
30
Define Closeness - # of Responses
# of Responses
Distance

ISPRS Int. J. Geo-Inf. 2013, 2 499
citizens, the content generated from collective mapping approaches is often produced by non-experts,
and the process usually lacks standardization and coordination of authorities and professionals [21].
The strength is, thus, a double-edged sword that also becomes its major challenge that causes data
quality problems [42]. Data quality is compromised when the user-generated content is subjective,
unstructured, poorly documented, insufficiently referenced or validated without scientific screening [43].
Data quality can also be impaired due to missing, inconsistent or conflicting values [44]. Therefore,
how to integrate participatory mapping techniques especially collective mapping approaches into more
formal governance adds another dimension of complexity to the VGI credibility problem. Since
collective mapping approaches normally take place when users participate in the data contribution
process, strategies are suggested to tackle the complexity challenge from three angles: contributor, data
and the contribution process. First, local users or community volunteers can be recruited to screen VGI
content and serve as gate-keepers to improve the data quality [45]. Since these contributors are often
familiar with the surrounding environment or local events, they are more likely to collaboratively
validate the VGI content and identify missing or conflicting data. Moreover, literature suggests that
integrating the capability of commenting on VGI submission may improve public understanding, data
quality and the knowledge base [21]. The design of the SIPPS framework is aligned with this
suggestion. The comment component in SIPPS provides citizens with the ability to submit new
comments, review comments, comment on existing posts and rate comments. The survey results also
indicated that by providing this interactive functionality, the comment component increased user
confidence in the EIA process transparency and willingness to access and share information. It is
therefore believed that SIPPS can help overcome the VGI credibility issue and formalize the data
collection framework. Nevertheless, it should be noted that this strategy assumes that the recruited
contributors are from the local community or have knowledge about the local environments [28]. To
validate that they possess the local intelligence, a brief test is suggested to evaluate user knowledge of
the related topic or environmental condition [28]. For instance, if the goal of an EIA project is to
determine a new power station site in a park, a possible evaluation might involve participants to
identify locations of major park features on a map to confirm their familiarity with the area. Note that
this research also recognizes that the self-evaluation step could add extra overhead to the existing
process and may lessen a user’s enthusiasm to participate.
Second, data quality issues in collective mapping may be alleviated by leveraging the power of
social media networks and crowdsourcing. Social media networks generate a large number of live
feeds on a continuous basis and within a short turnaround time. Although individual feeds can have
uncertain quality, data abundance provides an opportunity for grass roots participation to perform
cross-validation with considerable VGI content [43]. With this strategy, inputs are aggregated from
numerous individuals or sources, and the relevance of the output VGI clusters are evaluated by the
contributors in a given context [46]. As a result, more reliable information can be extracted for better
data quality. The SIPPS framework responds to this strategy by integrating social media tools in the
comment component. The social media tools retrieve live feeds with predefined keywords from social
media networks (YouTube, Twitter and Flickr) and display them on a map. By allowing the crowd to
review multiple feeds from various sources, SIPPS provides participants with an opportunity to
corroborate the information using crowd wisdom. The content retrieved from social media tools can
still be irrelevant, and that is why data mining was proposed as part of the SIPPS framework with the

ISPRS Int. J. Geo-Inf. 2013, 2 500
goal to identify interesting patterns and filter out unwanted or undesirable entries in an automatic
fashion. It is also believed that content filtering should be part of the monitoring process of the EIA
responsible agencies if they choose to employ a production web system similar to SIPPS to support the
EIA process. It is therefore recommended that the EIA agencies delegate an administrator to steward
the data contents and manually remove any inappropriate information. Furthermore, a rating
mechanism is considered one type of new arbiter of VGI credibility for bottom-up approaches
implemented through collaborative efforts [21]. Since VGI content in many cases represents personal
opinion or observation rather than scientific data, an objective notion of data quality or accuracy by
itself does not seem entirely suitable to assess this type of information [21]. Instead, methods that can
reflect people’s perception and response to specific scenarios or cultural, political and economic
conditions are more appropriate [11]. With regard to the SIPPS prototype, it introduced rating
functionality in the comment component for users to examine the more subjective VGI contents. The
rating mechanism makes it possible for comments with higher ratings to draw close attention.
Collaborative rating on a large scale may also contribute to elimination of inaccurate values. One of
the survey respondents suggested that SIPPS include the ―Like‖ functionality (as can be found on
Facebook) in the comment component as another dimension for users to examine VGI contents. This
suggestion is actually being considered as an area for future work.
In addition to improving the management of contributors and data, the contribution process should be
regulated such that the data collection and production chain can operate in a more controllable manner [47].
A series of standards, methods and techniques need to be established to streamline VGI content generation,
specify boundaries for data requirements, data ownership, data management and distribution, participant
recruitment and address possible responsibility and ethical concerns [21,41,48]. The establishment of this
discipline may progress gradually and formalization of governance may limit the freedom of
contributors to some extent. To achieve the best outcome, a balance must be maintained between
allowing contributor freedom and compliance with necessary specifications [49]. Similarly, a more
comprehensive way to deal with VGI content is to assess each given scenario (e.g., an EIA alternative)
with data from both authoritative origins and non-expert VGI sources [50].
Another interesting finding that emerged from the survey is the adoption of collaborative mapping
techniques into the decision-making process. Evidence from the survey results show that collaborative
mapping techniques have the following advantages over other traditional participatory methods in the
EIA process: First, the spatial element provided by collaborative mapping has the strength of
visualizing geographic features that may not be effectively demonstrated through other interfaces or
information sources. Spatial analysis also facilitates early identification of environmental alternatives
and problems. Second, findings from the survey (Question 30—What is your opinion about the EIA
project before and after visiting the website?) suggested that spatial presentation along with the content
sharing and interacting capability can disclose environmental facts and change perceptions on
activities and problems. Not only is this valuable to the public in promoting understanding and social
learning, but also to EIA decision makers in managing public expectation and mitigating potential conflicts
that may happen later in the EIA process. This study identified three major factors that impact the adoption
of collaborative mapping techniques in the EIA process: cost, time and outcome. A number of respondents
indicated that they would like to know the budget for each EIA alternative and the expense to implement
the SIPPS solution. With the current situation of budget cuts and personnel reduction in many

ISPRS Int. J. Geo-Inf. 2013, 2 501
environmental agencies and public services, it is important that a solution fits into the EIA process with
reasonable cost. SIPPS meets this requirement by providing a reusable application template that can be
configured and deployed with manageable cost and effort to support similar environmental projects.
Although a few commercial-off-the-shelf software products were used in its development, data and map
services used in the framework can alternatively be published and hosted through cost-reduced packages
designed for organizations, especially environmental and humanitarian institutions.
The time factor is about when to participate and whether a solution will improve time efficiency in
EIA. Most survey respondents recognized that SIPPS reduced the time required to participate in the
EIA process. From the decision-making side, concern was raised about the timeframe constraint in the
EIA public reviewing phase. One respondent acknowledged the benefits of SIPPS in increasing
environmental awareness and improving public participation in the EIA scoping phase, but was
concerned that the application might make the public reviewing process unnecessarily elongated and
delay the final decision process, due to the extra volume of comments that need to be analyzed and
additional back-and-forth conversation and negotiation. The study recognized this concern as a
possibility and an important factor for the acceptance of collaborative mapping approaches in
decision-making, but since the main goal of the study is to improve the effectiveness of public
participation in EIA, how to handle the situation is beyond the scope of this research.
Outcome is also considered as a significant factor that influences the adoption of collaborative
mapping approaches in EIA decision-making. User feedback in the survey suggested three aspects to
cover outcome: uncertainty, diversity and conflict. As previously mentioned, VGI credibility is a major
challenge that causes uncertainty. Aggregating crowd wisdom is able to help verify general
information and enhance information provided by authorities. Reducing data fluctuation between good
and bad will minimize uncertainty and increase the confidence of decision makers in undertaking a
VGI solution. Furthermore, one of the fundamental goals of involving the public in EIA is to empower
marginalized groups and establish a more equitable decision structure across the distribution of
political power [51]. Ideally, the EIA participatory process should account for common views shared
by individuals or representatives of various groups [4]. Therefore, diversity becomes a consideration
for decision makers to accept collaborative approaches. Collaborative mapping approaches, on one
hand, provide more flexibility by releasing people from spatial and temporal constraints of attending
physical meetings (Feedback in Questions 23 and 24 confirmed this finding); on the other hand, VGI
contents are often presented through a web-based interface, which can create a participation barrier for
people who lack computer literacy and Internet access. This limitation is known as the ―digital divide‖ [52].
In terms of conflict, a desirable participatory method should support decision makers to prioritize
concerns, communicate outcomes and manage conflicts. Before decisions are made on EIA projects,
risk and impact analysis of each alternative needs to be conducted. VGI content that reflects local
intelligence and creativity not only assists decision makers in identifying alternatives, but also allows
them to explore various options and discover better solutions. In SIPPS, this is realized by the spatial
feature editing function and comment responding capability. Once a decision is made or project
activities are under development, the progress and outcome must be communicated to the public.
Collaborative mapping approaches are capable of distributing the information in a timely manner to a
large population via the web and the mobile platform. In SIPPS, a map viewer on both the web and the
mobile interface is provided for decision makers to inform and collect feedback from the public. The

ISPRS Int. J. Geo-Inf. 2013, 2 502
social and political interaction enabled by collaborative mapping approaches between decision makers
and the public also represents a more proactive way to avoid and resolve conflicts, because it
demonstrates a sense of ownership on issues, a traceable sequence to address concerns and mutual
understanding of legal requirements, values, perceptions and interest of involved parties.
Besides the above challenges, it is recognized that the study sample size is limited and some of the
inferences discovered from the research sample may not be generalized to a larger population. The
results can be skewed towards younger, more educated people who are computer literate. Responses
indicated that the older generation, who may not have computer skills and access to social media tools,
were usually more concerned about the impacts of EIA activities (especially the impact on health and
safety) and, thus, more likely to participate in EIAs.
Lastly, while the study produced a conceptual framework and a prototype system to improve the
effectiveness of public participation in EIA, it does not recommend completely abandoning the
traditional methods. One respondent pointed out that she would use both the traditional methods and a
website, like the one designed in this research, to raise her voice if an EIA was really concerning her.
Therefore, a combination of both instruments may generate a better outcome and benefit the citizens to
the greatest extent.
8. Contributions and Conclusions
This study presented a five-component conceptual framework, with the goal to improve the
effectiveness of public participation in the EIA process. A web-based spatially intelligent public
participation system (SIPPS) was designed and implemented as a prototype to assess the concept.
Survey questionnaires and user scenarios were used to collect user feedback and evaluate the system.
Results have shown that compared to the traditional methods, SIPPS was able to improve multiple
effectiveness criteria, such as information accessibility, collaborative and sharing capability,
willingness to participate and transparency. It was also successful in promoting user environmental
awareness and improving system usability.
The major contribution of this research is three-fold: First, it uniquely combined GIS, VGI, social
media tools, data mining and mobile technology from multiple dimensions in designing the conceptual
framework to improve public participation in the EIA process. This has not been found in any of the
previous literature reviewed in the information systems or environmental academic community.
Second, the conceptual framework and the prototype system designed in this study are generic enough
to be utilized as a template to benefit other environmental projects similar to the selected case study.
The conceptual framework is scalable and the application template can be configured and deployed
with reasonable cost and effort to meet the needs of local governments and agencies in enhancing
public participation in other environmental projects. Third, from the empowerment perspective, not
only will the framework and the system serve as an instrument to educate the public in understanding a
particular EIA project, but it will also contribute to the formulation of a collective knowledge base
regarding public participation in policy making, enhancing trust and, ultimately, the development of a
sustainable society.

ISPRS Int. J. Geo-Inf. 2013, 2 503
Acknowledgments
We would like to thank the support received from the following CGU faculty members:
Hal Nelson, Lorne Olfman, June Hilton and Tom Horan.
Conflict of Interest
The authors declare no conflict of interest.
References
1. Del Furia, L.; Wallace-Jones, J. The effectiveness of provisions and quality of practices
concerning public participation in EIA in Italy. Environ. Impact Asses. 2000, 20, 457–479.
2. Qin, X.; Tao, C. Analysis of Public Constructoin and the Use of Envrionmental Information. In
Proceedings of International Conference on Mechanic Automation and Control Engineering
(MACE), Wuhan, China, 26–28 June 2010; pp. 1948–1951.
3. Lowndes, V.; Pratchett, L.; Stoker, G. Trends in public participation: Part 1—Local government
perspectives. Public Admin. 2001, 79, 205–222.
4. Gonzalez, A.; Gilmer, A.; Foley, R.; Sweeney, J.; Fry, J. Technology-aided participative methods
in environmental assessment: An international perspective. Comput. Environ. Urban 2008, 32,
303–316.
5. Harris, T.; Weiner, D. GIS and Society: The Social Implications of How People, Space, and
Environment are Represented in GIS. Available online: www.ncgia.ucsb.edu/Publications/
Tech_Reports/96/96–7.PDF (accessed on 13 January 2013).
6. Sieber, R. Public participation geographic information systems: A literature review and
framework. Ann. Assoc. Am. Geogr. 2006, 96, 491–507.
7. Al-Kodmany, K. GIS and the Artist: Shaping the Image of a Neighbourhood in Participatory
Environmental Design. In Community Participation and Geographic Information Systems, 1st ed.;
Craig, W.J., Harris, T.M., Weiner, D., Eds.; Taylor and Francis: New York, NY, USA, 2002;
pp. 320–329.
8. Bojórquez-Tapia, L.; Díaz-Mondragón, S.; Ezcurra, E. GIS-based approach for participatory
decision making and land suitability assessment. Int. J. Geogr. Inf. Sci. 2001, 15, 129–151.
9. Kingston, R.; Carver, S.; Evans, A.; Turton, I. Web-based public participation Geographical
Information Systems: An aid to local environmental decision-making. Comput. Environ. Urban
2000, 24, 109–125.
10. Haklay, M.E. Public access to environmental information: Past, present and future.
Comput. Environ. Urban 2003, 27, 163–180.
11. Stefanidis, A.; Crooks, A.; Radzikowski, J. Harvesting ambient geospatial information from social
media feeds. Environ. Manage. 2012, 49, 816–832.
12. Yap, L.F.; Bessho, M.; Koshizuka, N.; Sakamura, K. User-Generated Content for Location-Based
Services: A Review. In Virtual Communities, Social Networks and Collaboration;
Lazakidou, A.A., Ed.; Springer Science: New York, NY, USA, 2012; Vo1ume 15, p. 163.
ISPRS Int. J. Geo-Inf. 2013, 2 504
13. Howe, J. The Rise of Crowdsourcing. Available online: http://www.wired.com/wired/archive/
14.06/crowds.html (accessed on 13 January 2013).
14. Brabham, D.C. Crowdsourcing as a model for problem solving: An introduction and cases. Int. J.
Res. New Media Technol. 2008, 14, 75–90.
15. Committee on New Research Directions for the National Geospatial-Intelligence Agency;
Mapping Science Committee; Board on Earth Sciences and Resources; Division on Earth and Life
Studies. Workshop on New Research Directions for the National Geospatial-Intelligence Agency,
1st ed.; The National Academies Press: Washington, DC, USA, 2010; pp. 2–3. Available online:
http://www.nap.edu/catalog.php?record_id=12964 (accessed on 13 January 2013).
16. Goodchild, M.F. NeoGeography and the nature of geographic expertise. J. Locat. Based Serv.
2009, 3, 82–96.
17. Núñez-Redó, M.; Díaz, L.; Gil, J.; González, D.; Huerta, J. Discovery and Integration of Web 2.0
Content into Geospatial Information Infrastructures: A Use Case in Wild Fire Monitoring. In
Proceedings of the IFIP WG 8.4/8.9 International Cross Domain Conference on Availability,
Reliability, and Security for Business, Enterprise and Health Information Systems, Vienna,
Austria, 22–26 August 2011; Tjoa, A.M., Oqirchmayr, G., You, I., Xu, L., Eds.; Springer-Verlag:
Vienna, Austria, 2011; pp. 50–68.
18. Goodchild, M.F. Citizens as voluntary sensors: Spatial data infrastructure in the world of Web 2.0.
Int. J. Spat. Data Infrastruct. Res. 2007, 2, 24–32.
19. Tulloch, D.L. Many Many Maps: Empowerment and Online Participatory Mapping. Available
online: http://firstmonday.org/htbin/cgiwrap/bin/ojs/index.php/fm/article/view/1620/1535 (accessed
on 13 January 2013).
20. Turner, A.J. Introduction to Neogeography; O’Reilly Media: Sebastopol, CA, USA, 2006; pp. 2–3.
21. Flanagin, A.J.; Metzger, M.J. The credibility of volunteered geographic information. GeoJournal
2008, 72, 137–148.
22. Belimpasakis, P.; Saaranen, A. Sharing with people: A system for user-centric content sharing.
Multimed. Syst. 2010, 16, 399–421.
23. Daz, L.; Granell, C.; Gould, M.; Huerta, J. Managing user-generated information in geospatial
cyber infrastructures. Future Gener. Comput. Syst. 2011, 27, 304–314.
24. Creighton, J. The Public Participation Handbook: Making Better Decisions through Citizen
Involvement, 1st ed.; Jossey-Bass: San Francisco, CA, USA, 2005; p. 244.
25. Ho, S.; Rajabifard, A. Learning from the Crowd: The Role of Volunteered Geographic
Information in Realising a Spatially Enabled Society. In Proceedings of GSDI 12 World
Conference—Realising Spatially Enabled Societies, Singapore, 19–22 October 2010.
26. Werts, J.D.; Mikhailova, E.A.; Post, C.J.; Sharp, J.L. An integrated WebGIS framework
for volunteered geographic information and social media in soil and water conservation.
Environ. Manage. 2012, 49, 816–832.
27. Danielsen, F.; Burgess, N.D.; Jensen, P.M.; Pirhofer-Walzl, K. Environmental monitoring: The
scale and speed of implementation varies according to the degree of peoples involvement. J. App.
Ecol. 2010, 47, 1166–1168.
28. Seeger, C.J. The role of facilitated volunteered geographic information in the landscape planning
and site design process. GeoJournal 2008, 72, 199–213.

ISPRS Int. J. Geo-Inf. 2013, 2 505
29. Kelly, M.; Tuxen, K.; Kearns, F. Geospatial informatics for management of a new forest disease:
Sudden oak death. Photogramm. Eng. Remote Sensing 2004, 70, 1001–1004.
30. Eick, C.; Vaezian, B.; Jiang, D.; Wang, J. Discovery of Interesting Regions in Spatial Datasets
Using Supervised Clustering. In Proceedings of the 10th European Conference on Principles
and Practice of Knowledge Discovery in Databases, Berlin, Germany, 18–22 September 2006;
pp. 127–138.
31. Rzhetsky, A.; Seringhaus, M.; Gerstein, M.B. Getting started in text mining: Part two. PLoS
Comput. Biol. 2009, 5, doi: 10.1371/journal.pcbi.1000411.
32. Maue, P.; Schade, S. Data integration in the geospatial semantic web. J. Cases Inf. Technol. 2009,
11, 100–122.
33. Gao, L.; Chang, E.; Han, S. Powerful tool to expand business intelligence: Text mining. World
Acad. Sci. Eng. Technol. 2005, 8, 110–115.
34. Glasson, J.; Therivel, R.; Chadwick, A. Introduction to Environmental Impact Assessment,
3rd ed.; Routledge: New York, NY, USA, 2005; p. 127.
35. Bishop, P.; Davis, G. Mapping public participation in policy choices. Aust. J. Publ. Admin. 2006,
61, 14–29.
36. Pring, G.; Noe, S.Y. The Emerging International Law of Public Participation Affecting Global
Mining, Energy and Resource Development. In Human Rights in Natural Resource Development:
Public Participation in the Sustainable Development of Mining and Energy Resources, 1st ed.;
Zillman, D.M., Lucas, A., Pring, G., Eds.; Oxford University Press: New York, NY, USA, 2002;
pp. 11–76.
37. De Steiguer, J.E. Evaluating the Effectiveness of Multi-Criteria Decision Models for Improving
Public Participation; Accession No. 0194153. Available online: http://www.reeis.usda.gov/web/
crisprojectpages/194153.html (accessed on 29 July 2012).
38. Pischke, F.; Cashmore, M. Decision-oriented environmental assessment: An empirical study of its
theory and methods. Environ. Impact Asses. 2006, 26, 643–662.
39. Bangor, A.; Kortum, P.T.; Miller, J.A. An empirical evaluation of the System Usability Scale
(SUS). Int. J. Human-Comput. Interact. 2008, 24, 574–594.
40. Cutter, S.L.; Mitchell, J.T.; Scott, M.S. Revealing the vulnerability of people and places: A case
study of Georgetown County, South Carolina. Ann. Assn. Amer. Geogr. 2000, 90, 713–737.
41. Gouveia, C.; Fonseca, A. New approaches to environmental monitoring: The use of ICT to
explore volunteered geographic information. GeoJournal 2008, 72, 185–197.
42. Elwood, S. Volunteered geographic information key questions, concepts and methods to guide
emerging research and practice. GeoJournal 2008, 72, 133–135.
43. Schade, S.; Díaz, L.; Ostermann, F.; Spinsanti, L.; Luraschi, G.; Cox, S.; Nuñez, M.;
de Longueville, B. Citizen-based sensing of crisis events: Sensor web enablement for volunteered
geographic information. Appl. Geomat. 2011, 5, 3–18.
44. Yanenko, O.; Schilieder, C. Enhancing the Quality of Volunteered Geographic Information: A
Constraint-Based Approach. In Bridging the Geographic Information Sciences; Gensel, J.,
Josselin, D., Vandenbroucke, D., Eds.; Springer-Verlag: Berlin/Heidelberg, Germany, 2012;
pp. 429–446.

ISPRS Int. J. Geo-Inf. 2013, 2 506
45. Bishr, M.; Mantelas, L. A trust and reputation model for filtering and classifying knowledge about
urban growth. GeoJournal 2008, 72, 229–237.
46. Mummidi, L.; Krumm, J. Discovering points of interest from users’ map annotations. GeoJournal
2008, 72, 215–227.
47. Lee, V. Volunteer Monitoring: A Brief History. Available online: http://water.epa.gov/type/rsl/
monitoring/upload/2004_10_13_monitoring_volunteer_newsletter_volmon06no1.pdf (accessed
on 2 April 2013).
48. De Longueville, B.; Annoni, A.; Schade, S.; Ostländer, N.; Whitmore, C. Digital Earth’s nervous
system for crisis events: Real-time sensor web enablement of Volunteered Geographic
Information. Int. J. Digital Earth 2010, 3, 242–259.
49. Girres, J.-F.; Touya, G. Quality assessment of the French OpenStreetMap dataset. Trans. GIS
2010, 14, 435–459.
50. Connors, J.P.; Lei, S.; Kelly, M. Citizen science in the age of Neogeography: Utilizing
volunteered geographic information for environmental monitoring. Ann. Assn. Amer. Geogr.
2012, 102, 1267–1289.
51. O’Faircheallaigh, C. Public participation and environmental impact assessment: Purpose,
implications, and lessons for public policy making. Environ. Impact Asses. 2010, 30, 19–27.
52. Oden, M.D.; Lentz, R.G. Digital divide or digital opportunity in the Mississippi delta region of the
US. Telecommun. Policy 2001, 25, 291–313.
© 2013 by the authors; licensee MDPI, Basel, Switzerland. This article is an open access article
distributed under the terms and conditions of the Creative Commons Attribution license
(http://creativecommons.org/licenses/by/3.0/).