A spatial neural fuzzy network for estimating pan evaporation at ...
12
Hydrol. Earth Syst. Sci., 16, 255–266, 2012 www.hydrol-earth-syst-sci.net/16/255/2012/ doi:10.5194/hess-16-255-2012 © Author(s) 2012. CC Attribution 3.0 License. Hydrology and Earth System Sciences A spatial neural fuzzy network for estimating pan evaporation at ungauged sites C.-H. Chung, Y.-M. Chiang, and F.-J. Chang Department ofBioenvironmental Systems Engineering, National Taiwan University, Taipei 10617, Taiwan Correspondence to: F.-J. Chang ([email protected]) Received: 14 October 2011 – Published in Hydrol. Earth Syst. Sci. Discuss.: 3 November 2011 Revised: 11 January 2012 – Accepted: 13 January 2012 – Published: 25 January 2012 Abstract. Evaporation is an essential reference to the man- agement of water resources. In this study, a hybrid model that integrates a spatial neural fuzzy network with the kring- ing method is developed to estimate pan evaporation at un- gauged sites. The adaptive network-based fuzzy inference system (ANFIS) can extract the nonlinear relationship of ob- servations, while kriging is an excellent geostatistical inter- polator. Three-year daily data collected from nineteen me- teorological stations covering the whole of Taiwan are used to train and test the constructed model. The pan evapora- tion (E pan ) at ungauged sites can be obtained through sum- ming up the outputs of the spatially weighted ANFIS and the residuals adjusted by kriging. Results indicate that the pro- posed AK model (hybriding ANFIS and kriging) can effec- tively improve the accuracy of E pan estimation as compared with that of empirical formula. This hybrid model demon- strates its reliability in estimating the spatial distribution of E pan and consequently provides precise E pan estimation by taking geographical features into consideration. 1 Introduction Evaporation is one of the main elements that affect water storage and temperature in the hydrological cycle. An ac- curate estimation of evaporation is crucial for the manage- ment of agricultural irrigation, water balance and soil con- servation. However, it is difficult to effectively simulate its variation due to the complex interactions between land and atmosphere systems. In previous hydrological applications, a number of direct and indirect methods were applied to the measurement and estimation of evaporation. One direct method was to use evaporation pans to accumulate the total amount of evaporation at a specific location during an obser- vation period, while indirect methods such as mass transfer and empirical equations had difficulty in identifying the most suitable equation that best fits the wide range of data types. Those problems should be explored through better models that could satisfy inherently nonlinear systems. Artificial neural networks (ANNs) are an adaptive system that adjusts its structure according to the given input-output patterns. The nonlinear characteristics of ANNs often serve as a viable tool for physical or stochastic models in vari- ous hydrological fields (Antar et al., 2006; Chen and Chang, 2009; Chiang and Chang, 2009; Chang et al., 2005; Kim and Barros, 2001). In recent years, the applications of ANN to evaporation estimation were presented in many studies (Tra- jkovic et al., 2003; Keskin and Terzi, 2006; Kisi, 2006; Kisi and Ozturk, 2007; Gonzalez-Camacho et al., 2008; Chang et al., 2010). In general, those applications of ANN-based models could only produce point estimates. Therefore, how to extend the applicability of ANN models from point esti- mation to spatial estimation would be an important scientific issue because ANNs are not distributed models but lumped models. Therefore, it will be of great help if ANNs can com- bine geostatistical methods such as kriging for estimating the spatial distribution of evaporation. In addition, Choudhury et al. (1994), Xu et al. (2006) and McVicar et al. (2007) had discussed the relationship between reference evapotranspi- ration (ET 0 ) and pan evaporation (E pan ) to obtain the pan coefficient (K pan ) in spatial interpolation issues. Published by Copernicus Publications on behalf of the European Geosciences Union.
Transcript of A spatial neural fuzzy network for estimating pan evaporation at ...

Hydrol. Earth Syst. Sci., 16, 255–266, 2012www.hydrol-earth-syst-sci.net/16/255/2012/doi:10.5194/hess-16-255-2012© Author(s) 2012. CC Attribution 3.0 License.
Hydrology andEarth System
Sciences
A spatial neural fuzzy network for estimating pan evaporation atungauged sites
C.-H. Chung, Y.-M. Chiang, and F.-J. Chang
Department of Bioenvironmental Systems Engineering, National Taiwan University, Taipei 10617, Taiwan
Correspondence to:F.-J. Chang ([email protected])
Received: 14 October 2011 – Published in Hydrol. Earth Syst. Sci. Discuss.: 3 November 2011Revised: 11 January 2012 – Accepted: 13 January 2012 – Published: 25 January 2012
Abstract. Evaporation is an essential reference to the man-agement of water resources. In this study, a hybrid modelthat integrates a spatial neural fuzzy network with the kring-ing method is developed to estimate pan evaporation at un-gauged sites. The adaptive network-based fuzzy inferencesystem (ANFIS) can extract the nonlinear relationship of ob-servations, while kriging is an excellent geostatistical inter-polator. Three-year daily data collected from nineteen me-teorological stations covering the whole of Taiwan are usedto train and test the constructed model. The pan evapora-tion (Epan) at ungauged sites can be obtained through sum-ming up the outputs of the spatially weighted ANFIS and theresiduals adjusted by kriging. Results indicate that the pro-posed AK model (hybriding ANFIS and kriging) can effec-tively improve the accuracy ofEpan estimation as comparedwith that of empirical formula. This hybrid model demon-strates its reliability in estimating the spatial distribution ofEpan and consequently provides preciseEpan estimation bytaking geographical features into consideration.
1 Introduction
Evaporation is one of the main elements that affect waterstorage and temperature in the hydrological cycle. An ac-curate estimation of evaporation is crucial for the manage-ment of agricultural irrigation, water balance and soil con-servation. However, it is difficult to effectively simulate itsvariation due to the complex interactions between land andatmosphere systems. In previous hydrological applications,a number of direct and indirect methods were applied to
the measurement and estimation of evaporation. One directmethod was to use evaporation pans to accumulate the totalamount of evaporation at a specific location during an obser-vation period, while indirect methods such as mass transferand empirical equations had difficulty in identifying the mostsuitable equation that best fits the wide range of data types.Those problems should be explored through better modelsthat could satisfy inherently nonlinear systems.
Artificial neural networks (ANNs) are an adaptive systemthat adjusts its structure according to the given input-outputpatterns. The nonlinear characteristics of ANNs often serveas a viable tool for physical or stochastic models in vari-ous hydrological fields (Antar et al., 2006; Chen and Chang,2009; Chiang and Chang, 2009; Chang et al., 2005; Kim andBarros, 2001). In recent years, the applications of ANN toevaporation estimation were presented in many studies (Tra-jkovic et al., 2003; Keskin and Terzi, 2006; Kisi, 2006; Kisiand Ozturk, 2007; Gonzalez-Camacho et al., 2008; Changet al., 2010). In general, those applications of ANN-basedmodels could only produce point estimates. Therefore, howto extend the applicability of ANN models from point esti-mation to spatial estimation would be an important scientificissue because ANNs are not distributed models but lumpedmodels. Therefore, it will be of great help if ANNs can com-bine geostatistical methods such as kriging for estimating thespatial distribution of evaporation. In addition, Choudhury etal. (1994), Xu et al. (2006) and McVicar et al. (2007) haddiscussed the relationship between reference evapotranspi-ration (ET0) and pan evaporation (Epan) to obtain the pancoefficient (Kpan) in spatial interpolation issues.
Published by Copernicus Publications on behalf of the European Geosciences Union.

256 C.-H. Chung et al.: A spatial neural fuzzy network for estimating pan evaporation at ungauged sites
35
522
Fig. 1. Architecture of an ANFIS model with seven fuzzy rules for evaporation
estimation. W, S, R, T, H and D are wind speed, sunshine hour, radiation,
temperature, humidity and dew point temperature, respectively.
523
Fig. 1. Architecture of an ANFIS model with seven fuzzy rulesfor evaporation estimation.W , S, R, T , H and D are windspeed, sunshine hour, radiation, temperature, humidity and dewpoint temperature, respectively.
The aforementioned research provided evidences of theestimation and/or prediction of evaporation only at gaugedsites using ANNs. In this study, a hybrid computationalmodel is proposed by combining the ANN and kriging forestimating the evaporation at ungauged sites. Kriging hasbeen recognized as a geostatistical tool for interpolating thevalue at a random location based on nearby information andhas been applied to problems in hydrological fields (Schuur-mans et al., 2007; Chen, 2008; Neuman and Jacobson, 1984;Legleiter, 2008). A number of studies have investigated theapplicability of neural networks with geostatistics to envi-ronment, such as fallout (Kanevsky et al., 1996), tempera-ture (Koike et al., 2001), etc. Nevertheless, all of the above-mentioned studies merely performed the spatial estimationsthrough two-dimensional coordinate (latitude and longitude).The spatial estimation of evaporation developed in this studywas achieved by using three-dimensional information includ-ing latitude, longitude and elevation. Moreover we specifi-cally take the meteorological variables related to evaporationfor estimating the pan evaporation at ungauged sites by in-tegrating kriging into ANN which never been investigatedpreviously.
In this study, a novel approach that combines a spatialneural fuzzy network with kriging is implemented to im-prove the accuracy of evaporation estimation and to extendits capability for displaying the spatial distribution of evapo-ration. Evaporation was measured by Class A Pan (pan evap-oration), and the collected data contained invariant informa-tion including geographical coordinates and elevation. More-over, the relation between the ANN and kriging is that theANN is assigned to extract knowledge only from changeable
36
Fig. 2. Flowchart of the constructed AK model for estimating the spatial distribution
of evaporation.
Fig. 2. Flowchart of the constructed AK model for estimating thespatial distribution of evaporation.
parameters (evaporation and meteorological variables). Theoutputs of the spatially weighted ANN can then be combinedwith the residuals adjusted by simple kriging for producingevaporation estimation at ungauged sites. Another scientificissue raised in this study is that the hybrid model can reliablyreflect the impacts of topographical features on evaporation.Section 2 presents the hybrid methodology that integrates thespatially weighted ANFIS and simple kriging method (here-inafter called the AK model). Section 3 addresses the studyarea, data sets, the model construction procedure and the em-pirical formula. Section 4 shows the results of the proposedhybrid model which are compared with those of the empiri-cal equation. The contribution and findings in this study aregiven in Sect. 5. Finally, the conclusion of this study is drawnin Sect. 6.
2 Methodologies
In the following sub-sections, the ANFIS, spatial weightmethod, kriging method and model construction process areintroduced.
2.1 Adaptive network-based fuzzy inference system(ANFIS)
The adaptive network-based fuzzy inference system (AN-FIS), initially introduced by (Jang, 1993), has been success-fully applied to many problems (Chang and Chang, 2001,2006; Chen et al., 2006; Shu and Ouarda, 2008). The ANFIS
Hydrol. Earth Syst. Sci., 16, 255–266, 2012 www.hydrol-earth-syst-sci.net/16/255/2012/
C.-H. Chung et al.: A spatial neural fuzzy network for estimating pan evaporation at ungauged sites 257
uses neural network learning algorithms coupled with fuzzyreasoning to map an input space onto an output space. Thearchitecture of the constructed ANFIS model with a briefdescription is shown in Fig. 1.
The ANFIS is usually trained by a hybrid supervised learn-ing algorithm to optimize both linear and nonlinear param-eters. Furthermore, it is common to adopt the subtractivefuzzy clustering algorithm when establishing the fuzzy rulesbetween input and output variables. The subtractive fuzzyclustering algorithm determines the minimum number ofrules to discriminate the fuzzy quality associated with eachcluster. Therefore, this algorithm determines the fuzzy rulesof the constructed ANFIS model in this study.
2.2 Spatial weight method
Owing to great uncertainties in spatial distribution, evapora-tion at different locations is usually affected by various fac-tors. Daly (2006) had an overview of commonly used inter-polation techniques. The inverse distance weighting methodis introduced to integrate the results given by the point es-timator (ANFIS), and then the evaporation at specific un-gauged sites of interest will be computed in this case study.The implementation procedure of this method is describedas follows:
1. identify the TWD67 (Taiwan Datum 1967) coordinates(x and y) and elevation (z) of two sites (gauged and un-gauged sites) and calculate the distanced between thetwo sites using Eq. (1), where subscriptso andi repre-sent gauged and ungauged sites, respectively. Becauseelevation is a key factor for evaporation and the eleva-tion difference (less than 2000 m) is much smaller thanthe distance (less than 300 km) between gauged and un-gauged sites. Based on a great number of trial-and-error process, the emphatic weight is set as 1000, whichcan also refer to Hutchinson (1995) that indicated thatthe weighted values of elevation and distance should beapproximately equal.
doi=
√(xo −xi)2+(yo −yi)2+((zo −zi)×1000)2 (1)
2. Define the inverse square ratiof as Eq. (2)
f (doi) =1
d2oi
(2)
3. Compute the weightw by calculating the distance be-tween everyEpan and every grid cell of the ungaugedsite as Eq. (3):
wi =f (doi)n∑
i=1f (doi)
(3)
37
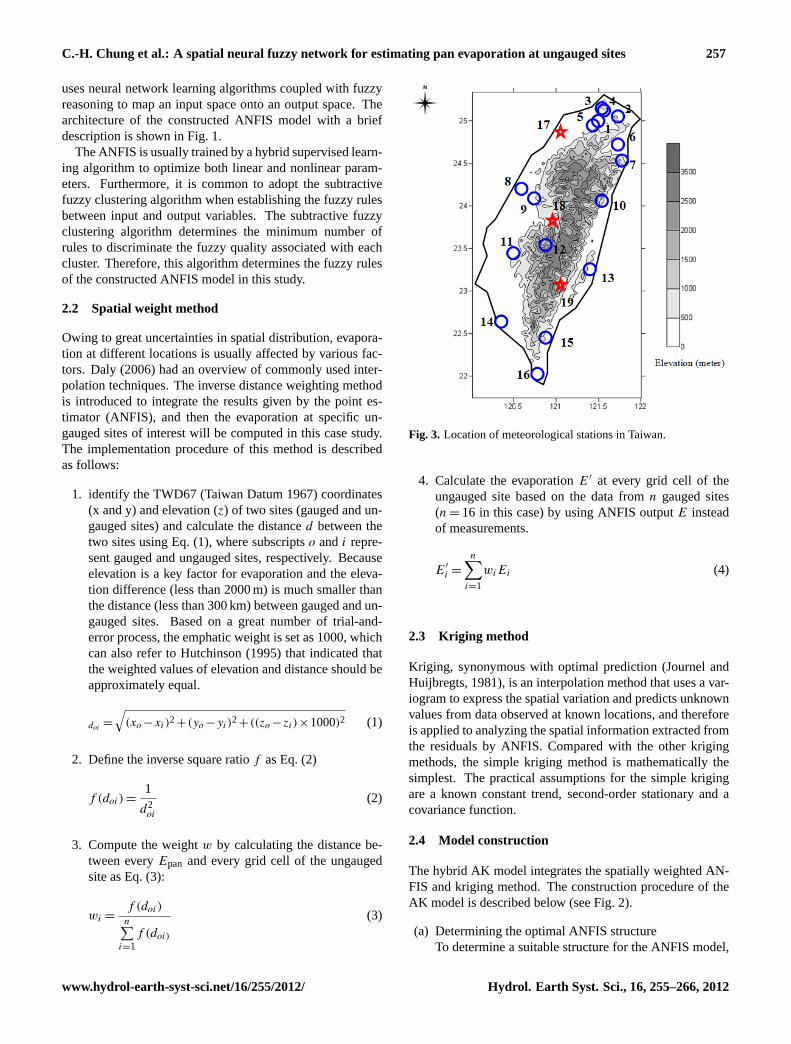
Fig. 3. Location of meteorological stations in Taiwan.
Fig. 3. Location of meteorological stations in Taiwan.
4. Calculate the evaporationE′ at every grid cell of theungauged site based on the data fromn gauged sites(n = 16 in this case) by using ANFIS outputE insteadof measurements.
E′
i =
n∑i=1
wiEi (4)
2.3 Kriging method
Kriging, synonymous with optimal prediction (Journel andHuijbregts, 1981), is an interpolation method that uses a var-iogram to express the spatial variation and predicts unknownvalues from data observed at known locations, and thereforeis applied to analyzing the spatial information extracted fromthe residuals by ANFIS. Compared with the other krigingmethods, the simple kriging method is mathematically thesimplest. The practical assumptions for the simple krigingare a known constant trend, second-order stationary and acovariance function.
2.4 Model construction
The hybrid AK model integrates the spatially weighted AN-FIS and kriging method. The construction procedure of theAK model is described below (see Fig. 2).
(a) Determining the optimal ANFIS structureTo determine a suitable structure for the ANFIS model,
www.hydrol-earth-syst-sci.net/16/255/2012/ Hydrol. Earth Syst. Sci., 16, 255–266, 2012
258 C.-H. Chung et al.: A spatial neural fuzzy network for estimating pan evaporation at ungauged sites
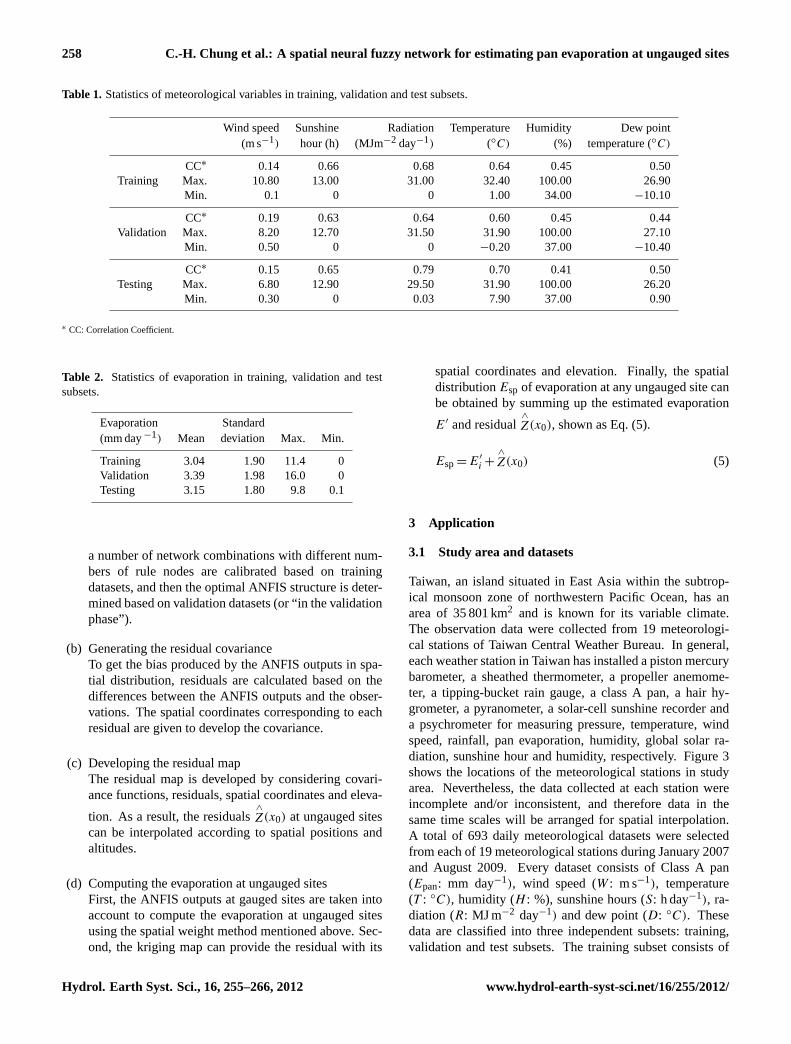
Table 1. Statistics of meteorological variables in training, validation and test subsets.
Wind speed Sunshine Radiation Temperature Humidity Dew point(m s−1) hour (h) (MJm−2 day−1) (◦C) (%) temperature (◦C)
CC∗ 0.14 0.66 0.68 0.64 0.45 0.50Training Max. 10.80 13.00 31.00 32.40 100.00 26.90
Min. 0.1 0 0 1.00 34.00 −10.10
CC∗ 0.19 0.63 0.64 0.60 0.45 0.44Validation Max. 8.20 12.70 31.50 31.90 100.00 27.10
Min. 0.50 0 0 −0.20 37.00 −10.40
CC∗ 0.15 0.65 0.79 0.70 0.41 0.50Testing Max. 6.80 12.90 29.50 31.90 100.00 26.20
Min. 0.30 0 0.03 7.90 37.00 0.90
∗ CC: Correlation Coefficient.
Table 2. Statistics of evaporation in training, validation and testsubsets.
Evaporation Standard(mm day−1) Mean deviation Max. Min.
Training 3.04 1.90 11.4 0Validation 3.39 1.98 16.0 0Testing 3.15 1.80 9.8 0.1
a number of network combinations with different num-bers of rule nodes are calibrated based on trainingdatasets, and then the optimal ANFIS structure is deter-mined based on validation datasets (or “in the validationphase”).
(b) Generating the residual covarianceTo get the bias produced by the ANFIS outputs in spa-tial distribution, residuals are calculated based on thedifferences between the ANFIS outputs and the obser-vations. The spatial coordinates corresponding to eachresidual are given to develop the covariance.
(c) Developing the residual mapThe residual map is developed by considering covari-ance functions, residuals, spatial coordinates and eleva-
tion. As a result, the residuals∧
Z(x0) at ungauged sitescan be interpolated according to spatial positions andaltitudes.
(d) Computing the evaporation at ungauged sitesFirst, the ANFIS outputs at gauged sites are taken intoaccount to compute the evaporation at ungauged sitesusing the spatial weight method mentioned above. Sec-ond, the kriging map can provide the residual with its
spatial coordinates and elevation. Finally, the spatialdistributionEsp of evaporation at any ungauged site canbe obtained by summing up the estimated evaporation
E′ and residual∧
Z(x0), shown as Eq. (5).
Esp= E′
i +∧
Z(x0) (5)
3 Application
3.1 Study area and datasets
Taiwan, an island situated in East Asia within the subtrop-ical monsoon zone of northwestern Pacific Ocean, has anarea of 35 801 km2 and is known for its variable climate.The observation data were collected from 19 meteorologi-cal stations of Taiwan Central Weather Bureau. In general,each weather station in Taiwan has installed a piston mercurybarometer, a sheathed thermometer, a propeller anemome-ter, a tipping-bucket rain gauge, a class A pan, a hair hy-grometer, a pyranometer, a solar-cell sunshine recorder anda psychrometer for measuring pressure, temperature, windspeed, rainfall, pan evaporation, humidity, global solar ra-diation, sunshine hour and humidity, respectively. Figure 3shows the locations of the meteorological stations in studyarea. Nevertheless, the data collected at each station wereincomplete and/or inconsistent, and therefore data in thesame time scales will be arranged for spatial interpolation.A total of 693 daily meteorological datasets were selectedfrom each of 19 meteorological stations during January 2007and August 2009. Every dataset consists of Class A pan(Epan: mm day−1), wind speed (W : m s−1), temperature(T : ◦C), humidity (H : %), sunshine hours (S: h day−1), ra-diation (R: MJ m−2 day−1) and dew point (D: ◦C). Thesedata are classified into three independent subsets: training,validation and test subsets. The training subset consists of
Hydrol. Earth Syst. Sci., 16, 255–266, 2012 www.hydrol-earth-syst-sci.net/16/255/2012/

C.-H. Chung et al.: A spatial neural fuzzy network for estimating pan evaporation at ungauged sites 259
38
524
(a) (b)
525
Fig. 4. Statistical features of the spatial distribution of daily pan evaporation in 526
Taiwan: (a) average of evaporation; and (b) standard deviation. 527
528
529
Fig. 4. Statistical features of the spatial distribution of daily pan evaporation in Taiwan:(a) average of evaporation; and(b) standard deviation.
all data from station Nos. 1–16 during 2007–2008, and thevalidation subset consists of all data from station Nos. 1–16during January 2009–August 2009. Being different from thatof the test subset, the determination of the training and vali-dation subsets is dependent on the temporal criterion due tothe optimization of parameters. In other words, training datashould cover as much variability as possible. This is why thetraining and validation subsets consisted of data from stationNos. 1–16 and the ratio of the number of months in the train-ing subset to the number of months in the validation subsetis approximately 3:1. To better understand the temporal andspatial variability of evaporation, the estimation of evapora-tion at any ungauged site should be provided. To achieve thisgoal, all data from station Nos. 17–19 during January 2007–August 2009 are used in test subset. Besides, the importantreasons for selecting station Nos. 17–19 are (1) these threestations are separately located in northern, central and south-ern Taiwan; (2) these three sites have relatively few meteo-rological stations around them as compared with the othersites, and therefore enhance the practicability of choosingthese three stations; and (3) these three sites are surroundedby other sites. Cressie (1990) and Schiltz et al. (1998) pre-sented that most errors in the simple kriging are attributableto the spatial extrapolation.
Tables 1 and 2 show the statistics of meteorological vari-ables and evaporation in training, validation and test subsets.The properties of all variables are similar in three subsets,which indicate the data structures of these three independentsubsets for model construction have the same characteristics.Each of the first three variables (sunshine hour, radiation and
temperature; see Table 1) that are highly related to evapo-ration has a correlation coefficient higher than 0.6. How-ever, dew point temperature, humidity and wind speed havebeen frequently suggested in the evaporation estimation lit-erature, and therefore are adopted in this case study. Fig-ure 4 displays the spatial distribution of the measured evap-oration in the aspect of average and standard deviation. It isobvious that the evaporation is less in northern Taiwan thanin southern Taiwan; however the variance of evaporation iseven larger in northern Taiwan than in central and southernTaiwan, which indicates the climate and weather conditionsare more complicated and more variable in northern Taiwan.This is another reason for selecting station Nos. 17–19 (lo-cated in northern, central and southern Taiwan, respectively)as test targets. In other words, the capability of model gener-alization can be identified when the constructed estimationmodel for evaporation performs well in the testing phase.Data arranged in training and validation datasets are usedfor building the model structure and optimizing the corre-sponding parameters, and the test data are used for perfor-mance comparison between the ANFIS-based model and theempirical formula when estimating the spatial distributionof evaporation.
3.2 Achievement comparison
The Penman equation is a popular empirical formula forevaporation estimation, and its original version that de-scribed evaporation from an open water surface was devel-oped by Penman (1948). Donohue et al. (2010) indicated the
www.hydrol-earth-syst-sci.net/16/255/2012/ Hydrol. Earth Syst. Sci., 16, 255–266, 2012

260 C.-H. Chung et al.: A spatial neural fuzzy network for estimating pan evaporation at ungauged sites
Table 3. Performance of the ANFIS model in the training,validation and testing subsets.
RMSE(mm day−1) NDEI1 CE
Training 1.02 0.53 0.71Validation 1.13 0.57 0.67Testing 0.98 0.54 0.70
1 NDEI is defined as the ratio of the root mean square error to the standard deviationof the target time series (Jang, 1993).
39
530
Fig. 5. Covariance values obtained from the fitted and the experimental models
based on the residuals from ANFIS.
531
Fig. 5. Covariance values obtained from the fitted and the experi-mental models based on the residuals from ANFIS.
Penman formula gives the most reasonable result on the esti-mation of potential evaporation among five commonly usedempirical formulas. Numerous Penman equations have beenused to assess evaporation from water and lands. Specifi-cally, the Food and Agricultural Organization of the UnitedNations (FAO) suggests using the definition of the refer-ence evapotranspiration from Smith et al. (1997), and theFAO also recommends Penman-Monteith equation as a stan-dard method for computing daily reference evapotranspira-tioncrop (Allen et al., 1998; Chang et al., 2010). Moreover,Xu and Singh (1998) indicated that the monthly values of thePenman method agree most closely with the pan evaporationvalues. The Penman-Monteith (PM) empirical formula asshown in Eq. (6) is therefore compared with the AK modelin this study. The PM formula considers many physical con-ditions such as crop canopy resistance and aerodynamic re-sistance to replace the original wind speed function. To havethe same comparison standard, Yeh et al. (2008) is referred,which analyzed reference evapotranspiration calculated byPenman-Monteith formula and pan evaporation to determinethe pan coefficient (Kpan) based on 15-yr (1990–2004) mete-orological data in Taiwan. The mean of 15-yrKpan in stationNos. 17–19 are 0.82, 0.9 and 0.82, respectively, and theKpanequation is shown in Eq. (7).
Table 4. Performance of the AK and PM models at individual me-teorological station.
RMSE(mm day−1) CE
No. 17 No. 18 No. 19 No. 17 No. 18 No. 19
AK 1.17 1.02 1.08 0.64 0.12 0.59PM 1.59 1.25 1.14 0.35 −0.32 0.54
40
532
Fig. 6. Residual map of the averages of daily evaporation residuals. 533 Fig. 6. Residual map of the averages of daily evaporation residuals.
The Penman-Monteith equation:
ET0 =0.408(Rn −G)+γ 900
(T +273)u(es−ea)
1+γ (1+0.34u)(6)
Kpan=ET0
Epan(7)
where ET0 is the reference evapotranspiration (mm day−1),Rn is the global solar radiation (MJ m−2 day−1), G is thesoil heat flux density (MJ m−2 day−1), T is the mean dailyair temperature at a height of 2 m above ground (◦C),u is thewind speed at a height of 2 m above ground (m s−1), (es−ea)
is the deficit of saturation vapor pressure (kPa),1 is the slopevapor pressure curve (kPa◦C−1), γ is the psychrometric con-stant (kPa◦C−1), andEpan is pan evaporation (mm day−1).
Hydrol. Earth Syst. Sci., 16, 255–266, 2012 www.hydrol-earth-syst-sci.net/16/255/2012/
C.-H. Chung et al.: A spatial neural fuzzy network for estimating pan evaporation at ungauged sites 261
41
0
50
100
150
200
250
300
350
400
Winter2007
Spring Summer Fall Winter2008
Spring Summer Fall Winter2009
Spring Summer
Season
Eva
por
atio
n (
mm
/sea
son)
Observation
AK
PM
534
(a)
0
50
100
150
200
250
300
350
Winter
2007
Spring Summer Fall Winter
2008
Spring Summer Fall Winter
2009
Spring Summer
Season
Eva
pora
tion (
mm
/sea
son)
Observation
AK
PM
(b)
0
50
100
150
200
250
300
350
400
Winter
2007
Spring Summer Fall Winter
2008
Spring Summer Fall Winter
2009
Spring Summer
Season
Eva
pora
tion (
mm
/sea
son)
Observation
AK
PM
(c)
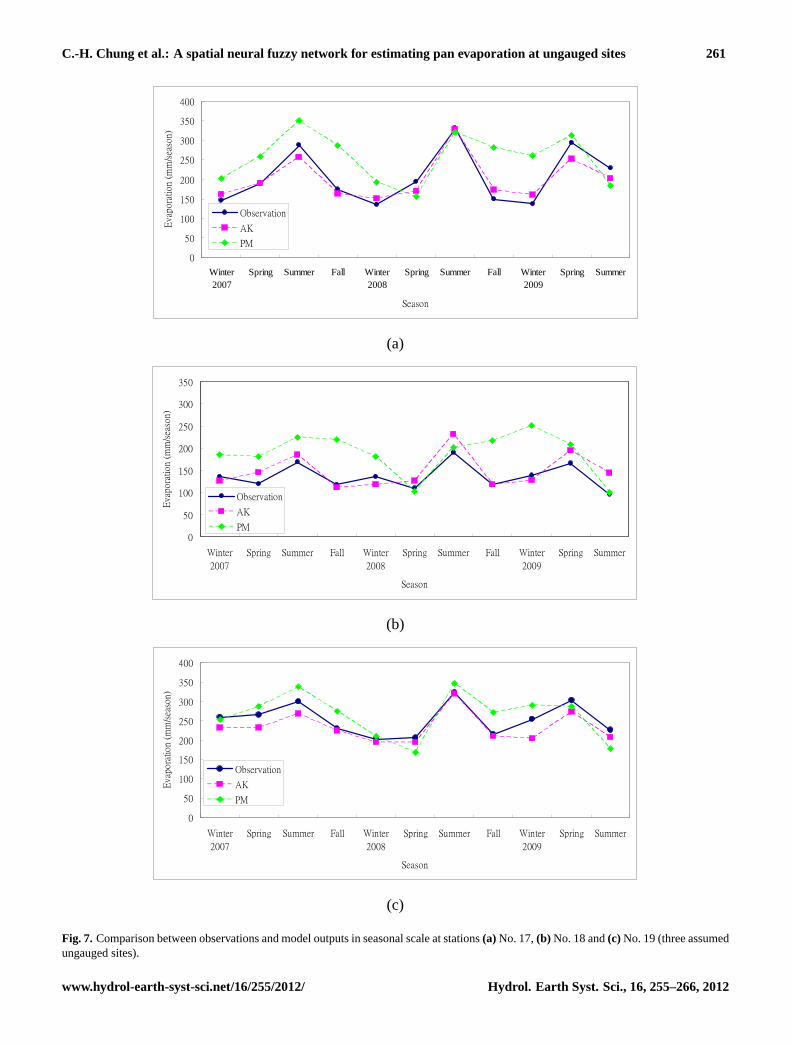
Fig. 7. Comparison between observations and model outputs in seasonal scale at 535
stations (a) No. 17, (b) No. 18 and (c) No. 19 (three assumed ungauged sites). 536 Fig. 7. Comparison between observations and model outputs in seasonal scale at stations(a) No. 17,(b) No. 18 and(c) No. 19 (three assumedungauged sites).
www.hydrol-earth-syst-sci.net/16/255/2012/ Hydrol. Earth Syst. Sci., 16, 255–266, 2012
262 C.-H. Chung et al.: A spatial neural fuzzy network for estimating pan evaporation at ungauged sites
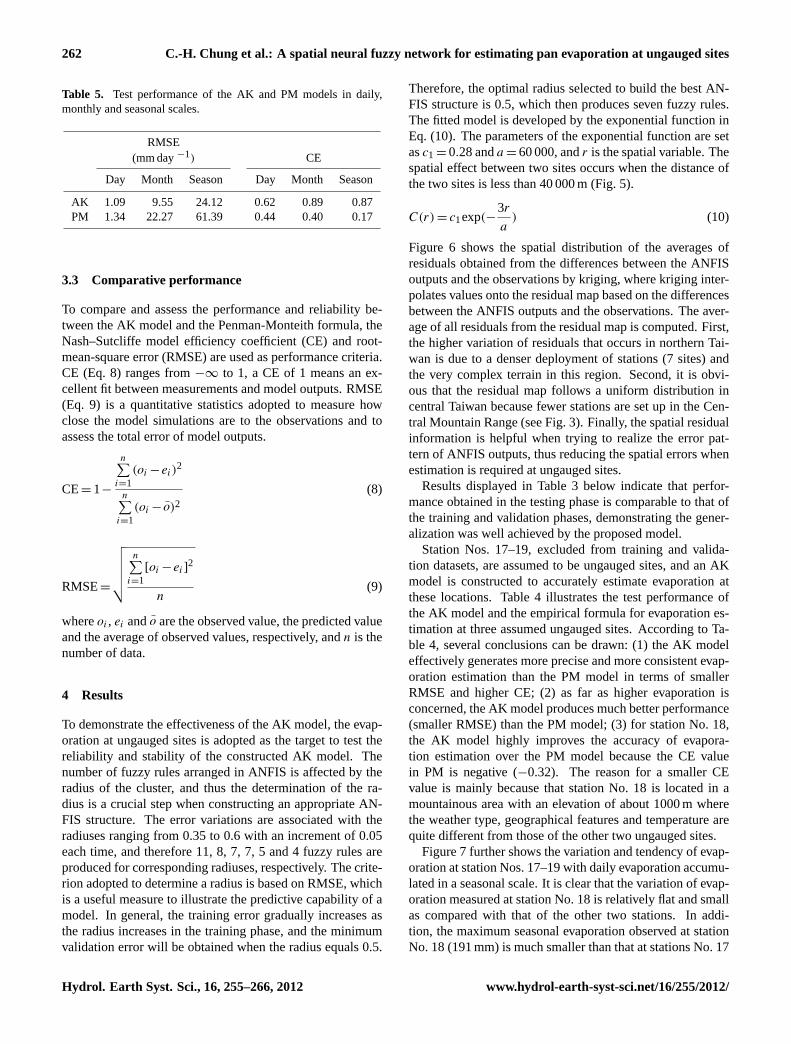
Table 5. Test performance of the AK and PM models in daily,monthly and seasonal scales.
RMSE(mm day−1) CE
Day Month Season Day Month Season
AK 1.09 9.55 24.12 0.62 0.89 0.87PM 1.34 22.27 61.39 0.44 0.40 0.17
3.3 Comparative performance
To compare and assess the performance and reliability be-tween the AK model and the Penman-Monteith formula, theNash–Sutcliffe model efficiency coefficient (CE) and root-mean-square error (RMSE) are used as performance criteria.CE (Eq. 8) ranges from−∞ to 1, a CE of 1 means an ex-cellent fit between measurements and model outputs. RMSE(Eq. 9) is a quantitative statistics adopted to measure howclose the model simulations are to the observations and toassess the total error of model outputs.
CE= 1−
n∑i=1
(oi −ei)2
n∑i=1
(oi −o)2(8)
RMSE=
√√√√√ n∑i=1
[oi −ei ]2
n(9)
whereoi , ei ando are the observed value, the predicted valueand the average of observed values, respectively, andn is thenumber of data.
4 Results
To demonstrate the effectiveness of the AK model, the evap-oration at ungauged sites is adopted as the target to test thereliability and stability of the constructed AK model. Thenumber of fuzzy rules arranged in ANFIS is affected by theradius of the cluster, and thus the determination of the ra-dius is a crucial step when constructing an appropriate AN-FIS structure. The error variations are associated with theradiuses ranging from 0.35 to 0.6 with an increment of 0.05each time, and therefore 11, 8, 7, 7, 5 and 4 fuzzy rules areproduced for corresponding radiuses, respectively. The crite-rion adopted to determine a radius is based on RMSE, whichis a useful measure to illustrate the predictive capability of amodel. In general, the training error gradually increases asthe radius increases in the training phase, and the minimumvalidation error will be obtained when the radius equals 0.5.
Therefore, the optimal radius selected to build the best AN-FIS structure is 0.5, which then produces seven fuzzy rules.The fitted model is developed by the exponential function inEq. (10). The parameters of the exponential function are setasc1 = 0.28 anda = 60 000, andr is the spatial variable. Thespatial effect between two sites occurs when the distance ofthe two sites is less than 40 000 m (Fig. 5).
C(r) = c1exp(−3r
a) (10)
Figure 6 shows the spatial distribution of the averages ofresiduals obtained from the differences between the ANFISoutputs and the observations by kriging, where kriging inter-polates values onto the residual map based on the differencesbetween the ANFIS outputs and the observations. The aver-age of all residuals from the residual map is computed. First,the higher variation of residuals that occurs in northern Tai-wan is due to a denser deployment of stations (7 sites) andthe very complex terrain in this region. Second, it is obvi-ous that the residual map follows a uniform distribution incentral Taiwan because fewer stations are set up in the Cen-tral Mountain Range (see Fig. 3). Finally, the spatial residualinformation is helpful when trying to realize the error pat-tern of ANFIS outputs, thus reducing the spatial errors whenestimation is required at ungauged sites.
Results displayed in Table 3 below indicate that perfor-mance obtained in the testing phase is comparable to that ofthe training and validation phases, demonstrating the gener-alization was well achieved by the proposed model.
Station Nos. 17–19, excluded from training and valida-tion datasets, are assumed to be ungauged sites, and an AKmodel is constructed to accurately estimate evaporation atthese locations. Table 4 illustrates the test performance ofthe AK model and the empirical formula for evaporation es-timation at three assumed ungauged sites. According to Ta-ble 4, several conclusions can be drawn: (1) the AK modeleffectively generates more precise and more consistent evap-oration estimation than the PM model in terms of smallerRMSE and higher CE; (2) as far as higher evaporation isconcerned, the AK model produces much better performance(smaller RMSE) than the PM model; (3) for station No. 18,the AK model highly improves the accuracy of evapora-tion estimation over the PM model because the CE valuein PM is negative (−0.32). The reason for a smaller CEvalue is mainly because that station No. 18 is located in amountainous area with an elevation of about 1000 m wherethe weather type, geographical features and temperature arequite different from those of the other two ungauged sites.
Figure 7 further shows the variation and tendency of evap-oration at station Nos. 17–19 with daily evaporation accumu-lated in a seasonal scale. It is clear that the variation of evap-oration measured at station No. 18 is relatively flat and smallas compared with that of the other two stations. In addi-tion, the maximum seasonal evaporation observed at stationNo. 18 (191 mm) is much smaller than that at stations No. 17
Hydrol. Earth Syst. Sci., 16, 255–266, 2012 www.hydrol-earth-syst-sci.net/16/255/2012/
C.-H. Chung et al.: A spatial neural fuzzy network for estimating pan evaporation at ungauged sites 263
42
(a) (b)
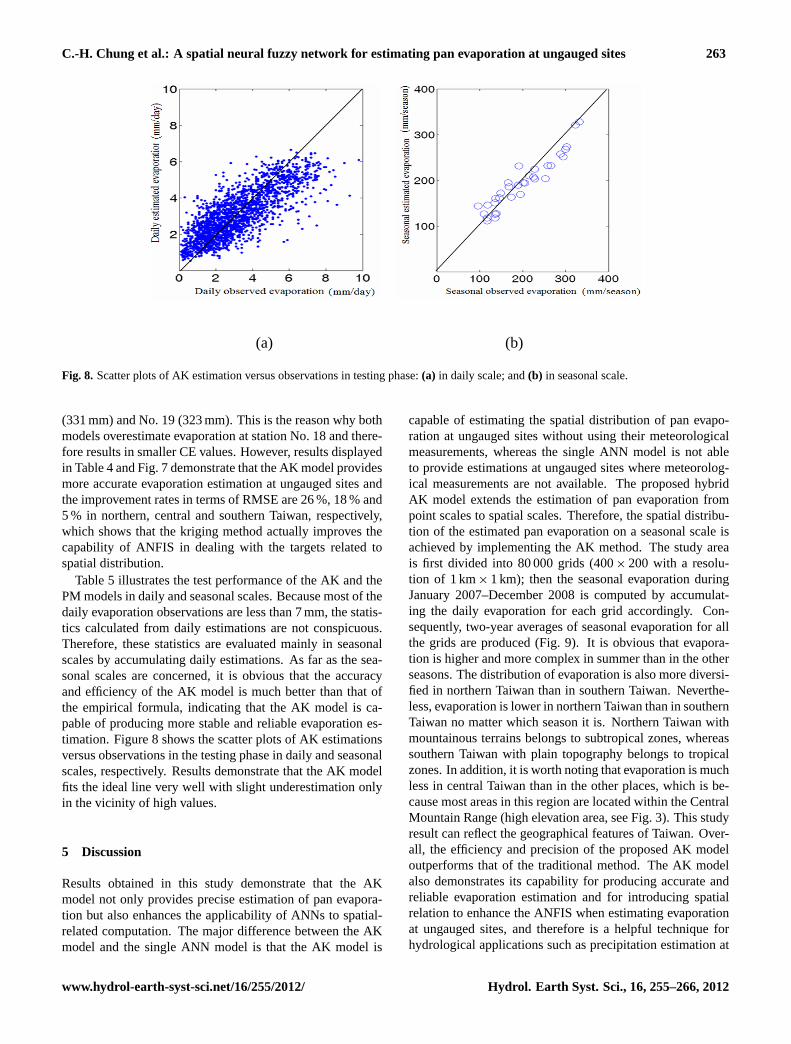
Fig. 8. Scatter plots of AK estimation versus observations in testing phase: (a) in daily 537
scale; and (b) in seasonal scale. 538 Fig. 8. Scatter plots of AK estimation versus observations in testing phase:(a) in daily scale; and(b) in seasonal scale.
(331 mm) and No. 19 (323 mm). This is the reason why bothmodels overestimate evaporation at station No. 18 and there-fore results in smaller CE values. However, results displayedin Table 4 and Fig. 7 demonstrate that the AK model providesmore accurate evaporation estimation at ungauged sites andthe improvement rates in terms of RMSE are 26 %, 18 % and5 % in northern, central and southern Taiwan, respectively,which shows that the kriging method actually improves thecapability of ANFIS in dealing with the targets related tospatial distribution.
Table 5 illustrates the test performance of the AK and thePM models in daily and seasonal scales. Because most of thedaily evaporation observations are less than 7 mm, the statis-tics calculated from daily estimations are not conspicuous.Therefore, these statistics are evaluated mainly in seasonalscales by accumulating daily estimations. As far as the sea-sonal scales are concerned, it is obvious that the accuracyand efficiency of the AK model is much better than that ofthe empirical formula, indicating that the AK model is ca-pable of producing more stable and reliable evaporation es-timation. Figure 8 shows the scatter plots of AK estimationsversus observations in the testing phase in daily and seasonalscales, respectively. Results demonstrate that the AK modelfits the ideal line very well with slight underestimation onlyin the vicinity of high values.
5 Discussion
Results obtained in this study demonstrate that the AKmodel not only provides precise estimation of pan evapora-tion but also enhances the applicability of ANNs to spatial-related computation. The major difference between the AKmodel and the single ANN model is that the AK model is
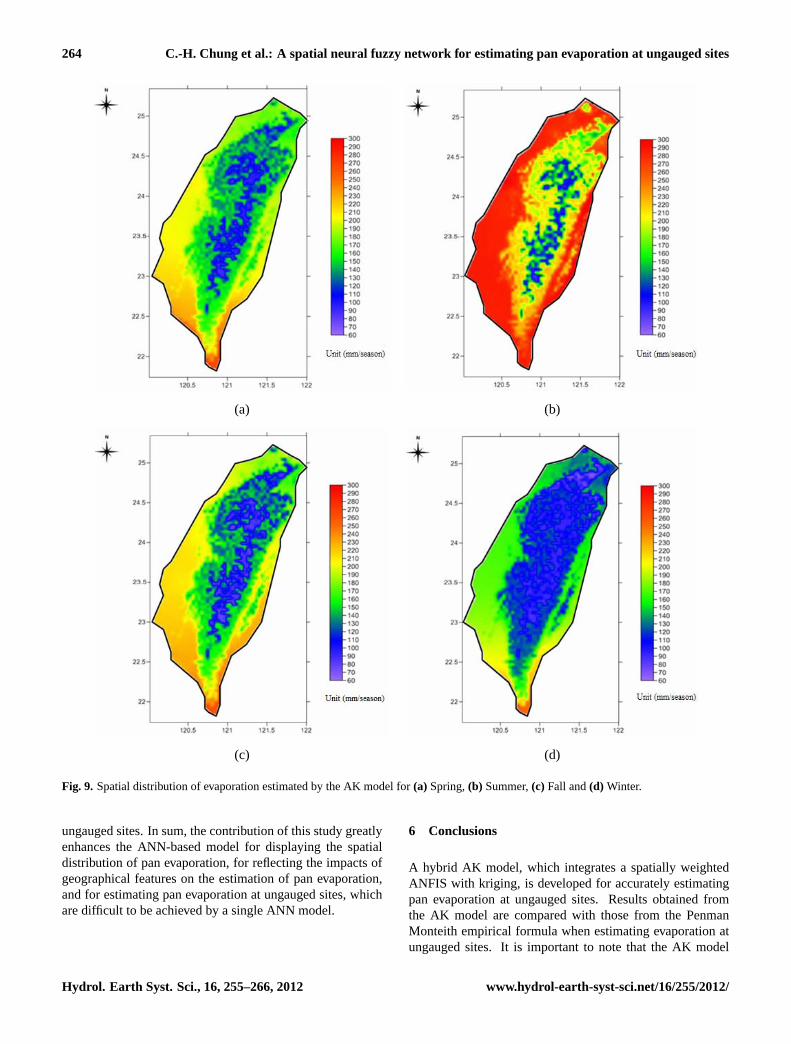
capable of estimating the spatial distribution of pan evapo-ration at ungauged sites without using their meteorologicalmeasurements, whereas the single ANN model is not ableto provide estimations at ungauged sites where meteorolog-ical measurements are not available. The proposed hybridAK model extends the estimation of pan evaporation frompoint scales to spatial scales. Therefore, the spatial distribu-tion of the estimated pan evaporation on a seasonal scale isachieved by implementing the AK method. The study areais first divided into 80 000 grids (400× 200 with a resolu-tion of 1 km× 1 km); then the seasonal evaporation duringJanuary 2007–December 2008 is computed by accumulat-ing the daily evaporation for each grid accordingly. Con-sequently, two-year averages of seasonal evaporation for allthe grids are produced (Fig. 9). It is obvious that evapora-tion is higher and more complex in summer than in the otherseasons. The distribution of evaporation is also more diversi-fied in northern Taiwan than in southern Taiwan. Neverthe-less, evaporation is lower in northern Taiwan than in southernTaiwan no matter which season it is. Northern Taiwan withmountainous terrains belongs to subtropical zones, whereassouthern Taiwan with plain topography belongs to tropicalzones. In addition, it is worth noting that evaporation is muchless in central Taiwan than in the other places, which is be-cause most areas in this region are located within the CentralMountain Range (high elevation area, see Fig. 3). This studyresult can reflect the geographical features of Taiwan. Over-all, the efficiency and precision of the proposed AK modeloutperforms that of the traditional method. The AK modelalso demonstrates its capability for producing accurate andreliable evaporation estimation and for introducing spatialrelation to enhance the ANFIS when estimating evaporationat ungauged sites, and therefore is a helpful technique forhydrological applications such as precipitation estimation at
www.hydrol-earth-syst-sci.net/16/255/2012/ Hydrol. Earth Syst. Sci., 16, 255–266, 2012
264 C.-H. Chung et al.: A spatial neural fuzzy network for estimating pan evaporation at ungauged sites
43
539
(a) (b)
(c) (d)
Fig. 9. Spatial distribution of evaporation estimated by the AK model for (a) Spring, 540
(b) Summer, (c) Fall and (d) Winter. 541
542
Fig. 9. Spatial distribution of evaporation estimated by the AK model for(a) Spring,(b) Summer,(c) Fall and(d) Winter.
ungauged sites. In sum, the contribution of this study greatlyenhances the ANN-based model for displaying the spatialdistribution of pan evaporation, for reflecting the impacts ofgeographical features on the estimation of pan evaporation,and for estimating pan evaporation at ungauged sites, whichare difficult to be achieved by a single ANN model.
6 Conclusions
A hybrid AK model, which integrates a spatially weightedANFIS with kriging, is developed for accurately estimatingpan evaporation at ungauged sites. Results obtained fromthe AK model are compared with those from the PenmanMonteith empirical formula when estimating evaporation atungauged sites. It is important to note that the AK model
Hydrol. Earth Syst. Sci., 16, 255–266, 2012 www.hydrol-earth-syst-sci.net/16/255/2012/

C.-H. Chung et al.: A spatial neural fuzzy network for estimating pan evaporation at ungauged sites 265
estimates evaporation without using meteorological variablesat ungauged sites, whereas the PM model uses meteoro-logical variables directly. The role of ANFIS in the AKmodel is to estimate evaporation at gauged sites and extendits estimations to ungauged sites through the spatial weightmethod; whereas the use of kriging is to adjust the spatialerror of ANFIS outputs. Once the AK model is well devel-oped and trained, the operation of the AK model merely re-quires coordinates and elevation data at ungauged sites andcoordinates, elevation data and the meterological variables atgauged sites in practice. In addition, the daily estimation ofevaporation in the testing phase obtained from the AK modelprovides an RMSE of 1.09 mm day−1, whereas the estima-tion accuracy of the PM model only achieves 1.34 mm day−1.In summary, the ANFIS provides more accurate point esti-mation of evaporation at all stations than the Penman Mon-teith empirical formula; and the AK model not only signifi-cantly reduces the estimation errors but provides robust andprecise temporal and spatial distribution of evaporation byintegrating kriging into the spatially weighted ANFIS, whichcan be effectively extended to cover the whole of Taiwanin four seasons. We conclude that the proposed hybrid AKmodel demonstrates good reliability when estimating evap-oration at both gauged and ungauged sites and is an effec-tive and efficient method for use in related fields that involvetemporal and spatial relationship management.
Acknowledgements.This study was partially supported by theNational Science Council (NSC), Taiwan, R. O. C. (Grant No. NSC97-2313-B-002-013-MY3).
Edited by: E. Toth
References
Allen, R. G., Pereira, S. L., Raes, D., and Smith, M.: Crop evapo-transpiration, Guidelines for computing crop water requirements,Irrigation and Drainage Paper No. 56, FAO, Rome, 1998.
Antar, M. A., Elassiouti, I., and Allam, M. N.: Rainfall-runoff mod-elling using artificial neural networks technique: a Blue Nilecatchment case study, Hydrol. Process., 20, 1201–1216, 2006.
Chang, F. J. and Chang, Y. T.: Adaptive neuro-fuzzy inference sys-tem for prediction of water level in reservoir, Adv. Water Res.,29, 1–10, 2006.
Chang, F. J., Chang, L. C., Kao, H.-S., and Wu, G.-R.: Assessingthe effort of meteorological variables for evaporation estimationby self-organizing map neural network, J. Hydrol., 384, 118–129, 2010.
Chang, L. C. and Chang, F. J.: Intelligent control for modelling ofreal-time reservoir operation, Hydrol. Process., 15, 1621–1634,2001.
Chang, Y. T., Chang, L.C., and Chang, F. J.: Intelligent control formodeling of real-time reservoir operation, part II: artificial neuralnetwork with operating rule curves, Hydrol. Process., 19, 1431–1444, 2005.
Chen, S. H., Lin, Y. H., Chang, L. C., and Chang, F. J.: The strat-egy of building a flood forecast model by neuro-fuzzy network,Hydrol. Process., 20, 1525–1540, 2006.
Chen, Y. C.: Rainfall network design using kriging and entropy,Hydrol. Process., 22, 340–346,doi:10.1002/hyp.6292, 2008.
Chen, Y. H. and Chang, F. J.: Evolutionary Artificial Neural Net-works for Hydrological Systems Forecasting, J. Hydrol., 367,125–137, 2009.
Chiang, Y. M. and Chang, F. J.: Integrating hydrometeorologicalinformation for rainfall-runoff modelling by artificial neural net-works, Hydrol. Process., 23, 1650–1659. 2009.
Choudhury, B. J., Ahmed, N. U., Idso, S. B., Reginato, R. J., andDaughtry, C. S. T.: Relations between evaporation coefficientsand vegetation indices studied by model simulations, RemoteSens. Environ., 50, 1–17, 1994.
Cressie, N.: The originas of Kriging, Math. Geol., 22, 239–252,1990.
Daly, C.: Guidelines for assessing the suitability of spatial climatedata sets, Int. J. Climatol., 26, 707–721, 2006.
Donohue, R. J., McVicar, T. R., and Roderick, M. L.: Assessingthe ability of potential evaporation formulations to capture thedynamics in evaporative demand within a changing climate, J.Hydrol., 386, 186–197, 2010.
Gonzalez-Camacho, J. M., Cervantes-Osornio, R., Ojeda-Bustamante, W., and Lopez-Cruz, I.: Forecasting referenceevapotranspiration using artificial neural networks, IngenieriaHidraulica En Mexico, 23, 127–138, 2008.
Hutchinson, M. F.: Interpolating mean rainfall using thin platesmoothing splines, Int. J. Geogr. Inf. Syst., 9, 385–403, 1995.
Jang, J. S. R.: ANFIS – Adaptive-network-based fyzzy inferencesystem, IEEE T. Syst. Man Cybernet., 23, 665–685, 1993.
Journel, A. G. and Huijbregts, C. J.: Mining Geostatistics, Aca-demic Press, 1981.
Kanevsky, M., Arutyunyan, R., Bolshov, L., Demyanov, V., andMaignan, M.: Artificial neural networks and spatial estimationsof Chernobyl fallout, Geoinformatics, 7, 5–11, 1996.
Keskin, M. E. and Terzi, O.: Artificial neural network models ofdaily pan evaporation, J. Hydrol. Eng.-ASCE, 11, 65–70, 2006.
Kim, G. and Barros, A. P.: Quantitative flood forecasting using mul-tisensor data and neural networks, J. Hydrol., 246, 45–62, 2001.
Kisi, O.: Daily pan evaporation modelling using a neuro-fuzzy com-puting technique, J. Hydrol., 329, 636–646, 2006.
Kisi, O. and Ozturk, O.: Adaptive neurofuzzy computing techniquefor evapotranspiration estimation, J. Irrig. Drain. Eng.-ASCE,133, 368–379, 2007.
Koike, K., Matsuda, S., and Gu, B.: Evaluation of interpola-tion accuracy of neural kriging with application to temperature-distribution analysis, Math. Geol., 33, 421–448, 2001.
Legleiter, C. J.: Spatial prediction of river channel topog-raphy by kriging, Earth Surf. Proc. Land., 33, 841–867,doi:10.1002/esp.1579, 2008.
McVicar, T. R., Van Niel, T. G., Li, L. T., Hutchinson, M. F., Mu,X. M., and Liu, Z. H.: Spatially Distributing Monthly Refer-ence Evapotranspiration and Pan Evaporation Considering To-pographic Influences, J. Hydrol., 338, 196–220, 2007.
Neuman, S. P. and Jacobson, E. A.: Analysis of nonintrinsic spatialvaribility by residual kriging with application to regional ground-water levels, J. Int. Assoc. Math. Geol., 16, 499–521, 1984.
Penman, H. L.: Natural evaporation from open water,
www.hydrol-earth-syst-sci.net/16/255/2012/ Hydrol. Earth Syst. Sci., 16, 255–266, 2012

266 C.-H. Chung et al.: A spatial neural fuzzy network for estimating pan evaporation at ungauged sites
bare soil and grass, Proc. Roy. Soc. B, 193, 120–145,doi:10.1098/rspa.1948.0037, 1948.
Schultz, C., S. Myers, J. Hipp, and C. Young .: NonstationaryBayesian kriging: a predictive technique to generate correctionsfor detection, location, and discrimination, Bull. Seism. Soc.Am., 88, 1275–1288, 1998.
Schuurmans, J. M., Bierkens, M. F. P., Pebesma, E. J., and Uijlen-hoet, R.: Automatic prediction of high-resolution daily rainfallfields for multiple extents: The potential of operational radar, J.Hydrometeorol., 8, 1204–1224, 2007.
Shu, C. and Ouarda, T. B. M. J.: Regional flood frequency anal-ysis at ungauged sites using the adaptive neuro-fuzzy inferencesystem, J. Hydrol., 349, 31–43, 2008.
Smith, M., Allen, R., and Pereira, L.: Revised FAO methodologyfor crop water requirement, Land and Water Development Divi-sion, FAO, Rome, 1997.
Trajkovic, S., Todorovic, B., and Stankovic, M.: Forecasting of ref-erence evapotranspiration by artificial neural networks, J. Irrig.Drain. Eng.-ASCE, 129, 454–457, 2003.
Xu, C. Y. and Singh, V. P.: Dependence of evaporation on meteoro-logical variables at different time scales and intercomparsion ofestimation methods, Hydrol. Process., 12, 429–442, 1998.
Xu, C. Y., Gong, L., Jiang, T., Chen, D., and Singh, V. P.: Analy-sis of spatial distribution and temporal trend of reference evapo-transpiration and pan evaporation in Changjiang (Yangtze River)catchment, J. Hydrol., 327, 81–93, 2006.
Yeh, H. F., Lee C.-H., Chen, J.-W., and Chang, K.-L.: Evaluationof pan coefficients for estimating reference evapotranspiration insouthern Taiwan, J. Taiwan Agr. Eng., 54, 27–35, 2008.
Hydrol. Earth Syst. Sci., 16, 255–266, 2012 www.hydrol-earth-syst-sci.net/16/255/2012/