A Spatial Analysis of Phosphorus in the Mississippi River...
11
931 Phosphorus (P) in rivers in the Mississippi River basin (MRB) contributes to hypoxia in the Gulf of Mexico and impairs local water quality. We analyzed the spatial pattern of P in the MRB to determine the counties with the greatest January to June P riverine yields and the most critical factors related to this P loss. Using a database of P inputs and landscape characteristics from 1997 through 2006 for each county in the MRB, we created regression models relating riverine total P (TP), dissolved reactive P (DRP), and particulate P (PP) yields for watersheds within the MRB to these factors. Riverine yields of P were estimated from the average concentration of each form of P during January to June for the 10-yr period, multiplied by the average daily flow, and then summed for the 6-mo period. e fraction of land planted in crops, human consumption of P, and precipitation were found to best predict TP yields with a spatial error regression model (R 2 = 0.48, n = 101). Dissolved reactive P yields were predicted by fertilizer P inputs, human consumption of P, and precipitation in a multiple regression model (R 2 = 0.42, n = 73), whereas PP yields were explained by crop fraction, human consumption of P, and soil bulk density in a spatial error regression model (R 2 = 0.49, n = 61). Overall, the Upper Midwest’s Cornbelt region and lower Mississippi basin had the counties with the greatest P yields. ese results help to point out specific areas where agricultural conservation practices that reduce losses to streams and rivers and point source P removal might limit the intensity or spatial occurrence of Gulf of Mexico hypoxia and improve local water quality. A Spatial Analysis of Phosphorus in the Mississippi River Basin Linda M. Jacobson, Mark B. David,* and Laurie E. Drinkwater P hosphorus (P) and nitrogen (N) in the Mississippi River Basin (MRB) have been transported to rivers and streams in increasing amounts over time and a major impact has been the creation of a coastal hypoxic zone in the Gulf of Mexico (USEPA, 2007). e MRB drains a large portion of the United States and various sources contribute nutrients, especially N and P, to the Mississippi River, which then flow to the Gulf of Mexico. One of the main contributors of N and P is runoff (both surface and subsurface) from agricultural land that has been treated with fertilizers and manures, and managed in ways that increase N and P availability. e use of fertilizer in the United States has increased since the mid-1930s and has been shown to correlate with increasing N and P loads in the Mississippi River (Turner and Rabalais, 1991; Donner, 2003). A study performed in 1999 by the National Science and Technology Council also found a significant link between N carried by the Mississippi River and hypoxia in the Gulf of Mexico (CENR, 2000). Although N is a major contributing nutrient to hypoxia in the Gulf of Mexico, recent studies have found that P is also important to the formation of the hypoxic zone (USEPA, 2007). Phosphorus becomes a limiting nutrient in the coastal waters of the Gulf of Mexico in the spring and summer, due to large changes that have occurred in the N-to-P ratio from excessive N loading over many years (USEPA, 2007). Sylvan et al. (2006) assert that P is limit- ing for phytoplankton growth in the spring and summer, and as a result should be included in strategies that are being developed to decrease the occurrence of hypoxia. Bierman et al. (1994) also found primary productivity to be controlled to a greater extent by P than by N in several areas of the Mississippi Delta. e impor- tance of P concentrations in the Gulf of Mexico in spring and summer suggest that studies should focus on this period of deliv- ery from upstream sources. Much of the P in rivers and streams is from nonpoint sources, with agriculture dominating these sources in the MRB. In a national analysis, USEPA suggested that P entering rivers and streams was due primarily to agriculture (USEPA, 1998). Phosphorus from agricultural fields moves predominantly via surface runoff or in tile drainage. Sharpley et al. (1994) determined runoff and erosion to be the principal means of transporting P from agricultural fields Abbreviations: AIC, Akaike’s information criterion; DEM, Digital Elevation Model; DRP, dissolved reactive phosphorus; GIS, geographic information system; HUC, hydrologic unit code; MRB, Mississippi River Basin; PP, particulate phosphorus; SPARROW, spatially referenced regression on watershed attributes; TN, total nitrogen; TP, total phosphorus; UTM, Universal Transverse Mercator. L.M. Jacobson and M.B. David, Dep. of Natural Resources and Environmental Sciences, Univ. of Illinois at Urbana-Champaign, W-503 Turner Hall, 1102 S. Goodwin Ave., Urbana, IL 61801; L.E. Drinkwater, Dep. of Horticulture, Cornell Univ., Ithaca, NY 14853. Assigned to Associate Editor Peter Vadas. Copyright © 2011 by the American Society of Agronomy, Crop Science Society of America, and Soil Science Society of America. All rights reserved. No part of this periodical may be reproduced or transmitted in any form or by any means, electronic or mechanical, including pho- tocopying, recording, or any information storage and retrieval system, without permission in writing from the publisher. J. Environ. Qual. 40:931–941 (2011) doi:10.2134/jeq2010.0386 Posted online 28 Mar. 2011. Received 7 Sept. 2010. *Corresponding author ([email protected]). © ASA, CSSA, SSSA 5585 Guilford Rd., Madison, WI 53711 USA TECHNICAL REPORTS: LANDSCAPE AND WATERSHED PROCESSES
-
Upload
nguyenkien -
Category
Documents
-
view
217 -
download
3
Transcript of A Spatial Analysis of Phosphorus in the Mississippi River...

931
Phosphorus (P) in rivers in the Mississippi River basin (MRB) contributes to hypoxia in the Gulf of Mexico and impairs local water quality. We analyzed the spatial pattern of P in the MRB to determine the counties with the greatest January to June P riverine yields and the most critical factors related to this P loss. Using a database of P inputs and landscape characteristics from 1997 through 2006 for each county in the MRB, we created regression models relating riverine total P (TP), dissolved reactive P (DRP), and particulate P (PP) yields for watersheds within the MRB to these factors. Riverine yields of P were estimated from the average concentration of each form of P during January to June for the 10-yr period, multiplied by the average daily fl ow, and then summed for the 6-mo period. Th e fraction of land planted in crops, human consumption of P, and precipitation were found to best predict TP yields with a spatial error regression model (R2 = 0.48, n = 101). Dissolved reactive P yields were predicted by fertilizer P inputs, human consumption of P, and precipitation in a multiple regression model (R2 = 0.42, n = 73), whereas PP yields were explained by crop fraction, human consumption of P, and soil bulk density in a spatial error regression model (R2 = 0.49, n = 61). Overall, the Upper Midwest’s Cornbelt region and lower Mississippi basin had the counties with the greatest P yields. Th ese results help to point out specifi c areas where agricultural conservation practices that reduce losses to streams and rivers and point source P removal might limit the intensity or spatial occurrence of Gulf of Mexico hypoxia and improve local water quality.
A Spatial Analysis of Phosphorus in the Mississippi River Basin
Linda M. Jacobson, Mark B. David,* and Laurie E. Drinkwater
Phosphorus (P) and nitrogen (N) in the Mississippi River Basin (MRB) have been transported to rivers and streams in
increasing amounts over time and a major impact has been the creation of a coastal hypoxic zone in the Gulf of Mexico (USEPA, 2007). Th e MRB drains a large portion of the United States and various sources contribute nutrients, especially N and P, to the Mississippi River, which then fl ow to the Gulf of Mexico. One of the main contributors of N and P is runoff (both surface and subsurface) from agricultural land that has been treated with fertilizers and manures, and managed in ways that increase N and P availability. Th e use of fertilizer in the United States has increased since the mid-1930s and has been shown to correlate with increasing N and P loads in the Mississippi River (Turner and Rabalais, 1991; Donner, 2003). A study performed in 1999 by the National Science and Technology Council also found a signifi cant link between N carried by the Mississippi River and hypoxia in the Gulf of Mexico (CENR, 2000).
Although N is a major contributing nutrient to hypoxia in the Gulf of Mexico, recent studies have found that P is also important to the formation of the hypoxic zone (USEPA, 2007). Phosphorus becomes a limiting nutrient in the coastal waters of the Gulf of Mexico in the spring and summer, due to large changes that have occurred in the N-to-P ratio from excessive N loading over many years (USEPA, 2007). Sylvan et al. (2006) assert that P is limit-ing for phytoplankton growth in the spring and summer, and as a result should be included in strategies that are being developed to decrease the occurrence of hypoxia. Bierman et al. (1994) also found primary productivity to be controlled to a greater extent by P than by N in several areas of the Mississippi Delta. Th e impor-tance of P concentrations in the Gulf of Mexico in spring and summer suggest that studies should focus on this period of deliv-ery from upstream sources.
Much of the P in rivers and streams is from nonpoint sources, with agriculture dominating these sources in the MRB. In a national analysis, USEPA suggested that P entering rivers and streams was due primarily to agriculture (USEPA, 1998). Phosphorus from agricultural fi elds moves predominantly via surface runoff or in tile drainage. Sharpley et al. (1994) determined runoff and erosion to be the principal means of transporting P from agricultural fi elds
Abbreviations: AIC, Akaike’s information criterion; DEM, Digital Elevation Model; DRP, dissolved reactive phosphorus; GIS, geographic information system; HUC, hydrologic unit code; MRB, Mississippi River Basin; PP, particulate phosphorus; SPARROW, spatially referenced regression on watershed attributes; TN, total nitrogen; TP, total phosphorus; UTM, Universal Transverse Mercator.
L.M. Jacobson and M.B. David, Dep. of Natural Resources and Environmental Sciences, Univ. of Illinois at Urbana-Champaign, W-503 Turner Hall, 1102 S. Goodwin Ave., Urbana, IL 61801; L.E. Drinkwater, Dep. of Horticulture, Cornell Univ., Ithaca, NY 14853. Assigned to Associate Editor Peter Vadas.
Copyright © 2011 by the American Society of Agronomy, Crop Science Society of America, and Soil Science Society of America. All rights reserved. No part of this periodical may be reproduced or transmitted in any form or by any means, electronic or mechanical, including pho-tocopying, recording, or any information storage and retrieval system, without permission in writing from the publisher.
J. Environ. Qual. 40:931–941 (2011)doi:10.2134/jeq2010.0386Posted online 28 Mar. 2011.Received 7 Sept. 2010.*Corresponding author ([email protected]).© ASA, CSSA, SSSA5585 Guilford Rd., Madison, WI 53711 USA
TECHNICAL REPORTS: LANDSCAPE AND WATERSHED PROCESSES
932 Journal of Environmental Quality • Volume 40 • May–June 2011
to rivers and streams. In a study performed on three streams in Illinois, tile drainage was determined to be the largest source of P to surface waters with larger dissolved reactive P (DRP) concentrations occurring, compared with base fl ow, as dis-charge increased (Gentry et al., 2007). Tile drainage was also an important source of P export in agricultural watersheds in Delaware, Indiana, and Canada (Sims et al., 1998). Fraterrigo and Downing (2008) found the agricultural landscape to have a similar eff ect on P concentrations in lakes in Iowa, because P concentrations in the lakes correlated with the amount of sur-rounding land dominated by agriculture.
Th e occurrence of diff erent forms of P depends on the type of transport. Particulate P (PP) is bound to soil particles and organic matter, and enters rivers and streams mostly through surface runoff and erosion. Th e majority (75–95%) of P coming from runoff of conventionally tilled land often consists of PP (Sharpley et al., 1994). Dissolved reactive P is not sedi-ment bound and tends to be the dominant form transported in runoff from grass or forested lands, which produce less erosion (Sharpley et al., 1994). However, these proportions can vary greatly from site to site, and as a function of precipitation. As shown by Gentry et al. (2007), the loads of DRP, PP, and total P (TP) in Central Illinois streams depend greatly on precipita-tion and stream discharge. During years without major storm events, they found DRP constituted 50 to 73% of the TP river-ine loads, whereas during a wet year, DRP was 35% of the TP load. Overall, concentrations of both DRP and TP increased during storm events and were signifi cantly less during the low fl ow of summer and fall. During a large discharge event, PP concentrations in several streams were two to fi ve times greater than DRP as a result of large amounts of surface runoff and erosion into the streams. However, in most years, large dis-charge events did not occur and most P was transported in the form of DRP moving to streams through tile drainage (Gentry et al., 2007).
Another important source of P within the MRB is point sources, particularly sewage treatment plant effl uent. Point sources were found to contribute 34% of the average annual P fl ux in the Gulf of Mexico and 27% of the spring fl ux of P over the 5-yr period from 2001 to 2005 (USEPA, 2007). For the period 1980 through 1997, 47% of the TP loads occurring in rivers in Illinois were attributed to sewage effl uent (David and Gentry, 2000). Sewage effl uent can contribute a large amount of P to rivers and streams, and few sewage treatment plants in the MRB are required to remove P from their effl uent.
Th e Mississippi River Gulf of Mexico Watershed Nutrient Task Force created an action plan in which goals for reduc-tion of N and P were developed (45% reduction in loads for both nutrients) in an eff ort to reduce the size of the hypoxic zone (Mississippi River/Gulf of Mexico Watershed Nutrient Task Force, 2008). To achieve these goals, additional studies are needed that help to understand P sources to riverine sys-tems throughout the entire MRB, so that conservation prac-tices and point source reductions can be targeted at the sources likely leading to greater P yields. Th e USGS developed the SPARROW (spatially referenced regression on watershed attri-butes) model to determine the sources and transport of total N (TN) and TP in the MRB and predict the mean annual fl ux and yield of TN and TP delivered to the Gulf of Mexico
(Alexander et al., 2008; Robertson et al., 2009). However, SPARROW only estimates TP yields and delivery, uses older data, and only provides annual loads. Th erefore, additional analyses and models of P sources across the MRB are needed to help focus programs to reduce P loads. We analyzed the spatial pattern of P inputs and outputs in the MRB as they relate to riverine January to June P yields of TP, PP, and DRP. Th ese analyses identifi ed which counties across the entire MRB have the greatest yields of P and most critical factors related to P loss at this large scale.
Materials and MethodsData SourcesA 10-yr dataset (1997–2006) of factors thought to be related to P delivery was constructed for each of the 1768 counties in the MRB. Th is is the same core database used by David et al. (2010) to examine N sources and fl uxes. National Agricultural Statistics Service provided data on the acres of crops planted and amount of biomass harvested each year in every county for corn (Zea mays L.), soybeans [Glycine max (L.) Merr.], wheat (Triticum aes-tivum L.), rice (Oryza sativa L.), cotton (Gossypium hirsutum L.), sorghum [Sorghum bicolor (L.) Moench], alfalfa (Medicago sativa L.), and other hay crops (USDA, 2008). Th e crop fraction for each county was calculated as the percent of the county that was planted in corn, soybeans, wheat, rice, cotton, and sorghum. Th e number of hogs, cattle, broilers, layers, and turkeys were avail-able from county-level data from the 1997 and 2002 Census of Agriculture, which were used either to interpolate or extrapo-late animal numbers for the remaining years for our 10-yr study period (USDA, 2008). Pasture data were also obtained in this way from the Census of Agriculture. Fertilizer P inputs for each county were estimated from yearly states’ sales of P fertilizer (AAPFCO, 2008) and then estimated at the county level using Census of Agriculture fertilizer expenditure data from 1997 and 2002 (USDA, 2008), interpolating for the other years. We compared fertilizer P estimates from this method with sales data and found large discrepancies for some counties along the lower Mississippi River. About 50 of the counties located along the Mississippi River in Missouri, Arkansas, Louisiana, Mississippi, and Tennessee had estimated fertilizer P values about double the amount of P fertilizer sold in 2002 in the county from our expenditure data. Th erefore, we used half of our calculated value averaged over the 10-yr period for these counties. Human popu-lation numbers were obtained from the U.S. Census Bureau for 2000 (U.S. Bureau of the Census, 2008).
Phosphorus EstimatesCrop harvest of P by county was determined by using the bio-mass harvests (yields) combined with assumed P concentrations. Th e P concentrations used for each crop are given in Table 1. Th e amount of P in animal manure was calculated with estimates made by Goolsby et al. (1999). Hogs, cattle, broilers, layers, and turkeys were estimated at 0.012, 0.053, 0.0003, 0.0006, and 0.0013 kg P d−1, respectively (Goolsby et al., 1999). Th ese values were multiplied by the number of animals in each county for each year to obtain the amount of P contributed through animal manure. Th e amount of P consumed by humans in each county was estimated by multiplying the population in the year
Jacobson et al.: Spatial Analysis of P in Mississippi River Basin 933
2000 in each county by 0.46 kg P yr−1, the per capita value of P consumed by humans (David and Gentry, 2000). We assumed that this P will be contributed to riverine loads as sewage effl uent, since few treatment plants in the basin remove P.
Phosphorus BalancesA P balance, called net P inputs, was calcu-lated; components of the P balance were crop P harvested, animal manure P, human con-sumption of P, and fertilizer P. Crop P har-vested was the sum of corn, soybeans wheat, sorghum, rice, and cotton P harvested. Animal manure P consisted of the sum of hog, cattle, broiler, layer, and turkey manure P. Th e net P inputs were calculated as (fertilizer P + animal manure P + human con-sumption of P) − (crop P harvested) per hectare of the county. Our net P estimates are similar to the net anthropogenic P inputs calculated by Russell et al. (2008) for the Chesapeake Bay region and Han et al. (2011) for Lake Erie and Lake Michigan basins.
Landscape and Climate CharacteristicsTile drainage, soil bulk density, soil clay content, slope, and precipitation were obtained or estimated for each county. Th e percentage of each county that is tile drained was obtained from Sugg (2007), which was based on the locations of row-cropped areas and poorly drained soils. See David et al. (2010) for a complete description of this estimate. Th e soil bulk density and clay content were obtained from the NRCS Soil Survey Geographic database (USDA–NRCS, 2010b).
Th e average slope of each county was calculated from Digital Elevation Models (DEMs) using ArcGIS v9.3 (Environmental Systems Research Institute, 2008). Th e DEMs at 1 arc second (30-m resolution) were downloaded for each state from the USGS Th e National Map Seamless Server (USGS, 2010a) and projected to the Universal Transverse Mercator (UTM) projec-tion based on the UTM zone of the state’s location. Th e Spatial Analyst tool through zonal statistics was used to calculate the average slope for each county.
Precipitation data from 1997 to 2006 were obtained from the PRISM Climate Group and were distributed at about 4-km resolution (PRISM Climate Group, 2009). Using ArcGIS, the precipitation data for each month were summed for each year and then averaged by county using zonal statistics.
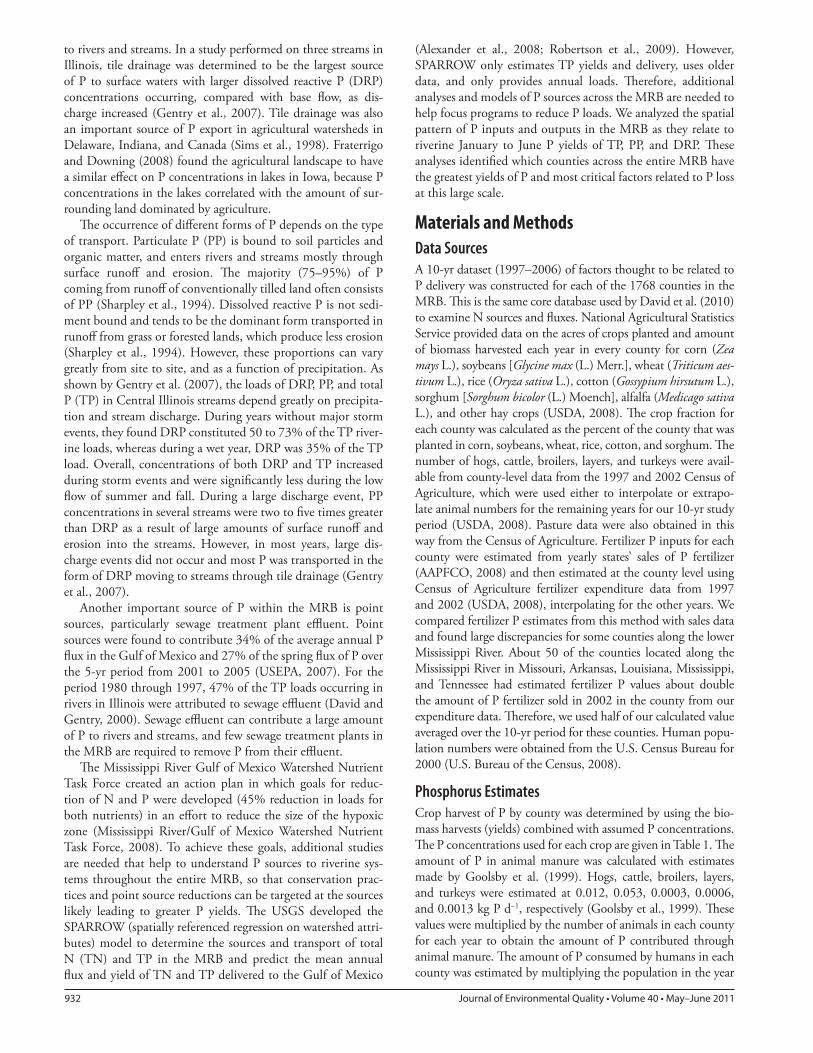
Riverine Phosphorus Concentrations and YieldsA watershed analysis was conducted using 113 unique water-sheds located throughout the MRB (Fig. 1). Flow and P con-centration data for each watershed were used to calculate yield estimates from 1997 to 2006 for 1 January to 30 June. Th e months from January to June were chosen to show the winter/spring time period, which is the time period that contributes nutrients causing the hypoxic zone in the Gulf of Mexico in the spring and summer (Mississippi River/Gulf of Mexico Watershed Nutrient Task Force, 2008). Flow data were avail-able from USGS and TP and DRP data were from USGS and USEPA Storage and Retrieval database (USGS, 2010b;
USEPA, 2009). We only selected those sites for which there was continuous fl ow data available from USGS and at least three TP concentrations between January and June for each of the majority of the years during the 1997 to 2006 time period. However, data collection varied by state and year with some years having more concentration data available than others. Th ere were typically about 40 TP concentration measurements at each location. Th ese criteria gave us total P data for 101 of the 113 sites, and DRP for 73 of the 113 sites. Some of the sites that had DRP data did not have TP measurements. Th e PP concentrations were calculated by subtracting the DRP concentration from the TP concentration, and PP concentra-tions were calculated for 61 sites. Th e TP, DRP, and PP con-centrations were averaged for the 6-mo period, multiplied by the average fl ow during the 6 mo from 1997 to 2006, and then divided by the watershed area to obtain an estimate of the yield. Watersheds were also chosen to be in a variety of areas and the range in watershed size in this analysis was from 79 to 50,360 km2, with the median watershed area 1981 km2. Th e watershed boundaries were delineated using ArcGIS by clip-ping and merging the eight- or 12-digit hydrologic unit code (HUC8 or HUC12) watersheds that contained the fl ow path of the river up to the point of data collection.
ModelingModels were created to relate the independent variables to the yields in kg ha−1 of TP, DRP, and PP of the unique watersheds.
Table 1. Estimated P removal in grain, hay, and cotton harvests.
mg P kg−1 dry mass
kg P per common harvest unit harvest unit % moisture
in harvest unit
Corn† 3170 0.068 bushel 15.5Soybean† 6880 0.163 bushel 13Wheat† 3870 0.091 bushel 13.5Sorghum† 3710 0.082 bushel 13Alfalfa† 2080 2.1 ton 10Hay† 6890 6.94 ton 10Rice‡ 2540 0.115 hundredweight 11.3Cotton‡ 3500 0.862 bale 7.8
† From Goolsby et al. (1999).
‡ From USDA–NRCS (2010a).
Fig. 1. Watersheds used in the modeling analysis (n = 113). All water-sheds were not used in each model, which was dependent on data availability. Black dots indicate outlet of the watershed where data were available.

934 Journal of Environmental Quality • Volume 40 • May–June 2011
Estimates of the independent variables averaged from 1997 through 2006 were made for each unique watershed using ArcGIS. A weighted average of the variables was calculated based on the area of each county that was located in the watershed. Th e independent variables were compared for the counties in the MRB and 113 unique watersheds to verify that these watersheds were representative of the entire basin. Spearman’s correlation coeffi cient was used to analyze correlation among the indepen-dent variables and January to June yields of TP, DRP, and PP for each unique watershed. Th e independent variables that were found to be correlated with the watershed TP, DRP, and PP yields were used in creating models, as well as other variables that were thought to be important from the literature.
All models were run using the TP, DRP, and PP yield data with a square root transformation to correct for the non-nor-mality of the yield data. Multiple regression models were con-structed for the TP, DRP, and PP yields, using the SAS v9.1 PROC REG procedure (SAS Institute, 2003). Variables that had the strongest correlations were added to models sequen-tially and retained if they were signifi cant. Th e residuals of each model were then examined for spatial autocorrelation with the global Moran’s I to determine the need for spatial regression models using GeoDa (Anselin et al., 2006). Th e rook contigu-ity spatial weights matrix created by GeoDa was used in this analysis. Th e Breusch–Pagan test and residual plots were used to determine the presence of heteroskedasticity in the residuals of each model.
We examined two formulations of spatial regression models to account for spatial autocorrelations—a spatial lag model and spatial error model. Th e spatial lag model accounts for spatial trends in the data by incorporating an autocorrelation term in the regression model structure, whereas the spatial error model does so by incorporating an autocorrelation term in the error term. Th e spatial lag model follows the equation below:
Y = Xβ + ρWY + ε [1]
where Y is the yield of TP, DRP, or PP (dependent variable), X is the independent variable, β is the regression coeffi cient, ρ is the spatial autoregression coeffi cient, W is the spatial weight matrix, WY is the spatially lagged dependent variable, and ε is the random error term.
Th e spatial error model follows:
Y = Xβ + ε ε = λWε + ξ [2]
where Y is the yield of TP, DRP, or PP (dependent variable), X is the independent variable, β is the regression coeffi cient, and ε is the random error term, where λ is the spatial autoregres-sion coeffi cient, W is the spatial weights matrix, Wε is the spa-tially lagged error term, and ξ is the independent error term.
Th e multiple regression models and spatial lag and error models were compared to determine which best fi t the data to show the most critical factors controlling riverine P yields. Th e best model based on having the greatest R2 and log likelihood values, and the least Akaike’s information criterion (AIC) value for each constituent was then applied to each county in the MRB. Th e estimated TP, DRP, and PP yields for each county were visualized using ArcGIS.
Th e estimated TP yields from our best model were compared with TP yields predicted by the SPARROW model (Robertson et al., 2009) for the HUC8 watersheds in the MRB. Th e HUC8 level watershed is at a size where decisions by federal or state land managers may be made about P yields and sources across the MRB. Our predicted TP yields and SPARROW’s predicted TP yields from Robertson et al. (2009) were spatially averaged using geographic information system (GIS) for these HUC8 watersheds to make the comparison.
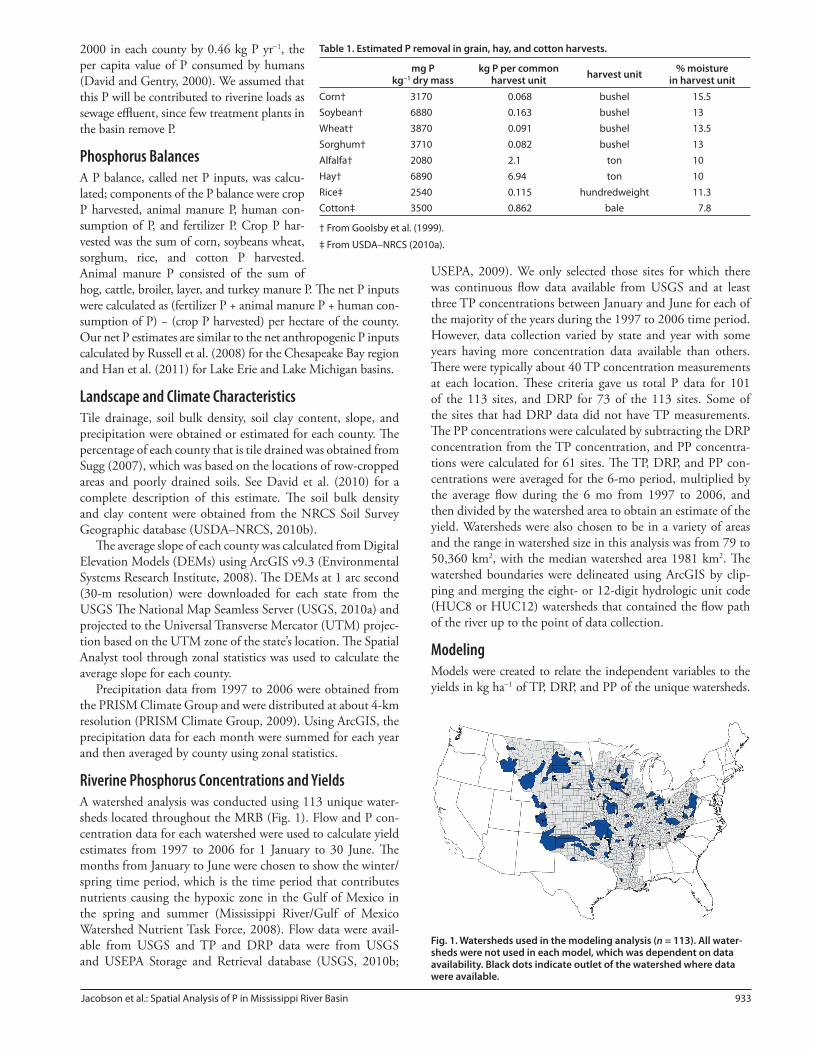
ResultsCounty Level CharacteristicsInputs of fertilizer P were greatest in the Cornbelt of the MRB (Fig. 2A). Th is is where the greatest crop fraction (Fig. 2B) was located with the crops predominantly in a corn and soy-bean rotation, which is characteristic of the Upper Midwest. Fertilizer P inputs were signifi cantly correlated to the crop frac-tion (rs = 0.88, P < 0.0001), tile drainage fraction (rs = 0.56, P < 0.0001), and crop P harvested (rs = 0.90, P < 0.0001). Th erefore, we considered fertilizer as an indicator of row crop intensity.
Animal manure P inputs were greatest in the western part of the MRB (Fig. 2C), where animal production is most con-centrated. Net P inputs were also greatest in the western part of the MRB, likely due to these manure inputs (Fig. 2D). Animal manure P inputs and net P inputs were greatly correlated (rs = 0.70, P < 0.0001). In Illinois, where there is more limited animal production, net P inputs were negative as fertilizer and manure inputs were less than crop harvest of P. Net P inputs were not greatly correlated with fertilizer P inputs (rs = 0.13, P < 0.0001) or human P consumption (rs = 0.04, P = 0.083). Th erefore, many of the counties with greater net P inputs had large animal manure P inputs, rather than fertilizer or effl uent sources.
To show that the watersheds used to develop the model for the MRB were representative of the MRB, the distribution of the county characteristics in the watersheds was compared with the characteristics across the MRB (Table 2). Th e median values were similar among the watersheds and the entire MRB for most of the characteristics. However, the entire MRB had a median crop fraction (14.3%) that was about double the crop fraction for the modeled watersheds (7.1%), but the rest of the distribution was similar. Th e distributions for the other char-acteristics were similar, but the maximum was greatest for the MRB counties for all characteristics except for bulk density, which was less than but close to the watershed maximum. Th e minimums were predominantly the same for the watershed and MRB characteristics, with the exception of precipitation having a noticeably lesser minimum for the model and clay having a noticeably lesser minimum for the MRB. Even with these diff erences, the model watershed characteristics com-pared well with the overall MRB and were assumed to be rep-resentative of the entire basin.
Correlation AnalysisTh e TP, DRP, and PP yields for the watersheds were cor-related with the county level characteristics averaged for the watersheds as shown with Spearman’s correlation coeffi cients
Jacobson et al.: Spatial Analysis of P in Mississippi River Basin 935
(Table 3). Crop fraction, tile drainage, fertilizer P inputs, and crop P harvested were signifi cantly correlated with TP and PP yields at the 0.01 probability level. Crop fraction, fertilizer P inputs, and crop P harvested were also signifi cantly correlated with DRP yields at the 0.01 probability level. Tile drainage was signifi cantly correlated with DRP yields at the 0.05 prob-ability level.
Animal manure P inputs were signifi cantly correlated with the yields of TP but were not signifi cantly correlated with DRP or PP yields. Human P consumption was signifi cantly corre-lated with TP and DRP yields, and had greater correlations than animal manure P inputs. Th e net P inputs in the MRB were not signifi cantly correlated with DRP or PP yields, and were signifi cantly correlated with TP yields at the 0.05 prob-ability level.
Th e percentage slope of the watersheds was greatly nega-tively correlated with the watersheds’ yields of TP, DRP, and PP. Precipitation was greatly correlated with yields of TP and DRP, and was not signifi cantly correlated with PP yields. Th e percentage clay of the soils of the watersheds was signifi cantly correlated at the 0.01 probability level with TP and PP yields, and the bulk density was only signifi cantly correlated with
the yields of TP at the 0.05 probability level. Th e areas of the watersheds were negatively correlated with all P yields but were only signifi cant with DRP yields.
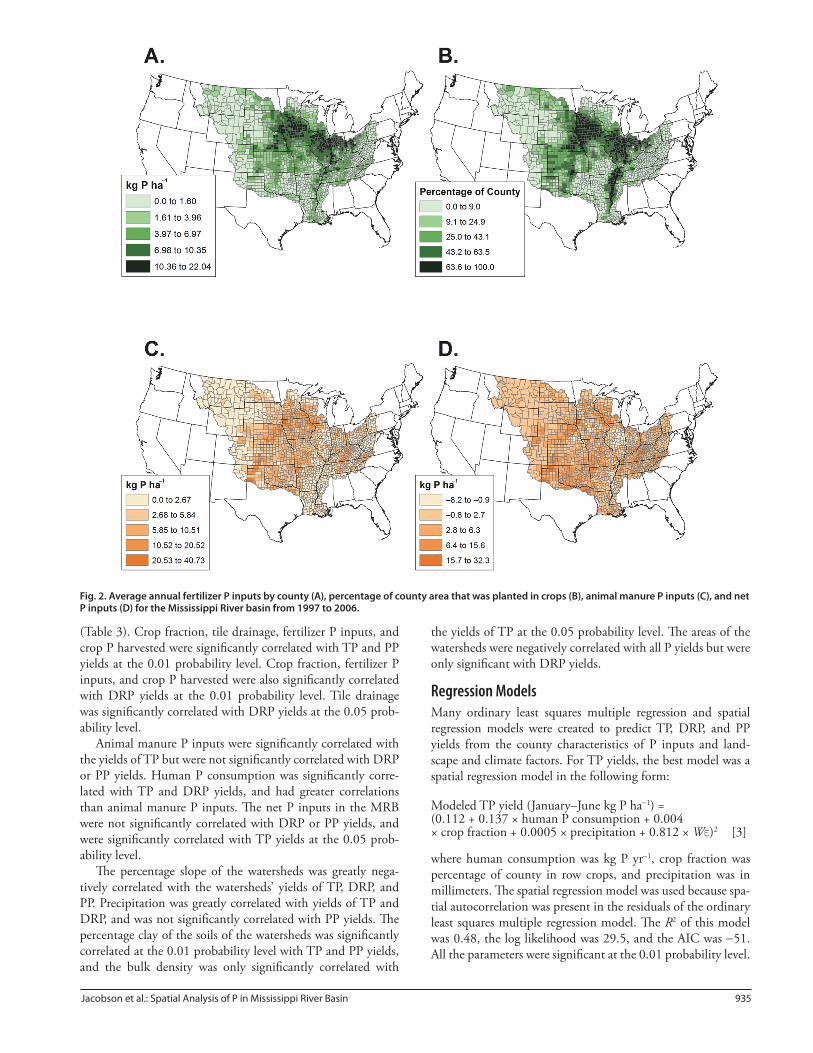
Regression ModelsMany ordinary least squares multiple regression and spatial regression models were created to predict TP, DRP, and PP yields from the county characteristics of P inputs and land-scape and climate factors. For TP yields, the best model was a spatial regression model in the following form:
Modeled TP yield (January–June kg P ha−1) = (0.112 + 0.137 × human P consumption + 0.004 × crop fraction + 0.0005 × precipitation + 0.812 × Wε)2 [3]
where human consumption was kg P yr−1, crop fraction was percentage of county in row crops, and precipitation was in millimeters. Th e spatial regression model was used because spa-tial autocorrelation was present in the residuals of the ordinary least squares multiple regression model. Th e R2 of this model was 0.48, the log likelihood was 29.5, and the AIC was −51. All the parameters were signifi cant at the 0.01 probability level.
Fig. 2. Average annual fertilizer P inputs by county (A), percentage of county area that was planted in crops (B), animal manure P inputs (C), and net P inputs (D) for the Mississippi River basin from 1997 to 2006.

936 Journal of Environmental Quality • Volume 40 • May–June 2011
Th e best model predicting DRP yields was an ordinary least squares multiple regression model as shown:
Modeled DRP yield (January–June Kg P ha−1) = (0.021 + 0.064 × human P consumption + 0.014 × fertilizer P inputs + 0.0004 × precipitation)2 [4]
where human consumption was kg P yr−1, fertilizer P inputs were kg P ha−1 yr−1, and precipitation was in millimeters. Th ere was no spatial autocorrelation present in the residuals; there-fore, a spatial regression model was not necessary. Th e R2 of the model was 0.42, the log likelihood was 59.5, and the AIC was −111. Human P consumption was signifi cant at the 0.05 prob-
ability level and fertilizer P inputs and precipitation were signifi cant at the 0.01 probability level.
Th e PP yields were best predicted by a spatial error model as follows:
Modeled PP yield (January–June kg P ha−1) = (−0.601 + 0.16 × human P consumption + 0.003 × crop fraction + 0.673 × bulk density + 0.844 × Wε)2 [5]
where human consumption was kg P yr−1, crop frac-tion was percentage of county in row crops, and bulk density was g cm−3. Th e spatial error model was chosen because spatial autocorrelation was present in the residuals of the ordinary least squares multiple regression model. Th e R2 of this model was 0.49, the log likelihood was 23.36, and the AIC was −38.73. Bulk density was signifi cant at the 0.05 probability level and human P consumption, crop fraction, and the spatially lagged error term were signifi cant at the 0.01 probability level.
Table 2. Distribution of modeled watersheds (model, n = 113) and Mississippi River basin (MRB) county (MRB, n = 1768) characteristics and P fl uxes averaged for 1997 to 2006.
Characteristic Dataset Min. 25th percentile Median 75th percentile Max.
Crop fraction (%) Model 0.0 0.5 7.1 51.9 86.1MRB 0.0 1.1 14.3 45.9 100.0
Tile drainage (% of area) Model 0.0 0.0 0.0 3.4 99.2MRB 0.0 0.0 0.0 4.1 100.0
Fertilizer P (kg P ha−1) Model 0.0 0.5 1.8 6.0 13.0MRB 0.0 0.9 2.6 6.1 22.0
Crop P harvested (kg P ha−1) Model 0.0 0.0 0.4 8.3 20.0MRB 0.0 0.1 1.4 7.0 22.1
Animal manure P (kg P ha−1) Model 0.1 1.3 3.0 6.3 14.3MRB 0.0 1.6 3.4 5.8 40.7
Human P (kg P ha−1) Model 0.0 0.0 0.1 0.2 3.5MRB 0.0 0.0 0.1 0.1 10.0
Net P inputs (kg P ha−1) Model −6.2 1.1 2.4 4.0 10.3MRB −8.2 0.9 2.4 4.4 32.3
Slope (%) Model 1.0 3.6 6.8 16.0 42.7MRB 0.2 2.6 4.9 10.4 50.2
Precipitation (mm) Model 88.5 319.9 468.0 626.4 885.2MRB 123.3 363.1 504.5 646.5 991.3
Clay (%) Model 6.4 15.9 20.1 24.8 43.7MRB 3.7 17.1 20.7 25.0 52.9
Bulk density (g cm−3) Model 0.4 1.3 1.4 1.4 1.5MRB 0.4 1.3 1.4 1.4 1.7
Area (km2) Model 79 904 1981 4608 50,360Flow† (cm) Model 0.1 5.5 16.8 29.1 58.8Yield TP† (kg P ha−1) Model 0.0 0.08 0.23 0.4 1.27Yield DRP† (kg P ha−1) Model 0.0 0.03 0.09 0.14 0.4Yield PP† (kg P ha−1) Model 0.0 0.07 0.2 0.30 1.04
† January to June. TP, total phosphorus; DRP, dissolved reactive phosphorus; PP, particulate phosphorus.
Table 3. Spearman’s correlation coeffi cients (rs) showing associations between total P (n = 101), dissolved reactive P (n = 73), and particulate P (n = 61) yields, and Mississippi River basin county characteristics.
Characteristic Yield TP† Yield DRP Yield PP
Crop fraction 0.45** 0.33** 0.46**Tile drainage 0.45** 0.29* 0.37**Fertilizer P 0.57** 0.48** 0.48**Crop P harvested 0.49** 0.34** 0.48**Animal manure P 0.36** 0.22 0.11Human P 0.44** 0.50** 0.13Net P inputs 0.25* 0.16 0.10Slope −0.39** −0.37** −0.34**Precipitation 0.36** 0.41** 0.19Clay 0.28** 0.16 0.42**Bulk density 0.25* 0.02 0.25Watershed area −0.07 −0.33** −0.02
* Signifi cant at P < 0.05.
** Signifi cant at P ≤ 0.01.
† TP, total phosphorus; DRP, dissolved reactive phosphorus; PP, particulate phosphorus.

Jacobson et al.: Spatial Analysis of P in Mississippi River Basin 937
Th ese models were applied to each county in the MRB to show the predicted January to June 1997 to 2006 average river-ine TP, DRP, and PP yields (Fig. 3A, 3B, and 3C, respectively). Th e classes in the fi gures show the number of counties with the greatest yields with the three greatest classes having about 100 counties in each, the fourth class having about 400 counties, and the last class having about 1050 counties. We chose this class breakout to clearly illustrate the most important counties related to the largest P yields from our analysis.
Predicted TP yields were greatest in the Midwest Cornbelt region through southern Minnesota, Iowa, Illinois, Indiana, and Ohio. Th ere were also large TP yields predicted in counties along the Mississippi River in the southern part of the MRB in Missouri, Arkansas, Louisiana, Tennessee, and Mississippi. Predicted TP yields were less in the counties in the western part of the MRB.
Th e spatial distribution of the predicted DRP yields was similar to that of the predicted TP yields. Predicted DRP yields were greatest in portions of the Cornbelt region of the MRB, particularly in Illinois, Indiana, and Ohio. Th ere were also some counties with large predicted DRP yields in Kentucky, Tennessee, and Alabama. Th e least predicted DRP yields were in the western region of the MRB.
Th e predicted PP yields had a more variable spatial distribu-tion. Th e greatest predicted PP yields were in the Cornbelt, but there were fewer counties with large values in that area as compared with the predicted TP and DRP yields. Th e least predicted PP yields were along the western and eastern border of the MRB. However Nebraska, Kansas, and Oklahoma had more counties with larger predicted PP yields than was pre-dicted for TP or DRP yields.
DiscussionModel VariablesTh e importance of both agriculture and human populations in contributing to TP, DRP, and PP yields is strongly suggested by the model results. Both models for TP and PP yields had crop fraction as a signifi cant variable and DRP yield had fertilizer P inputs as a signifi cant variable. Crop fraction and fertilizer P were both indicators of row crop intensity of agriculture and they were greatly correlated with each other. Th erefore, agricul-tural practices of intense row cropping were found to be one of the explanatory variables in contributing all three forms of P to rivers and streams.
Precipitation was signifi cant as a contributing factor in the models for the yields of TP and DRP. Th ese results indicate that the inputs of P from agriculture depended on precipitation to aid in the movement of P from fi elds to rivers and streams through surface runoff . Precipitation was also greatly correlated with fl ow (rs = 0.94, P < 0.0001), as would be expected, but fl ow was never as important in the models as was precipitation. However, precipitation was not signifi cant in models predict-ing PP yields. Instead, bulk density of the soil was signifi cant in the model for PP yields. Th erefore, soil characteristics were more important in contributing to PP yields, whereas pre-cipitation (and the resulting runoff and streamfl ow) was more important in predicting TP and DRP yields.
Th e third variable that was signifi cant in the models for all three forms of P was P consumed by humans. Th is variable was used as an indicator for sewage effl uent P inputs to rivers and streams. As a result, inputs of P from sewage effl uent were a signifi cant contributing factor to P yields. Because sewage treatment plants in most of the MRB do not have P removal technology installed, P is directly added to surface waters and can be a major contributor to P yields (David and Gentry, 2000; USEPA, 2007). David and Gentry (2000) estimated that ~47% of the P exported by rivers in Illinois was from sewage effl uent. David et al. (2010) also determined that effl u-ent was signifi cant in their model of nitrate yields in the MRB, although only a small amount of the riverine nitrate yields was explained by this term. Given the direct inputs of P to rivers from sewage effl uent and little removal in the water column from chemical processes (Bedore et al., 2008), chemical or bio-logical removal of effl uent P will likely be needed in addition to agricultural reductions.
Animal manure P inputs were not signifi cant in any of the models predicting TP, DRP, or PP yields, which was unex-pected. We used manure per hectare of area in the county, as well as assuming manure was only applied to pastureland. We also evaluated the assumption that all manure (other than cattle) was applied to cropland. None of these variables were signifi cant in any model. Th erefore, animal manure P was not a signifi cant contributor to any of the P yields based on our modeling. Th is was likely due to the greatest amount of animal manure being in counties in the western portion of the MRB where precipitation was less. With less precipitation, there was less streamfl ow compared with the wetter row-cropped areas of the basin. Th is could lead to greater in-stream P concentrations but relatively lesser yields and stream loads, an important result of our analysis.
Slope had a negative correlation with TP, DRP, and PP yields, and was not signifi cant in any of the models. We had expected that greater slope might indicate greater erosion and greater losses of total P and PP to streams. Our observed result is probably because the counties with the greatest slope were not used for agriculture and as a result did not contribute a large amount of P. In the entire MRB, slope and crop fraction were negatively correlated (rs = −0.66, P < 0.0001). Th erefore, the counties with the least slope were used for agriculture and, as shown by the models, had greater P yields.
Net P inputs were not signifi cantly correlated with any of the P yields and were not used in the yield models. Th is indi-cated that net P inputs, and even negative net P inputs, did not explain P losses from counties. Net P inputs were negative for 180 counties in the MRB with the majority of these coun-ties located in Illinois, Indiana, Iowa, and along the Mississippi River in Arkansas and Mississippi. A negative net P input indi-cated that more P was harvested in crops and taken away from a county than was added through fertilizer, animal manure, and sewage effl uent. A positive net P input indicated that more P was being put into a county through fertilizer, animal manure, and sewage effl uent than was being removed through harvested crops. Th e positive net P inputs did not follow an obvious spa-tial trend and could not be used to predict P yields. Net P input and animal manure were correlated (rs = −0.79, P < 0.0001), again suggesting that large net P inputs were in those counties

938 Journal of Environmental Quality • Volume 40 • May–June 2011
with greater animal numbers. Our median net P input was 2.4 kg P ha−1 yr−1 for all counties in the MRB, less than the 4.5 kg P ha−1 yr−1 found in the Chesapeake Bay region by Russell et al. (2008). Th e Chesapeake Bay region had only 6% row crop agriculture and 19% pasture, but a greater population density that led to greater net P inputs (Russell et al., 2008). Han et al. (2011) reports net P inputs of 5.6 and 11.2 kg P ha−1 yr−1 for Lake Michigan and Lake Erie watersheds, respectively, again greater than the overall average P input for the MRB. David and Gentry (2000) found that in Illinois there had been posi-tive P inputs for many years, but by the late 1990s inputs were about the same as outputs. In the USEPA Science Advisory Board report (USEPA, 2007), negative inputs were noted for the upper MRB, similar to what we observed here.
Han et al. (2011) reported that for 24 watersheds in the Lake Erie and Lake Michigan basins, net P inputs were strongly related to riverine P export, with an R2 of 0.93 for lower Michigan and R2 = 0.59 for Lake Erie watersheds. Th eir data were from 1974 to 1992 and do not refl ect the reduc-tions in P fertilizer use that has occurred or the large increases in crop productivity and harvest removals, which led to nega-tive P inputs in some of our watersheds. Th erefore, some of our intensive agricultural watersheds had the greatest riverine P loads with negative P inputs. Th is suggests that it is inten-sive agricultural production that leads to greater riverine P loss, rather than the net P input. Russell et al. (2008) found that for the Chesapeake Bay region, net P inputs were not statistically signifi cant (P = 0.10) in explaining watershed P loss but did explain 34% of the variation.
In our analysis, spatial error regression models were used to predict the TP and PP yields because the spatial error model better satisfi ed the assumptions of the multiple regres-sion model. Th e spatial error models for the TP and PP yields also had larger R2 and log likelihood values, as well as lesser AIC values than the spatial lag regression models. However, there was not a large diff erence among the coeffi cients in the equations created by the multiple regression and spatial error models. Th e signifi cant lambda coeffi cient indicated the need to include spatial autocorrelation in the model, but the spa-tially lagged error term was not included in the calculation predicting the county TP and PP yields. Th e spatially lagged error term could not be included because the errors could not be assumed to be the same at each county location. Th erefore, only the coeffi cients from the spatial error regression models were used to predict the TP and PP yields in the counties. Th e predicted yields were not very diff erent from those that would have been predicted by the multiple regression models.
Model ComparisonTh e TP yields for the 818 HUC8 watersheds in the MRB deter-mined using the SPARROW model are shown by Robertson et al. (2009). Compared with our map showing TP yields pre-dicted from our spatial error model, there is a somewhat similar distribution of the greatest TP yields being located in parts of Illinois and along the Mississippi River in Arkansas, Tennessee, Mississippi, and Louisiana (Fig. 4). Th e maps are also similar in that the least TP yields are along the eastern and western edges of the MRB. For the 818 HUC8 watersheds in the MRB, our TP yields were correlated with the SPARROW TP yields (rs =
0.78, P < 0.0001). However, there are quite a few diff erences in the maps with Robertson et al. (2009) having greater TP yields in Oklahoma, Arkansas, Kentucky, Tennessee, and Alabama, and fewer in Illinois and Indiana, as compared with the pre-dicted TP yields from our model. Th eir yields were much more variable compared with our estimates, with watersheds side by side having very diff erent yields. Point sources could lead to some of this variability but much of it was in agriculturally dominated areas.
Robertson et al. (2009) predicted a median TP yield of 0.82 kg P ha−1 yr−1 for the 818 HUC8 watersheds, whereas our median value for January to June was 0.20 kg P ha−1. We expected our 6-mo yields to be less, but they were only about 20 to 25% of the Robertson et al. (2009) estimates. In addi-tion, our 6-mo value is during the greatest fl ow period of the year, so that although we expected to see lesser values, we did not expect this much of a diff erence. For east-central Illinois, Gentry et al. (2007) reported average annual TP yields of 0.75, 0.46, and 0.58 kg P ha−1 for the Embarras, Kaskaskia, and upper Sangamon watersheds, respectively, measured from 1994 to 2003, with the years varying by watershed. Th e larger HUC8 watersheds, which include the Gentry et al. (2007) watersheds, predicted 6-mo values of 0.48, 0.48, and 0.51 kg P ha−1 for the Embarras, Kaskaskia, and upper Sangamon, respectively, using our Eq. [3]. Predicted values for these same watersheds from Robertson et al. (2009) were 1.62, 1.49, and 1.58 kg P ha−1, respectively. Our values are close to the annual values measured by Gentry et al. (2007), which again is expected since most of the fl ow and yield are during the January to June period (see Royer et al. [2006] for further discussion of timing). Th e Robertson et al. (2009) SPARROW values seem to be esti-mated at about three times the actual yield reported by Gentry et al. (2007).
In the SPARROW model, the parameters of alfalfa, other crops, and slope were not signifi cant at the 0.05 probability level in predicting total P yields (Alexander et al., 2008). Th is is similar to our model of TP yield in that slope was also not a signifi cant explanatory variable. Corn, soybeans, and urban sources were signifi cant in the SPARROW model, with corn and soybeans estimated to deliver 25.1% of the P to the Gulf of Mexico and urban sources 12.3% (Alexander et al., 2008). Corn and soybeans are similar to the crop fraction variable in our model and urban sources to sewage effl uent inputs. Th erefore, these results were consistent with our model since crop fraction and sewage effl uent P inputs were both signifi -cant and major contributing factors in our models. However, the croplands variable in SPARROW includes both fertilizer P and animal manure recovered from confi ned animals on nearby farms and applied to crops, whereas our crop fraction is simply the percentage of land in row crops. Th e SPARROW model also predicted that 37% of the P delivered to the Gulf of Mexico was from pasture/rangeland, which included manure inputs of P from unconfi ned animals and manure lost during the collection, storage, and treatment of wastes from confi ned animals (Alexander et al., 2008). Th erefore, SPARROW results are diff erent from our TP yield model in which P inputs from animal manure were not a signifi cant variable.
Th ere may be several reasons for the diff erences in P sources and TP predicted yield maps between our spatial error model

Jacobson et al.: Spatial Analysis of P in Mississippi River Basin 939
and SPARROW model (Alexander et al., 2008). One may be the diff erence in time periods for the data. SPARROW used stream data from 1975 to 1995 and nutrient source data from 1992; we used data from 1997 to 2006. Sprague and Lorenz (2009) showed changes in P fertilizer and manure inputs across the MRB from 1992/1993 to 2002/2003, which would cause our data and SPARROW’s data of P inputs to be diff erent. Th ey documented declines in manure loadings across much of Iowa, Illinois, Indiana, and Ohio. In addition, they found large declines in fertilizer P loadings in all MRB states east of the Mississippi River, as well as Iowa and Oklahoma (Sprague and
Lorenz, 2009). Another could be the way the data were used with SPARROW standardizing the P yield data for just the year 1992. We used a mean value from 1997 to 2006. Also, we calculated TP yields using average fl ow and TP concentrations. Th erefore, we may have underestimated large fl ow events, which can be important in the annual and seasonal transport of P (Gentry et al., 2007). Finally, the allocation of P inputs from animal manure by the SPARROW model was diff erent than our model. Th e animal manure P inputs for our model were based on the number of animals in each county, calculated as either manure applied per hectare of county area or to just pas-tureland within each county, whereas the SPARROW model allocated animal manure P inputs to either pasture and range-lands (confi ned animal manure), or to row crops (primarily unconfi ned manure). A large percentage of P from the manure applied to the pasture and rangelands was then found to enter rivers with the SPARROW model (Alexander et al., 2008). In our models, however, we could not fi nd signifi cant manure terms with animal manure applied to pasture and rangeland areas, or to row crops. Th erefore, the diff ering assumptions between our model and the SPARROW model for the distri-bution and contribution of P from animal manure resulted in very diff erent TP yield predictions in certain areas.
Fig. 3. Average annual predicted January to June total P (A), dissolved reactive P (B), and particulate P (C) yields for the counties in the Mississippi River basin from 1997 to 2006.
Fig. 4. Our predicted January to June total P (TP) yields using Eq. [3] (A) and SPARROW predicted total P yields (B) for the hydrologic unit code 8 watersheds in the Mississippi River basin. SPARROW TP yields are from Robertson et al. (2009).

940 Journal of Environmental Quality • Volume 40 • May–June 2011
Our three models explained between 42 and 49% of the variation in P yields across the MRB. We were not able to fi nd many other studies of this type. Woli et al. (2008) developed a multiple regression model for the Hokkaido Watershed in Japan that was heavily agricultural land, with 211 stream sam-pling locations and explained 21% of the variation. Russell et al. (2008) found that a combination of percentage devel-oped land and human population density explained 95% of the variability in TP yield in the Chesapeake Bay region. Th e SPARROW model was able to explain 68% of the variation in annual P yields normalized to average fl ow conditions for the MRB. At the farm scale, we know P losses can come from a small part of the landscape (Sharpley et al., 1994), although this may not be true in the fl at, tile-drained agricultural areas (Gentry et al., 2007). In our large-scale analysis, many of these fi eld-scale factors are not accounted for at a county level. In addition, recent studies have shown that streambank ero-sion can be an important source of P (Zaimes et al., 2008ab), which our analysis would not include. However, our analysis is still valuable in showing, at this large scale, which counties or watersheds are likely to have the greatest P yields and many of the important characteristics that explain P yields across the basin. Th en, particular types of fi elds or areas within a county that should be managed diff erently can become the focus. Th e 300 counties in the MRB with the greatest predicted P yields using our models were determined to be most in need of man-agement practices to limit P losses. Th ese counties had pre-dicted January to June TP yields >0.40 kg P ha−1, DRP yields >0.15 kg P ha−1, or PP yields >0.30 kg P ha−1. Since the major-ity of these counties were located in the Cornbelt region of the MRB, management of agricultural practices to limit P may be useful. For instance, the USEPA Science Advisory Board (USEPA, 2007) recommended the use of more complex crop-ping systems to improve the effi ciency of P use. Using peren-nial cropping systems and cover crops would also help reduce P in surface runoff (USEPA, 2007). However, these are practices that would alter the current agricultural system and can be dif-fi cult to implement.
We compared our P yield map with the nitrate yield map presented in David et al. (2010). David et al. (2010) found that tile-drained corn and soybean fi elds were the major source of nitrate in the MRB, with a small secondary source of sewage effl uent. Th is is similar to our P results, except that the greatest yields of total P include the tile-drained portion of the MRB, as well as other intensively managed agricultural areas (e.g., southern Illinois and lower Mississippi River fl oodplain). Th is suggests that some management practices, such as perennial crops, may be able to reduce both nitrate and P losses in some areas of the MRB.
Since the use of P fertilizer is needed for crop production, management in the way it is applied to limit potential runoff should be used. Phosphorus fertilizer should be applied when storms are unlikely and incorporated into soil to reduce poten-tial P loss due to runoff . Manure applied to agricultural fi elds should be incorporated into the soil profi le to limit P runoff (Sharpley et al., 2001). Th e use of wetlands, as well as conser-vation buff ers and riparian areas managed to retain P, would be useful in removing P in runoff from agricultural fi elds (USEPA, 2007). However, to be eff ective in retaining and fi l-
tering nutrients, riparian areas need to be managed appropri-ately for the water fl ow path (Sharpley et al., 2001). Th erefore, without altering the current agricultural system, practices can be implemented in the application of fertilizer and in the use of constructed wetland and riparian areas to reduce P in runoff .
Finally, we did fi nd that human consumption of P was a sig-nifi cant term in each of our models. Point source P, primarily from sewage effl uent, will also need to be reduced in any eff ort to decrease P yields where they are greatest.
ConclusionsOur models suggest that at the broad scale of the MRB, many factors known at the fi eld or small watershed scale to control P losses to streams are also important. Th is includes cropland within the area, P fertilizer inputs, and soil variables, such as bulk density, each of which were related to stream P yields. In addition, the importance of human populations (i.e., sewage effl uent) was also shown, a known major input of P to streams and rivers. However, manure P was not found at this large scale to be a signifi cant explanatory variable, which may be due to our focus on P yields (rather than in-stream P concentrations) and our large-scale view across the MRB, where row cropping was more important. Th is was perhaps due to the greater land area involved in row-crop agriculture in areas of the MRB with greater precipitation. Overall, our models add to our under-standing about where and what management tools might be needed to reduce P yields across the MRB.
AcknowledgmentsWe thank J. Fraterrigo, C. Mitchell, and K. Woli for their help in data collection, statistics, and GIS work, and G. McIsaac for his helpful comments on the manuscript. Th is research was funded by the NSF Biocomplexity in the Environment/Coupled Natural–Human Cycles Program (Grant #0508028).
ReferencesAAPFCO. 2008. Commercial fertilizer reports, 1997 to 2007. Association of
American Plant Food Control Offi cials. University of Kentucky, KY.Alexander, R.B., R.A. Smith, G.E. Schwarz, E.W. Boyer, J.V. Nolan, and
J.W. Brakebill. 2008. Diff erences in phosphorus and N delivery to the Gulf of Mexico from the Mississippi River Basin. Environ. Sci. Technol. 42:822–830. doi:10.1021/es0716103
Anselin, L., I. Syabri, and Y. Kho. 2006. GeoDa: An introduction to spatial data analysis. Geogr. Anal. 38:5–22. doi:10.1111/j.0016-7363.2005.00671.x
Bedore, P.D., M.B. David, and J.W. Stucki. 2008. Mechanisms of phosphorus control in urban streams receiving sewage effl uent. Water Air Soil Pollut. 191:217–229. doi:10.1007/s11270-008-9619-x
Bierman, V.J., N.N. Rabalais, S.C. Hinz, D. Zhu, R.E. Turner, and W.J. Wise-man. 1994. A preliminary mass balance model of primary productivity and dissolved oxygen in the Mississippi River plume/inner gulf shelf re-gion. Estuaries 17:886–899. doi:10.2307/1352756
CENR. 2000. Integrated assessment of hypoxia in the northern Gulf of Mex-ico. National Science and Technology Council Committee on Environ-mental and Natural Resources: Washington, DC.
David, M.B., L.E. Drinkwater, and G.F. McIsaac. 2010. Sources of nitrate yields in the Mississippi River basin. J. Environ. Qual. 39:1657–1667. doi:10.2134/jeq2010.0115
David, M.B., and L.E. Gentry. 2000. Anthropogenic inputs of nitrogen and phosphorus and riverine export for Illinois, USA. J. Environ. Qual. 29:494–508. doi:10.2134/jeq2000.00472425002900020018x
Donner, S. 2003. Th e impact of cropland cover on river nutrient levels in the Mississippi River Basin. Glob. Ecol. Biogeogr. 12:341–355. doi:10.1046/j.1466-822X.2003.00032.x
Environmental Systems Research Institute. 2008. ArcGIS 9.3. ESRI, Red-lands, CA.

Jacobson et al.: Spatial Analysis of P in Mississippi River Basin 941
Fraterrigo, J.M., and J.A. Downing. 2008. Th e infl uence of land use on lake nutrients varies with watershed transport capacity. Ecosystems 11:1021–1034. doi:10.1007/s10021-008-9176-6
Gentry, L.E., M.B. David, T.V. Royer, C.A. Mitchell, and K.M. Starks. 2007. Phosphorus transport pathways to streams in tile-drained agricultural watersheds. J. Environ. Qual. 36:408–415. doi:10.2134/jeq2006.0098
Goolsby, D.A., W.A. Battaglin, G.B. Lawrence, R.S. Artz, B.T. Aulenbach, R.P. Hooper, D.R. Keeney, and G.J. Stensland. 1999. Flux and sources of nutrients in the Mississippi–Atchafalaya River basin. Topic 3 Rep. of the integrated assessment on hypoxia in the Gulf of Mexico. NOAA Coastal Ocean Program Decision Analysis Ser. 17. NOAA Coastal Ocean Pro-gram, Silver Spring, MD.
Han, H., N. Bosch, and J.D. Allan. 2011. Spatial and temporal varia-tion in phosphorus budgets for 24 watersheds in the Lake Erie and Lake Michigan basins. Biogeochemistry 102:45–58. doi:10.1007/s10533-010-9420-y
Mississippi River/Gulf of Mexico Watershed Nutrient Task Force. 2008. Gulf Hypoxia Action Plan 2008 for reducing, mitigating, and controlling hypoxia in the northern Gulf of Mexico and improving water quality in the Mississippi River Basin. Mississippi River/Gulf of Mexico Water-shed Nutrient Task Force. Available at http://www.epa.gov/msbasin/pdf/ghap2008_update082608.pdf (verifi ed 2 Mar. 2011).
PRISM Climate Group. 2009. Precipitation. Oregon State University. Avail-able at http://www.prismclimate.org (verifi ed 2 Mar. 2011).
Robertson, D.M., G.E. Schwarz, D.A. Saad, and R.B. Alexander. 2009. In-corporating uncertainty into the ranking of SPARROW model nutrient yields from Mississippi/Atchafalaya River basin watersheds. J. Am. Water Resour. Assoc. 45:534–549. doi:10.1111/j.1752-1688.2009.00310.x
Royer, T.V., M.B. David, and L.E. Gentry. 2006. Timing of riverine export of nitrate and phosphorus from agricultural watersheds in Illinois: Implica-tions for reducing nutrient loading to the Mississippi River. Environ. Sci. Technol. 40:4126–4131. doi:10.1021/es052573n
Russell, M.J., D.E. Weller, T.E. Jordan, K.J. Sigwart, and K.J. Sullivan. 2008. Net anthropogenic phosphorus inputs: Spatial and temporal vari-ability in the Chesapeake Bay region. Biogeochemistry 88:285–304. doi:10.1007/s10533-008-9212-9
SAS Institute. 2003. SAS v. 9.1. SAS Inst., Cary, NC.Sharpley, A.N., S.C. Chapra, R. Wedepohl, J.T. Sims, T.C. Daniel, and K.R.
Reddy. 1994. Managing agricultural phosphorus for protection of surface waters: Issues and options. J. Environ. Qual. 23:437–451. doi:10.2134/jeq1994.00472425002300030006x
Sharpley, A.N., P. Kleinman, and R. McDowell. 2001. Innovative management of agricultural phosphorus to protect soil and water resources. Commun. Soil Sci. Plant Anal. 32:1071–1100. doi:10.1081/CSS-100104104
Sims, J.T., R.R. Simard, and B.C. Joern. 1998. Phosphorus loss in agricultural
drainage: Historical perspective and current research. J. Environ. Qual. 27:277–293. doi:10.2134/jeq1998.00472425002700020006x
Sprague, L.A., and D.L. Lorenz. 2009. Regional nutrient trends in streams and rivers of the United States, 1993–2003. Environ. Sci. Technol. 43:3430–3435. doi:10.1021/es803664x
Sugg, Z. 2007. Assessing U.S. farm drainage: Can GIS lead to better esti-mates of subsurface drainage extent? World Resources Institute, Wash-ington, DC.
Sylvan, J.B., Q. Dortch, D.M. Nelson, A.F. Maier Brown, W. Morrison, and J.W. Ammerman. 2006. Phosphorus limits phytoplankton growth on the Louisiana Shelf during the period of hypoxia formation. Environ. Sci. Technol. 40:7548–7553. doi:10.1021/es061417t
Turner, R.E., and N.N. Rabalais. 1991. Changes in Mississippi River water quality this century. Bioscience 41:140–147. doi:10.2307/1311453
U.S. Bureau of the Census. 2008. Annual population estimates by county, 2000. Available at http://www.census.gov (verifi ed 2 Mar. 2011).
USDA. 2008. National Agricultural Statistics Service State and County data. Available at http://www.nass.usda.gov (verifi ed 2 Mar. 2011). USDA-NASS, Washington, DC.
USDA–NRCS. 2010a. Nutrient Content of Crops. Available at http://plants.usda.gov/npk (verifi ed 2 Mar. 2011). National Plant Data Center, Baton Rouge, LA.
USDA–NRCS. 2010b. Soil Survey Geographic (SSURGO) database. http://soils.usda.gov/survey/geography/ssurgo (verifi ed 2 Mar. 2011).
USEPA. 1998. National water quality inventory: 1998. Report to congress. Offi ce of Water, USEPA, Washington, DC.
USEPA. 2007. Hypoxia in the northern Gulf of Mexico, an update by the EPA Science Advisory Board. EPA-SAB-08-003. USEPA, Washington, DC.
USEPA. 2009. STORET/WQX. Available at http://www.epa.gov/storet (veri-fi ed 2 Mar. 2011). EROS Data Center, Sioux Falls, SD.
USGS. 2010a. Th e National Map Seamless Server. Available at http://seamless.usgs.gov (verifi ed 2 Mar. 2011).
USGS. 2010b. USGS Water Data for the Nation. Available at http://water-data.usgs.gov (verifi ed 2 Mar. 2011).
Woli, K.P., A. Hayakawa, T. Nagumo, H. Imai, T. Ishiwata, and R. Hat-ano. 2008. Assessing the impact of phosphorus cycling on river wa-ter P concentration in Hokkaido. Soil Sci. Plant Nutr. 54:310–317. doi:10.1111/j.1747-0765.2007.00243.x
Zaimes, G.N., R.C. Schultz, and T.M. Isenhart. 2008a. Total phospho-rus concentrations and compaction in riparian areas under diff erent land-uses in Iowa. Agric. Ecosyst. Environ. 127:22–30. doi:10.1016/j.agee.2008.02.008
Zaimes, G.N., R.C. Schultz, and T.M. Isenhart. 2008b. Streambank soil and phosphorus losses under diff erent riparian land-uses in Iowa. J. Am. Wa-ter Resour. Assoc. 44:935–947. doi:10.1111/j.1752-1688.2008.00210.x