A Soil-Aggregate Crushing-Energy Meter' - USDA soil... · The crushing was done on an Instron Model...
4
Reprinted from the Soil Science Society ofAmerica Journal Volume 47, no. 2, March-April 1983 677 South Segoe Rd.. Madison, WI 53711 USA A Soil-Aggregate Crushing-Energy Meter' D. W. BOYD, E. L. SKIDMORE, AND J. G. THOMPSON* ABSTRACT An improved technique for measuring the energy of crushing of soil aggregates was developed. Criteria for the improved system were: (i) energy must be measured quickly and accurately, (ii) a digital readout should be provided in convenient units, (iii) the system must perform tests both independently and in parallel with a previous method, (iv) the force on the sample at its initial fracture should be recorded, and (v) the system must be portable. The system developed consists mainly of two pnrfs. A small crushing vise was constructed that can be hand-driven or mounted in existing test equipment. A computer module measures the force on the sample and the displacement of the crushing mechanism using a load cell and a displacement transducer. The force times dis- placement product is numerically integrated to find the crushing energy. The entire system fits easily into a hard-shelled camera case (530 by 430 by 190 mm) and is powered from a single 110 V, 60 Hz electrical outlet. The design criteria were met, and measurements taken by the new system agreed well with previous methods having a coefficient of determination (9) of 0.999. Additional Index Words: aggregate stability, soil structure, rupture stress. Boyd, D.W., E.L. Skidmore, and J.G. Thompson. 1983. A soil-aggre- gate crushing-energy meter. Soil Sci. Soc. Am. J. 47:313-316. RY SOIL AGGREGATE stability is an important mea- sure in evaluating soil properties. It finds applica- tion in several areas including tillage and wind erosion research. However, current methods of evaluating dry soil aggregate stability are tedious and time consuming. One common method uses a sieving procedure (Chepil, 1953; Toogood, 1978). A sample of aggregates is sieved for a given length of time and the remains are weighed. The remains are then resieved for a given length of time and the remaics of that sieving are weighed. The dry soil aggregate stability is expressed as a function of the weights remaining after each sieving. Aggregate stability has been considered to be a func- tion of the energy required to alter a sample. Some (Mar- shall and Quirk, 1950; Grossman et al., 1959; Gill and McCreery, 1960; Farrell et al., 1967) have used a drop- shatter technique. In this method, the aggregate stability is expressed in terms of the height from which the sample must be dropped onto a hard surface to fracture the sam- ple. The energy of impact and thus the energy imparted to the sample is proportional to the height from which the sample was dropped. It has been further suggested that aggregate stability is more precisely defined as the energy required to expose new surface area in a sample. This was the subject of recent research (Skidmore and Powers, 1982) in which a sample was crushed and both the energy imparted to the sample and the surface area after crushing were mea- l Contribution from the Agricultural Research Service, USDA, in cooperation with the Kansas Agricultural Experiment Station. De- partment of Agronomy Contribution 82-386-5. Research Assistant, Agronomy Dep., and Graduate Student, Me- chanical Engineering; Soil Scientist, ARS-USDA; and Professor, Me- chanical Engineering Dep., respectively, Kansas State University, Man- hattan, KS 66506. Trade and company names are included for the benefit of the reader and do not imply endorsement or preferential treatment of the product. sured. The crushing was done on an Instron Model 1125 Universal Testing In~trument.~ The energy imparted to the sample was related to the area under force vs. dis- placement curve. The area was integrated by cutting out the portion of the chart under the curve and weighing it. The weight was compared to the weight of a known area of the same paper. Knowing the calibrations of the load cell and the displacement drive, the energy of crushing was calculated. The surface area was found by sieving the crushed sample into 13 size fractions. The average surface area for a particle in each size range was estimated and the total area was calculated as a weighted sum of the areas for all the fractions. This procedure is obviously tedious and time consum- ing. The purpose of this work was to expedite the mea- surement of dry soil aggregate stability by using a dif- ferent method of measuring the crushing energy. The criteria for the new measuring device were: (i) the device must measure the energy quickly and accurately, (ii) a digital readout in the proper units should be provided, (iii) the device should be able to perform tests both in- dependently and in conjunction with the Instron ma- chine, thus enhancing the output capabilities of that in- strument, (iv) the device should record the force on the sample at its initial fracture, and (v) the device should be portable. SYSTEM DESIGN The system consists of two main parts-a crushing vise and a computer module. The system is pictured in Fig. 1. The crush- ing vise was built of 6.35 mm (% in.) aluminum plate with steel supporting rods. The travel of the crushing plate is 25.4 mm and is accomplished with 18 revolutions of the drive shaft. The platform on which the sample rests is supported by an Interface' SSMIOO load cell. The load cell contains a strain gauge bridge in a sealed aluminum package. It delivers a d.c. voltage proportional to the force on it. The load cell has a force capacity of 445 N (100 Ib). The displacement of the crushing plate is measured by a Hewlett-Packard3 'ID-CDT1000 displacement transducer, a linear differential transformer that produces a d.c. voltage pro- portional to the displacement of its core. Since the crushing energy is the integral of the product of the force on the sample and the displacement of the crushing plate, these two instruments (load cell and displacement trans- ducer) provide the necessary information for the computer to calculate the crushing energy. The computer module contains a single board computer, some interfacing circuitry, and the power supply for all devices. The computer is a SYM-1 made by Synertek Systems Corp~ration,~ built around a 6502 microprocessor. It has on board a 28-key keypad and a 6-digit LED display that are accessible from user programs. The interfacing circuitry consists of a Burr-Brown3 SDM856 hybrid data acquisition system and a Burr-Brown 3606 digi- tally controlled programmable gain instrument amplifier. The data acquisition system is a single integrated circuit that con- tains an 8-channel differential input analog multiplexer, a sam- ple/hold amplifier, and a 12-bit successive approximation an- alog to digital converter. The programmable gain amplifier provides 11 possible gains ranging from 1 to 1,024. These are selected by lines from the computer. These devices allow han- dling of the relatively large (0 to 5 V) displacement signal and 313
Transcript of A Soil-Aggregate Crushing-Energy Meter' - USDA soil... · The crushing was done on an Instron Model...

Reprinted from the Soil Science Society ofAmerica Journal Volume 47, no. 2, March-April 1983
677 South Segoe Rd.. Madison, WI 53711 USA
A Soil-Aggregate Crushing-Energy Meter'
D. W. BOYD, E. L. SKIDMORE, AND J. G. THOMPSON*
ABSTRACT An improved technique for measuring the energy of crushing of soil
aggregates was developed. Criteria for the improved system were: (i) energy must be measured quickly and accurately, (ii) a digital readout should be provided in convenient units, (iii) the system must perform tests both independently and in parallel with a previous method, (iv) the force on the sample at its initial fracture should be recorded, and (v) the system must be portable. The system developed consists mainly of two pnrfs. A small crushing vise was constructed that can be hand-driven or mounted in existing test equipment. A computer module measures the force on the sample and the displacement of the crushing mechanism using a load cell and a displacement transducer. The force times dis- placement product is numerically integrated to find the crushing energy. The entire system fits easily into a hard-shelled camera case (530 by 430 by 190 mm) and is powered from a single 110 V, 60 Hz electrical outlet. The design criteria were met, and measurements taken by the new system agreed well with previous methods having a coefficient of determination (9) of 0.999.
Additional Index Words: aggregate stability, soil structure, rupture stress.
Boyd, D.W., E.L. Skidmore, and J.G. Thompson. 1983. A soil-aggre- gate crushing-energy meter. Soil Sci. Soc. Am. J. 47:313-316.
RY SOIL AGGREGATE stability is an important mea- sure in evaluating soil properties. It finds applica-
tion in several areas including tillage and wind erosion research. However, current methods of evaluating dry soil aggregate stability are tedious and time consuming.
One common method uses a sieving procedure (Chepil, 1953; Toogood, 1978). A sample of aggregates is sieved for a given length of time and the remains are weighed. The remains are then resieved for a given length of time and the remaics of that sieving are weighed. The dry soil aggregate stability is expressed as a function of the weights remaining after each sieving.
Aggregate stability has been considered to be a func- tion of the energy required to alter a sample. Some (Mar- shall and Quirk, 1950; Grossman et al., 1959; Gill and McCreery, 1960; Farrell et al., 1967) have used a drop- shatter technique. In this method, the aggregate stability is expressed in terms of the height from which the sample must be dropped onto a hard surface to fracture the sam- ple. The energy of impact and thus the energy imparted to the sample is proportional to the height from which the sample was dropped.
It has been further suggested that aggregate stability is more precisely defined as the energy required to expose new surface area in a sample. This was the subject of recent research (Skidmore and Powers, 1982) in which a sample was crushed and both the energy imparted to the sample and the surface area after crushing were mea-
l Contribution from the Agricultural Research Service, USDA, in cooperation with the Kansas Agricultural Experiment Station. De- partment of Agronomy Contribution 82-386-5.
Research Assistant, Agronomy Dep., and Graduate Student, Me- chanical Engineering; Soil Scientist, ARS-USDA; and Professor, Me- chanical Engineering Dep., respectively, Kansas State University, Man- hattan, KS 66506.
Trade and company names are included for the benefit of the reader and do not imply endorsement or preferential treatment of the product.
sured. The crushing was done on an Instron Model 1125 Universal Testing I n ~ t r u m e n t . ~ The energy imparted to the sample was related to the area under force vs. dis- placement curve. The area was integrated by cutting out the portion of the chart under the curve and weighing it. The weight was compared to the weight of a known area of the same paper. Knowing the calibrations of the load cell and the displacement drive, the energy of crushing was calculated.
The surface area was found by sieving the crushed sample into 13 size fractions. The average surface area for a particle in each size range was estimated and the total area was calculated as a weighted sum of the areas for all the fractions.
This procedure is obviously tedious and time consum- ing. The purpose of this work was to expedite the mea- surement of dry soil aggregate stability by using a dif- ferent method of measuring the crushing energy. The criteria for the new measuring device were: (i) the device must measure the energy quickly and accurately, (ii) a digital readout in the proper units should be provided, (iii) the device should be able to perform tests both in- dependently and in conjunction with the Instron ma- chine, thus enhancing the output capabilities of that in- strument, (iv) the device should record the force on the sample at its initial fracture, and (v) the device should be portable.
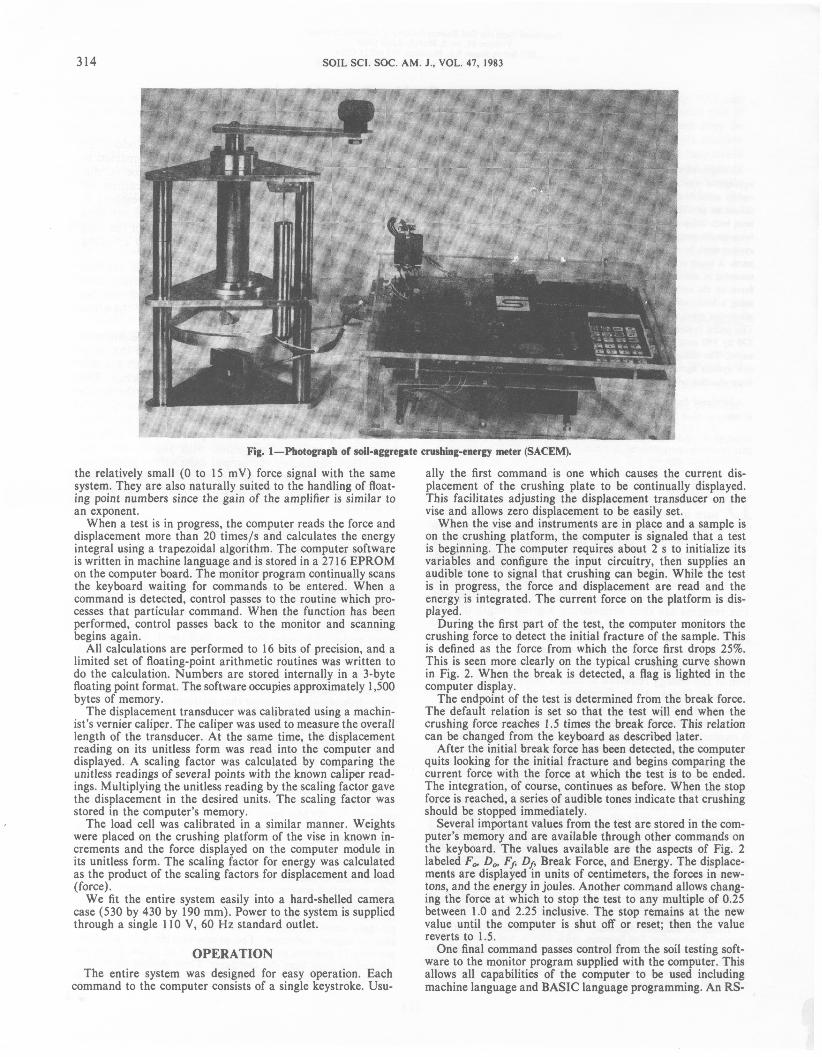
SYSTEM DESIGN The system consists of two main parts-a crushing vise and
a computer module. The system is pictured in Fig. 1. The crush- ing vise was built of 6.35 mm (% in.) aluminum plate with steel supporting rods. The travel of the crushing plate is 25.4 mm and is accomplished with 18 revolutions of the drive shaft.
The platform on which the sample rests is supported by an Interface' SSMIOO load cell. The load cell contains a strain gauge bridge in a sealed aluminum package. It delivers a d.c. voltage proportional to the force on it. The load cell has a force capacity of 445 N (100 Ib).
The displacement of the crushing plate is measured by a Hewlett-Packard3 'ID-CDT1000 displacement transducer, a linear differential transformer that produces a d.c. voltage pro- portional to the displacement of its core.
Since the crushing energy is the integral of the product of the force on the sample and the displacement of the crushing plate, these two instruments (load cell and displacement trans- ducer) provide the necessary information for the computer to calculate the crushing energy.
The computer module contains a single board computer, some interfacing circuitry, and the power supply for all devices. The computer is a SYM-1 made by Synertek Systems Corp~ration,~ built around a 6502 microprocessor. It has on board a 28-key keypad and a 6-digit LED display that are accessible from user programs.
The interfacing circuitry consists of a Burr-Brown3 SDM856 hybrid data acquisition system and a Burr-Brown 3606 digi- tally controlled programmable gain instrument amplifier. The data acquisition system is a single integrated circuit that con- tains an 8-channel differential input analog multiplexer, a sam- ple/hold amplifier, and a 12-bit successive approximation an- alog to digital converter. The programmable gain amplifier provides 1 1 possible gains ranging from 1 to 1,024. These are selected by lines from the computer. These devices allow han- dling of the relatively large (0 to 5 V) displacement signal and
313
314 SOIL SCI. SOC. AM. J.. VOL. 47, 1983
Fig. 1-Photograph of soil-aggregate crushing-energy meter (SACEM).
the relatively small (0 to 15 mV) force signal with the same system. They are also naturally suited to the handling of float- ing point numbers since the gain of the amplifier is similar to an exponent.
When a test is in progress, the computer reads the force and displacement more than 20 times/s and calculates the energy integral using a trapezoidal algorithm. The computer software is written in machine language and is stored in a 2716 EPROM on the computer board. The monitor program continually scans the keyboard waiting for commands to be entered. When a command is detected, control passes to the routine which pro- cesses that particular command. When the function has been performed, control passes back to the monitor and scanning begins again.
All calculations are performed to 16 bits of precision, and a limited set of floating-point arithmetic routines was written to do the calculation. Numbers are stored internally in a 3-byte floating point format. The software occupies approximately 1,500 bytes of memory.
The displacement transducer was calibrated using a machin- ist’s vernier caliper. The caliper was used to measure the overall length of the transducer. At the same time, the displacement reading on its unitless form was read into the computer and displayed. A scaling factor was calculated by comparing the unitless readings of several points with the known caliper read- ings. Multiplying the unitless reading by the scaling factor gave the displacement in the desired units. The scaling factor was stored in the computer’s memory.
The load cell was calibrated in a similar manner. Weights were placed on the crushing platform of the vise in known in- crements and the force displayed on the computer module in its unitless form. The scaling factor for energy was calculated as the product of the scaling factors for displacement and load (force).
We fit the entire system easily into a hard-shelled camera case (530 by 430 by 190 mm). Power to the system is supplied through a single 110 V, 60 Hz standard outlet.
OPERATION The entire system was designed for easy operation. Each
command to the computer consists of a single keystroke. Usu-
ally the first command is one which causes the current dis- placement of the crushing plate to be continually displayed. This facilitates adjusting the displacement transducer on the vise and allows zero displacement to be easily set.
When the vise and instruments are in place and a sample is on the crushing platform, the computer is signaled that a test is beginning. The computer requires about 2 s to initialize its variables and configure the input circuitry, then supplies an audible’tone to signal that crushing can begin. While the test is in progress, the force and displacement are read and the energy is integrated. The current force on the platform is dis- played.
During the first part of the test, the computer monitors the crushing force to detect the initial fracture of the sample. This is defined as the force from which the force first drops 25%. This is seen more clearly on the typical crushing curve shown in Fig. 2. When the break is detected, a flag is lighted in the computer display.
The endpoint of the test is determined from the break force. The default relation is set so that the test will end when the crushing force reaches 1.5 times the break force. This relation can be changed from the keyboard as described later.
After the initial break force has been detected, the computer quits looking for the initial fracture and begins comparing the current force with the force at which the test is to be ended. The integration, of course, continues as before. When the stop force is reached, a series of audible tones indicate that crushing should be stopped immediately.
Several important values from the test are stored in the com- puter’s memory and are available through other commands on the keyboard. The values available are the aspects of Fig. 2 labeled Fo, Do, Fp Df, Break Force, and Energy. The displace- ments are displayed in units of centimeters, the forces in new- tons, and the energy in joules. Another command allows chang- ing the force at which to stop the test to any multiple of 0.25 between 1.0 and 2.25 inclusive. The stop remains at the new value until the computer is shut off or reset; then the value reverts to 1.5.
One final command passes control from the soil testing soft- ware to the monitor program supplied with the computer. This allows all capabilities of the computer to be used including machine language and BASIC language programming. An RS-
BOYD ET AL.: A SOIL-AGGREGATE CRUSHING-ENERGY METER 315
- I
I i
Flrrt 25%
I 1 1
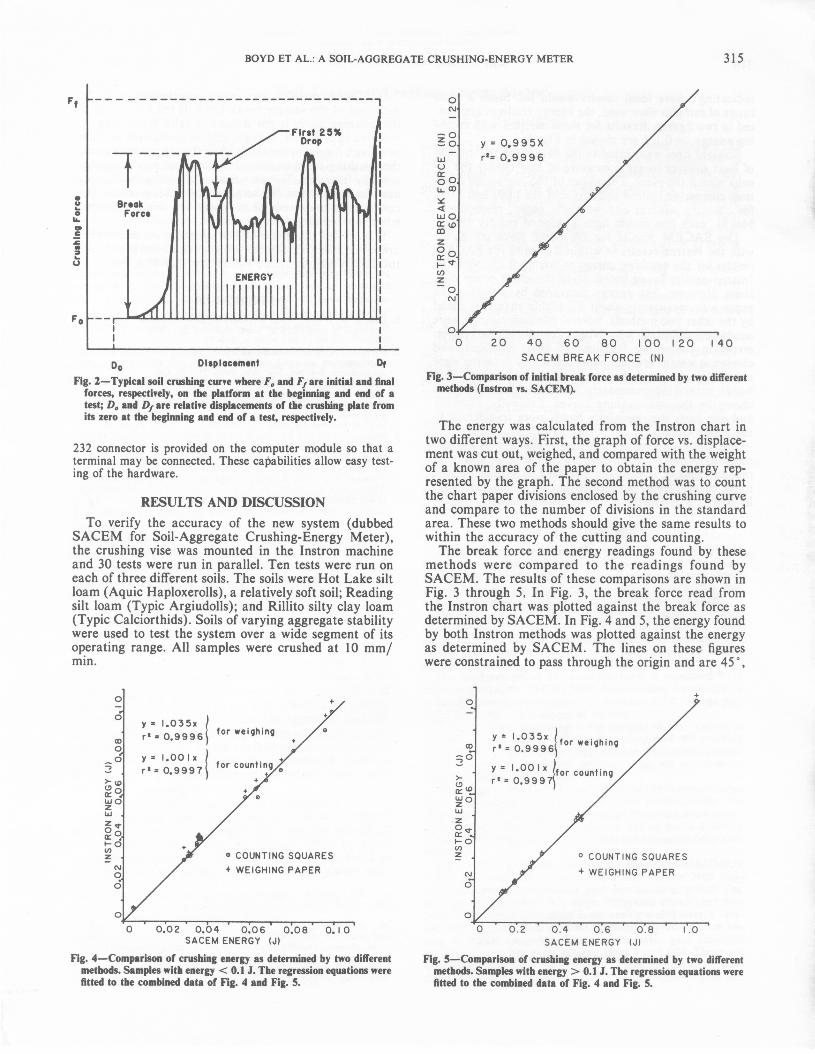
D O Dlrplacomont Df Fig. 2-Typical soil crushing curve where Fa and Ff are initial and final
forces, respectively, on the platform at the beginning and end of a test; 0, and Of are relative displacements of the crushing plate from its zero at the beginning and end of a test, respectively.
232 connector is provided on the computer module so that a terminal may be connected. These caoabilities allow easy test- ing of the hardware.
RESULTS AND DISCUSSION To verify the accuracy of the new system (dubbed
SACEM for Soil-Aggregate Crushing-Energy Meter), the crushing vise was mounted in the Instron machine and 30 tests were run in parallel. Ten tests were run on each of three different soils. The soils were Hot Lake silt loam (Aquic Haploxerolls), a relatively soft soil; Reading silt loam (Typic Argiudolls); and Rillito silty clay loam (Typic Calciorthids). Soils of varying aggregate stability were used to test the system over a wide segment of its operating range. All samples were crushed at 10 mm/ min.
0 20 40 60 i o 1'00 I 2 0 140 S A C E M B R E A K F O R C E (N)
Fig. 3-Comparison of initial break force as determined by two different methods (Instron vs. SACEM).
The energy was calculated from the Instron chart in two different ways. First, the graph of force vs. displace- ment was cut out, weighed, and compared with the weight of a known area of the paper to obtain the energy rep- resented by the graph. The second method was to count the chart paper divisions enclosed by the crushing curve and compare to the number of divisions in the standard area. These two methods should give the same results to within the accuracy of the cutting and counting.
The break force and energy readings found by these methods were compared to the readings found by SACEM. The results of these comparisons are shown in Fig. 3 through 5 . In Fig. 3, the break force read from the Instron chart was plotted against the break force as determined by SACEM. In Fig. 4 and 5 , the energy found by both Instron methods was plotted against the energy as determined by SACEM. The lines on these figures were constrained to pass through the origin and are 45 O ,
+ /
Y ' r * =
COUNTING SQUARES + WEIGHING PAPER /
1
0 0.02 0.04 0.06 0.00 0.1 0 SACEM ENERGY (J l
Fig. 4-Comparison of crushing energy as determined by two different methods. Samples with energy < 0.1 J. The regression equations were fitted to the combined data of Fig. 4 and Fig. 5.
O COUNTING SQUARES + WEIGHING PAPER
SACEM ENERGY (Jl
Fig. 5-Comparison of crushing energy as determined by two different methods. Samples with energy > 0.1 J. The regression equations were fitted to the combined data of Fig. 4 and Fig. 5.

316 SOIL SCI. SOC. AM. J . , VOL. 47, 1963
indicating where ideal results would lie. Since a wide range of samples were used, the energy readings are plot- ted in two figures. Results for those samples with crush- ing energy > 0.1 J are shown in Fig. 4.
Straight lines were fitted to the data using the method of least squares to get a measure of how closely the re- sults match the ideal. The slopes of the regression equa- tions comparing Instron and SACEM are l .001 and l .034 for counting squares and weighing paper, respectively. Ideally, each line should have a slope of exactly unity.
The SACEM results for the break force correlated with the Instron results to within 0.6% and the SACEM results for the crushing energy to within 0.2%, with the Instron results found by counting the chart paper divi- sions. However, the energy measured by weighing the paper was consistently about 3% higher than that found by the other two methods. Several miniexperiments were conducted to find out why. Nonuniformity of chart paper, errors in estimating fractions of chart divisions, and change in weight of chart paper caused by handling were tested. It was found that handling the paper with bare hands caused approximately the same discrepancy as shown by the soil crushing curves. Evidently, moisture and oils from the operator’s hands were transferred to the paper sample.
The time required to make an evaluation by the old methods is much longer than by SACEM. A highly ir- regular chart of typical size can take as long as 15 min to be cut out by a careful operator. The reading made by SACEM is available almost instantaneously.
One minor problem can occur occasionally with the definition of the sample break force. If the initial rise of the crushing curve is not smooth, a false break may be detected by SACEM. A slight shift in the sample position or a small fragment breaking off of the sample may cause the crushing force to drop 25% long before the sample actually fractures. This occurred once during the 30 tests used for comparison. To help minimize this problem, the computer is programmed to ignore any break detected when the crushing force is < 2 N .
It is obvious that the SACEM system gives results that are in excellent agreement with previous work and that the design criteria stated earlier are very well met.
REFERENCES I . Chepil, W.S. 1953. Field structure of cultivated soils with special
reference to erodibility by wind. Soil Sci. Soc. Am. Proc. 17:185- 190.
2. Farrell. D.A., E.L. Greacen, and W.E. Larson. 1967. The effect of water content on axial strain in a loam soil under tension and compression. Soil Sci. SOC. Am. Proc. 31:445-450.
3. Gill, W.R., and W.F. McCreery. 1960. Relation of size of cut to tillage tool efficiency. Agric. Eng. 41:372-374, 381.
4. Grossman. R.B., J.B. Fehrenbacher, and A.H. Beavers. 1959. Fra- gipan soils of Illinois: I. General characterization and field relation- ships of Hosmer silt loam. Soil Sci. Soc. Am. Proc. 23:65-70.
5 . Marshall, T.J., and J.P. Quirk. 1950. Stability of structural aggre- gates of dry soil. Aust. J. Agric. Res. 1:266-275.
6. Skidmore, E.L., and D.H. Powers. 1982. Dry soil-aggregate stabil- ity: energy-based index. Soil Sci. Soc. Am. J. 46:1274-1279.
7. Toogood, J.A. 1978. Relation of aggregate stability to property of Alberta soils. p. 21 1-215. In W.W. Emerson et al. (ed.) Modification of soil structure. John Wiley & Sons, New York.