A Social Profile - Home - Blacktown City · Culturally and linguistically diverse communities – A...
31
Culturally and linguistically diverse people Blacktown City Social Profile 2016 A Social Profile
Transcript of A Social Profile - Home - Blacktown City · Culturally and linguistically diverse communities – A...

Culturally and linguistically diverse people
Blacktown City Social Profile 2016
A Social Profile

Culturally and linguistically diverse communities – A social profile 1
For further information regarding issues identified in this profile or if you are seeking information on issues not included please contact the Social Planning Team on 02 9839 6420.

Contents
Executive summary ................................................................................................................................ 1
1. Introduction ................................................................................................................................... 4
1.1 How did we develop the social profile? ................................................................................. 4
2. What does the data say? ................................................................................................................ 7
2.1 Culturally and linguistically diverse communities population and age structure ................... 7
2.2 Emerging “Country of Birth” groups ...................................................................................... 8
2.3 Language spoken at home ................................................................................................... 10
2.4 Proficiency in English ............................................................................................................ 13
2.5 Migration Streams ................................................................................................................ 14
2.6 Where do culturally and linguistically diverse people live? ................................................. 15
2.7 Overweight, obesity and diabetes ........................................................................................ 17
2.8 Social exclusion .................................................................................................................... 17
2.9 Social capital for culturally diverse people ........................................................................... 17
2.10 Volunteering rates ................................................................................................................ 21
3. What do the community and service providers say? ................................................................... 22
3.1 Social gradient ...................................................................................................................... 22
3.2 Stress .................................................................................................................................... 22
3.3 Early life ................................................................................................................................ 23
3.4 Social exclusion .................................................................................................................... 23
3.5 Work ..................................................................................................................................... 24
3.6 Unemployment .................................................................................................................... 24
3.7 Social support ....................................................................................................................... 24
3.8 Addiction .............................................................................................................................. 25
3.9 Food ..................................................................................................................................... 25
3.10 Transport .............................................................................................................................. 25
3.11 Service development ............................................................................................................ 25

Culturally and linguistically diverse communities – A social profile 1
Tables and figures
Figure 1: Survey participants from culturally and linguistically diverse backgrounds ........................ 5 Table 1: Statistical local areas and precincts in Blacktown City ........................................................ 7 Table 2: Country of birth for Blacktown City ranked by size .............................................................. 8 Table 3: Languages spoken at home – ranked by size ................................................................... 12 Table 4: Proficiency in English ......................................................................................................... 14 Figure 2: People born overseas 2011 .............................................................................................. 15 Table 5: People born overseas, 2011 .............................................................................................. 16 Figure 3: Belonging .......................................................................................................................... 18 Figure 4: Speaking with neighbours ................................................................................................ 19 Figure 5: Satisfied with their local neighbourhood ........................................................................... 19 Figure 6: Could you rely on neighbours? ......................................................................................... 20 Figure 7: Perceptions of safety ........................................................................................................ 20

Culturally and linguistically diverse communities – A social profile 1
Executive summary
This profile outlines the major social issues currently facing culturally and linguistically diverse people in Blacktown City. It explores the key issues for eleven priority areas being the social gradient, stress, early life, social exclusion, work, unemployment, social support, addiction, food, transportation and service development. It also provides a snapshot of community strengths and needs for culturally and linguistically diverse communities.
The profile is a resource to support planning and research. It is a tool for strategic planning, reviewing strategic plans and should be used along-side consideration of the policies and activities of organisations, Local, State and Federal governments.
The executive summary provides an overview of findings from research and community engagement. It identifies the following key issues and strengths for culturally and linguistically diverse people:
Issues
• Blacktown City has a large and growing population of people born overseas.
§ Proportions vary from a low of 13.6% in Riverstone - Vineyard to a high of 58.5% inWoodcroft.
• Overall, 58.8% of the population spoke English only, and 36.9% spoke a non-Englishlanguage, compared with 62.2% and 32.5% respectively for Greater Sydney.
• The number of people ‘who spoke English not well or not at all’ increased from 11,889 in2006 to 14,166 in 2011.
• Cost of living, including housing, utilities and food.
• Housing for large migrant families.
• Social isolation and dislocation in families who have lost contact with traditional cultures.
• Language barriers across all age groups. Low levels of English literacy exclude new arrivalsfrom participating in society.
• Participants report being victims of discrimination and racism and being publicly abused dueto their ethnicity including harassment and discrimination in some workplaces.
• Children face educational disadvantage.
• Litter and untidiness in our streets and a lack of maintenance of our parks, equipment, roads,footpaths, trees and waterways.
Culturally and linguistically diverse communities – A social profile 2
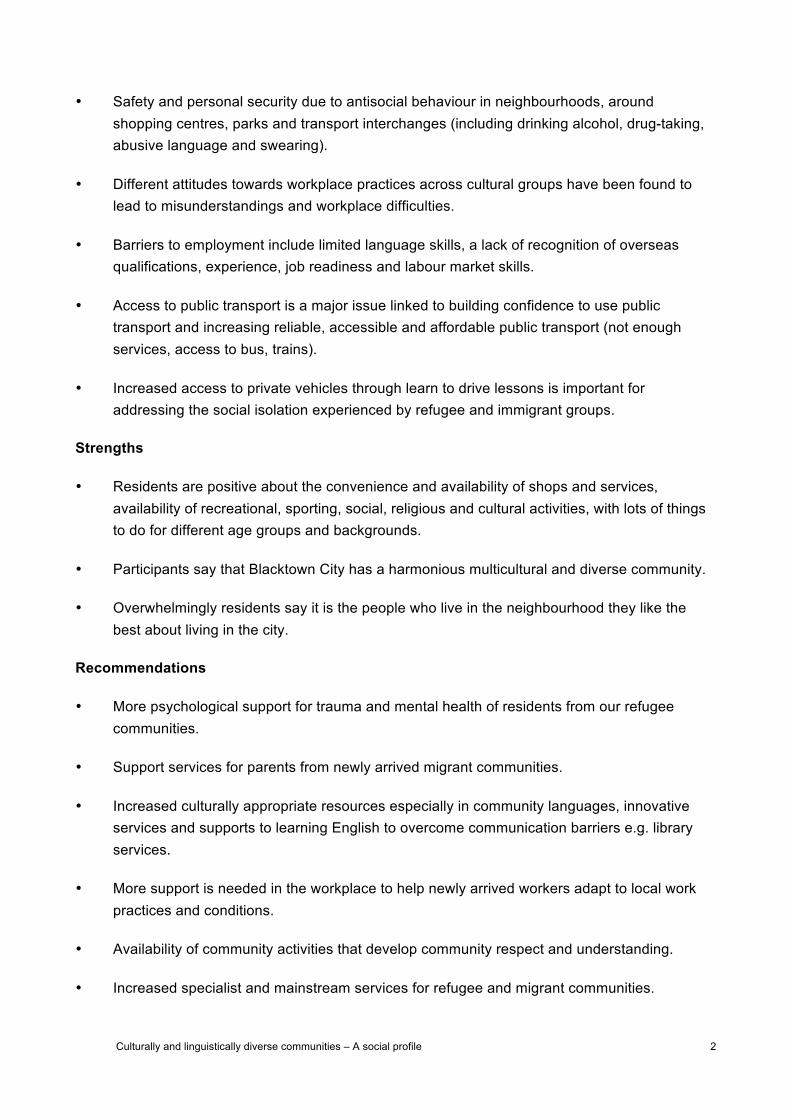
• Safety and personal security due to antisocial behaviour in neighbourhoods, aroundshopping centres, parks and transport interchanges (including drinking alcohol, drug-taking,abusive language and swearing).
• Different attitudes towards workplace practices across cultural groups have been found tolead to misunderstandings and workplace difficulties.
• Barriers to employment include limited language skills, a lack of recognition of overseasqualifications, experience, job readiness and labour market skills.
• Access to public transport is a major issue linked to building confidence to use publictransport and increasing reliable, accessible and affordable public transport (not enoughservices, access to bus, trains).
• Increased access to private vehicles through learn to drive lessons is important foraddressing the social isolation experienced by refugee and immigrant groups.
Strengths
• Residents are positive about the convenience and availability of shops and services,availability of recreational, sporting, social, religious and cultural activities, with lots of thingsto do for different age groups and backgrounds.
• Participants say that Blacktown City has a harmonious multicultural and diverse community.
• Overwhelmingly residents say it is the people who live in the neighbourhood they like thebest about living in the city.
Recommendations
• More psychological support for trauma and mental health of residents from our refugeecommunities.
• Support services for parents from newly arrived migrant communities.
• Increased culturally appropriate resources especially in community languages, innovativeservices and supports to learning English to overcome communication barriers e.g. libraryservices.
• More support is needed in the workplace to help newly arrived workers adapt to local workpractices and conditions.
• Availability of community activities that develop community respect and understanding.
• Increased specialist and mainstream services for refugee and migrant communities.
Culturally and linguistically diverse communities – A social profile 3
• More health care workers, doctors and nurses who speak community languages.
Culturally and linguistically diverse communities – A social profile 4
1. Introduction
Social and community planning helps us focus on the needs and aspirations of local communities through a whole of community approach. It provides an evidence base that guides our activities over the short-term and long-term.
This profile, focused on culturally and linguistically diverse people, presents research from the Blacktown City Social Profile 2016 and provides a more detailed understanding of the social situation for culturally and linguistically diverse people in Blacktown City.
The principles of equity, access and social justice underpin this profile. It is strength based, recognising community strengths and resources which can be used to build strong, healthy and sustainable communities. The profile is a resource to support planning and research. It is a tool for strategic planning, reviewing strategic plans and should be used along-side consideration of the policies and activities of organisations, Local, State and Federal governments.
While we have a lead role in addressing many of the issues identified, we recognise not all issues raised in community engagement are solely the responsibility of local government and require strategic linkages and collaborative partnerships with the community sector and other stakeholders. This document will guide us in focussing resources on key issues and actions in response to community need and mindful of the directions of other stakeholders.
This social profile on culturally and linguistically diverse communities includes the following sections:
• What does the data say? The key social indicators for culturally and linguistically diversecommunities.
• What do the community and service providers say? A summary of the priority issuesculturally and linguistically diverse communities identified in our community engagement.
1.1 How did we develop the social profile?
The Blacktown City Social Profile 2016 is a key reference document for developing our community strategic plan. It was developed through community engagement and research. We engaged with over 2,155 people who participated in social profile surveys, focus groups, stakeholder forums and service interviews.
The target groups consulted are in line with the Department of Local Government’s mandatory target groups and included Aboriginal and Torres Strait Islander People, children, men, older people, people with disability, people from culturally and linguistically diverse background, women and young people.
In comparison to Blacktown City (37.6%), there was a higher percentage representation of people born overseas (55%) who participated in the survey.

Culturally and linguistically diverse communities – A social profile 5
Figure 1: Survey participants from culturally and linguistically diverse backgrounds
The survey was provided on-line, used in face to face interviews at key city wide events and distributed through key points that included Blacktown City administration, libraries, community organisations, social groups and clubs and face to face interviewing at key festivals and events. Multicultural groups and agencies helped distribute translated surveys in 12 languages.
A detailed summary of findings is contained in the Community Engagement Report - Blacktown City Social Profile 2016.
We researched key social indicators for the city and were informed, in part, by research from Westir Ltd. A detailed summary of results are contained in the Social Indicator Report - Blacktown City Social Profile 2016.
The Blacktown City Social Profile 2016 can be found at: http://www.blacktown.nsw.gov.au/Discover_Blacktown/Statistics/Blacktown_City_Social_Profile_2016
Additional resources in this series include:
• The Blacktown City Social Profile 2016
• Blacktown City Social Profile 2016 Community Engagement Report
• Blacktown City Social Profile 2016 Social Indicator Report
• A social profile - Blacktown Precinct
• A social profile - Mount Druitt Precinct
• A social profile - North West Precinct
• A social profile - Aboriginal and Torres Strait Islander communities
• A social profile - Children
45%
55%
Australia
Overseas

Culturally and linguistically diverse communities – A social profile 6
• A social profile - Older people
• A social profile - People with disability
• A social profile - Women
• A social profile - Young people.

Culturally and linguistically diverse communities – A social profile 7
2. What does the data say?This section includes Australian Bureau of Statistics, Census of Population and Housing, 2006 and 2011 data. This data and analysis was compiled and presented by .id, (profile.id.com.au, forecast.id.com.au and atlas.id.com.au). Findings for Blacktown City have been benchmarked with Greater Sydney and/or New South Wales where this data has been available.
The report identifies Australian Bureau of Statistics Census data using Statistical level areas and precincts. Statistical level areas mostly align with the precincts identified in Table .1
Table 1: Statistical local areas and precincts in Blacktown City
Blacktown South West Blacktown South West Blacktown North Mount Druitt Precinct Blacktown Precinct North-West Precinct
Bidwill, Blackett, Dean Park, Dharruk, Emerton, Glendenning, Hassall Grove, Hebersham, Lethbridge Park, Minchinbury, Mount Druitt, Oakhurst, Plumpton, Rooty Hill, Ropes Crossing, parts of St Marys, Shalvey, Tregear, Whalan and Willmot.
Arndell Park, Blacktown, Bungarribee, Doonside, Eastern Creek ,Huntingwood, Kings Langley, Kings Park, Lalor Park, Marayong, Prospect, Seven Hills, Toongabbie and Woodcroft .
Acacia Gardens, Colebee, Glenwood, Kellyville Ridge, Marsden Park, Parklea, Quakers Hill, Riverstone, Rouse Hill, Schofields, Shanes Park, Stanhope Gardens, The Ponds and Vineyard.
In 2016, Blacktown City was the 2nd largest and the fastest growing local government area in New South Wales. There was an estimated 350,000 residents and we have a projected population of 520,000 by 2036. The city is growing rapidly through urban development in the North West Growth Centre and established centres such as Blacktown, Mt Druitt, Rooty Hill and Seven Hills.
2.1 Culturally and linguistically diverse communities population and age structure
ABS Census data for 2011 shows that 113,213 people who were living in Blacktown City, were born overseas with 19% having arrived in Australia within the last 5 years.
• The analysis of Country of Birth data for the population of Blacktown City in 2011 comparedto Greater Sydney, shows there was a larger proportion of people born overseas, as well asa larger proportion of people from a non-English speaking background.
• Overall, 37.6% of the population was born overseas, and 31.5% were from a non-Englishspeaking background, compared with 34.2% and 26.3% respectively for Greater Sydney.
• The largest non-English speaking country of birth of residents of Blacktown City was thePhilippines, where 6.4% of the population, or 19,360 people, were born.

Culturally and linguistically diverse communities – A social profile 8
• The major differences between the countries of birth of the population in Blacktown City andGreater Sydney were:
§ a larger percentage of people born in Philippines (6.4% compared to 1.4%)
§ a larger percentage of people born in India (5.0% compared to 2.0%)
§ a larger percentage of people born in Fiji (2.2% compared to 0.7%)
§ a smaller percentage of people born in China (1.0% compared to 3.4%).
2.2 Emerging “Country of Birth” groups
Between 2006 and 2011, the number of people born overseas increased by 20,161 (21.7%), and the number of people from a non-English speaking background increased by 19,083 (25.2%). The largest changes in birthplace countries of the population in this area between 2006 and 2011 were for those born in India (+7,787 persons), the Philippines (+3,232 persons), Fiji (+1,096 persons) and Sri Lanka (+987 persons).
Table 2: Country of birth for Blacktown City ranked by size
Blacktown City 2011 2006 Change
Country of birth Number % Greater Sydney
Number % Greater Sydney
2006 to 2011
Philippines 19,360 6.4 1.4 16,128 5.9 1.3 +3,232 India 15,050 5.0 2.0 7,263 2.7 1.3 +7,787 New Zealand 7,417 2.5 1.9 6,648 2.4 2.0 +769
United Kingdom 7,394 2.5 4.1 7,818 2.9 4.3 -424
Fiji 6,486 2.2 0.7 5,390 2.0 0.7 +1,096 Sri Lanka 3,450 1.1 0.5 2,463 0.9 0.4 +987 China 3,067 1.0 3.4 2,455 0.9 2.6 +612 Malta 2,616 0.9 0.3 2,850 1.0 0.4 -234 Pakistan 2,581 0.9 0.3 1,605 0.6 0.2 +976
Sudan 2,166 0.7 0.1 1,970 0.7 0.1 +196 Samoa 1,803 0.6 0.2 1,548 0.6 0.2 +255 Lebanon 1,781 0.6 1.3 1,789 0.7 1.3 -8 South Africa 1,759 0.6 0.8 1,334 0.5 0.7 +425 Egypt 1,750 0.6 0.4 1,601 0.6 0.4 +149 Afghanistan 1,720 0.6 0.2 1,212 0.4 0.2 +508 Bangladesh 1,526 0.5 0.4 893 0.3 0.3 +633 Italy 1,493 0.5 1.0 1,620 0.6 1.1 -127 Indonesia 1,359 0.5 0.6 1,030 0.4 0.5 +329 Iraq 1,346 0.4 0.7 945 0.3 0.5 +401

Culturally and linguistically diverse communities – A social profile 9
Table continued
Blacktown City 2011 2006 Change
Country of birth Number % Greater Sydney
Number % Greater Sydney
2006 to 2011
Turkey 1,334 0.4 0.3 1,220 0.4 0.3 +114 Malaysia 1,215 0.4 0.6 999 0.4 0.5 +216 South Korea 1,182 0.4 0.9 1,179 0.4 0.8 +3 Poland 1,113 0.4 0.3 1,184 0.4 0.3 -71 Croatia 1,102 0.4 0.3 1,189 0.4 0.4 -87 Iran 1,100 0.4 0.3 805 0.3 0.3 +295 Germany 1,085 0.4 0.4 1,169 0.4 0.5 -84 Serbia / Montenegro (fmr Yugoslavia)
954 0.3 0.3 1,194 0.4 0.4 -240
Vietnam 920 0.3 1.6 921 0.3 1.5 -1 Tonga 903 0.3 0.1 802 0.3 0.1 +101 Hong Kong 800 0.3 0.8 746 0.3 0.9 +54 Greece 766 0.3 0.7 860 0.3 0.8 -94 United States of America
700 0.2 0.5 536 0.2 0.4 +164
Chile 696 0.2 0.3 716 0.3 0.3 -20 Burma (Myanmar) 682 0.2 0.1 547 0.2 0.1 +135 Mauritius 668 0.2 0.1 638 0.2 0.1 +30 Bosnia and Herzegovina
645 0.2 0.2 649 0.2 0.2 -4
Netherlands 624 0.2 0.2 702 0.3 0.3 -78 Ireland 606 0.2 0.4 520 0.2 0.3 +86 Thailand 482 0.2 0.3 312 0.1 0.3 +170 Nepal 477 0.2 0.3 135 0.0 0.1 +342 Singapore 439 0.1 0.2 373 0.1 0.2 +66 Cook Islands 421 0.1 0.0 387 0.1 0.0 +34 Cyprus 373 0.1 0.1 395 0.1 0.1 -22 Hungary 363 0.1 0.1 398 0.1 0.2 -35 Peru 350 0.1 0.1 308 0.1 0.1 +42 Ghana 313 0.1 0.0 201 0.1 0.0 +112 Uruguay 301 0.1 0.1 311 0.1 0.2 -10 Germany 1,085 0.4 0.4 1,169 0.4 0.5 -84 Serbia / Montenegro (fmr Yugoslavia)
954 0.3 0.3 1,194 0.4 0.4 -240

Culturally and linguistically diverse communities – A social profile 10
Table continued Blacktown City 2011 2006 Change
Country of birth Number % Greater Sydney
Number % Greater Sydney
2006 to 2011
Vietnam 920 0.3 1.6 921 0.3 1.5 -1 Tonga 903 0.3 0.1 802 0.3 0.1 +101 Hong Kong 800 0.3 0.8 746 0.3 0.9 +54 Greece 766 0.3 0.7 860 0.3 0.8 -94 United States of America
700 0.2 0.5 536 0.2 0.4 +164
Chile 696 0.2 0.3 716 0.3 0.3 -20 Burma (Myanmar) 682 0.2 0.1 547 0.2 0.1 +135 Mauritius 668 0.2 0.1 638 0.2 0.1 +30 Bosnia and Herzegovina
645 0.2 0.2 649 0.2 0.2 -4
Netherlands 624 0.2 0.2 702 0.3 0.3 -78 Ireland 606 0.2 0.4 520 0.2 0.3 +86 Thailand 482 0.2 0.3 312 0.1 0.3 +170 Nepal 477 0.2 0.3 135 0.0 0.1 +342 Singapore 439 0.1 0.2 373 0.1 0.2 +66
Cook Islands 421 0.1 0.0 387 0.1 0.0 +34 Cyprus 373 0.1 0.1 395 0.1 0.1 -22 Hungary 363 0.1 0.1 398 0.1 0.2 -35 Peru 350 0.1 0.1 308 0.1 0.1 +42 Ghana 313 0.1 0.0 201 0.1 0.0 +112 Uruguay 301 0.1 0.1 311 0.1 0.2 -10 Source: Australian Bureau of Statistics, Census of Population and Housing 2006 and 2011. Compiled and presented in
profile.id by .id, the population experts. Excludes countries with fewer than 20 people, or less than 0.1% of the total
population. (Usual residence data)
2.3 Language spoken at home
ABS Census data for 2011 shows that 111,170 people who were living in Blacktown City, spoke a language other than English.
Compared to Greater Sydney an analysis of the main Languages Spoken at Home by residents of Blacktown City in 2011 shows that there was a smaller proportion of people who spoke English only, and a larger proportion of those speaking a non-English language (either exclusively, or in addition to English).
Overall, 58.8% of the population spoke English only, and 36.9% spoke a non-English language, compared with 62.2% and 32.5% respectively for Greater Sydney. The major Language Other than English Spoken at Home by residents of Blacktown City was Filipino/Tagalog, with 6.1% of the population, or 18,322 people speaking this language at home.

Culturally and linguistically diverse communities – A social profile 11
In 2001, the major differences between the population of Blacktown City and Greater Sydney in relation to the Language Spoken at Home were:
• a larger percentage speaking Filipino/Tagalog at home (6.1% compared to 1.2%)
• a larger percentage speaking Hindi at home (3.6% compared to 1.2%)
• a larger percentage speaking Punjabi at home (2.3% compared to 0.4%)
• a smaller percentage speaking Mandarin at home (0.9% compared to 3.0%)
• emerging groups.
Between 2006 and 2011, the number of people who spoke a Language Other than English at Home increased by 23,129 or 26.3%, and the number of people who spoke English only increased by 8,254 or 4.9%.
The largest changes in the spoken languages of the population in Blacktown City between 2006 and 2011 were for those speaking:
• Punjabi (+4,058 persons)
• Hindi (+3,585 persons)
• Filipino/Tagalog (+2,871 persons)
• Urdu (+1,451 persons).
Culturally and linguistically diverse communities – A social profile 12
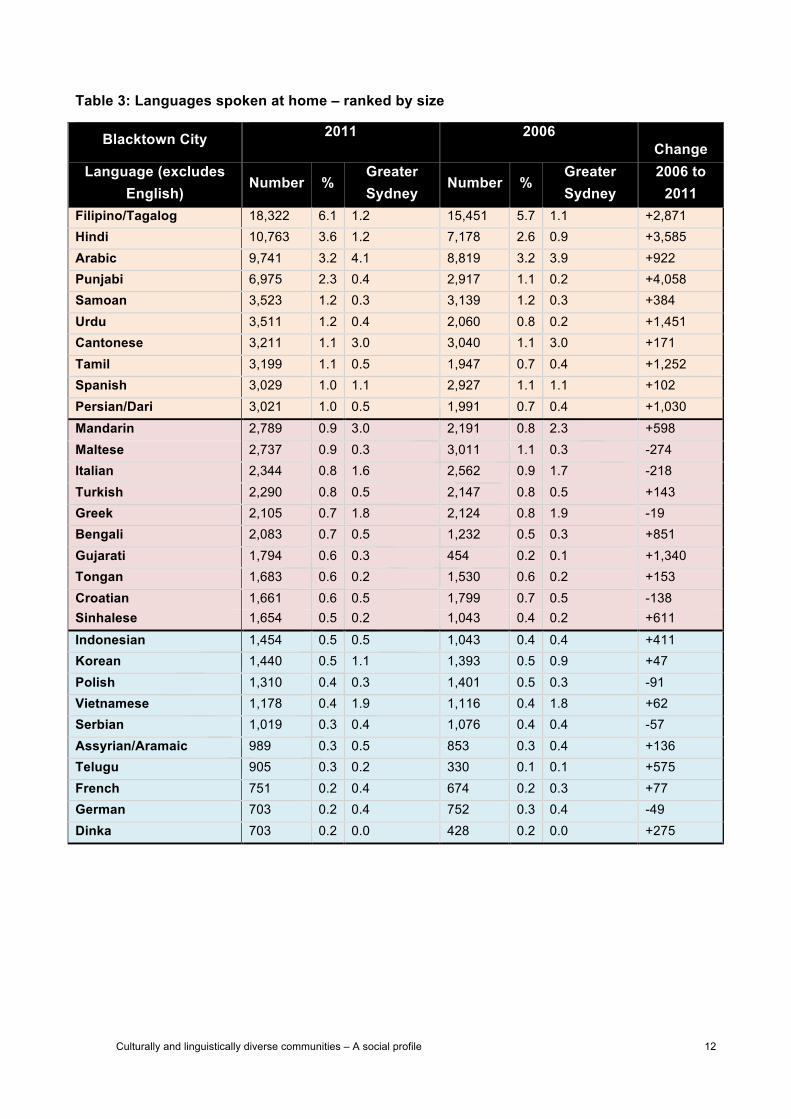
Table 3: Languages spoken at home – ranked by size
Blacktown City 2011 2006 Change
Language (excludes English)
Number % Greater Sydney
Number % Greater Sydney
2006 to 2011
Filipino/Tagalog 18,322 6.1 1.2 15,451 5.7 1.1 +2,871 Hindi 10,763 3.6 1.2 7,178 2.6 0.9 +3,585 Arabic 9,741 3.2 4.1 8,819 3.2 3.9 +922 Punjabi 6,975 2.3 0.4 2,917 1.1 0.2 +4,058 Samoan 3,523 1.2 0.3 3,139 1.2 0.3 +384 Urdu 3,511 1.2 0.4 2,060 0.8 0.2 +1,451 Cantonese 3,211 1.1 3.0 3,040 1.1 3.0 +171 Tamil 3,199 1.1 0.5 1,947 0.7 0.4 +1,252 Spanish 3,029 1.0 1.1 2,927 1.1 1.1 +102 Persian/Dari 3,021 1.0 0.5 1,991 0.7 0.4 +1,030 Mandarin 2,789 0.9 3.0 2,191 0.8 2.3 +598 Maltese 2,737 0.9 0.3 3,011 1.1 0.3 -274 Italian 2,344 0.8 1.6 2,562 0.9 1.7 -218 Turkish 2,290 0.8 0.5 2,147 0.8 0.5 +143 Greek 2,105 0.7 1.8 2,124 0.8 1.9 -19 Bengali 2,083 0.7 0.5 1,232 0.5 0.3 +851 Gujarati 1,794 0.6 0.3 454 0.2 0.1 +1,340 Tongan 1,683 0.6 0.2 1,530 0.6 0.2 +153 Croatian 1,661 0.6 0.5 1,799 0.7 0.5 -138 Sinhalese 1,654 0.5 0.2 1,043 0.4 0.2 +611
Indonesian 1,454 0.5 0.5 1,043 0.4 0.4 +411 Korean 1,440 0.5 1.1 1,393 0.5 0.9 +47 Polish 1,310 0.4 0.3 1,401 0.5 0.3 -91 Vietnamese 1,178 0.4 1.9 1,116 0.4 1.8 +62 Serbian 1,019 0.3 0.4 1,076 0.4 0.4 -57 Assyrian/Aramaic 989 0.3 0.5 853 0.3 0.4 +136 Telugu 905 0.3 0.2 330 0.1 0.1 +575 French 751 0.2 0.4 674 0.2 0.3 +77 German 703 0.2 0.4 752 0.3 0.4 -49 Dinka 703 0.2 0.0 428 0.2 0.0 +275

Culturally and linguistically diverse communities – A social profile 13
Table continued Blacktown City 2011 2006
Change Language
(excludes English) Number %
Greater Sydney
Number % Greater Sydney
2006 to 2011
Nepali 692 0.2 0.4 137 0.1 0.1 +555 Burmese 687 0.2 0.1 541 0.2 0.1 +146 Malayalam 649 0.2 0.1 193 0.1 0.1 +456 Non-verbal so described
600 0.2 0.1 550 0.2 0.2 +50
Hungarian 600 0.2 0.1 657 0.2 0.2 -57 Russian 554 0.2 0.4 472 0.2 0.3 +82 Marathi 496 0.2 0.1 211 0.1 0.1 +285 Portuguese 441 0.1 0.3 404 0.1 0.3 +37 Kurdish 435 0.1 0.0 279 0.1 0.0 +156 Thai
428 0.1 0.3 259 0.1 0.2 +169
Armenian 360 0.1 0.2 310 0.1 0.2 +50 Maori (Cook Island) 354 0.1 0.0 310 0.1 0.0 +44 Pashto 339 0.1 0.0 164 0.1 0.0 +175 Fijian 321 0.1 0.1 339 0.1 0.1 -18 Bosnian 317 0.1 0.1 314 0.1 0.1 +3 Macedonian 302 0.1 0.4 281 0.1 0.5 +21 Source: Australian Bureau of Statistics, Census of Population and Housing 2006 and 2011. Compiled and presented in
profile.id by .id, the population experts. Excludes countries with fewer than 20 people, or less than 0.1% of the total
population. (Usual residence data)
2.4 Proficiency in English
English language proficiency is fundamental to the successful settlement of migrants and refugees in Australia. English language proficiency enhances the ability of newly arrived migrants to participate in the mainstream society and reduces the risk of social exclusion experienced as a result of language and communication barriers.
In Blacktown City the number of people ‘who spoke another language’ and ‘spoke English very well or well’ increased from 76,162 (28%) in 2006 to 96,859 (32.2%) in 2011. However, the number of people ‘who spoke English not well or not at all’ also increased from 11,872 (4.4%) in 2006 to 14,167 (4.7%).

Culturally and linguistically diverse communities – A social profile 14
Table 4: Proficiency in English
Blacktown City 2011 2006 Change
English proficiency Number % Greater Sydney
Number % Greater Sydney
2006 to 2011
Speaks English only 177,075 58.8 62.2 168,819 62.1 64.0 +8,256 Speaks another language, and
English well or very well 96,859 32.2 26.7 76,162 28.0 23.7 +20,697
Speaks another language, and English not well or not at all
14,167 4.7 5.8 11,872 4.4 5.5 +2,295
Not stated 12,995 4.3 5.4 14,855 5.5 6.8 -1,860
Total population 301,096 100.0
100.0 271,708 100.0 100.0 +29,388
Source: Australian Bureau of Statistics, Census of Population and Housing 2006 and 2011. Compiled and presented in profile.id by .id, the population experts. (Usual residence data)
2.5 Migration Streams
While Blacktown City consistently settles a large number of new migrants, due to changes in Federal settlement policies, the total number of new settlers has reduced steadily from over 3,500 to just over 2000 each year in the period from 2006 and 2014. Blacktown City Social Profile 2016)
This trend is evident across all migration streams with the largest reduction occurring in the ‘skilled’ migration stream (from 2005 to 200 approximately) followed by the ‘family reunion’ stream (from 1,200 to 780 approximately). The number of settlers in the humanitarian stream has fluctuated from around 500 to 350 each year.
• The number of skilled migrants has decreased from a high of 53.8% in 2006 down to 10.0%in 2014.
• At the same time the number of family reunion immigrants increased from 32.3% to a peakof 42.0 % in 2011, dropping back to 37.0% in 2014.
• Humanitarian arrivals fluctuated from 13.8% in 2006 to a high of 22.7% in 2011, droppingback to 16.1% in 2014. This settlement was has remained higher than the proportion ofhumanitarian migrant settlement in Greater Sydney as a whole (10.84%) and all of NewSouth Wales (10.49%). The proportion of special/other arrivals has remained very low duringthis entire time period.
Culturally and linguistically diverse communities – A social profile 15
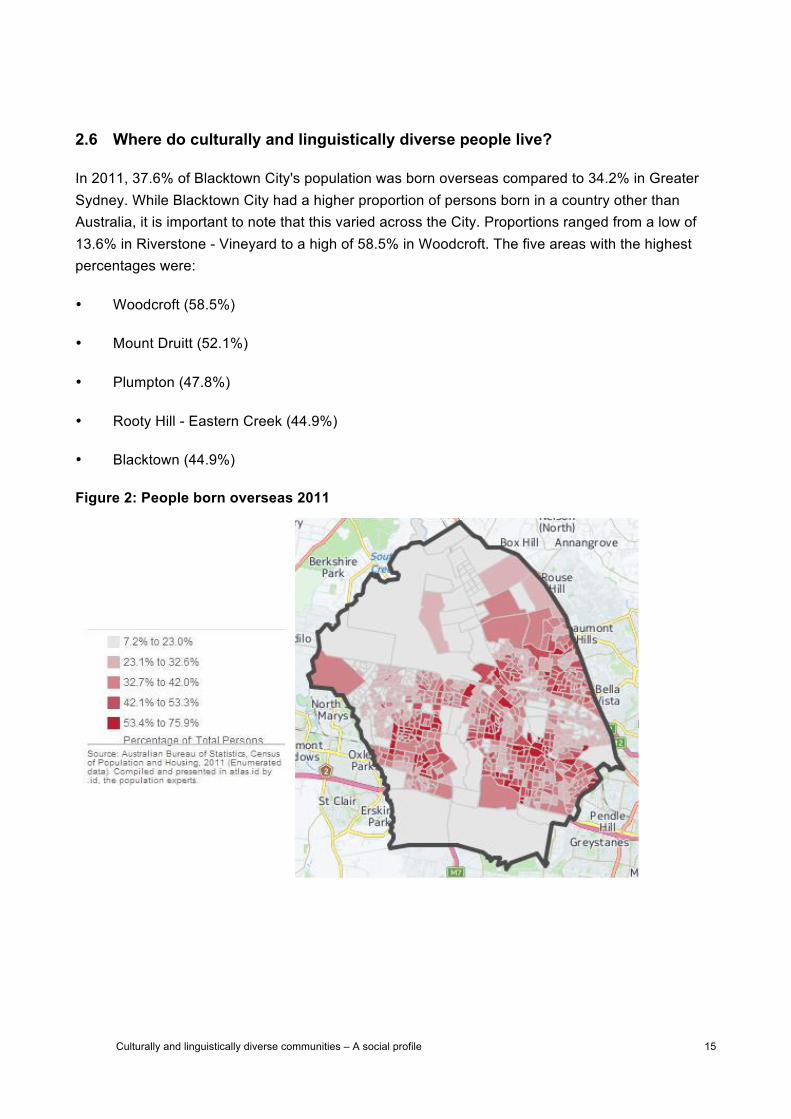
2.6 Where do culturally and linguistically diverse people live?
In 2011, 37.6% of Blacktown City's population was born overseas compared to 34.2% in Greater Sydney. While Blacktown City had a higher proportion of persons born in a country other than Australia, it is important to note that this varied across the City. Proportions ranged from a low of 13.6% in Riverstone - Vineyard to a high of 58.5% in Woodcroft. The five areas with the highest percentages were:
• Woodcroft (58.5%)
• Mount Druitt (52.1%)
• Plumpton (47.8%)
• Rooty Hill - Eastern Creek (44.9%)
• Blacktown (44.9%)
Figure 2: People born overseas 2011

Culturally and linguistically diverse communities – A social profile 16
Table 5: People born overseas, 2011
Blacktown City - Enumerated - Area Number Total population Percent % Acacia Gardens - Parklea 2,628 6,598 39.8
Bidwill 939 4,568 20.6
Blackett 847 3,381 25.1
Blacktown 19,551 43,578 44.9
Dean Park 1,067 3,062 34.8
Dharruk 854 2,728 31.3
Doonside 4,980 12,979 38.4
Emerton 734 2,379 30.9
Glendenning 2,057 5,046 40.8
Glenwood 6,560 15,214 43.1
Hassall Grove 1,608 4,411 36.5
Hebersham 1,783 5,405 33.0
Kellyville Ridge 3,021 8,201 36.8
Kings Langley 2,365 9,182 25.8
Kings Park 875 3,327 26.3
Lalor Park 1,595 7,066 22.6
Lethbridge Park 980 4,657 21.0
Marayong 2,699 7,261 37.2
Marsden Park - Shanes Park - Colebee - Ropes Crossing 854 2,903 29.4
Minchinbury 1,886 5,411 34.9
Mount Druitt 8,233 15,809 52.1
Oakhurst 2,698 6,918 39.0
Plumpton 3,930 8,222 47.8
Prospect - Huntingwood - Arndell Park 1,558 4,569 34.1
Quakers Hill 9,569 26,024 36.8
Riverstone - Vineyard 861 6,319 13.6
Rooty Hill - Eastern Creek 6,404 14,265 44.9
Schofields - Rouse Hill 976 4,331 22.5
Seven Hills 6,653 18,357 36.2
Shalvey 877 3,489 25.1
Stanhope Gardens 3,307 8,129 40.7
The Ponds 1,291 2,978 43.4
Toongabbie 1,954 4,432 44.1
Tregear 823 3,899 21.1
Whalan 1,459 5,883 24.8
Willmot 512 2,486 20.6
Woodcroft 3,740 6,396 58.5
Blacktown City 112,748 299,895 37.6
Greater Sydney 1,497,334 4,378,473 34.2
WSROC 567,834 1,504,718 37.7
Greater Western Sydney 677,932 1,917,425 35.4
New South Wales 1,772,165 6,896,776 25.7
Australia 5,279,282 21,504,278 24.5 Source: Australian Bureau of Statistics, Census of Population and Housing [Parameter].[StartYear] Compiled and presented in atlas.id by .id , the population experts.

Culturally and linguistically diverse communities – A social profile 17
2.7 Overweight, obesity and diabetes
Diabetes represents one of the most challenging public health problems of the 21st century and is reaching epidemic levels globally (Shaw et al., 2010). Approximately 1 million Australians (4.4% of the total (Australian population) have been diagnosed with diabetes at some time in their lives, including an estimated 130,000 people with type1 diabetes Institute of Health and Welfare, 2011).
Social determinants of health are the conditions in which individuals are born, grow, live, work, and age. Increasingly, they are being recognized for their relationship to the rising incidence of Type 2 diabetes in Australia. The prevalence of Type 2 diabetes, increases with age and is higher in men than in women. In Australia, Type 2 diabetes is highest amongst individuals who are overweight or obese, Aboriginal and Torres Strait Islander communities and some immigrant groups.
During 2007 – 2013 the diabetes rate for Blacktown City increased markedly from 3.6 per 100 to 7.8 per 100 - an estimated increase of 7,141 people diagnosed with Type 2 diabetes. This rate is higher than for Sydney statistical division (6.2) and New South Wales (5.8). (Source: Public Health Information Development Unit (PHIDU). Social Health Atlas of Australia: Medicare Local (online). At: http://www.adelaide.edu.au/phidu/maps-data/data/ (accessed April 2015)). Statistical local area data were not available in the Social Atlas at the time of this report.
2.8 Social exclusion
Recent arrivals to a new country are often socially excluded from the broader community due to various reasons including language and cultural differences and barriers, lack of understanding of local systems and processes and in some cases racism and stigmatisation. These exclusions are often more overwhelming for newly-arrived humanitarian entrants fleeing from countries as a result of war, religious or ethnic persecution, and political strife. In addition to the challenges faced by all migrants, refugees may also have their settlement impeded by limited social support and family networks and the impact of grief, loss, torture and trauma.
2.9 Social capital for culturally diverse people
Social capital is a term used to describe particular social relationships within a group or community. This includes levels of trust between people; whether they have a shared understanding of how they should behave towards, and care for one another and participation in civic organisations, such as sporting clubs and school councils. It is also used to describe the resources available within communities that are built from networks of mutual support, reciprocity, trust and obligation. It can be accumulated when people interact with each other in families, workplaces, neighbourhoods, local associations and a range of informal and formal meeting places. (ABS, 2000) It can be measured by surveying residents about levels of community belonging, trust, safety, participation and harmony.

Culturally and linguistically diverse communities – A social profile 18
Regular community surveys across the city provide a snapshot of community belonging and see how community perceptions vary for each community and target group over time. In previous surveys (2006, 2011), residents from across the city have reported positive levels of ‘feeling that they belong to their community’.
During March-May 2015, Blacktown City engaged 2155 residents from across the city in a Social Plan 2016 “Have Your Say” survey. The survey included the following social capital questions:
• I feel like I belong in this neighbourhood
• If you had a problem, could you rely on one of your neighbours to help you?
• I feel safe walking down my street
• I speak with my neighbours – frequently, sometimes, never
• How satisfied are you with your local area as a place to live, work and spend time?
The following results are from respondents to the survey who were born overseas.
I feel like I belong in this neighbourhood
The majority of overseas born participants reported feeling “they belonged in their neighbourhood” (81%), compared to 79% for all participants. This is response was higher than in 2011, when 72.2% of overseas born people reported feeling “they belonged in their neighbourhood”.
Figure 3: Belonging
46%
2%
16%
35%
0%
Agree
Disagree
Neutral
Strongly agree
Strongly disagree

Culturally and linguistically diverse communities – A social profile 19
Speaking with neighbours
This was the first time this question was included in the survey and it provides a baseline for comparison for future surveys. Overseas born people were less likely to speak to a neighbor at least once a week (35%) when compared to all participants (43.1%).
Figure 4: Speaking with neighbours
Satisfaction with neighbourhood
The majority of overseas born people were satisfied with their neighbourhood as a place to live work and spend their time (52%), higher compared to 49.2% for all participants. 16% were very satisfied compared with 18.4% of all participants. In 2011, 48.7% were satisfied and 20.4% were very satisfied.
Figure 5: Satisfied with their local neighbourhood
35%
8%
57%
Frequently (at least once a week)
Never
Some^mes
5%
21%
52%
6%
16%
Dissa^sfied
Neutral
Sa^sfied
Very dissa^sfied
Very sa^sfied

Culturally and linguistically diverse communities – A social profile 20
If you had a problem, could you rely on a neighbour for help?
The majority (60%) reported being able to “rely on a neighbour for help with a problem”. This compared to 64.1 % for all participants. Almost one third (27%) reported they “didn’t know”.
Figure 6: Could you rely on neighbours?
Feeling safe walking down their street
This was the first time this question was included in the survey and it provides a baseline for comparison for future surveys. There were 46% of overseas born participants who reported always feeling safe walking down their street compared to 48.8% for all participants. Overseas born people had a comparable rate of “never” feeling safe (6%) to all participants (6%).
Figure 7: Perceptions of safety
27%
13% 60%
I don't know
No
Yes
46%
6%
49% Always
Never
Some^mes
Culturally and linguistically diverse communities – A social profile 21
2.10 Volunteering rates
In 2011, 11.6% of the population of Blacktown City were involved in volunteering roles within their community. This rate was lower than rates for Greater Sydney (15.1%) and New South Wales (16.9%). These rates could also be an underestimation of volunteering within the community where individuals help one another informally, without being part of an organisation or group or seeing themselves as volunteers.
While this remains a largely under-researched area, particularly in emerging communities, there is growing evidence that many thousands of residents from culturally and linguistically diverse backgrounds volunteer both within and outside their communities. Although many people from culturally and linguistically diverse backgrounds do volunteer, they may not understand the term ‘volunteer’ in the census question. For some, ‘volunteering’ is just a part of belonging to the community, and for others, the term ‘volunteering’ may not be well understood.

Culturally and linguistically diverse communities – A social profile 22
3. What do the community and service providers say?
The results of our community engagement (with residents, workers and service providers) are presented using the World Health Organisation Social Determinants of Health (Wilkinson & Marmot 2003). The social determinants of health are mostly responsible for health inequities - the unfair and avoidable differences in health status seen within and between communities.
The key aspects of social and economic circumstances affecting social wellbeing and health: The social gradient, stress, early life, social exclusion, work, unemployment, social support, addiction food and transport. As a result of the community engagement, we have included an eleventh priority area focussing on how services can be enhanced or supported to improve outcomes for the community: service development.
3.1 Social gradient
• The cost of living, including housing, utilities and food is high and beyond the budgets ofmany migrants and budgeting is difficult.
• Managing income and balancing competing demands for limited financial resources ischallenging for our refugee families, many who have obligations to family members who areoverseas.
• Young people from a migrant and refugee backgrounds report the lack of language skills andracism makes them feel isolated at school.
• Services and residents say adjusting to the education system puts children and youngpeople from our migrant and refugee communities at a disadvantage.
• Services say there is willingness from non-English speaking residents to improve theireducation and English proficiency and get new skills to settle into the community.
• There is a lack of suitable housing for large migrant families.
• Renting is challenging for people who have low incomes and no job or credit history.
3.2 Stress
• Many residents report that they like where they live because it is quiet but this is matchedequally by residents who dislike the noises in their neighbourhoods.
• Residents identify that the convenience and availability of shops and services is the thingthey like best about living in the city.
• Residents are positive about the availability of recreational, sporting, social, religious andcultural activities, with lots of things to do for different age groups and backgrounds.

Culturally and linguistically diverse communities – A social profile 23
• There is an equal distribution of residents who describe the city as safe place to live wherethere is little crime and violence and those who say neighbourhood violence, harassingbehaviour and bullying is a major stress in their lives.
• Residents report being victims of discrimination and racism.
• People are concerned about the maintenance of our parks, equipment, roads, footpaths,trees and waterways.
• Residents are concerned about antisocial behaviour, in their neighbourhoods, aroundshopping centres, parks and transport interchanges (including drinking alcohol, drug-taking,abusive language and swearing).
• There is wide spread concern that many of our streets are untidy and dirty with rubbish andlitter.
• Safety and personal security is a real concern in particular locations like the transportinterchanges and railway stations.
• We need more psychological support for trauma and mental health of residents from ourrefugee communities.
3.3 Early life
• Services report parents from newly arrived migrant communities require support.
• Residents say family reunification is made more difficult by unclear government policy andbureaucratic delays.
3.4 Social exclusion
• Residents report being victims of discrimination and racism.
• Services note language difficulties are a major barrier to communication that can beovercome with more resources, innovative services and supports to learning English.
• Services and residents from non-English speaking backgrounds say low levels of Englishliteracy exclude new arrivals from participating in society.
• Understanding cultural 'norms' and the ‘Australian service system’ are seen my many asexcluding them from participating in society.
• There is increased reporting of residents being publicly abused due to their ethnicity.
• However many residents are positive and say that Blacktown City has a harmoniousmulticultural and diverse community.

Culturally and linguistically diverse communities – A social profile 24
3.5 Work
• Participants and services say different attitudes towards workplace practices across culturalgroups have been found to lead to misunderstandings and workplace difficulties.
• Residents report that there is harassment and discrimination in some workplaces.
• Participants and services report refugees and humanitarian entrants require skills trainingand support in relation to the "Australian Way of Life" to help them in their workplace.
• Some participants and services report many migrants aim to get work as their highest priority(because they have support obligations to family here and overseas) rather than study orstrengthening their skills and employability.
3.6 Unemployment
• Services and residents report language skills exclude many from accessing services andemployment.
• Services and residents note that a lack of recognition of overseas qualifications andexperience disadvantages migrants and refugees in getting a job.
• Employment services say some migrants and refugees find it difficulty acquiring jobreadiness and labour market skills.
3.7 Social support
• Overwhelmingly residents say it is the people who live in the neighbourhood they like thebest about living in the city. The people make Blacktown a great place to live.
• There is some reporting of intergenerational tensions, especially among recent arrivals withinrefugee and migrant communities.
• Many respondents want activities that develop community respect and understanding.
• Refugees report that they experience both cultural and social dislocation and have fewersupports to help them cope.
• There is a shortage or specialist and mainstream services for refugee and migrantcommunities.
• Services and residents say there need to be more health care workers, doctors and nurseswho speak community languages.
• Residents comment that library services need more resources in community languages

Culturally and linguistically diverse communities – A social profile 25
• Services and participants identify those families in which parents and children are separatedfrom their traditional cultures, by distance or by dislocation, experience disconnection orbroken social structures.
3.8 Addiction
• The impact of alcohol and drugs in the community in particular the antisocial behaviourassociated with alcohol and drug use is a concern for many.
3.9 Food
• Not reported in community engagement.
3.10 Transport
• Some residents lack the confidence to use public transport and need support.
• Survey respondents report the lack of reliable, accessible and affordable public transport (notenough services, access to bus, trains).
• There is wide spread concern about speeding vehicles on local roads and what is perceivedas a 'hoon' culture amongst some drivers in our community.
• There is wide spread concern about traffic especially issues with congestion.
• A lack of parking in Blacktown City, specifically Blacktown CBD, Blacktown Hospital,Stanhope Gardens and around railways and bus interchanges, availability of parking is afrustration to many drivers.
• Services say access to private vehicles in which to learn to drive is important for addressingthe social exclusion experienced by refugees, young people and other disadvantagedcommunities.
3.11 Service development
• A lack of services and supports for many people including: homeless people, refugees andmigrants, young people, people with mental illness, general practitioners, domestic violence.
• There is a shortage of both specialist and mainstream services for refugee and migrantcommunities. In particular interpreters and materials in community languages.
• Many services report they face uncertainty in regards of funding. This is impacting on serviceprovision, clients and staff.
Many organisations are concerned about the stress on staff having to 'do more with less', animpact of funding changes and the uncertainty in the sector.

Culturally and linguistically diverse communities – A social profile 26

Culturally and linguistically diverse communities – A social profile 27