A smartphone application to measure the quality of pest ...
8
A smartphone application to measure the quality of pest control spraying machines via image analysis Bruno Brandoli Machado ∗ Computer Science Department Federal University of Mato Grosso do Sul Ponta Pora, Brazil Gabriel Spadon Institute of Mathematics and Computer Science University of Sao Paulo Sao Carlos, Brazil Mauro S. Arruda Computer Science Department Federal University of Mato Grosso do Sul Ponta Pora, Brazil Wesley N. Goncalves Computer Science Department Federal University of Mato Grosso do Sul Ponta Pora, Brazil Andre C. P. L. F. Carvalho Institute of Mathematics and Computer Science University of Sao Paulo Sao Carlos, Brazil Jose F. Rodrigues-Jr Institute of Mathematics and Computer Science University of Sao Paulo Sao Carlos, Brazil ABSTRACT The need for higher agricultural productivity has demanded the intensive use of pesticides. However, their correct use depends on assessment methods that can accurately predict how well the pesti- cides’ spraying covered the intended crop region. Some methods have been proposed in the literature, but their high cost and low portability harm their widespread use. This paper proposes and experimentally evaluates a new methodology based on the use of a smartphone-based mobile application, named DropLeaf. Exper- iments performed using DropLeaf showed that, in addition to its versatility, it can predict with high accuracy the pesticide spray- ing. DropLeaf is a five-fold image-processing methodology based on: (i) color space conversion; (ii) threshold noise removal; (iii) convolutional operations of dilation and erosion; (iv) detection of contour markers in the water-sensitive card; and, (v) identification of droplets via the marker-controlled watershed transformation. The authors performed successful experiments over two case stud- ies, the first using a set of synthetic cards and the second using a real-world crop. The proposed tool can be broadly used by farmers equipped with conventional mobile phones, improving the use of pesticides with health, environmental and financial benefits. CCS CONCEPTS • Human-centered computing → Mobile computing; Mobile phones; • Computing methodologies → Image segmenta- tion; Computer vision; ∗ Corresponding author — [email protected]. Permission to make digital or hard copies of all or part of this work for personal or classroom use is granted without fee provided that copies are not made or distributed for profit or commercial advantage and that copies bear this notice and the full citation on the first page. Copyrights for components of this work owned by others than ACM must be honored. Abstracting with credit is permitted. To copy otherwise, or republish, to post on servers or to redistribute to lists, requires prior specific permission and/or a fee. Request permissions from [email protected]. SAC 2018, April 9–13, 2018, Pau, France © 2018 Association for Computing Machinery. ACM ISBN 978-1-4503-5191-1/18/04. . . $15.00 https://doi.org/10.1145/3167132.3167237 KEYWORDS Mobile Application, Image Processing, Pesticide Spraying Analysis, Deposition Analysis ACM Reference Format: Bruno Brandoli Machado, Gabriel Spadon, Mauro S. Arruda, Wes- ley N. Goncalves, Andre C. P. L. F. Carvalho, and Jose F. Rodrigues-Jr. 2018. A smartphone application to measure the quality of pest control spray- ing machines via image analysis. In Proceedings of SAC 2018: Symposium on Applied Computing (SAC 2018). ACM, New York, NY, USA, 8 pages. https://doi.org/10.1145/3167132.3167237 1 INTRODUCTION The world population is estimated to be 7 billion people with a projection of increasing to 9.2 billion by 2050. An increase that will demand nearly 70% more food due to changes in dietary habits (more dairy and grains) in underdeveloped countries [4]. To cope with such a challenge, it is mandatory to increase the productivity of existing land, which is achieved by means of less waste along the food chain, and by the use of pesticides. Pesticides correspond to chemical preparations for destroying weed plants (via herbicides), fungal (via fungicides), or insects (via insecticides) [1]. The use of pesticides is disseminated worldwide, accounting for a 40-billion- dollar annual budget [13] with tons of chemicals (roughly 2 kg per hectare [10]) being applied in all kinds of crops with the aim of increasing the production of food. Current trends point that a large range of agricultural and horticultural systems are to face heavier pressures from pests, leading to a higher demand for pesticides. In this scenario, it is important that the correct amount of pes- ticide is sprayed on the crop fields. Too much and there might be residues in the produced food along with environmental contam- ination; too little and there might be regions of the crop that are not protected, reducing the productivity. Besides, irregular spray coverage might cause pest and/or weed resistance or behavioral avoidance [11, 15]. In order to evaluate the pulverization, it is nec- essary to measure the spray coverage, that is, the proportional area covered by the pesticide formulation droplets (water carrier, active ingredients, and adjuvant). The problem of measuring the spray coverage abridges to know- ing how much pesticide was sprayed on each part of the crop field. The standard manner to do that is to distribute oil or water-sensitive
Transcript of A smartphone application to measure the quality of pest ...

A smartphone application to measure the quality of pest controlspraying machines via image analysis
Bruno Brandoli Machado∗Computer Science Department
Federal University ofMato Grosso do SulPonta Pora, Brazil
Gabriel SpadonInstitute of Mathematicsand Computer ScienceUniversity of Sao Paulo
Sao Carlos, Brazil
Mauro S. ArrudaComputer Science Department
Federal University ofMato Grosso do SulPonta Pora, Brazil
Wesley N. GoncalvesComputer Science Department
Federal University ofMato Grosso do SulPonta Pora, Brazil
Andre C. P. L. F. CarvalhoInstitute of Mathematicsand Computer ScienceUniversity of Sao Paulo
Sao Carlos, Brazil
Jose F. Rodrigues-JrInstitute of Mathematicsand Computer ScienceUniversity of Sao Paulo
Sao Carlos, Brazil
ABSTRACTThe need for higher agricultural productivity has demanded theintensive use of pesticides. However, their correct use depends onassessment methods that can accurately predict how well the pesti-cides’ spraying covered the intended crop region. Some methodshave been proposed in the literature, but their high cost and lowportability harm their widespread use. This paper proposes andexperimentally evaluates a new methodology based on the use ofa smartphone-based mobile application, named DropLeaf. Exper-iments performed using DropLeaf showed that, in addition to itsversatility, it can predict with high accuracy the pesticide spray-ing. DropLeaf is a five-fold image-processing methodology basedon: (i) color space conversion; (ii) threshold noise removal; (iii)convolutional operations of dilation and erosion; (iv) detection ofcontour markers in the water-sensitive card; and, (v) identificationof droplets via the marker-controlled watershed transformation.The authors performed successful experiments over two case stud-ies, the first using a set of synthetic cards and the second using areal-world crop. The proposed tool can be broadly used by farmersequipped with conventional mobile phones, improving the use ofpesticides with health, environmental and financial benefits.
CCS CONCEPTS•Human-centered computing→Mobile computing;Mobilephones; • Computing methodologies → Image segmenta-tion; Computer vision;
∗Corresponding author — [email protected].
Permission to make digital or hard copies of all or part of this work for personal orclassroom use is granted without fee provided that copies are not made or distributedfor profit or commercial advantage and that copies bear this notice and the full citationon the first page. Copyrights for components of this work owned by others than ACMmust be honored. Abstracting with credit is permitted. To copy otherwise, or republish,to post on servers or to redistribute to lists, requires prior specific permission and/or afee. Request permissions from [email protected] 2018, April 9–13, 2018, Pau, France© 2018 Association for Computing Machinery.ACM ISBN 978-1-4503-5191-1/18/04. . . $15.00https://doi.org/10.1145/3167132.3167237
KEYWORDSMobile Application, Image Processing,Pesticide Spraying Analysis, Deposition AnalysisACM Reference Format:Bruno Brandoli Machado, Gabriel Spadon, Mauro S. Arruda, Wes-ley N. Goncalves, Andre C. P. L. F. Carvalho, and Jose F. Rodrigues-Jr. 2018.A smartphone application to measure the quality of pest control spray-ing machines via image analysis. In Proceedings of SAC 2018: Symposiumon Applied Computing (SAC 2018). ACM, New York, NY, USA, 8 pages.https://doi.org/10.1145/3167132.3167237
1 INTRODUCTIONThe world population is estimated to be 7 billion people with aprojection of increasing to 9.2 billion by 2050. An increase that willdemand nearly 70% more food due to changes in dietary habits(more dairy and grains) in underdeveloped countries [4]. To copewith such a challenge, it is mandatory to increase the productivityof existing land, which is achieved by means of less waste along thefood chain, and by the use of pesticides. Pesticides correspond tochemical preparations for destroying weed plants (via herbicides),fungal (via fungicides), or insects (via insecticides) [1]. The use ofpesticides is disseminated worldwide, accounting for a 40-billion-dollar annual budget [13] with tons of chemicals (roughly 2 kg perhectare [10]) being applied in all kinds of crops with the aim ofincreasing the production of food. Current trends point that a largerange of agricultural and horticultural systems are to face heavierpressures from pests, leading to a higher demand for pesticides.
In this scenario, it is important that the correct amount of pes-ticide is sprayed on the crop fields. Too much and there might beresidues in the produced food along with environmental contam-ination; too little and there might be regions of the crop that arenot protected, reducing the productivity. Besides, irregular spraycoverage might cause pest and/or weed resistance or behavioralavoidance [11, 15]. In order to evaluate the pulverization, it is nec-essary to measure the spray coverage, that is, the proportional areacovered by the pesticide formulation droplets (water carrier, activeingredients, and adjuvant).
The problem of measuring the spray coverage abridges to know-ing how much pesticide was sprayed on each part of the crop field.The standard manner to do that is to distribute oil or water-sensitive

SAC 2018, April 9–13, 2018, Pau, France B. B. Machado et al.
cards (WSC) over the soil; such cards are coated with a bromoethyldye that turns blue in the presence of water [7]. The problem, then,becomes assessing each card by counting the number of droplets perunit area, by drawing their size distribution, and by estimating thepercentage of the card area that was covered; these measures allowone to estimate the volume of sprayed pesticide per unit area of thecrop. If done manually, this process is burdensome and imprecise.This is where automated solutions become the first need, motivat-ing a number of commercial solutions including the Swath Kit [12],a pioneer computer-based process that uses image processing toanalyze the water-sensitive cards; the USDA-ARS system [17], acamera-based system that uses 1-cm2 samples from the cards toform a pool of sensor data; the DropletScan [14], a flatbed scannerdefined over a proprietary hardware; the DepositScan system, madeof a laptop computer and a handheld business card scanner [19];and the AgroScan system1, a batch-based outsource service that per-forms analyzes over collected cards. All these systems, however, aretroublesome to carry throughout the field, requiring the collection,scanning, and post-processing of the cards, a time-consuming andlabor-intensive process. An alternative is to use wired, or wireless,sensors [2]; an expensive solution that demands constant mainte-nance.
Since there is a consensus with respect to the need of achievinga homogeneous spray coverage to gain productivity in agriculturaland horticultural systems, there is room for research in innovativemeans of evaluating the spraying of pesticides. Such means mightbenefit from the current commodity technology found in mobilecell phones, which carry computing resources powerful enough toperform a wide range of applications. In the form of a cell phoneapplication, it is possible to conceive a readily-available solution,portable up to the crop field, to aid farmers and agronomists in thetask of measuring the spray coverage and, hence, in the decision-making process concerning where and how to pulverize. This is theaim of the present study, in which we introduce DropLeaf, a cellphone application able to estimate the amount of pesticide sprayedon water-sensitive cards. DropLeaf works on regular smartphones,what significantly simplifies the assessment of the pesticide appli-cation. It uses the cell phone’s camera to capture images of thespray cards, instantly producing estimates of the spray coverageby means of image processing techniques.
The remainder of the paper is structured as follows. Section 2describes the steps of the proposed approach to measure the qualityof pest control spraying. In addition, in this section, we describethe techniques implemented in the mobile application. In Section 3,we show the results achieved by our application. Section 4 reviewsmajor points related to our results. Conclusions come in Section 5.
2 METHODOLOGY & APPLICATIONIn this section, we introduce our methodology, named DropLeaf, toestimate the pesticide spray coverage. The aim of the technique isto measure the coverage area of water-sensitive spray cards, so toaid in the estimation of the crop pesticide coverage, as discussed inSection 1. DropLeaf is based on image processing techniques builtup on a mobile application that is functional on commodity cellphones. The software calculates measures from the drops observed
1 http://www.agrotec.etc.br/produtos/agroscan/
on the spray cards, presenting statistics that enable the assessmentof the spraying:• Coverage Density (CD): given in percentage of coveredarea per area unit in cm2;• Volumetric Median Diameter (VMD): given by the 50thpercentile DV 0.5 of the diameter distribution;• Diameter Relative Span (DRS): given by DRS =
DV 0.9−DV 0.1DV 0.5
, where DV 0.1 is the 10th percentile and DV 0.9is the 90th percentile of the diameter distribution.
The three measures are used to understand how much of thefield was covered with pesticide and how well the pesticide wasdispersed; the finer the diameters and the higher the coverage area,the better the dispersion.
In order to calculate those measures, it is necessary to determinethe diameter (in micrometers) of each drop observed in a givencard. Manually, this is a laborious task that might take hours percard. Instead, DropLeaf uses an intricate image processing methodthat saves time and provides superior precision when compared tomanual inspection and to former techniques.
Figure 1 illustrates the image processing method of DropLeaf,which consists of five steps applied to each spray card image: (I)color space conversion to grayscale; (II) binarization by thresh-olding (noise removal); (III) dilation and erosion in distinct copiesof the image; (IV) complement operation over dilated and erodedimages to produce contour markers; (V) drop identification viamarker-controlled watershed. Following, we explain each step spec-ifying why it was necessary and how it relates to the next step. Toillustrate the steps of the method, we provide a running examplewhose initial spray card image is presented in Figure 1(a).
2.1 Grayscale transformationAfter the acquisition of an image via the cellphone cameraIor iдinal (x ,y) = (Rxy ,Gxy ,Bxy ) ∈ [0, 1]3, the Step 1 is to con-vert it to a grayscale image Iдray (x ,y) ∈ [0, 1]. This is necessary toease the discrimination of the card surface from the drops that fellon it. We use the continuous domain of [0,1] so that our formalismis able to express any color depth; specifically we use 32 bits forRGB and 8 bits for grayscale. Color information is not needed as itwould make the computation heavier and more complex. This firststep, then, transforms the image into a grayscale representation,see Figure 1(b), according to:
Iдray (x ,y) = 0.299 ∗ Rxy + 0.587 ∗Gxy + 0.114 ∗ Bxy (1)
2.2 BinarizationHere, the grayscale image Iдray passes through a threshold-basedbinarization process – Step 2, a usual step for image segmenta-tion. Since the grayscale is composed of a single color channel,binarization can be achieved simply by choosing a threshold value.Gray values Iдray (x ,y) below the threshold become black, andIдray (x ,y) values above the threshold become white. Since spraycards are designed to stress the contrast between the card and thedrops, the threshold value can be set as a constant value – we usevalue 0.35 corresponding to value 90 in the 8-bit domain [0, 255].This is a choice that removes noise and that favors faster processingif compared to more elaborated binarization processes like those

A smartphone application to measure the quality of spraying machines via image analysis SAC 2018, April 9–13, 2018, Pau, France
Figure 1: The image processing method of DropLeaf. It starts by loading an image of a water sensitive paper. Then, it performs a color-spacetransformation to obtain a grayscale version of the same image — Step 1. Subsequently, the grayscale image is binarized to isolate the dropsand to remove noise — Step 2. Next, in two distinct copies of the noisy-removed image, it applies morphological operations of Dilation andErosion; the dilated image is inverted to contrast with the color of the eroded one — Step 3. The next step is to compute the difference betweenthe two images, delineating the contours (masks) of the droplets. The resulting image is used to identify the contours’ markers that delimitthe area of each drop — Step 4. Finally, the contours are used to segment the drops in sheds — Step 5, providing the tool with a well-definedset of droplets.
based on clustering or on gray-levels distribution. Figure 1(c) de-picts the result, an image Ibinary (x ,y) ∈ {0, 1} given by:
Ibinary (x ,y) =
0, if Iдray (x ,y) < 0.351, otherwise
(2)
2.3 Dilation and erosionAt this point, we need to identify the contours of the drops – Step3, which will delimit their diameters. We use an approach based onconvolution operators of dilation ⊕ and erosion ⊖ [9]. We proceedby creating two copies of the binary image. One copy passes throughdilation – Figure 1(d), a morphological operation that probes andexpands the shapes found in an image. For dilation to occur, astructuring element (a square binary matrix) is necessary so tospecify the extent of the dilation. We used a 3 × 3 matrix B so todilate the drops by nearly 1 pixel. Note that, at this point, we stilldo not know about the drops; rather, the dilation convolution hasthe mathematical property of interacting with potential shapes to
be segmented, thus allowing for drop identification. After dilation,the shapes that correspond to the drops will be 1 pixel larger allalong their perimeters. Formally, we produce an image Idilationaccording to:
Idilation = Ibinary ⊕ B (3)After that, the second copy of the binary image passes through
erosion – Figure 1(e), also a morphological operation that, contraryto dilation, contracts the shapes found in the image. Again, we usea 3× 3 matrix B as the structuring element so to erode the drops bynearly 1 pixel. Formally, we produce an image Ierosion accordingto:
Ierosion = Ibinary ⊖ B (4)
2.4 Contour identificationGiven the two images produced by dilation and erosion — Idilationwith drops larger than the original and Ierosion with drops smallerthan the original — the trick then is to identify the contours ofthe drops by measuring the difference between the dilated and the

SAC 2018, April 9–13, 2018, Pau, France B. B. Machado et al.
eroded drops. This is achieved by applying a complement operationover the two binary images – Step 4. To do so, first, we invert theeroded image, so that 1’s become 0’s and vice versa, obtaining imageIerosion = ¬Ierosion . Then, it is sufficient to perform the followingpixel by pixel logic AND:
Icontour (x ,y) = Idilation (x ,y) AND Ierosion (x ,y) (5)
The result is the binary image Icontour that is depicted in Fig-ure 1(f), in which only contour pixels have value 1.
2.5 Marker-based watershed segmentationIn the last step – Step 5, with contours properly marked on theimage, we proceed to the drop identification considering the previ-ously identified contours. To this end, we used the marker-basedwatershed segmentation. Watershed [16] is a technique that consid-ers an image as a topographic relief in which the gray level of thepixels corresponds to their altitude. The transform proceeds by sim-ulating the flooding of the landscape starting at the local minima.This process forms basins that are gradually fulfilled with water.Eventually, the water from different basins meet, indicating thepresence of ridges (boundaries); this is an indication that a segmentwas found and delimited. The process ends when the water reachesthe highest level in the color-encoding space. The problem withthe classical watershed is that it might over-segment the image inthe case of an excessive number of minima. For a better precision,we use the marker-controlled variation of the algorithm [6]. Thisvariation is meant for images whose shapes define proper contourspreviously given to the algorithm. Given the contours (markers),the marker-based watershed proceeds by considering as minima,only the pixels within the boundaries of the contours. Watershed isan iterative algorithm computationally represented by a functionwatershed(Image i, Image[] contours). We use such a function to pro-duce a set of segments (drops) over the gray-level image Iдray whileconsidering the set of contours identified in the image Icontour , asfollows:
watershed (Iдray , f indContours (Icontour )) (6)
where Imaдe[] f indContours (Imaдe i ) is a function that, given animage, returns a set of sub images (matrices) corresponding to thecontours found in the image; meanwhile, watershed is a functionthat, given an input image and a set of sub images correspondingto contours, produces a set of segments stored in the array of inputcontours.
We use the product of the watershed function to produce ourfinal output Iseдmented simply by drawing the segments over theoriginal image, as illustrated in Figure 1(g). Notice, however, thatthe last image of the process, Iseдmented , is meant only for visu-alization. The analytical process, the core of the methodology, iscomputed over the set of segments.
2.6 Diameter processingAfter segmentation is concluded, we have a set of segments, eachcorresponding to a drop of pesticide. The final step is to computethe measures presented at the beginning of this section: coveragedensity (CD), volumetric median diameter (VMD), and diameterrelative span (DRS). Since we have the segments computationallyrepresented by an array of binary matrices, we can calculate the
area and the diameters of each drop by counting the pixels of eachmatrix. After counting, it is necessary to convert the diameter givenin pixels into a diameter given in micrometers (µm), which, for thei-th drop, goes as follows:
diameterµm (dropi ) = widthpx (dropi ) ∗widthcardµm
widthcardpx(7)
where, widthpx (dropi ) is the width in pixels of the i-th drop;widthcardpx is the width of the card in pixels; andwidthcardµm is thewidth of the card in micrometers. Notice that we usedwidth, butwe could have used heiдht as well; what matters is that the fractionprovides a conversion ratio given in px/µm, which is not sensi-ble to the axis; horizontal or vertical, the ratio is the same for anon-distorted image.
Notice that widthpx (dropi ) and widthcardpx are obtainable viaimage processing, after the segmentation method; meanwhile,widthcardµm is a constant provided by the user, corresponding tothe real-world width of the card. Also, notice that we are consid-ering that the diameter corresponds to the horizontal axis (thewidth) of the drop; it is possible, however, that the diameter cor-responds to the vertical axis, in which case the formulation isstraightly similar. Choosing between the horizontal and the ver-tical axes might be tricky in case the drop is elliptical, ratherthan circular. We solved this issue by extracting the diameterfrom the area of the drop. We use the formula of the circle areaacircle = π ∗ radius2 = π ∗ ( diameter
2 )2. With simple algebra, weconclude that given the area in pixels of the i-th drop, its diameterin pixels is given by the following equation:
diameterpx (dropi ) = 2 ∗
√areapx (dropi )
π(8)
Rewriting Equation 7 by means of Equation 8, we get:
diameterµm (dropi ) = 2 ∗
√areapx (dropi )
π∗widthcardµm
widthcardpx(9)
Once the diameter is converted into micrometers, it becomestrivial to compute all the measures that support the spray cardanalysis, as described in the beginning of Section 2.
Implementation detailsThe use of mobile devices to perform automatic tasks has increasedfast [18]. The main reasons for it are the recent advances in hard-ware, such as sensors, processors, memories, and cameras. Thereby,smartphones have become new platforms for applications of imageprocessing and computer vision [8].
Mobile devices are an adequate mean to perform tasks in real-time in situ far from the laboratory. In this context, besides thismethodology, the contribution of this paper is the development of amobile application to measure the quality of pesticide spraying onwater-sensitive cards. The methods that constitute the process wereimported from the OpenCV library2. Java was the programminglanguage. The application is fully functional as depicted in Figure 2.
2 http://opencv.org

A smartphone application to measure the quality of spraying machines via image analysis SAC 2018, April 9–13, 2018, Pau, France
Figure 2: A preview of our fully functional application.
Figure 3: Control card provided by Hoechst.
3 EXPERIMENTAL RESULTSIn this section, we evaluate our methodology in the task of mea-suring the spray coverage deposition on water-sensitive cards. Thegoal is to have our technique correctly identifying the spray dropsboth in terms of density of spraying (percentage of coverage percm2) and in terms of drop diameter. As so, the first set of experi-ments was conducted over a control card provided by enterpriseHoechst, demonstrating the accuracy in controlled conditions. Thesecond set of experiments was conducted over a real water-sensitivecard that was used on soy crops, demonstrating that the applicationworks even during in situ conditions.
3.1 Control-card experimentsIn this set of experiments, we use the card provided by the Agrotech-nical Advisory of the German enterpriseHoechst. The card holds syn-thetic drops with sizes 50µm, 100µm, 250µm, 500µm, and 1,000µm,as shown in Figure 3; this card is used to calibrate equipment andto assess the accuracy of manual and automatic measuring tech-niques. Since the number and sizes of drops are known, this firstexperiment works as a controlled validation of the methodology.
To measure the drops of the control card, we used a smartphoneto capture the image of the card. In Table 3, we present the averagediameter of the drops, the area covered by the drops given in cm2,the density given in drops per cm2, the coverage density given inpercentage of the card area, and the volumetricmedian diameter.Wedo not present the diameter relative span because, as all the dropsare equal, there is no significant span. From the table, it is possibleto conclude that the accuracy of the methodology is in accordancewith the controlled protocol; that is, the known and measured
SAC 2018, April 9–13, 2018, Pau, France B. B. Machado et al.
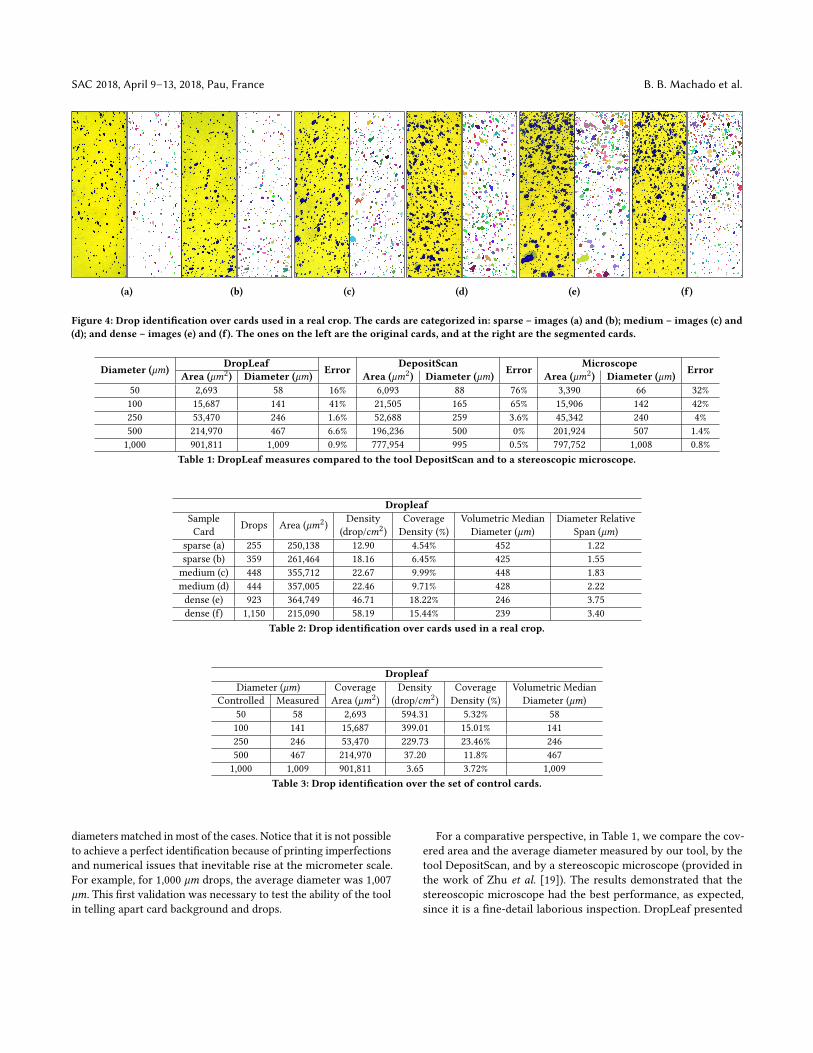
(a) (b) (c) (d) (e) (f)
Figure 4: Drop identification over cards used in a real crop. The cards are categorized in: sparse – images (a) and (b); medium – images (c) and(d); and dense – images (e) and (f). The ones on the left are the original cards, and at the right are the segmented cards.
Diameter (µm) DropLeaf Error DepositScan Error Microscope ErrorArea (µm2) Diameter (µm) Area (µm2) Diameter (µm) Area (µm2) Diameter (µm)50 2,693 58 16% 6,093 88 76% 3,390 66 32%100 15,687 141 41% 21,505 165 65% 15,906 142 42%250 53,470 246 1.6% 52,688 259 3.6% 45,342 240 4%500 214,970 467 6.6% 196,236 500 0% 201,924 507 1.4%1,000 901,811 1,009 0.9% 777,954 995 0.5% 797,752 1,008 0.8%
Table 1: DropLeaf measures compared to the tool DepositScan and to a stereoscopic microscope.
DropleafSample Drops Area (µm2) Density Coverage Volumetric Median Diameter RelativeCard (drop/cm2) Density (%) Diameter (µm) Span (µm)
sparse (a) 255 250,138 12.90 4.54% 452 1.22sparse (b) 359 261,464 18.16 6.45% 425 1.55medium (c) 448 355,712 22.67 9.99% 448 1.83medium (d) 444 357,005 22.46 9.71% 428 2.22dense (e) 923 364,749 46.71 18.22% 246 3.75dense (f) 1,150 215,090 58.19 15.44% 239 3.40
Table 2: Drop identification over cards used in a real crop.
DropleafDiameter (µm) Coverage Density Coverage Volumetric Median
Controlled Measured Area (µm2) (drop/cm2) Density (%) Diameter (µm)50 58 2,693 594.31 5.32% 58100 141 15,687 399.01 15.01% 141250 246 53,470 229.73 23.46% 246500 467 214,970 37.20 11.8% 4671,000 1,009 901,811 3.65 3.72% 1,009
Table 3: Drop identification over the set of control cards.
diameters matched in most of the cases. Notice that it is not possibleto achieve a perfect identification because of printing imperfectionsand numerical issues that inevitable rise at the micrometer scale.For example, for 1,000 µm drops, the average diameter was 1,007µm. This first validation was necessary to test the ability of the toolin telling apart card background and drops.
For a comparative perspective, in Table 1, we compare the cov-ered area and the average diameter measured by our tool, by thetool DepositScan, and by a stereoscopic microscope (provided inthe work of Zhu et al. [19]). The results demonstrated that thestereoscopic microscope had the best performance, as expected,since it is a fine-detail laborious inspection. DropLeaf presented

A smartphone application to measure the quality of spraying machines via image analysis SAC 2018, April 9–13, 2018, Pau, France
the best results after the microscope, beating the precision of De-positScan for all the drop sizes, but 500 µm; for 1,000 µm drops,the two tools had a similar performance, diverging in less than 1%.In the experiments, one can notice that the bigger the drop, thesmaller the error, which ranged from 41% to less that 1%. For biggerdrops, the drop identification is next to perfect; for smaller ones,the error is much bigger; this is because of the size scale. Whenmeasuring drops as small as 50µm, a single extra pixel detected bythe camera is enough to produce a big error. This problem was alsoobserved in the work of Zhu et al. [19]).
By analyzing the data, we concluded that the error due to thesize scale is predictable. Since it varies with the drop size, it is notlinear; nevertheless, it is a pattern that can be corrected with thefollowing general equation:
diameter ′ = a ∗ diameterb (10)In the case of our tool, we used a = 0.2192733 and b = 1.227941.
These values shall vary from method to method, as we observedfor DepositScan and for the stereoscopic microscope.
3.2 Card experimentsIn the second set of experiments, we used six cards evaluated inthe work of Cunha et al. [3]. The cards were separated into threegroups of two cards, which were classified as sparse, medium, anddense with respect to the density of drops, as can be verified inFigure 4. These experiments aimed at testing the robustness of themethodology, that is, its ability in identifying drops even when theyare irregular and/or they have touching borders. Table 2 showsthe numerical results, including the number of drops, the cover-age area, the density, the coverage density, the volumetric mediandiameter, and the diameter relative span. In this case, the tablemust be interpreted along with the figure, which presents the dropsas identified by our methodology. The first four measures can beinspected visually. It is also possible to see that the right-hand sideimages in Figure 4 (the tool’s results stressed with colored drops),demonstrate that the segmentation matches the expectations ofa quick visual inspection. The drops at the left are perfectly pre-sented on the right. Other features are also noticeable. Density, forinstance, raises as we visually inspect Figure 4(a) to Figure 4(f);the corresponding numbers in the table raise similarly. Countingthe number of drops requires close attention and a lot of time; forthe less dense Figure 4(a) and Figure 4(b), however, it is possible toverify the accuracy of the counting and segmentation provided bythe tool.
The last two measures, VMD and DRS, provide parameters tounderstand the distribution of the drops’ diameters. For example,it is possible to see that, being more dense, cards (e) and (f) had asmaller median and a larger span of diameters. These measures in-dicate that the spraying is irregular and that it needs to be adjusted.Meanwhile, cards (a) and (b) are more regular, but not as dense asnecessary, with a lot of blank spots. Cards (c) and (d), in turn, havea more uniform spraying and a more regular coverage.
4 DROP DETECTION ISSUESThis section discusses issues to be considered when developingtechnologies for spray card inspection. We faced such issues during
our research; we discuss such issues as a further contribution thatshall guide other researchers that deal with the same and withrelated problems.
4.1 Coverage factorIn our experience, we noticed that when the spraying gets too dense,not all of the information about the drops can be detected, no matterwhich technique is used for measuring; for instance, informationabout the number of drops, and their diameter distribution cannotbe tracked anymore. This effect was already pointed out by Fox etal. [5], who claims that a total coverage on the card above 20% causesresults to be unreliable; and coverages close to 70% are unfeasible.
This is because, with too much spray, the drops fall too close oneto each other, causing overlaps; visually, is it like two or more dropsbecame one. Effectively, this is what happens in the crop due to theintermolecular forces present in the water drops, which causes themto merge, forming bigger drops. Hence, it is needed caution, nomatter which technique of assessment, whenever the total coveragearea surpasses 20%, a circumstance when the diameter distributionis no longer accurate, and one must rely only on the coverage areafor decision making. Although the diameter is not available, thelarge drops that might be detected indicate an excessive amount ofpesticide or a malfunctioning of the spray device.
4.2 Angle of image captureWe also noticed that the image processing methodology used todetect the drops of all the studies presented so far, including ours,works only if the capture angle of the card is equal to 90 degrees.That is, the viewing angle of the camera/scanner must be orthogo-nal to the spray card surface. This is necessary because the pixelsof the image are converted into a real-world dimension to expressthe diameter of the drops in µm; therefore, it is necessary that thedimensions of the image be homogeneous with respect to scale.In case, the capture angle is not of 90 degrees, the image is dis-torted, resulting in different scales in each part of the image. Forflatbed scanners, this is straightforward to guarantee; however, forhandheld devices (cameras and smartphones), additional care isnecessary. In such cases, one might need a special protocol in orderto capture the image, like using a tripod, or some sort of apparatusto properly place the capturing device with respect to the spraycard. This problem might also be solved by means of an imageprocessing algorithm to remove eventual distortions, in which case,additional research and experimentation are necessary.
4.3 Minimum dots per inch (dpi)Our experiments also reviewed that there must be a minimumamount of information on the spray card images in order to achievethe desired precision regarding the drops’ diameter. This minimuminformation is expressed by the dots per inch (dpi) property of theimage capturing process; dpi is a well-known resolution measurethat expresses how much pixels are necessary to reproduce thereal-world dimension of one linear inch. If not enough pixels arecaptured per inch of the spray card during the capturing process, itbecomes impossible to estimate, or even to detect, the diameter ofthe smallest drops. This might influence the diameter distributionanalysis hiding problems in the spraying process.

SAC 2018, April 9–13, 2018, Pau, France B. B. Machado et al.
In order to guide our research and development, we calculatedand tested on the minimum dpi’s that are necessary for each desireddrop diameter. In Table 4 one can see the minimum number ofpixels to express each drop diameter for each dpi value; notice thatsome cells of the table are empty (filled with a hyphen) indicatingthat the diameter cannot be computationally expressed in that dpiresolution. Also, notice that, in the columns, the number of pixelsfor one same diameter increases with the resolution. Obviously, themore information, the more precision at the cost of more processingpower, substantially more storage, and more network bandwidthwhen transferring images. From the table, it is possible to concludethat 600 dpi is the minimum resolution for robust analyses, since itcan represent diameters as small as 50 µm; meanwhile, a resolutionof 1,200 dpi, although even more robust, might lead to drawbacksregarding the management of image files that are way too big.Notwithstanding, the fact that a resolution is enough to representa given diameter is not a guarantee that drops with that diametersize will be detected; this is because the detection depends on otherfactors such as the quality of the lenses, and the image processingalgorithm.
Table 4 is a guide for developers willing to computationallyanalyze spray cards, and also for agronomists who are decidingwhich equipment to buy in face of their needs.
HHHHHµmdpi 50 100 300 600 1200 2400 2600
10 - - - - - - 150 - - - 1 2 5 5100 - - 1 2 5 9 10250 - 1 3 6 12 24 26500 1 2 6 12 24 47 511,000 2 4 12 24 47 94 10210,000 20 39 118 236 472 945 1024
Table 4: Pixels needed to represent a given length, given a dpi.
5 CONCLUSIONSWe introduced DropLeaf, a portable application to measure thepesticide coverage by means of the digitalization of water-sensitivespray cards. We verified that the precision of DropLeaf was enoughto allow the use of mobile phones as substitutes for more expensiveand troublesome methods of quantifying pesticide application incrops. The methodology was instantiated in a tool to be used inthe inspection of real-world crops. We tested our tool with twodatasets of water-sensitive cards; our experiments demonstratedthat DropLeaf accurately tracks drops, being able to measure thepesticide coverage and the diameter of the drops. Furthermore,our mobile application detects overlapping drops, an importantachievement because a finer precision provides not only betteraccuracy but also more information.
ACKNOWLEDGEMENTSThe authors are thankful to Dr. Claudia Carvalho who kindly pro-vided annotated cards; to the Sao Paulo Research Foundation (grants2011/02918-0, 2016/02557-0 and CEPID CeMEAI grant 2013/07375-0); to the National Council for Scientific and Technological Devel-opment (CNPq); and to the Coordination for the Improvement ofHigher Education Personnel (Capes).
REFERENCES[1] Hubert Bon, Joel Huat, Laurent Parrot, Antonio Sinzogan, Thibaud Martin, Eric
Malezieux, and Jean-Francois Vayssieres. 2014. Pesticide risks from fruit andvegetable pest management by small farmers in sub-Saharan Africa. A review.Agronomy for Sustainable Development 34, 4 (2014), 723–736.
[2] T. G. Crowe, D. Downey, and D. K. Giles. 2005. Digital device and technique forsensing distribution of spray deposition. Transactions of the American Society ofAgricultural and Biological Engineers 48, 6 (2005), 2085–2093.
[3] Mario Cunha, Claudia Carvalho, and Andre R.S. Marcal. 2012. Assessing theability of image processing software to analyse spray quality on water-sensitivepapers used as artificial targets. Biosystems Engineering 111, 1 (2012), 11–23.https://doi.org/10.1016/j.biosystemseng.2011.10.002
[4] Food and Agriculture Organization. 2009. Feeding the world in 2050. TechnicalReport. United Nations. World agricultural summit on food security.
[5] R.D. Fox, R.C. Derksen, J.A. Cooper, C.R. Krause, and H.E. Ozkan. 2003. Visualand image system measurement of spray deposits using water sensitive paper.Applied Engineering In Agriculture 19, 5 (2003), 549–552.
[6] Raffaele Gaetano, Giuseppe Masi, Giuseppe Scarpa, and Giovanni Poggi. 2012. Amarker-controlled watershed segmentation: Edge, mark and fill. InGeoscience andRemote Sensing Symposium (IGARSS), 2012 IEEE International. IEEE, 4315–4318.
[7] D. K. Giles and D. Downey. 2003. Quality Control Verification and Mapping forChemical Application. Precision Agriculture 4, 1 (2003), 103–124.
[8] Farinella Giovanni Maria, Ravì Daniele, Tomaselli Valeria, Guarnera Mirko,and Battiato Sebastiano. 2015. Representing Scenes for Real–Time ContextClassification on Mobile Devices. Pattern Recognition 48, 4 (2015), 1086–1100.https://doi.org/10.1016/j.patcog.2014.05.014
[9] Rafael C Gonzalez and Richard E Woods. 2007. Image processing. Digital imageprocessing 2 (2007).
[10] Yongbo Liu, Xubin Pan, and Junsheng Li. 2015. A 1961–2010 record of fertilizeruse, pesticide application and cereal yields: a review. Agronomy for SustainableDevelopment 35, 1 (2015), 83–93.
[11] Xavier Martini, Natalie Kincy, and Christian Nansen. 2012. Quantitative impactassessment of spray coverage and pest behavior on contact pesticide performance.Pest Management Science 68, 11 (2012), 1471–1477.
[12] Karl Mierzejewski. 1991. Aerial spray technology: possibilities and limitations forcontrol of pear thrips. Technical Report. U.S. Department of Agriculture, ForestService. 317–331 pages. Tech. Rep. NE-147.
[13] Jozsef Popp, Karoly Peto, and Janos Nagy. 2013. Pesticide productivity and foodsecurity. A review. Agronomy for Sustainable Development 33, 1 (2013), 243–255.
[14] Wolf R.E. 2003. Assessing the ability of DropletScan to analyze spray dropletsfrom a ground operated sprayer. Applied Engineering In Agriculture 19 (2003),525–530.
[15] Michael Renton, Roberto Busi, Paul Neve, David Thornby, and Martin Vila-Aiub.2014. Herbicide resistance modelling: past, present and future. Pest ManagementScience 70, 9 (2014), 1394–1404.
[16] Luc Vincent and Pierre Soille. 1991. Watersheds in digital spaces: an efficientalgorithm based on immersion simulations. IEEE transactions on pattern analysisand machine intelligence 13, 6 (1991), 583–598.
[17] Hoffman W.C. and Hewitt A.J. 2005. Comparison of three imaging systems forwater-sensitive papers. Applied Engineering In Agriculture 21 (2005), 961–964.
[18] Feng Xia, Ching-Hsien Hsu, Xiaojing Liu, Haifeng Liu, Fangwei Ding, and WeiZhang. 2015. The power of smartphones. Multimedia Systems 21, 1 (2015), 87–101.https://doi.org/10.1007/s00530-013-0337-x
[19] Heping Zhu, Masoud Salyani, and Robert D. Fox. 2011. A Portable ScanningSystem for Evaluation of Spray Deposit Distribution. Computer and Electronicsin Agriculture 76, 1 (2011), 38–43.