Sirris manufacturingday2011 the-future-of-smart-manufacturing-execution-de-clercq

IOSR Journal of Electrical and Electronics Engineering (IOSR-JEEE)
e-ISSN: 2278-1676,p-ISSN: 2320-3331, Volume 10, Issue 3 Ver. III (May – Jun. 2015), PP 14-28
www.iosrjournals.org
DOI: 10.9790/1676-10331428 www.iosrjournals.org 14 | Page
A Smart Manufacturing Execution System
Kunal S. Jagdale1, Suyash A. Patil
2, and Sanjaykumar K. Parchandekar
3
1, 2, 3Department of Electronics Engineering,
Walchand College of Engineering, Sangli-416 415, Maharashtra, India
Abstract: This paper presents a novel design of a smart and efficient Manufacturing Execution System (MES)
to acquire data from the shop floor in a factory. With increasing complexities in the production process,
improving industrial productivity using production information systems is a challenge for all industries in the
world. Manufacturing Execution Systems (MES), since their introduction in the factory environment, are
gaining popularity due to their ability to control and monitor production process using integrated data.
However, employers/managers are still confronting with many complications in understanding huge
information on the production process and reacting quickly based on such information. In this paper, we
propose the design of NIRMAN Factory Information System (FIS)-A Smart MES to enable the control and
monitoring of multiple factors of the production process like assembly line, personnel, quality control, safety,
etc. NIRMAN FIS, a MES based on Android Smartphone, presents data about factory environment and factory
operations on the manager’s smartphone screen and helps him to react and take important decisions quickly
and flexibly.
Index Terms: Sectional Efficiency, Factory Efficiency, Assembly Line, Threshold Limit, Productivity,
Morale, Factory Environment, Data Acquisition, Analysis, Automatic and Manual Control, Bluetooth, Arduino,
Android, Remote Monitoring.
I. INTRODUCTION Production Managers share a significant task in the production process. They continuously monitor the
factory operations and are involved in optimizing the operations so as to escalate factory efficiency. However,
monitoring factory operations and production status is not an easy task.
Many existing computer based industrial automation systems help managers towards accomplishment
of his objectives. However, these systems, being bulky, are not portable and information is not available to the
manager unless he makes use of computer [3]. Hence, updates about production process are not conveyed to
manager when he is away from the system and this may delay some important decisions related to production.
This drawback necessitates development of new Manufacturing Execution System (MES) which can be
portable and can provide information about factory operations whenever required without physical presence of
manager before the system.
Smartphones are the best portable devices capable of providing enormous information. Single click on
the smartphone can fetch enormous information for the user. We cannot deny that the use of smartphones in
daily activities is making human life easier and faster than ever. The concept of using smartphones if extended
to industrial and commercial world can help manager to acquire data about his industry or business from
anywhere in the world.
The ever-increasing use of Android Smartphones and various applications that run on it led to
evolution of NIRMAN Factory Information System (FIS)-An Android based MES that not only monitors
important safety parameters in a factory but also provides information about production status and quality.
NIRMAN FIS provides real time production status, calculates production efficiency, plots real time graphs and
provides many other features for efficient analysis of data.
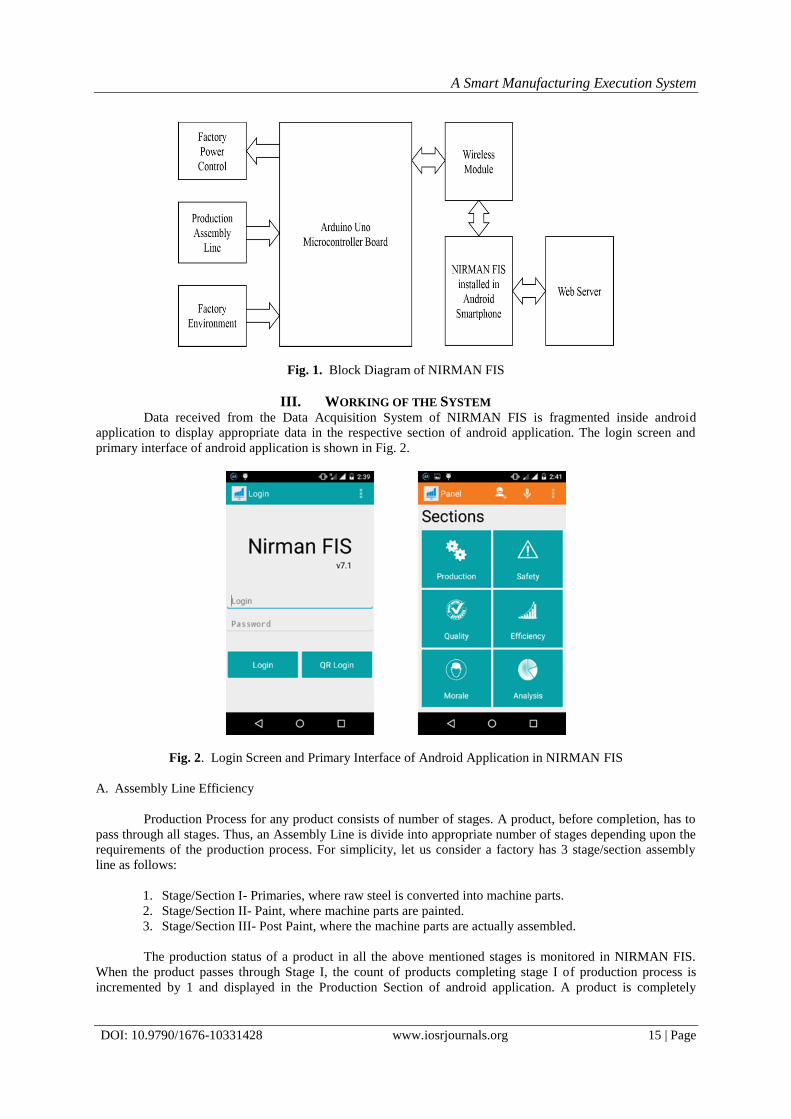
II. PROPOSED SYSTEM Data Acquisition System of NIRMAN FIS consists of 4 important blocks i.e., Factory Power Control,
Production Status, Factory Environment and Bluetooth Module. Details of Data Acquisition System will be
discussed in the later part of the paper. Arduino Uno Microcontroller Board [11] acquires data about production
process and factory environment to process and convert it into required form.
A Data String Pattern is designed to send this data to Android Application of NIRMAN FIS using HC-
05 Bluetooth Module [20]-[21]. With a Data Refresh Rate of 1 minute, android application continuously
displays and monitors various parameters of the factory. The android application also communicates with the
web server [8]-[10] to receive some commands and then conveys these commands to Arduino through bluetooth
module so as to enable Arduino to take appropriate action to ensure safety inside factory and thus, control
factory operations.
A Smart Manufacturing Execution System
DOI: 10.9790/1676-10331428 www.iosrjournals.org 15 | Page
Fig. 1. Block Diagram of NIRMAN FIS
III. WORKING OF THE SYSTEM Data received from the Data Acquisition System of NIRMAN FIS is fragmented inside android
application to display appropriate data in the respective section of android application. The login screen and
primary interface of android application is shown in Fig. 2.
Fig. 2. Login Screen and Primary Interface of Android Application in NIRMAN FIS
A. Assembly Line Efficiency
Production Process for any product consists of number of stages. A product, before completion, has to
pass through all stages. Thus, an Assembly Line is divide into appropriate number of stages depending upon the
requirements of the production process. For simplicity, let us consider a factory has 3 stage/section assembly
line as follows:
1. Stage/Section I- Primaries, where raw steel is converted into machine parts.
2. Stage/Section II- Paint, where machine parts are painted.
3. Stage/Section III- Post Paint, where the machine parts are actually assembled.
The production status of a product in all the above mentioned stages is monitored in NIRMAN FIS.
When the product passes through Stage I, the count of products completing stage I of production process is
incremented by 1 and displayed in the Production Section of android application. A product is completely

A Smart Manufacturing Execution System
DOI: 10.9790/1676-10331428 www.iosrjournals.org 16 | Page
manufactured when it passes through Stage 3 of the assembly line. NIRMAN FIS tracks the efficiency of each
stage by considering actual and expected production.
The count of expected production for each stage is incremented by 1 after a predefined standard time
required for a product to pass through that stage. Presently, this time is set as 1 minute for each stage and hence,
at the end of 3 minutes, each stage is expected to complete 3 products as shown in Fig. 3. However, based upon
the actual production, efficiency for each stage is calculated and is displayed in the application. For e.g., from
Fig. 3, actual and expected production for Stage I is 2 and 3 respectively. Hence, efficiency for Stage I is
calculated as (2/3)*100=66.66 %.
Fig. 3. Production Details displayed in Android Application of NIRMAN FIS
Shift wise data for each stage is made available in Production section of android application. As shown
in Fig. 3, each stage is allotted with percentage i.e. 25% for stage I, 75% for Stage II and 100% for stage III.
This indicates partial manufacturing of a product. For e.g., Say, at the end of the day, 50, 45 and 30 products
have passed through stage I, II, and III respectively. This means that 50, 45 and 30 products have completed
25%, 75% and 100% of the total production process respectively. Thus, at the end of the day, a manager can
know the count of products that are partially manufactured and the count of completely manufactured products.
We can also track the number of products that are available for delivery from Stage I to Stage II or
from Stage II to Stage III or from Stage III to Shipping.
B. Factory Environment
For complex industrial processes that are automated by process management systems, disruptions or
short-term interruptions of workflows cause high failure costs, in the worst case, even danger to people or the
environment. Hence, the factory environment should be constantly monitored to check some vital parameters
like temperature, air quality, pressure, humidity, light intensity, etc. because factor of safety is directly related
with these parameters.
NIRMAN Factory Information System acquires factory conditions using various sensors (to be
discussed later). For safety parameters like temperature, air quality and pressure, we can set Threshold Limit
using NIRMAN FIS as shown in Fig. 4. When these parameters cross their threshold limits, following actions
are generated by the system:
1. The power supply to the factory is cut-off.
2. Auxiliary power supply turns ON the light for emergency exit path.
3. The tile of the corresponding parameter turns red.
4. Emergency situation is notified to all workers in the factory using an alarm.
When entered into section of Safety, tiles for four zones will give details of various parameters like
temperature, pressure, humidity, air quality and light intensity as shown in Fig. 5. Thus, NIRMAN FIS monitors
and ensures safe working conditions in the factory.
The sensors used in the system to procure the above mentioned safety parameters consists of:

A Smart Manufacturing Execution System
DOI: 10.9790/1676-10331428 www.iosrjournals.org 17 | Page
1. Temperature and Pressure - BMP180 [5][19]
2. Air Quality - MQ135 [17]
3. Humidity - DHT 11 [18]
4. Light Intensity - LDR [2]
Fig. 4. Safety Section in Android Application of NIRMAN FIS
C. Automatic and Manual Power Control
If the temperature inside factory exceeds Threshold Limit due to fire, the tile of the zone will turn red
to indicate an emergency situation inside factory as shown in Fig. 5. When clicked on that zone, the tile of
temperature is found to turn red. When temperature crosses its Threshold Limit, android application
communicates with Arduino through bluetooth module and instructs the microcontroller to shut down the main
power supply to prevent further damage.
Sometimes, automatic control of the system might introduce a delay in conveying information about an
emergency situation or might even fail due to some technical problems. At such times, if an emergency situation
is visible before the eyes of a manager, he can use Power ON/OFF to manually cut-off the power supply to the
factory as shown in Fig. 5. Similarly, Buzzer ON/OFF option can be used to notify workers about an emergency
situation in the factory. When we click on the Power OFF button, the system will automatically turn ON an
auxiliary power supply as discussed earlier and generate an alarm.
Fig. 5. Safety Parameters displayed in Android Application of NIRMAN FIS

A Smart Manufacturing Execution System
DOI: 10.9790/1676-10331428 www.iosrjournals.org 18 | Page
As shown in Fig. 6, when a safety parameter is below its threshold value, power is continuously
supplied to the factory. This is indicated by Green LED in the system. When a safety parameter exceeds
threshold value, the android application instructs Arduino to make its pin 3 High [16]. This pin is connected to
the base of transistor Q1 (BC 547).
Fig. 6. Power supply to factory turned OFF when a parameter exceeds Threshold Limit
When it goes high, transistor turns ON and causes the relay to switch [1], turning OFF the Green LED
connected to relay, thus, indicating that the power supply is cut-off. As indicated by Red LED, an auxiliary
power supply is turned ON to light evacuation path.
D. Paperless Factory
Fig. 7. Productivity displayed in Android Application of NIRMAN FIS
Customer Satisfaction is the basic objective behind every manufactured product. Quality of the product
determines the level of influence of the product on the customers. Hence, Quality Testing of products is
essential to before the manufactured product is delivered to customer. A manufactured product is approved for
delivery to customer only if it passes all quality tests. For large products like cars or tractors, quality testing
involves documentation of many parameters of the product. It undergoes many tests the results of which are

A Smart Manufacturing Execution System
DOI: 10.9790/1676-10331428 www.iosrjournals.org 19 | Page
recorded on papers. Thus, quality testing consumes many papers. NIRMAN FIS aims towards minimization of
paper usage and promotes Green and Paperless Factory.
A list of quality control parameters is prepared in the android application of NIRMAN FIS as shown in
Fig. 7. When a product passes the test for that parameter, we place a Correct Mark on that parameter. The
procedure is repeated for all the parameters of a single product and pressing Submit button when all parameters
for a product are correct will increment the count of Approved Products by 1. When any of the parameters is not
correct, pressing Submit button will increment the count of Rejected Products.
Productivity of the factory is calculated by using formula:
As an extension to above features, if parameter is being tested by a machine, then output from that
machine can also be fetched to place a correct mark on that parameter automatically.
E. Personnel Morale
The morale of the employees will play an important role in determining the production capacity of the
factory. Morale and working capabilities of the workers are affected by the factory conditions. More favorable
the factory conditions, higher will be productivity. Each employee can be provided with unique Radio
Frequency Identification (RFID) [7][4] tags. When an employee wants to enter factory premises, RFID tag will
serve as an entry ticket and at the same time sensors will record his attendance that can be fetched by the
application. The application can keep a track of absent employees. Shift wise data will be collected to draw
some important conclusions related to employee morale.
Fig. 8. Personnel Morale in Android Application of NIRMAN FIS
As shown in Fig. 8, the application will continuously keep a track of expected workers and present
workers in the factory. The factory conditions like temperature, humidity and light intensity which effect
physical abilities of the workers will be procured from the sensors installed in the factory. With proper analysis
of the relation between these conditions and productivity, we can conclude the most favorable conditions when
the workers can perform at their best level. Maintaining a pleasant factory environment will increase the output
from workers, thus, resulting in increased productivity and efficiency.
F. Factory Efficiency
The data available from three shifts will be collectively analyzed to generate a report. If actual period
for which machines are active is greater than expected period, either machine efficiency or worker efficiency
has been decreased and should be addressed immediately. This will increase the energy consumption and
increase the overall production cost. The final goal is Increase Efficiency, Reduce Costs.

A Smart Manufacturing Execution System
DOI: 10.9790/1676-10331428 www.iosrjournals.org 20 | Page
The efficiency shown here is Factory Efficiency and considers 2 factors:
1. Average efficiency of 3 sections
2. Productivity
Fig. 9. Factory Efficiency displayed in Android Application of NIRMAN FIS
It is calculated by taking average efficiency of 3 sections and then multiplying the obtained average
with productivity to get answer in percentage. The formula used is as follows:
For e.g., if average efficiency of 3 sections is 70 % and productivity is 50 %, then the actual efficiency
of the factory is 35 %. It calculates the efficiency based on the number of approved products. Thus, even though
the average efficiency was 70 %, the actual efficiency is only 35 % because only 50 % of the total products were
approved.
G. Data Analysis
Fig. 10. Graphical Analysis for Production from 3 Stages of Assembly Line

A Smart Manufacturing Execution System
DOI: 10.9790/1676-10331428 www.iosrjournals.org 21 | Page
Data available, if analyzed properly, can reveal many important facts about factory performance and
can help managers to take proper actions for improving its performance. NIRMAN FIS generates real time
graphs based on the data acquired from Data Acquisition System.
Line graph of Fig. 10 shows the number of products manufactured in each stage per 2 hours.
Considering the expected number of manufactured products per 2 hours to be 40 (indicated by Yellow Line in
the graph), we can track the actual production for the entire day i.e. all 3 shifts. The duration when production
goes down can be tracked and appropriate measures can be taken.
Bar graph of Fig. 10 is the result of Quality Testing of the product. The number of Approved and
Rejected products can be tracked in each month. It is seen that rejected products are more during month of May.
Factory conditions in the month of May can be reviewed to find the cause for increase in rejected products.
Fig. 11 is a speedometer that will generate a rating for factory performance based on Factory Efficiency
discussed earlier. For example, if Factory Efficiency is 91%, Performance Rating is 9.1 and the factory
performance is Outstanding.
Fig. 11. Graphical Analysis for Overall Factory Performance
IV. DATA ACQUISITION SYSTEM Data Acquisition forms the heart of NIRMAN Factory Information System. Data about various
parameters is fetched from the sensors located in the factory environment. Arduino Uno, being the central
processing unit, processes the acquired data and transmits it serially [12] to Bluetooth Module.
Fig. 12. Data Acquisition System of NIRMAN FIS

A Smart Manufacturing Execution System
DOI: 10.9790/1676-10331428 www.iosrjournals.org 22 | Page
The composition of string in the transmitted serial data will be discussed later. The acquired data is
refreshed every second so that live updates about factory status are conveyed to the manager. Fig. 12 simplifies
the idea about the interface of various sensors with Arduino Uno.
To get acquainted with each block, we'll discuss about the parameters fetched by Arduino. These
parameters include temperature, pressure, humidity, air quality, light intensity and production status. A constant
length string is formed using these parameters to simplify the communication of data between Bluetooth Module
and Android Application.
A. Data String Pattern
As shown in Fig. 12, HC-05 [20] is connected to Arduino using TX and RX pins. The values serially
transmitted by Arduino are received by bluetooth module and transmitted to android application using wireless
bluetooth connection. Fig. 13 shows the string pattern generated by Arduino in NIRMAN FIS.
Fig. 13. String Pattern generated by Arduino for Serial Transmission
The string pattern and the length of the string is kept constant so that application on receiving the data
through bluetooth connection can divide the string and allot those values to respective parameters. This string is
sent every 1 sec by Arduino to bluetooth module. For example, if transmitted string is 01000234.590.9537.8959,
it actually consists of data blocks as shown in Fig. 13.
Fig. 14. Hardware Implementation of Data Acquisition System in NIRMAN FIS
B. Air Quality
MQ135 is used as the air quality sensor. Arduino Uno has 6-channel 10-bit ADC. The analog output of
MQ135 is connected to channel 1 (A1) to get digital output [14] varying from 0 to1023. Here, lower values of
digital output [17] indicate clean air while higher values indicate polluted air.
Using mapping function in Arduino Uno (i.e. map(AirQuality, 0, 1023, 9, 0)) [13], the values for air
quality from 0 to 1023 are mapped between 9 and 0. Thus, as a simplification to human understanding, higher
values between 0 and 9 will now indicate clean air and polluted air will be represented by lower values. Since
the values between 0 and 9 are used to specify air quality, it consumes only one character of the entire string
pattern.

A Smart Manufacturing Execution System
DOI: 10.9790/1676-10331428 www.iosrjournals.org 23 | Page
C. Temperature and Pressure
BMP180 [5] requires DC power supply of 3.3 V and is interfaced with Arduino Uno using Serial Data
(SDA) and Serial Clock (SCL) pins i.e. Inter Integrated Circuit (I2C) protocol [6]. It delivers pressure and
temperature values in bar and °C respectively [19]. For example, pressure=0.95 bar and temperature=34.89 °C.
It, therefore, consumes 9 characters in the transmitted string (dot is also considered as a character). The
measurement ranges are as follows:
1. Temperature: -40 to 85 °C
2. Pressure: up to 10,000 hPa
D. Humidity
DHT11, Temperature and Humidity Sensor, features a temperature and humidity sensor complex with
a calibrated digital signal output. By using the exclusive digital signal acquisition technique and temperature and
humidity sensing technology, it ensures high reliability and excellent long-term stability. This sensor includes a
resistive-type humidity measurement component and an NTC temperature measurement component and
connects to a high-performance 8-bit microcontroller offering excellent quality, fast response, anti-interference
ability and cost-effectiveness.
Although, DHT11 provides, both, temperature and humidity values, we use only the latter part. Single-
bus data format is used for communication and synchronization between Arduino and DHT11 sensor [18]. As
shown in Fig. 12, digital output of DHT11 is connected to pin 2 of Arduino and requires a pull-up resistor of 5
kΩ. DHT11 measures humidity between 20-90% RH. Humidity consumes 5 characters in the transmitted string.
For e.g., humidity in a factory is 38.59 %.
E. Light Intensity
LDR is used to measure light intensity. The circuit diagram is shown in the Fig. 15. As the resistance of
LDR varies with light, the voltage available at the analog input A0 of Arduino changes. The digital output [14]
has values from 0 to 1023. These values are mapped [13] between 0 and 9 in Arduino.
Fig. 15. LDR Connection Diagram to measure Light Intensity
When light falls on the LDR [2], its resistance decreases and analog input to A0 increases resulting in
higher values of light intensity between 0 and 9. Similarly, when no light falls on the LDR, its resistance
increases and analog input to A0 decreases giving lower values of light intensity. Light Intensity consumes only
1 character in the string as it has values between 0 and 9.
F. Production Status
The production status of 3 stages in supervised by the system. For the same, 3 sensors can be installed
at the end of each stage. To demonstrate the working of production section, 3 button switches as used as

A Smart Manufacturing Execution System
DOI: 10.9790/1676-10331428 www.iosrjournals.org 24 | Page
Assembly Line Sensors as shown in Fig. 12. These 3 switches which represent 3 stages of the assembly line are
connected to pins 5, 6 and 7 of Arduino respectively (Refer Fig. 12).
An active low signal is given to Arduino pins when the switch is pressed. Pressing a switch is
equivalent to product passing from one stage to another stage in an assembly line. This active low signal is
detected [15] by Arduino to send 1 when the switch is pressed and send 0 when switch is not pressed. 3
characters are used, one for each stage, whose value will be either 0 or 1 depending upon the condition of the
switch. Thus, production status consumes 3 characters in the transmitted string.
In practice, a pair of light source and photodiode [2] can be used at the end of each stage of assembly
line to detect the movement of products as shown in Fig. 16. When no product passes through a stage of
assembly line, the light emitted by light source will continuously fall on photodiode. The presence of product
will obstruct the light beam falling on photodiode that can be detected by properly interfacing photodiode with
Arduino.
Fig. 16. Use of Photodiodes to detect a product passing through a stage of assembly line
Thus, each time a product obstructs the light beam, the count of products passing through a stage will
be incremented by 1 and displayed in the android application of NIRMAN FIS.
V. REMOTE MONITORING By using NIRMAN FIS Web Portal or NIRMAN FIS Companion, it is possible to monitor and control
all factory operations remotely. When a manager wants to have a manual control over factory operations while
he is not physically present in the factory, he can use Remote Monitoring methods. The user has to authenticate
his account while using any of these methods. Using internet connectivity, he, can send commands to android
application which is connected to NIRMAN FIS using bluetooth.
Table I: Commands Used In Remote Monitoring
Command Function
141 Turn ON Buzzer in the factory
142 Turn OFF Buzzer in the factory
143 Turn ON Power Supply of the factory
144 Turn OFF Power Supply of the factory
The android application on reception of commands will instruct Arduino to take appropriate action.
These commands can be configured based on user requirements. The option of Web Socket Monitoring in the
android application must be turned ON to use remote monitoring methods. The 4 basic commands used in the
prototype are given in Table I.
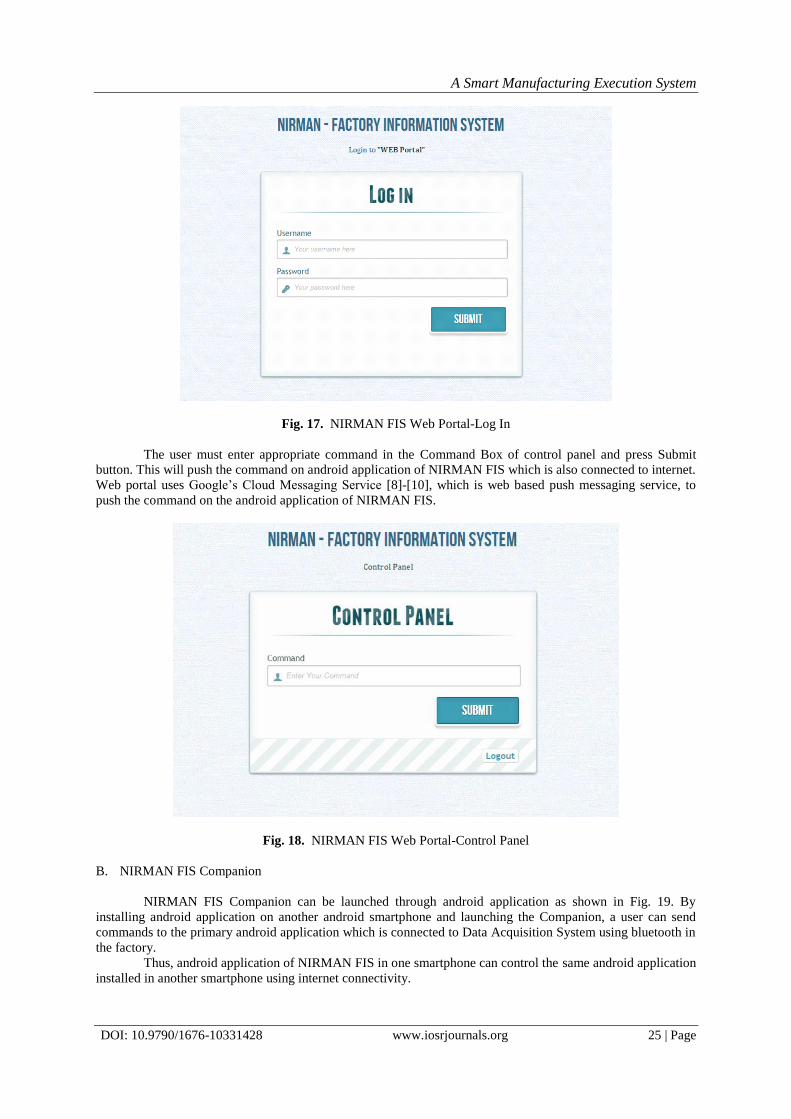
A. NIRMAN FIS Web Portal
NIRMAN FIS Web Portal is a website connected to android application of NIRMAN FIS. After user
authentication on Login Screen, control panel is displayed as shown in Fig. 17 and Fig. 18.
A Smart Manufacturing Execution System
DOI: 10.9790/1676-10331428 www.iosrjournals.org 25 | Page
Fig. 17. NIRMAN FIS Web Portal-Log In
The user must enter appropriate command in the Command Box of control panel and press Submit
button. This will push the command on android application of NIRMAN FIS which is also connected to internet.
Web portal uses Google’s Cloud Messaging Service [8]-[10], which is web based push messaging service, to
push the command on the android application of NIRMAN FIS.
Fig. 18. NIRMAN FIS Web Portal-Control Panel
B. NIRMAN FIS Companion
NIRMAN FIS Companion can be launched through android application as shown in Fig. 19. By
installing android application on another android smartphone and launching the Companion, a user can send
commands to the primary android application which is connected to Data Acquisition System using bluetooth in
the factory.
Thus, android application of NIRMAN FIS in one smartphone can control the same android application
installed in another smartphone using internet connectivity.

A Smart Manufacturing Execution System
DOI: 10.9790/1676-10331428 www.iosrjournals.org 26 | Page
Fig. 19. NIRMAN FIS Companion
VI. ADDITIONAL FEATURES Android Application of NIRMAN FIS incorporates many other features like SMS Notifications, Voice
Recognition, Adding a user account, etc.
A. Configure Device Address
NIRMAN FIS Android application is connected with hardware using Bluetooth module. In order to
establish a connection, Media Access Control (MAC) address of the bluetooth device needs to be configured by
the application. The MAC address of the targeted device after encrypting in a QR code will be scanned by the
application to establish a connection.
Using this feature, an old bluetooth device can be easily replaced with new one without any major
alterations in the existing system. Configure Device Address is available on the login screen of android
application as shown in Fig. 19.
B. Adding a User Account
The administrator or manager of the factory can add a user account for his subordinate in the android
application as shown in Fig. 20.
Fig. 20. Adding a User Account and Voice Recognition in Android Application of NIRMAN FIS.
A Smart Manufacturing Execution System
DOI: 10.9790/1676-10331428 www.iosrjournals.org 27 | Page
C. Voice Recognition
Voice recognition allows the user to control application using simple voice commands. For example, if
manager says, Open Production, the application will receive the voice command and open production section of
the NIRMAN FIS. Voice recognition enables hands-free operation of the application. However, it requires
internet connection to be enabled on the smartphone.
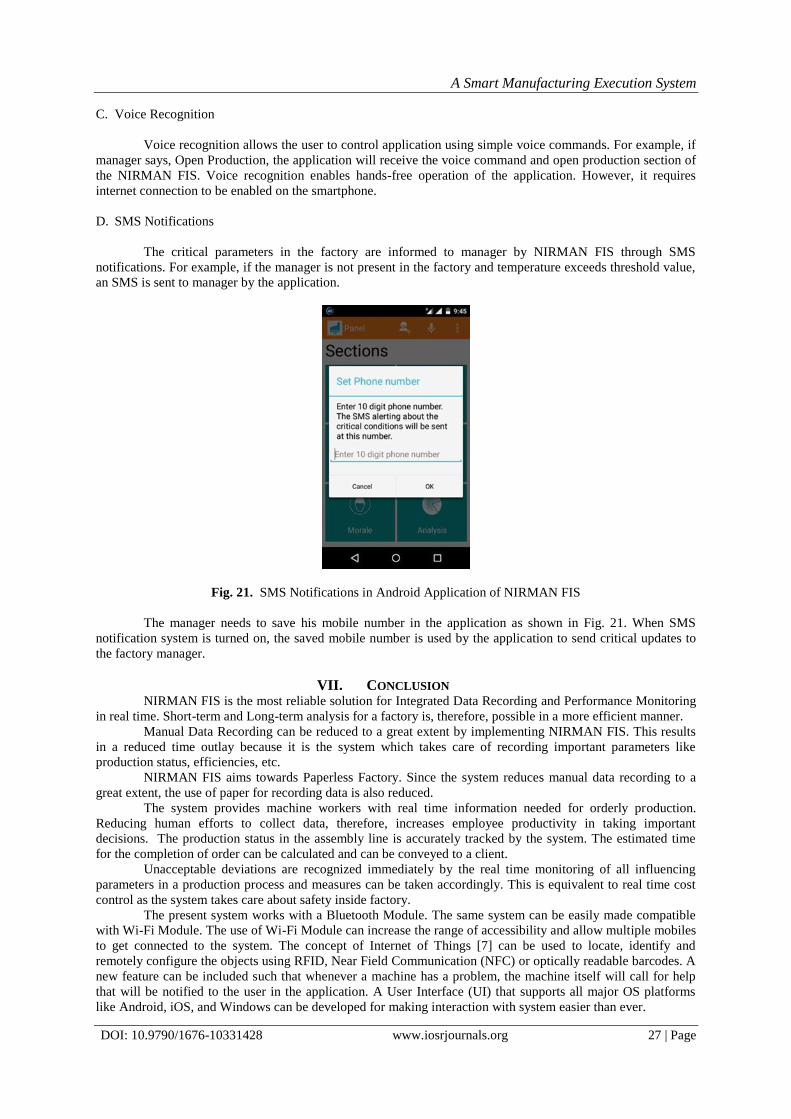
D. SMS Notifications
The critical parameters in the factory are informed to manager by NIRMAN FIS through SMS
notifications. For example, if the manager is not present in the factory and temperature exceeds threshold value,
an SMS is sent to manager by the application.
Fig. 21. SMS Notifications in Android Application of NIRMAN FIS
The manager needs to save his mobile number in the application as shown in Fig. 21. When SMS
notification system is turned on, the saved mobile number is used by the application to send critical updates to
the factory manager.
VII. CONCLUSION NIRMAN FIS is the most reliable solution for Integrated Data Recording and Performance Monitoring
in real time. Short-term and Long-term analysis for a factory is, therefore, possible in a more efficient manner.
Manual Data Recording can be reduced to a great extent by implementing NIRMAN FIS. This results
in a reduced time outlay because it is the system which takes care of recording important parameters like
production status, efficiencies, etc.
NIRMAN FIS aims towards Paperless Factory. Since the system reduces manual data recording to a
great extent, the use of paper for recording data is also reduced.
The system provides machine workers with real time information needed for orderly production.
Reducing human efforts to collect data, therefore, increases employee productivity in taking important
decisions. The production status in the assembly line is accurately tracked by the system. The estimated time
for the completion of order can be calculated and can be conveyed to a client.
Unacceptable deviations are recognized immediately by the real time monitoring of all influencing
parameters in a production process and measures can be taken accordingly. This is equivalent to real time cost
control as the system takes care about safety inside factory.
The present system works with a Bluetooth Module. The same system can be easily made compatible
with Wi-Fi Module. The use of Wi-Fi Module can increase the range of accessibility and allow multiple mobiles
to get connected to the system. The concept of Internet of Things [7] can be used to locate, identify and
remotely configure the objects using RFID, Near Field Communication (NFC) or optically readable barcodes. A
new feature can be included such that whenever a machine has a problem, the machine itself will call for help
that will be notified to the user in the application. A User Interface (UI) that supports all major OS platforms
like Android, iOS, and Windows can be developed for making interaction with system easier than ever.

A Smart Manufacturing Execution System
DOI: 10.9790/1676-10331428 www.iosrjournals.org 28 | Page
REFERENCES [1] Robert L. Boylestad, and Louis Nashelsky, “DC Biasing-BJTs,” in Electronic Devices and Circuit Theory, 10th ed. New Delhi, India:
Dorling Kindersley (India) Pvt. Ltd., 2013, pp. 220–222.
[2] Robert L. Boylestad, and Louis Nashelsky, “Other Two-Terminal Devices,” in Electronic Devices and Circuit Theory, 10th ed. New
Delhi, India: Dorling Kindersley (India) Pvt. Ltd., 2013, pp. 814-817. [3] Heiko Meyer, Franz Fuchs, and Klaus Thiel, “Factory of the Future,” in Manufacturing Execution Systems, New York: McGraw-Hill,
2009, pp. 5-30.
[4] Seung Woo Lee, So Jeong Nam, and Jai-Kyung Lee “A Real-time 4M Collecting Method for Production Information System,” World Academy of Science, Engineering and Technology, vol. 64, Apr. 2012.
[5] BMP180 Digital Pressure Sensor, Bosch Sensortec, Reutlingen, Germany, 2013.
[6] I2C-bus Specification and User Manual, NXP Semiconductors, Eindhoven, Netherlands, 2014. [7] SMARTER WAYS TO USE THE INTERNET OF THINGS, Wind River Systems Inc., Alameda, CA, USA, 2014.
[8] Configuring Google Cloud Messaging Service for Android Devices, Novell Inc., Provo, UT, USA, 2014.
[9] How To Develop Smart Android Notifications using Google Cloud Messaging Service, Software Engineering Competence Center (SECC), Giza, Egypt, 2013.
[10] Implementing GCM client on Android | Android Developers. [Online]. Available:
https://developer.android.com/google/gcm/client.html. [11] Arduino - ArduinoBoardUno. [Online]. Available: http://www.arduino.cc/en/Main/ArduinoBoardUno
[12] Serial.print - Arduino. [Online]. Available: http://www.arduino.cc/en/Serial/Print
[13] Arduino - Map. [Online]. Available: http://www.arduino.cc/en/Reference/Map [14] Arduino - AnalogRead. [Online]. Available: http://www.arduino.cc/en/Reference/AnalogRead
[15] Arduino - DigitalRead. [Online]. Available: http://www.arduino.cc/en/Reference/DigitalRead
[16] Arduino - DigitalWrite. [Online]. Available: http://www.arduino.cc/en/Reference/DigitalWrite [17] Arduino Playground - MQGasSensors. [Online]. Available: http://playground.arduino.cc/Main/MQGasSensors
[18] DHT11 library - Arduino Playground. [Online]. Available: http://playground.arduino.cc/main/DHT11Lib
[19] SFE_BMP180 Library. [Online]. Available: https://github.com/sparkfun/BMP180_Breakout/archive/master.zip [20] HC-05 - ITEAD Studio. [Online]. Available: ftp://imall.iteadstudio.com/Modules/IM120723009/DS_IM120723009.pdf
[21] Bluetooth | Android Developers. [Online]. Available: http://developer.android.com/guide/topics/connectivity/bluetooth.html