A SINGLE CELL PAIR MECHANICAL INTERROGATION PLATFORM …
111
University of Nebraska - Lincoln University of Nebraska - Lincoln DigitalCommons@University of Nebraska - Lincoln DigitalCommons@University of Nebraska - Lincoln Mechanical (and Materials) Engineering -- Dissertations, Theses, and Student Research Mechanical & Materials Engineering, Department of Summer 8-10-2021 A SINGLE CELL PAIR MECHANICAL INTERROGATION PLATFORM A SINGLE CELL PAIR MECHANICAL INTERROGATION PLATFORM TO STUDY CELL-CELL ADHESION MECHANICS TO STUDY CELL-CELL ADHESION MECHANICS Amir Monemianesfahani University of Nebraska- Lincoln, [email protected] Follow this and additional works at: https://digitalcommons.unl.edu/mechengdiss Part of the Biological Engineering Commons, Biomaterials Commons, Biomechanics and Biotransport Commons, Mechanical Engineering Commons, and the Molecular, Cellular, and Tissue Engineering Commons Monemianesfahani, Amir, "A SINGLE CELL PAIR MECHANICAL INTERROGATION PLATFORM TO STUDY CELL-CELL ADHESION MECHANICS" (2021). Mechanical (and Materials) Engineering -- Dissertations, Theses, and Student Research. 178. https://digitalcommons.unl.edu/mechengdiss/178 This Article is brought to you for free and open access by the Mechanical & Materials Engineering, Department of at DigitalCommons@University of Nebraska - Lincoln. It has been accepted for inclusion in Mechanical (and Materials) Engineering -- Dissertations, Theses, and Student Research by an authorized administrator of DigitalCommons@University of Nebraska - Lincoln.
Transcript of A SINGLE CELL PAIR MECHANICAL INTERROGATION PLATFORM …

University of Nebraska - Lincoln University of Nebraska - Lincoln
DigitalCommons@University of Nebraska - Lincoln DigitalCommons@University of Nebraska - Lincoln
Mechanical (and Materials) Engineering -- Dissertations, Theses, and Student Research
Mechanical & Materials Engineering, Department of
Summer 8-10-2021
A SINGLE CELL PAIR MECHANICAL INTERROGATION PLATFORM A SINGLE CELL PAIR MECHANICAL INTERROGATION PLATFORM
TO STUDY CELL-CELL ADHESION MECHANICS TO STUDY CELL-CELL ADHESION MECHANICS
Amir Monemianesfahani University of Nebraska- Lincoln, [email protected]
Follow this and additional works at: https://digitalcommons.unl.edu/mechengdiss
Part of the Biological Engineering Commons, Biomaterials Commons, Biomechanics and Biotransport
Commons, Mechanical Engineering Commons, and the Molecular, Cellular, and Tissue Engineering
Commons
Monemianesfahani, Amir, "A SINGLE CELL PAIR MECHANICAL INTERROGATION PLATFORM TO STUDY CELL-CELL ADHESION MECHANICS" (2021). Mechanical (and Materials) Engineering -- Dissertations, Theses, and Student Research. 178. https://digitalcommons.unl.edu/mechengdiss/178
This Article is brought to you for free and open access by the Mechanical & Materials Engineering, Department of at DigitalCommons@University of Nebraska - Lincoln. It has been accepted for inclusion in Mechanical (and Materials) Engineering -- Dissertations, Theses, and Student Research by an authorized administrator of DigitalCommons@University of Nebraska - Lincoln.
A SINGLE CELL PAIR MECHANICAL INTERROGATION PLATFORM TO
STUDY CELL-CELL ADHESION MECHANICS
by
Amir Monemian Esfahani
A DISSERTATION
Presented to the Faculty of
The Graduate College at the University of Nebraska
In Partial Fulfillment of Requirements
For the Degree of Doctor of Philosophy
Major: Engineering
(Biomedical Engineering)
Under the Supervision of Professor Ruiguo Yang
Lincoln, Nebraska
April 2021

ii
A SINGLE CELL PAIR MECHANICAL INTERROGATION PLATFORM TO
STUDY CELL-CELL ADHESION MECHANICS
Amir Monemian Esfahani, Ph.D.
University of Nebraska, 2021
Advisor: Ruiguo Yang
Cell-cell adhesion complexes are macromolecular adhesive organelles that integrate
cells into tissues. Perturbations of the cell-cell adhesion structure or related
mechanotransduction pathways lead to pathological conditions such as skin and heart
diseases, arthritis, and cancer. Mechanical stretching has been used to stimulate the
mechanotransduction process originating from the cell-cell adhesion and cell-extracellular
matrix (ECM) complexes. The current techniques, however, have limitations on their
ability to measure the cell-cell adhesion force directly and quantitatively. These methods
use a monolayer of cells, which makes it impossible to quantify the forces within a single
cell-cell adhesion complex. Other methods using single cells or cell pairs rely on cell-ECM
adhesion to find the cell-cell adhesion forces and consequently, they indirectly measure the
junctional forces.
In the current study, we designed and developed a single cell-cell adhesion
interrogation and stimulation platform based on nanofabricated polymeric structures. The
platform employs microstructures fabricated from biocompatible materials using two

iii
photon polymerization (TPP), a process that enables direct 3D structure writing with
nanometer precision. The microdevice allows a pair of epithelial cells to form a mature cell
junction. The single matured cell junction is stretched with controlled strain until cell-cell
junction ruptures while the forces within the cell-junction-cell system are recorded. Using
this platform, we have conducted mechanical characterization of a single cell junction with
strain-stress analysis. The strain dependency of the junction has been investigated through
the stretch test with four different strain rates. The results showed that the junction behaves
in a strain-rate dependent manner, where high strain-rates lead to decreased viscosity
property, a characteristic for a shear-thinning viscoelastic material. This also confirms our
hypothesis that strain-rate plays an important role in the cell mechanical behavior,
particularly the cytoskeleton dominant cell mechanics. The maturation of this technology
can pave the way for the in situ investigation of mechano-chemical signaling pathways
mediated by cell-cell junctions and potentially reveal novel disease mechanisms in which
defects in cell-cell adhesion play a significant role in the disease pathology.

iv
Acknowledgments
I would like to thank Dr. Yang who trusted in me and for his inexhaustible support
and help during my research. His advice was always helpful and pushed me forward. All
of the awards I got couldn’t be achieved without his support. I would thank the committee
members Dr. Tamayol, Dr. Lim, and Dr. Lei for their insightful comments during my Ph.D.
candidacy exam. And also, I thank Dr. Lavrik from ORNL who helped us in fabricating
the microstructures.
I would thank Dr. Karla Perez who trained me in most of the biology aspects of my
research. I would thank my lab mates Bahareh Tajvidi Safa, Jordan Rosenbohm, and
Grayson Minnick for their help in the completion of my research.
I would like to express my sincerest gratitude to my wife, Leila, and my children,
Baran and Benita, for their patient and supports.

v
Table of Contents
CHAPTER 1 ....................................................................................................................... 1
INTRODUCTION TO CELL-CELL ADHESION BIOPHYSICS .................................... 1
1.1. Introduction .................................................................................................................. 1
1.2. Cell-cell adhesion......................................................................................................... 3
1.2.1. Cell-cell adhesion junctions ...................................................................................... 3
1.2.2 Biophysics of cadherin-based AJ and desmosome cell-cell adhesions ..................... 5
1.2.3. Diseases related to AJs and desmosomes ................................................................. 6
1.3. Mechano-sensation of cell-cell stretching ................................................................... 7
1.3.1. Strengthening of the junction .................................................................................... 8
1.3.2. Stress dissipation within the cell layer ...................................................................... 9
1.3.3. Crosstalk between cell-cell and cell-ECM adhesion under mechanical stretch ..... 11
1.4. Mechanical stretching as a candidate for a therapeutic option .................................. 13
1.4.1. Wound healing ........................................................................................................ 13
1.4.2. Tissue regeneration ................................................................................................. 14
1.4.3. Stem cell differentiation under mechanical stretching ............................................ 15
1.5. Conclusion ................................................................................................................. 16
CHAPTER 2 ..................................................................................................................... 18
CURRENT TECHNIQUES TO STUDY CELLULAR FORCES AND THEIR
MECHANICS ................................................................................................................... 18
2.1. Monolayer based stretching ....................................................................................... 19
2.2. Cell-substrate and cell-cell interaction measurement ................................................ 23
2.3. Individual cells or cell pairs forces measurements .................................................... 26
2.3.1. Micropipette Aspiration .......................................................................................... 26
2.3.2. Optical Traps and Stretchers ................................................................................... 27
2.3.3. Magnetic Beads ....................................................................................................... 28
2.3.4. Atomic Force Microscopy (AFM) .......................................................................... 29
2.4. MEMS devices ........................................................................................................... 31
2.4.1. Cantilever beam deflection ..................................................................................... 31

vi
2.4.2. Moveable platforms ................................................................................................ 32
2.4.3. 3D Nanofabrication ................................................................................................. 34
2.5. Conclusion ................................................................................................................. 34
CHAPTER 3 ..................................................................................................................... 36
SCAµTT, A SINGLE CELL ADHESION INTERFACE MECHANICAL
CHARACTERIZATION PLATFORM ............................................................................ 36
3.1. Proposed design for single cell-cell adhesion interrogation ...................................... 36
3.2. Device fabrication and calibration ............................................................................. 41
3.3. Cell deposition procedure .......................................................................................... 48
3.4. Cell-cell adhesion junction formation ........................................................................ 50
CHAPTER 4 ..................................................................................................................... 55
DISPLACEMENT-CONTROLLED MECHANICAL CHARACTERIZATION OF THE
CELL-CELL JUNCTION ................................................................................................. 55
4.1. Cell-cell junction stretch test ..................................................................................... 55
4.2. A mechanosensing constitutive model for the viscoelastic behavior of a cell pair ... 66
4.3. Cadherins strengthening and rupture under rate-dependent stretch of cell-cell junction
........................................................................................................................................... 75
4.4. Discussion .................................................................................................................. 81
4.5. Conclusion ................................................................................................................. 85
CHAPTER 5 ..................................................................................................................... 86
ONGOING PROJECTS .................................................................................................... 86
5.1. Stretch and hold analysis of a single cell pair ............................................................ 86
5.2. Characterization of IP-Visio microfibers ................................................................... 87
5.3. PV screening of a single cell pair .............................................................................. 88
5.4. Desmoplakin mutation of the cell-cell junction ......................................................... 89
5.5. Traction force microscopy of the cell pair during the stretch test ............................. 90
5.6. Application of FRET sensors to study the mechanotransduction pathway ............... 91
References ......................................................................................................................... 92

vii
List of figures
Figure 1.1. The molecular complex of the adherens junction (AJ) and desmosome. 5
Figure 1.2. Strengthening the adhesion bonds occurs when cells are subjected to
an external force. 8
Figure 1.3. Cells can dissipate the force at the cell junction in three ways. 10
Figure 1.4. Crosstalk of cell-cell adhesion and cell-ECM adhesion
mechanotransduction. 13
Figure 2.1. Mechanical stretching of a monolayer of cells. 21
Figure 2.2. Fluid shear applied to the cell layer to study cell mechanics. 23
Figure 2.3. Cell-ECM adhesion forces measurement. 25
Figure 2.4. Individual cell and cell pair adhesion force measurement. 31
Figure 2.5. MEMS-based cellular force measurements 34
Figure 3.1. Detailed illustration of the entire SCAµTT platform. 37
Figure 3.2. Design, simulation, and fabrication of the first generation of the single
cell pair stretcher (horizontal). 39
Figure 3.3. Design, simulation, and fabrication of the second generation of the
single cell pair stretcher (vertical). 41
Figure 3.4. A single cell-cell adhesion interface mechanical characterization
platform. 46
Figure 3.5. Elastic deformation of the structure. 48
Figure 3.6. Cell deposition procedure. 49
Figure 3.7. Cell-cell adhesion junction formation and cell growth on the scaffolds. 50
Figure 3.8. Formation of a mature cell-cell adhesion junction. 52
Figure 3.9. Cell-ECM junction formation. 53
Figure 3.10. Time-lapse images of the cell-cell adhesion formation. 54
Figure 4.1. Cell-cell junction dimension quantification and analysis. 58
Figure 4.2. Initial length calculation. 59
Figure 4.3. Stress-strain curve calculation from the capture video frame of
mechanical testing. 61

viii
Figure 4.4. Representative image frames and the corresponding stress-strain
curves for stretch tests performed at strain rates of 0.005 s-1. 64
Figure 4.5. Representative image frames and the corresponding stress-strain
curves for stretch tests performed at strain rates of 0.05 s-1. 64
Figure 4.6. Representative image frames and the corresponding stress-strain
curves for stretch tests performed at strain rates of 0.25 s-1. 65
Figure 4.7. Representative image frames and the corresponding stress-strain
curves for stretch tests performed at strain rates of 0.50 s-1. 65
Figure 4.8. A representative time-lapse series of frames show the cell junction
ruptured symmetrically under an increasing strain. 66
Figure 4.9. Fitting the stress-strain curves with the Standard Linear Solid (SLS)
model. 67
Figure 4.10. Strain rate-dependent and actomyosin contractility-controlled
viscoelastic behavior of the cell pair. 71
Figure 4.11. Series of frames for CN01, control, and bleb under 0.005 s-1 strain
rate stretch test. 73
Figure 4.12. The effect of cytoskeleton dynamic on the stretch test. 74
Figure 4-13. Reversal of the stress modulation effect of a RhoA activator by
ROCK inhibitor. 75
Figure 4.14. Cadherin bond rupture exhibits rate-dependent behavior during
strain-rate controlled stretch. 77
Figure 4.15. E-cadherin clustering in cell-cell junction under applied strain. 78
Figure 4.16. The role of E-cad on the cell stretch test. 80
Figure 4.17. Confirmation of E-cadherin siRNA silencing. 80
Figure 5.1. Active remodeling of the cytoskeleton. 87
Figure 5.2. Mechanical characterization of microfibers. 88
Figure 5.3. A representative curve from the stretch test of skin cells. 89
Figure 5.4. mutation and over expression of desmoplakin in A431 cells. 90
Figure 5.5. Traction force microscopy of the cell pair on the platform. 91

1
CHAPTER 1
INTRODUCTION TO CELL-CELL ADHESION BIOPHYSICS
Portions of this material have previously appeared in the following publication:
Amir Monemian Esfahani, Jordan Rosenbohm, Keerthana Reddy, Xiaowei Jin, Tasneem
Bouzid, Brandon Riehl, Eunju Kim, Jung Yul Lim, Ruiguo Yang, Tissue Engineering Part
C: Methods, (2019) 25 (11), 631-640. Used with permission.
1.1. Introduction
Tissues in the human body are formed by the physical linkage among individual
cells through cell-cell and cell-ECM connections. These physical structures provide
mechanical integrity by transmitting physical forces across cytoskeletal networks within
individual cells. In the same capacity, they also possess mechanosensory that can feel
physical forces and orchestrate a proper biochemical response of different types and
timescales. This process, transducing mechanical forces into biochemical signals, has been
known as mechanotransduction, a phenomenon that was discovered first in ion channels
and later expanded to include mechanochemical processes from many other cells and tissue
types (1). Exploration of mechanotransduction has uncovered many molecules with
mechanosensing capabilities at the cell-ECM and cell-cell connections, most noteworthy
of which are at the focal adhesion in cell-ECM connection sites and cadherin-based cell-
cell adhesion sites (2).
Studies in cellular level mechanotransduction use many physical methods to apply a
force or strain to cell adhesions, the only physical structures of a cell that can take

2
mechanical input as a stimulus. Mechanical stretching in a two-dimensional (2D) cell
culture model represents the most convenient way of applying this mechanical input (3),
among others such as fluid shear. Mechanical stretching normally employs a flexible
substrate where cells can grow and form a monolayer. An actuation mechanism induces an
in-plane deformation of the flexible substrate and thus causes a strain on the cell monolayer
as a whole and, at the molecular level, a strain on the mechanosensing molecules. Different
regimens of strains, including static, cyclic, uniaxial, and biaxial, have been proposed to
elicit a variety of biochemical responses (4). Through this simple mechanism, researchers
have witnessed a host of discoveries that provide an understanding of how cells in different
tissues connect and interact with one another in tissue morphogenesis (5), grow and
proliferate (6), and, most importantly, probe the microenvironment through
mechanosensing to direct their fate (7).
Linker molecules between cadherin molecules and the cytoskeleton at the cell-cell
contact, such as α-catenin, generally serve as the mechanosensing elements at cell-cell
adhesion sites (8), similarly to focal adhesion kinases (FAKs) at the cell-ECM adhesion
sites. They experience straining from external stimuli in the form of a conformational
change, which exposes binding sites for molecules in downstream pathways. This series of
events subsequently leads to the strengthening of the cell-cell adhesion or dissipation of
tissue-level stresses within cytoskeleton elements (9). These responses normally are
achieved by forming adhesion bond clusters, or by enhancing existing cell-cell adhesion
connections (10). Following mechanotransduction, cells will exhibit various physiological
behaviors, and the majority of cell stretching studies are aimed at cellular proliferation and
tissue regeneration.

3
In this chapter, we will provide a focused overview of the cell stretching practices
on different cells with an emphasis on the molecular pathways in mechanotransduction
which leads to cell proliferation, tissue regeneration, and wound healing. We will review
cell-cell adhesive junctions and the biophysical processes in their adaptation to external
strain. We will subsequently discuss different modes and regimes of cell stretching, which
is followed by an overview of mechanotransduction responses to these different types of
stretching. The effect of mechanical stretch on the crosstalk between the cell-cell and cell-
ECM adhesion complexes is also discussed, in addition to physiological effects that arise
from the responses, such as tissue regeneration and wound healing.
1.2. Cell-cell adhesion
1.2.1. Cell-cell adhesion junctions
There are four types of cellular junctions at the cell-cell contact: tight junctions,
gap junctions, adherens junctions (AJs), and desmosomes. Tight junctions seal the
paracellular space, limiting the passage of molecules and ions through intercellular spaces
of the adjacent cells and preventing the movement of membrane proteins between the upper
and lower portions of the cell. Therefore, the apical and basolateral parts of the cell
membrane with different functions can be preserved (11). Gap junctions function as pores
between adherent cells, allowing small molecules, ions, and electrical current to pass
directly between cells (12). This facilitates the passage of potential through a tissue. For
example, moving action potential in heart muscles flows across cells, causing the heart to
pulse rhythmically (13).
AJs and desmosomes, on the other hand, have a key role in maintaining tissue
mechanical integrity. AJs are composed of classical cadherins at the extracellular domain

4
as adhesion molecules, and armadillo family proteins at the intracellular region as linker
molecules (14). At the extracellular domain, E-cadherin molecules from neighboring cells
form catch bonds, resisting tension, and maintaining tissue integrity. E-cadherin continues
through the cell membrane to the cytoplasmic domain. At this point, E-cadherin is linked
to linker molecules, p120- and β-catenin, which are further connected to actin filaments
(AFs) through another linker molecule, α-catenin (Figure 1.1A). It has been shown that
both E-cadherin and α-catenin at AJs serve as mechanosensors in different types of cells in
the skin and cardiovascular tissues (15). Desmosomes are cadherin-based adhesive
junctions and have a molecular organization similar to AJs (16). Desmosomes are
composed of desmosomal cadherin, desmogleins (Dsg), and desmocollins (Dsc), as well
as linker proteins from the armadillo family and the plakin family of cytolinkers (17). The
cytoplasmic tails of the cadherins connect to the intermediate filament (IF) network
through the linker molecules (Figure 1.1B). Molecules in the desmosome junction have
yet to be revealed as mechanosensors, although some studies have suggested that
plakophilin serves as binding scaffolds for RhoA, which potentially regulates cell
contractility (18).

5
Figure 1.1. The molecular complex of the adherens junction (AJ) and desmosome. A) AJ complex
includes a chain of E-Cadherin (E-Cad) at the extracellular domain and α- and β-catenin (α-cat, β-cat) and
P120 at the intracellular domain. β-catenin links the cadherin to F-actin through α-catenin. B) Desmosome is
a combination of three protein families. Desmocollin (Dsc) and desmoglein (Dsg) are the molecules at the
extracellular domain. Plakophilin (PKP) and Plakoglobin (PG) are connected to desmoglein and desmocollin,
respectively. These two molecules are then connected to intermediate filament through desmoplakin (DP)
(19).
1.2.2 Biophysics of cadherin-based AJ and desmosome cell-cell adhesions
Cells adhere to their neighboring cells physically through cellular junctions with
cadherin adhesion molecules, transmembrane molecules that have a key role in cell-cell
adhesion. They function as a cell-cell adhesion regulator and mechanotransducer during
tissue morphogenesis. Cadherin regulates cell-cell adhesion with three mechanisms: 1)
varying the interfacial tension between cell surfaces through adhesion tension, 2) providing
catch bonds that strengthen when pulled, and 3) initiating mechanosensing to regulate the
cytoskeletal network (20). Adhesion tension, like surface tension in liquids, gives rise to

6
the circular shape of cells; at the cell-cell contact, cadherin causes a reduction in adhesion
tension and, as a result, increases the surface contact area (21). In addition to reducing
adhesion tension to decrease the interfacial tension between cells, cadherin signaling also
helps increase the cell contact area, which is achieved by reorganizing the actomyosin
cytoskeleton in the contact area (21).
Studies show that contractile actomyosin exerts pulling forces on the cadherin bonds,
which resist the pulling by forming catch bonds to prevent bond rupture (22). Forces are
subsequently transmitted through cadherin bonds to the entire cytoskeletal network. The
anchor points of cadherin to the cytoskeleton are mediated by α- and β- catenin, and if
forces increase, vinculin, and other molecules are recruited to this complex in parallel (23,
24). Researchers determined that the weakest component resides in the cytoplasmic domain
rather than the extracellular domain (25-27).
1.2.3. Diseases related to AJs and desmosomes
In normal tissues, cells tightly attach and maintain tissue integrity. In the diseased
state, on the other hand, tissues frequently have cells with detachment or abnormal integrity
in cell-cell adhesion. In atherosclerosis, when plaque builds up inside blood vessels, the
reduction of cell adhesion strength results in the detachment of the plaque, which can lead
to a stroke or heart attack (28). In malignant tumors, a significant decrease in cell-cell
adhesion is often exhibited (29, 30). Immunostainings of various tumor types with
antibodies targeting specific proteins in the AJs have shown a correlation between the
changes in the proteins’ expressions and pathological conditions (31). In breast cancer, for
instance, cadherin expressions are often downregulated and the overall loss of
heterozygosity of cadherin is common (31). Loss-of-function mutations in α- and β-catenin

7
proteins have also been reported in cell lines derived from human epithelial tumors (32).
However, the prevalence of these mutations in primary tumors remains to be fully
understood.
Desmosomes have the primary role in resisting external strain. They are prominent
in the epidermis and heart, tissues often subjected to considerable mechanical stresses in
the human body. Mutations in, or autoantibodies directed at, desmosomal proteins lead to
compromised cardiac or cutaneous function, and sometimes both. An autoimmune attack
on Dsg causes pemphigus and staphylococcus (33). The ablation of the plakoglobin gene
results in mouse embryonic lethality owing to the mechanical fragility of the myocardium
(34). Desmoplakin mutations can cause an array of diseases in the heart and skin with
varying severity (35).
1.3. Mechano-sensation of cell-cell stretching
Mechanical stretching induces an external strain to a layer of cells in the 2D
substrate deformation scheme. At the tissue level, cells within the layer reorganize their
cytoskeleton structures to dissipate the additional stress. At the cellular level, contractile
forces generated from the actin filament network will be balanced at the cell-cell adhesion
sites with the external force from the stretch. Mechanosensory processes respond to
external stress by strengthening the cellular junctions via the recruitment of adhesion
molecules to the cell-cell contact (10).

8
Figure 1.2. Strengthening the adhesion bonds occurs when cells are subjected to an external
force. A) Catch bond formation of the cadherin bonds enables them to live longer and strengthen. B)
Recruitment of vinculin and other molecules to the junction complex parallel to α-catenin can reduce the
force on the junction. C) Clustering the adhesion bonds at the concentrated stress region can decrease the
amount of force on each cell (19).
1.3.1. Strengthening of the junction
Cells can strengthen cell-cell adhesion with different mechanisms. When subjected
to an external load, cadherin bonds can switch to long-lived, force-induced bonds with a
tighter contact (36), commonly referred to as catch bonds (Figure 1.2A) (22, 37, 38). Catch
bonds play important roles in cell migration and wound healing as they allow cells to grasp
each other strongly when pulled and to release in the absence of external stimuli (39).

9
Besides, mechanosensors at the AJ and the desmosome initiate a cascade of signaling
processes, which results in the strengthening of the linker molecules (40). For instance, α-
and β- catenin at the cytoplasmic tail of the junction can recruit vinculin to the complex
(41). As a result, the force is divided between the two chains, and the junction can
strengthen (Figure 1.2B) (42). Further, when mechanosensors at the junction detect stress
increase at a specific location, the signaling pathway leads to an increase in the number of
bonds (43), and therefore the average force within each bond drops (Figure 1.2C) (44-46).
In epithelia, E-cadherin is concentrated at regions of greatest tension within the AJ (47),
suggesting the presence of several mechanisms that couple the spreading of cadherins to
cortical actomyosin. These may include moving cadherins linked to the cytoskeleton
towards sites of higher contractile stress (48), clustering of cadherin by F-actin (49) and
myosin (50), and regulating cortical actin (51).
1.3.2. Stress dissipation within the cell layer
The molecular complex at the cell-cell junction behaves like a spring. The force
stretches the bond and can rupture it at the yield point. To mitigate the effect of applied
stress, cells can divide along the direction of the load (52), align their orientation along the
principle direction of the load (53), or reorganize the cytoskeleton (54) (Figure 1.3). When
cells are subjected to force, they can divide and proliferate in the direction of the applied
force to alleviate stress within each cell (Figure 1.3A).

10
Figure 1.3. Cells can dissipate the force at the cell junction in three ways. A) Oriented division of
cells in the direction of the principal stress which adds mass to this direction and increases the rest length. B)
Reorganization of cells through intercalation. C) Molecular remodeling of the cytoskeleton which decreases
the stress on the fibers (19).
Another mechanism is through cell intercalation, in which cells can exchange their
positions with neighbors so that the resting length increases and the force dissipates (52,
54-56) (Figure 1.3B). Rearranging the tissue in this manner leads to additional mass in the
direction of the load. Intercalation requires a combination of mechanisms, including
adhesive changes at the cell-cell and cell-ECM adhesion sites that allow cells to reposition,
cytoskeletal events through which cells exert the forces needed for cell neighbor exchange,

11
and cell polarity changes to regulate these processes (57). Moreover, the molecular
remodeling of the cytoskeleton inside the cell by the upregulation of filaments and cross-
linker molecules also dissipates the internal stress (58-62) (Figure 1.3C). Consequently,
the rest length increases, and the stress on the cytoskeleton decreases (63). Further, the
fluid-like behavior of the actin cytoskeleton allows extrinsic stresses to be dissipated by
the molecular turnover of cytoskeletal components (64), hence reducing the load on each
adhesion complex at the cell-cell junction (65).
1.3.3. Crosstalk between cell-cell and cell-ECM adhesion under mechanical stretch
It has been shown that modulation of cell-cell and cell-ECM adhesions are
coordinated during tissue morphogenesis. Increasing the number of cell-ECM adhesion
complexes leads to a decrease in the expression of cell-cell adhesion molecules, especially
E-cadherin, during mouse lung morphogenesis (66, 67). The adhesion of osteoblasts to
collagen in bone formation promotes cell-cell adhesion on the apical surface (68). The
formation of cell-ECM adhesions in cancer cells hinders the formation of cell-cell
adhesion, as was demonstrated by the negative feedback between the two adhesions when
cells were cultured on surfaces coated with both types of adhesion molecules (69). On the
other hand, cell-cell adhesion can locally disrupt the formation of cell-ECM adhesion. A
study on epithelial cells showed that cadherin formation prevents cell-ECM adhesion
formation, which arrests cell migration (70) and results in the disassembly of cell-ECM
adhesion in the contact region (71). On the contrary, the disruption of cell-cell adhesion
can promote the formation of cell-ECM adhesion complex to facilitate cell migration (72,
73).

12
Mechanical stretch affects mechanosensors at the cell-cell junctions in association
with mechanosensors at the focal adhesion sites. Integrins and cadherins are both connected
to actin filaments. Therefore, the same set of molecules are recruited in these junctions
when they are subjected to external forces. Interaction of integrin and cadherin causes an
upregulation in the expression of RhoA to reorganize the cytoskeleton in response to the
mechanical force (74). Actomyosin contractility is one of the major responses to
mechanical forces induced at AJs and focal adhesions. In fact, the role of AJs at the cell-
cell contact to communicate with cell-ECM adhesions has been well documented (75).
These signaling activities include the vinculin signaling facilitated by α-catenin, stress
sensing initiated by E-cadherin (76), and the transcriptional activities through β-catenin
nucleus translocation (77).
At the tissue level, these integrated networks of actin filaments form a strong
connection between neighboring cells and between cells and the ECM. These connections
lead to a global transmission of the mechanical force across the tissue when stretched to
facilitate collective migration and tissue homeostasis (75). Further, when an external force
is applied, since both adhesion types sense the force, a force balance between these
junctions is established to maintain tissue integrity. As a result, activating the FAK leads
to deactivating VE-cadherins (78). Conversely, weak cell attachment to the substrate results
in the aggregation of cells and an increase in cell-cell adhesion (78).

13
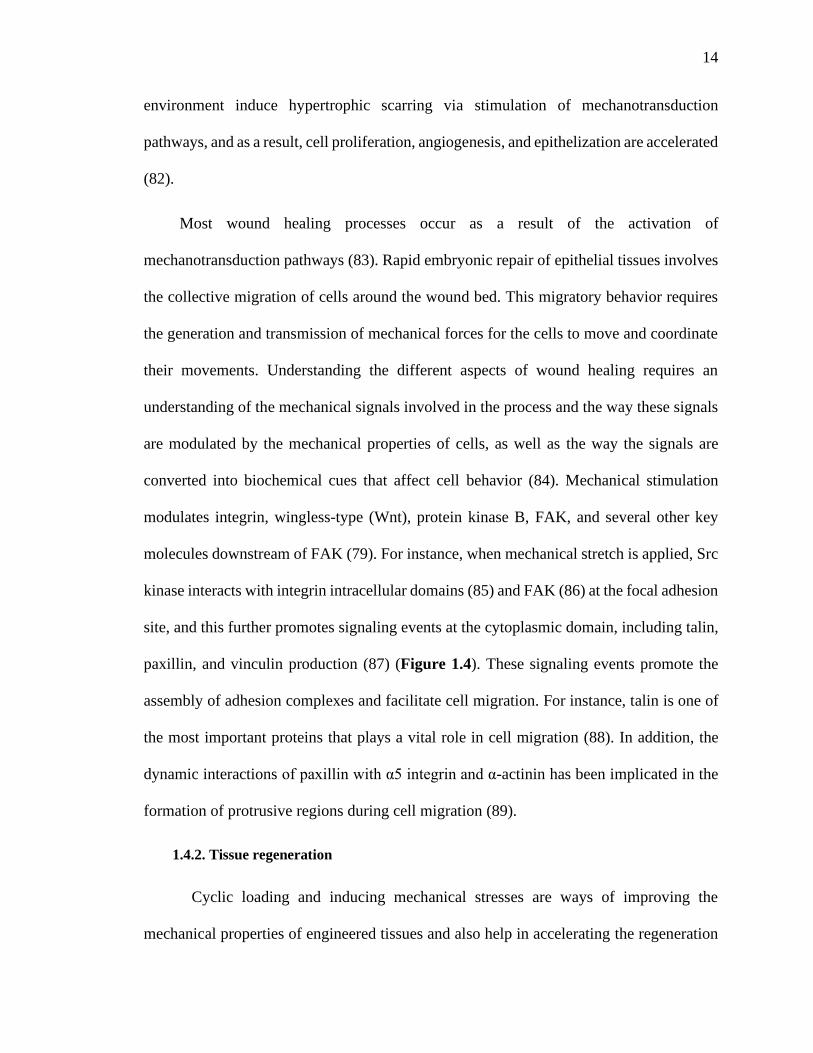
Figure 1.4. Crosstalk of cell-cell adhesion and cell-ECM adhesion mechanotransduction.
Cadherin junctions at cell-cell adhesion site have crosstalk with focal adhesion points. Vinculin can be
recruited either at AJ in parallel with α-catenin or at the focal adhesion junction in parallel with Paxillin (19).
1.4. Mechanical stretching as a candidate for a therapeutic option
The biophysical processes of strengthening cell-cell adhesion and reducing internal
tissue stress lead to a wide variety of physiological phenomena, which allows the scientific
community to contemplate whether mechanical stretching can become a suitable candidate
for therapeutic options. These efforts resulted in a range of studies correlating mechanical
stretch with wound healing and tissue regeneration.
1.4.1. Wound healing
It is widely accepted that mechanical forces are involved in both wound healing and
scar formation. Mechanically stretched engineered tissues in bioreactors may have
excellent organization, functionality, and strength compared with unstretched counterparts
(4). Fibroblasts have been extensively studied in biomechanical wound models, and
physical forces are known to influence the expression of ECM genes and inflammatory
genes involved in scar formation (79-81). Increased mechanical stresses in the wound
14
environment induce hypertrophic scarring via stimulation of mechanotransduction
pathways, and as a result, cell proliferation, angiogenesis, and epithelization are accelerated
(82).
Most wound healing processes occur as a result of the activation of
mechanotransduction pathways (83). Rapid embryonic repair of epithelial tissues involves
the collective migration of cells around the wound bed. This migratory behavior requires
the generation and transmission of mechanical forces for the cells to move and coordinate
their movements. Understanding the different aspects of wound healing requires an
understanding of the mechanical signals involved in the process and the way these signals
are modulated by the mechanical properties of cells, as well as the way the signals are
converted into biochemical cues that affect cell behavior (84). Mechanical stimulation
modulates integrin, wingless-type (Wnt), protein kinase B, FAK, and several other key
molecules downstream of FAK (79). For instance, when mechanical stretch is applied, Src
kinase interacts with integrin intracellular domains (85) and FAK (86) at the focal adhesion
site, and this further promotes signaling events at the cytoplasmic domain, including talin,
paxillin, and vinculin production (87) (Figure 1.4). These signaling events promote the
assembly of adhesion complexes and facilitate cell migration. For instance, talin is one of
the most important proteins that plays a vital role in cell migration (88). In addition, the
dynamic interactions of paxillin with α5 integrin and α-actinin has been implicated in the
formation of protrusive regions during cell migration (89).
1.4.2. Tissue regeneration
Cyclic loading and inducing mechanical stresses are ways of improving the
mechanical properties of engineered tissues and also help in accelerating the regeneration

15
of cells (90). It is necessary to understand biomechanical stimuli in cells as they may hold
the key to prepare tissues with adequate mechanical integrity for implantation purposes.
This has been demonstrated in muscle and cardiac tissues. It was shown that mechanical
strain affects the maturation of cardiac tissue, cell-cell interaction, and gap junctions (91).
Furthermore, in vivo-like forces were applied to human bio-artificial muscles (HBAMs) as
they differentiated. By applying a cyclic load, the HBAMs acquired improved tissue
elasticity and therefore an increased myofiber diameter when compared to unstretched
HBAMs (92). Moreover, cyclic mechanical stretching stimulates the proliferation of
cardiomyocytes within engineered early embryonic cardiac tissue and this increase is
blocked by p38MAPK inhibitor (93). Further, a bioreactor was used to investigate the
influence of mechanical stresses and strains on the properties of mature arteries (94). In the
study, cells were subjected to mechanical stress while they were cultured on a substrate,
and they adapted to surrounding functional demands while growing to obtain cohesive
regenerated tissues (94).
1.4.3. Stem cell differentiation under mechanical stretching
Recently, researchers have focused on applying mechanical stimulation to stem
cells in regenerative medicine. Several studies have reported the effects of mechanical
stretch on stem cell differentiation toward cardiovascular cell types since they are under
continual strain in nature (95). In one study, mechanical loading showed to improve
myocardium regeneration and reduced apoptosis during cardiomyocyte differentiation
(96). It was also demonstrated that mesenchymal stem cell commitment and differentiation
to ligament cells could be stimulated by mechanical stretch loading (97). A comprehensive
review of the effect of mechanical loads associated with F-actin on the differentiation of

16
stem cells revealed that the fate decision of stem cells was mostly governed by mechanical
and chemical cues correlated with microfilament proteins and intercellular adhesion
molecules (98). For instance, it was documented that cyclic mechanical stretching sped up
ECM-induced osteogenic differentiation along with promoting the overall expression (99).
Moreover, the RhoA/ROCK, cytoskeletal organization, and FAK were shown to regulate
mechanical stretch-induced realignment of hMSCs (100).
Mechanical stretch can further induce the migration of stem cells, such as bone
marrow-derived stem cells and MSCs, resulting in their production of expanded skin tissue
and skin regeneration (101). For instance, the application of cyclic loading on bone marrow
stromal cells promotes cell migration through the FAK-ERK1/2 pathway (102). In
addition, MSCs have been transplanted into animal models of skin tissue to investigate the
effect of mechanical loading on the migration of these cells to regenerate the skin (103).
Further, cyclic mechanical loading can be used to increase cardiomyocyte proliferation in
early embryonic cardiac tissue (93).
1.5. Conclusion
Mechanical stimuli have been extensively used to reveal different aspects of cells’
behavior. These mechanical forces can then be transduced into biochemical signals to
respond to external forces. At the molecular level, there are three different methods that
cells use to withstand the force and maintain tissue integrity. These include catch bond
formation, other protein recruitments, and cadherin bond clustering. In these situations, the
cell tries to reduce the force to each individual bond and avoid being ruptured. At the tissue
level, groups of cells respond to the force in terms of oriented cell division, cell
intercalation, and cytoskeleton reorganization. In these methods, the resting length

17
decreases to reduce the applied force to the whole tissue. Mechanical stimuli were also
used for wound healing, tissue regeneration, and stem cell differentiation. Recent studies
have been showing that these external forces can affect cell migration speed (in wound
healing) and proliferation (in tissue regeneration). Further, the application of forces to stem
cells makes them differentiate into muscle or cardiomyocyte cells which are subjected to
continuous force in nature.

18
CHAPTER 2
CURRENT TECHNIQUES TO STUDY CELLULAR FORCES AND THEIR
MECHANICS
Portions of this material have previously appeared in the following publication:
R. Yang, J. A. Broussard, K J. Green, and H D. Espinosa, Extreme Mechanics
Letters, Volume 20, 2018, 125-139.
A wide variety of techniques have been used to impose mechanical stimuli on living
cells. Most early studies were done on groups of cells, using techniques such as substrate
deformation, in which cells are cultured on a deformable substrate, and flow-induced shear,
in which fluid flowing over a culture of cells imposes shear stress on the cells. Most of the
cell mechanical properties are anisotropic due to the inherent heterogeneity of cells, so
studying cells in groups only gives average responses instead of uncovering the complex
response individual cells have. Technological advances allowed for the study of cells on
an individual level and many techniques were developed to do this. Some of these methods
include atomic force microscopy (AFM), optical traps/optical tweezers (OT), magnetic
beads, and micropipette aspiration. These techniques allow for the manipulation of single
cells and can, therefore, be used to uncover the anisotropic properties of cells. More
advanced methods of cell probing are commonly called micro-electromechanical systems
(MEMS). These devices generally include piezo-electric controlled actuators to impose
stresses on the cells, either by directly attaching to the cell or moving a structure that the
cell is attached to. Some examples of MEMS devices include uniaxial and biaxial pullers,
micropillars, and cantilever beams. These devices offer the highest force and displacement

19
resolutions. In this chapter, we will introduce the techniques used to study cell behavior
under external loads.
2.1. Monolayer based stretching
Interrogating cells in a monolayer is the most convenient way to study cell-cell
adhesion and the effect of mechanotransduction in healthy and diseased conditions. In these
methods, cells are seeded and grown on a flexible substrate which is then stretched through
the application of a load. These loads are transduced to biochemical signals through
different pathways depending on the nature of the load (104-106). Different cell types
behave in different ways to the same stimulation, which has yet to be fully studied (107).
Investigators have cultured various cell types on these flexible substrates, such as bone
cells (108), lung cells (109), and neurons (110), to study cell responses to the stretching
force, including cell proliferation, migration, differentiation, cytoskeleton rearrangement,
and other mechanotransduction responses.
Two common load types have been used to investigate cell-cell adhesion using
flexible substrates. The simplest is static loading, in which a fixed strain is applied to the
substrate and held. Viscoelastic properties of cells such as relaxation time can be
investigated with this load type. Conversely, dynamic loading is used to subject the
substrate to a time-varying strain. The effect of strain amplitude and frequency on tissue
behavior of melanocytes has been explored with this load shape (111). In-plane uniaxial
and biaxial stretching are commonly used as methods to apply a uniformly distributed force
to cells. To apply the load, the substrate is attached to a mechanism that stretches the
substrate upon actuation. Bone cells and embryonic osteoblasts were investigated using
this stretching method (112, 113) (Figure 2.1A and 2.1B). Uniaxial and biaxial stretching

20
methods are mainly used to study the effect of load on bone tissue (107, 114, 115). A
similar in-plane technique uses vacuum pressure to apply strain to the substrate of cultured
HEK293 cells (Figure 2.1C) and offers a uniform, equiaxial strain on cells (116). Four-
point bending (117, 118) is an out-of-plane technique for applying strain to the substrate
(Figure 2.1D). This method offers a low strain and uniform longitudinal and lateral stresses
on cells. The curved template method is another out-of-plane stretching technique in which
the substrate is pressed on a curved template which deforms the substrate out-of-plane
(Figure 2.1E). By controlling the shape of the curved template, a uniform strain can be
achieved (119).
The main advantage of the 2D substrate deformation methods compared to other
techniques such as fluid flow and 3D cell culture is that the amount of force can be precisely
adjusted. Determining the force in fluid flow-induced shear requires rigorous calculations
and the force in 3D culture is directed in three dimensions, making the exact amount of
force on cells difficult to be calculated. The stiffness of the substrate is a parameter that
plays an important role in the resolution of the applied load. Substrate stiffness is controlled
by changing the substrate’s thickness or chemical composition. By altering the substrate
stiffness, researchers can get different force resolutions, allowing for even more control of
the force. However, obtaining a fine resolution through control of substrate stiffness is still
an issue. Another advantage of 2D substrate deformation methods is the variety of load
conditions that can be applied to the substrate. When compared to fluidic flow and 3D
stretching, more options for load applications are available for substrate deformation.
Aside from these advantages, the 2D stretching method has some limitations. Since
the load is applied to a cell monolayer, it is almost impossible to directly and quantitatively

21
measure the adhesion forces at either the cell-cell or cell-ECM adhesions. Albeit, there is
some statistical analysis that can be done on these data, but the exact amount of the
adhesion force is not obtainable. Furthermore, stretching cell monolayers cannot reveal the
underlying mechanotransduction crosstalk between cell-cell and cell-ECM adhesions
(117). Studies have shown the interplay between integrin and cadherin-based adhesions
when cells are stimulated by external load or fluid shear (75, 120, 121). Since monolayer
stretching applies to stress and strain to both adhesion complexes at the cell-cell and cell-
ECM contacts, it is difficult to decouple the mechanotransduction pathways originating
from the two interfaces. A detailed discussion of this crosstalk from recent cell stretching
studies is presented in the following section.
Figure 2.1. Mechanical stretching of a monolayer of cells. A) Uniaxial stretching. B) Biaxial
stretching. C) Equiaxial stretching with vacuum suction. D) Four points bending substrate flection; E)
Stretching with a curved template (122).
Fluid flow can be used to impose shear stress onto a group of cells. To do this, cells
are cultured on the surface of a fluid flow channel. As fluid flows over the culture, shear
stress is imposed on the cells from the boundary layer between the cells and the fluid
(Figure 2.2A). This method has been used in a variety of studies, including investigating

22
the influence of fluid shear on the proliferation of bovine aortic endothelial cells (123) and
investigating rolling adhesion of white blood cells in shear flow (124). The primary
advantage of this method is the natural environment this study takes place in. Cells
commonly interact with fluid flow in vivo, so this setup allows for a very natural testing
environment. Two kinds of fluid flow systems are commonly used. The first is a parallel
plate system, in which fluid flow is driven through a small rectangular chamber using a
pressure differential. A variety of parallel plate systems have been developed (125-131),
and technological advances allowed for smaller microscopic parallel plate systems (132-
134). In these studies, the dimensions of the channel can be varied to control the flow
characteristics and thus shear stress and are kept small to ensure a low Reynolds number
and thus laminar flow. In one study, the width of the fluid flow channel was varied between
0.25 and 1 mm, which changed the shear stress imposed on a culture of fibroblasts (135).
The other system is a cone and plate system, in which a cone is rotated along its axis
above the surface of a circular plate (Figure 2.2B). Many studies have used this technique
(136-140). The tangential speed of the cone increases with increased distance from the axis
of rotation, but the distance between the cone and flat plate also increases, resulting in
uniform shear stress distributions along with the plate and the cone surface. By varying the
angle of the cone and the speed of rotation, many shear stresses can be achieved.

23
Figure 2.2. Fluid shear applied to the cell layer to study cell mechanics. A) Fluid flows in a chip
with a layer of cells. Different flow rates result in different shear stress on cells. B) The rotating cone can
make different shear stress at different angular velocities and distances from the axis of rotation (117).
2.2. Cell-substrate and cell-cell interaction measurement
Traction Force Microscopy (TFM) is the first mature technique to measure cell-
generated forces (141). In 2D TFM (Figure 2.3A), by measuring the substrate deformation
induced by cellular contractile forces, a stress map can be generated to quantify these
interaction forces per unit area. To this end, gel substrates embedded with fluorescence
beads are used to grow adherent cells. The dislocations of beads due to gel deformation are
calculated by comparing beads images captured when cells are attached and when cells are
trypsinized off the substrate. Several image processing methods (even ImageJ plugins
(142)) can compute the so-called displacement field by the traction force from the attached
cells (143). Common substrates used for TFM include polyacrylamide or silicon-based
gels. They are selected due to their linear elasticity and optical transparency, and normally
their elastic moduli can be tuned over several orders of magnitudes (144). Knowing the
elastic moduli of the substrates, the displacement field can be converted to the stress field
or traction force by integrating the stress field over an area. To consider the normal

24
component of the traction force in addition to the in-plane one, 3D TFM has been
developed in recent years (145, 146). There are layers of complexity and potential sources
of inaccuracy in computing the 3D displacement field involving ECM degradation and
nonlinearity of local deformation in 3D ECM among others (147). But some study does
show traction force differences between 2D and 3D matrix conditions (148).
In the study of cell-cell adhesion, TFM has so far produced the most reliable results
by indirectly quantifying cell-cell tugging forces through their force balance with cell-ECM
traction forces. These findings show direct evidence of crosstalk between cell-cell and cell-
ECM adhesions (149-151). On the one hand, integrin-mediated adhesions regulate the
tension and composition of cell-cell junction (21, 143, 152-154); on the other hand,
cadherin-based cell-cell adhesions in epithelial cells modulate cell-ECM traction forces
(149). In the latter case, by controlling calcium level and genetically switching off cadherin
(E-, and P-cad), a study has shown remarkably different traction force patterns for
keratinocytes: cooperative traction force with maximum stress at the peripheral of cell
colonies, and independent and significant traction force evenly distributed throughout the
colonies (149). Similar cooperative activities of cell-cell and cell-ECM adhesion were also
observed in heart muscle cells (71). Further, the force balance, as well as molecular tension
in E-cad, are modulated by spatial distributions of adhesion sites (155).
Microposts are purely mechanical devices that are used to measure adhesion and
traction forces cells exert on the surface they adhere to. In this experimental setup (Figure
2.3B), an array of microposts are fabricated. The geometry and composition of the
microposts determine their stiffness. When a cell is placed on the bed of microposts, the
posts bend as the cell exerts a force on them. Using optical microscopy, the deflection

25
distance and direction can be measured, and knowing the stiffness of the post, these
measurements can be converted into the force the cell is exerting on the micropost. The
primary advantage of this technique is the large number of independent force
measurements that can be taken at once, which when combined, gives a vector map of
traction forces the cell exerts. However, there is no way to control the strain the microposts
induce on the cell, so this is a passive technique. Also, forces can only be measured on the
plane between the cell and the end of the posts, and forces normal to this cannot be
quantified. One implementation of this technique used microposts with varying stiffness
by changing the geometry of individual microposts. This allows for control of the
sensitivity of force measurements on certain regions of the cell (156). Another study
embedded some of the microposts with magnetic cobalt nanowire. This allowed for control
of the microposts with the magnetic wire using an externally controlled magnetic field,
allowing for active control of forces on regions of the cell adhered to these microposts.
This setup was used to study the relationship between external mechanical forces and
internal biologically induced forces by applying a force to the magnetic microposts and
observing focal adhesion and traction forces on non-magnetic posts near the magnetic posts
(157).
Figure 2.3. Cell-ECM adhesion forces measurement. A) TFM B) Micropost (117).

26
2.3. Individual cells or cell pairs forces measurements
2.3.1. Micropipette Aspiration
Micropipette Aspiration is a simple technique in which a single cell is aspirated into
the tip of a micropipette (Figure 2.4Ai). The micropipette is positioned on the cell, and a
vacuum inside the micropipette slowly aspirates the cell into the micropipette. By making
the micropipette inside diameter smaller than the cell, compressive strains are imposed on
the cell as it enters the micropipette (158). This technique imposes large strains on cells,
and as a result, is incompatible with some cell types (159). Also, there are high-stress
concentrations along the edge of the pipette, and there is friction between the pipette
surface and the cell, which impacts results. This method has commonly been used to study
the viscoelastic behavior of cells, as cells slowly aspirate into the micropipette (160, 161).
Mathematical models have been used to convert resulting strains into stresses in
erythrocytes (162, 163) and chondrocytes (164), but they have limited accuracy due to the
many assumptions the models use.
In addition to aspirating cells, micropipettes have been used to manipulate individual
cells for other kinds of tests. In one experiment, two cells were brought into contact with
each other using two micropipettes (Figure 2.4Aii). The micropipettes use a slight vacuum
that can securely hold the cell on the micropipette without significant aspiration to not
introduce additional strains. After some time, the cells adhere to each other. Then, the
pressure in one of the micropipettes is increased until the cell bond breaks. By knowing the
pressure needed to break the cell bond, the mean adhesion force can be found (165, 166).
Two other studies were done which used two micropipettes to stretch a single cell. In one,
a slight vacuum was used to hold the cell on the tips of the micropipettes, and one

27
micropipette tip was actuated to strain the cell. One micropipette was attached to a
cantilever beam with a strain gauge, which could be used to quantify the input force to the
cell (167). In the other, the tips of two micropipettes were coated with a urethane resin
adhesive, which allowed a cell to adhere to them. One of the micropipettes was rigid and
stationary, and the other micropipette was flexible and actuated with a piezoelectric
actuator. The deflection of the flexible micropipette was recorded and used to determine
the force applied to the cell (168).
2.3.2. Optical Traps and Stretchers
Optical traps use the conservation of momentum of diffracting photons to impart
small forces on dielectric objects (169). This method has been used to study many
molecules (170), including the kinetics of RNA unfolding (171). When used to study cells,
dielectric microbeads are adhered to the cell and act as handles for the optical trap. The
adhesion strength limits the maximum force an optical trap can exert on a cell (172, 173).
Once the microbeads adhere to the cell, a laser is directed through one of the microbeads,
refracting the laser. The refraction changes the momentum of the photons, and thus changes
the momentum of the microbead, inducing a force. The microbead is attracted to the focal
point of the laser, and therefore the force can be controlled by altering how the laser is
focused on the microbead (174). For this to work, the refractive index of the bead must be
larger than the refractive index of the medium the cell is in. Generally, this technique is
used to apply static loadings to cells, but can also be used for cyclic loadings, using an
acousto-optic modulator (175).
One study using optical traps looked at the impact malaria had on the mechanical
properties of diseased red blood cells. In this study, healthy red blood cells (173) and

28
infected blood cells (176, 177) were stretched using an optical trap. The diseased cells were
tested in various stages of the infection, and it was found that the shear modulus steadily
increased throughout the infection, increasing by about an order of magnitude by the final
stage of the infection. A variation to optical traps, known as optical stretchers, uses
divergent lasers that interact directly with the cell without the need for microbead handles
(Figure 2.4B). In this technique, the laser spot size must be larger than the cell for stability.
Two lasers are directed on diametrically opposite sides of the cell, and as photons interact
with the cell, they impose a force on the cell, causing it to stretch. In addition to the
requirement of the refractive index of the cell being larger than the refractive index of the
surrounding medium, the cell’s refractive index must be homogeneous. This technique has
an advantage over optical traps in that higher laser powers can be used. This is because the
laser is unfocused, so the intensity of the laser is much less than the focused laser used for
optical traps (178-180). The two main advantages of these techniques are their high force
resolution and lack of physical contact with the cell. Using these techniques, sub pN forces
can be achieved, and cells can be studied in more natural environments because they do
not need to be physically attached to an instrument. However, the maximum achievable
force is limited to a couple of hundred pN, and high laser power may impart radiation
damage onto the cell.
2.3.3. Magnetic Beads
Magnetic beads can be used as handles to apply forces to a cell. First, the beads are
coated with a biochemical that allows them to bind to specific cell surface receptors (111).
Once they are attached, they can be manipulated through the control of an external
magnetic field (Figure 2.4C). This method was developed in 1950 (181) and has been used

29
in a variety of studies, including applying cyclic loadings to cells (182-184). Two main
advantages of this technique are the ability to apply torque to cells and the ability to easily
apply cyclic loadings through control of the magnetic field. However, due to unfavorable
scaling of magnetic forces with size, applying large forces with this technique requires
large beads relative to cell size (185).
2.3.4. Atomic Force Microscopy (AFM)
AFM is a technique that was originally developed to map the surface of nanoscale
structures. A silicon-based probe with a sharp tip is mounted on a cantilever beam and is
brought into contact with a surface. As it contacts the surface, the cantilever beam bends,
and by tracking its deflection by recording the angle at which a laser beam is deflected off
the back of the cantilever beam, the height of the surface can be measured (Figure 2.4Di).
This technique has been adapted to study cell mechanics by relating the amount the
cantilever beam deflects to the force the probe is placing on a cell by knowing the stiffness
of the cantilever beam. AFM has been used to study global elastic properties (186, 187)
and global viscoelasticity properties (188), as well as smaller-scale properties of cell nuclei
(189). This technique offers sub pN force resolution and sub-nm displacement resolution
but has a limited maximum force and displacement. In addition to compressive forces,
AFM can also be used to apply tensile forces to a cell. One way this can be done is by
culturing cells directly on the AFM tip. This allows for easy manipulation of cells and has
been used to study cell-cell and cell-substrate interactions (190). In addition, the AFM tip
can be functionalized to bind to cell surface receptors in a technique widely accepted as
single-molecule force spectroscopy (SMFS) (Figure 2.4Dii). Once functionalized, the
probe can be retracted to apply tensile forces and unwind or break molecular bonds (191).

30
SMFS has been used extensively to study binding affinities for a host of molecules,
including the unbinding of DNA protein pairs (192, 193).
In the study of cell-cell adhesion, AFM has been used in the context of single-cell
force spectroscopy (SCFS) (194, 195) (Figure 2.4Diii). This technique is similar in
principle with micropipette-based cell-cell adhesion studies using DPA, where two cells
are brought into contact and pulled apart to quantify their interaction. Compared with the
DPA method, SCFS offers a higher resolution (pN compared to nN for DPA) and less
native strain to the cells before contact. In SCFS adhesion measurements, a living cell is
first attached to a tip-less AFM cantilever, normally utilizing matrix protein coating, and
the cell was brought into contact with another cell on the substrate by lowering the
cantilever using a z-piezo stage. During the retraction phase, the interactions can be
measured by recording the cantilever deflection. The sensitivity in force measurement and
the fine position control by the z-piezo stage enables the quantifications of subtle cell-cell
interactions during the initial phase of adhesion. These forces are often retraction rate-
dependent and dwelling time-dependent (194, 196). A prolonged dwelling time often leads
to the study of cooperative binding. SCFS studies have led to the conclusion that levels of
E-Cad determine the adhesion strength between different types of progenitor cells in
zebrafish development (197). Destructive methods are also used to probe cellular responses
including the use of laser pulses (198-200) or AFM probes (201, 202) to dissect
cytoskeleton components.

31
Figure 2.4. Individual cell and cell pair adhesion force measurement. A) Micropipette aspiration
(i). Single cell (ii). Cell pair B) Optical stretch (i). Single cell (ii). Call pair C) Magnetic beads (i). Single cell
(ii). Cell pair D) AFM based measurements (i). and (ii). Single cell (iii). Cell pair (117).
2.4. MEMS devices
2.4.1. Cantilever beam deflection
A wide array of MEMS devices that use cantilever beam deflection have been
developed. In general, these devices use a cantilever beam to deform a cell. As the cell
deforms, the force also bends the cantilever beam, and by knowing the stiffness of the
beam, the force can be found by measuring the deflection of the beam. Many designs
utilizing this technique have been made, with an array of force ranges and sensing
capabilities. A 1-dimensional and a 2-dimensional cantilever beam MEMS device were

32
developed for probing cells (203). The 1-D sensor is only capable of measuring force in
the x-direction. A probe used to stimulate the cell is attached to two sets of parallel beams.
The beams confine the movement of the probe to a single dimension and also act as a spring
with a known spring constant (Figure 2.5Ai). This structure is actuated with a piezoelectric
actuator, and as the probe interacts with the cell, the beams are deformed. This deformation
is recorded and converted into a force using the known spring constant. The 2-D sensor
only has one beam attached to the probe, instead of two sets of parallel beams (Figure
2.5Aii). This allows the probe to move in both the x and y-direction. Another set of
cantilever beam MEMS devices were developed that featured much higher resolutions than
previous designs (204). These devices featured many cantilever beams connected on their
ends. By doing so, each beam only deflects slightly, which limits the nonlinear effects of
beam deflection calculations, increasing resolution without limiting force range (Figure
2.5Aiii). One configuration simply connects one beam to the end of the next beam, with
the probe at the end. This configuration allows for measurements in two dimensions with
high resolutions, but it has a lower measurement range. The second configuration connects
pairs of parallel beams end to end. This only allows for force measurement in one direction,
but it has a much larger measurement range. By controlling the number of beams used, the
force range and resolution can be controlled.
2.4.2. Moveable platforms
In a moveable platform MEMS device, a cell adheres to a platform that is split into
two or more parts. The cell adheres to the platform while the parts are together, and then
the parts of the platform are separated using a piezoelectric actuator and mechanical
linkages. As the parts of the platform come apart, the cell is stretched, and the degree to

33
which the cell is strained can be controlled by the separation distance between the parts of
the platform. Two variations of this technique have been implemented, a uniaxial puller
and a biaxial puller.
2.4.2.1. Uniaxial puller
A uniaxial puller consists of two platforms, one of which is fixed while the other is
moveable (Figure 2.5B). The moveable platform is attached to a piezoelectric actuator,
which can control the displacement of the platform. In one study, a uniaxial puller was
used to study the mechanical properties of hydrated collagen fibrils (205). An electrostatic
comb drive actuator was used to actuate one of the platforms, while the other was held
rigidly in place. The main advantages of using an electrostatic comb-drive actuator include
low power consumption using moderate driving voltages, and high speed and accuracy.
Also, the use of an electrostatic comb drive actuator allowed for the cyclic loading of the
cell.
2.4.2.2. Biaxial puller
A biaxial puller was developed that used an electrostatic comb-drive actuator and a
cleverly designed kinematic linkage that allowed for controlled actuation of four segments
of a platform at the same time (206). In this setup, one part of the stage was fixed, while
the other three were connected to a kinematic linkage that was connected to the electrostatic
actuator (Figure 2.5C). When the actuator moves, the linkage causes the three mobile
portions of the platform to move in mutually orthogonal directions from each other, and if
small displacements are assumed, they move away from each other at the same speed. This
results in a uniform biaxial strain on the cell.

34
Figure 2.5. MEMS-based cellular force measurements. A) Beams B) Uniaxial puller C) Biaxial
puller (117).
2.4.3. 3D Nanofabrication
Two-photon polymerization (TPP) has enabled the fabrication of devices at the
nanoscale and more importantly using biocompatible fabrication materials (207). A new
class of micro-scaffold with nanometer-scale features has been developed for cell
attachment and growth (208-211), for force measurement from cell adhesion-induced
interactions (212), and stimulation of focal adhesions (213).
2.5. Conclusion
Characterizing the intricacy of the biophysical and biochemical response requires
techniques that can quantify cell-generated forces and apply precise forces to cell-cell
adhesion complexes. Several widely-used techniques in the quantitative assessment of cell-

35
generated forces include traction force microscopy (TFM) (214) and elastomer-based
micropillar arrays (215). These methods provided great insights into the actin-based cell-
extracellular matrix (ECM) adhesion networks. In addition, micro-scaffolds fabricated by
3D printing have been used to measure cell forces in a 3D microenvironment (209, 216).
Nevertheless, for the study of cell-cell adhesion, one has to quantify indirectly, relying on
the force-balance between cell-cell and cell-ECM adhesions (215). More importantly, the
quantification methods are restricted to static observations and fail to apply desirable
mechanical stimuli. Cyclic stretching is able to provide mechanical stimuli to a monolayer
of cells and induce a variety of cellular responses (217). However, the lack of stress
measurement during loading has positioned the method as a stimulator rather than a
quantitative mechanical analyzer. Besides, it is impossible to apply defined loads onto each
individual cell junction using a monolayer cell stretcher, thus making it a qualitative
stimulator (53). To date, the mechanics of the cellular junctions remains poorly understood
with regard to the role of various components of the junction play in maintaining the
integrity of the cell adhesion during mechanical stress. Specifically, the majority of the
studies are carried out on isolated cells where mature intercellular junctions are yet to form,
and the focus can only be placed on the separation of the cadherin bonds. And yet, when
mechanical stretch testing is conducted on a monolayer of cells, the lack of stress
measurement during loading and the inability to apply defined loads onto each individual
cell junction renders the study qualitative.

36
CHAPTER 3
SCAµTT, A SINGLE CELL ADHESION INTERFACE MECHANICAL
CHARACTERIZATION PLATFORM
Portions of this material have previously appeared in the following publication:
Amir Monemian Esfahani, Jordan Rosenbohm, Bahareh Tajvidi Safa, Nickolay V Lavrik,
Grayson Minnick, Quan Zhou, Fang Kong, Xiaowei Jin, Eunju Kim, Ying Liu, Yongfeng
Lu, Jung Yul Lim, James K Wahl, Ming Dao, Changjin Huang, Ruiguo Yang,
Proceedings of the National Academy of Sciences, (2021) 118 (7). Used with permission.
3.1. Proposed design for single cell-cell adhesion interrogation
A novel micro-device has been designed and fabricated to interrogate the
mechanical behavior of the cell-cell junction. This device consists of two moveable islands
with known spring constants. A single epithelial cell (keratinocyte cell line) is picked up
using the Eppendorf single cell isolation system and placed on each island. When a mature
junction forms between the cell pair across the gap between the islands, it is strained for
the evaluation of mechanical strength until it fails. To do this, the displacement of Island 2
is directly controlled using an AFM system, which can displace the island between 0 to 50
μm, while Island 1 is displaced under the tensile force through the cell-cell junction. The
device is integrated on top of an inverted microscope which is used to monitor the
displacement of the islands, from which the deformation of the beams is determined. Island
1, therefore, functions as a force sensor that can be used to measure nano-Newton range
forces applied to the cell junction by relating its displacement to the spring constant of the
beam that supports it. The stretch test process is captured by a screen recorder and divided

37
into individual frames which are analyzed by a digital image correlation method to track
the islands’ displacements (Figure 3.1).
Figure 3.1. Detailed illustration of the entire SCAµTT platform. We used the AFM setup as a
tool to stretch the platform. Specifically, we utilized its precise X, Y, and Z positioning capabilities to capture
the pillar on the device within a hole drilled into the tip of a cantilever probe tip, and could subsequently
define a path for the tip to follow at a specified speed to apply strain at a controlled strain rate to the platform.
We did not use any other functions such as spectroscopy. To help illustrate how the AFM setup is integrated
into our platform, we drew a Solidworks model. An AFM probe with a hole drilled in the tip with a focused
ion beam (FIB) is mounted on the scanner head, and the AFM system is then placed on the stage of an
inverted microscope above the sample. The probe tip is then moved using controls on the stage and the AFM
software until the pillar is captured within the hole on the probe tip. From here, a line for the probe tip to
follow is defined within the AFM software along with the scanning speed to displace the tip in the Y-direction
and apply the strain at a controlled strain rate.
The stiffness of the supporting beams was designed to be as close to the stiffness
of the cell-cell junction (0.01 N/m – 0.5 N/m) (218) as possible to acquire the best balance

38
between force-sensing resolution and applied strain to the cell-cell junction, with the ability
to measure a force in the range of 0 – 50 nN at the junction (219, 220). The resolution of
the device is determined by the minimum force which can be detected by Island 1 which
is related to its stiffness. If the beams are too stiff, the movement of the island will not be
seen under the microscope. A compliant beam will allow the island to move more, allowing
the displacement to be more accurately quantified. On the other hand, their stiffness must
be high enough to prevent it from collapsing during the fabrication process. Several
generations of the sensing beam structure have been designed, fabricated, and tested, and
their stiffness was calculated using COMSOL Multiphysics simulation software. The first
generation was a group of parallel horizontal beams. A design with 5 sets of beams was
proposed as the first design. After the simulation, the calculated stiffness was K = 1×10⁵
N/m, which, compared to biological samples, was too large to measure the stress in the
cell-cell junction (Figure 3.2A). By reducing the number of beams, decreasing the beam
width from 5 μm to 2.5 μm, and increasing the beam length from 80 μm to 150 μm, we
were able to decrease the stiffness to 4.6 N/m (Figure 3.2B). However, this was still too
large to measure stress. Since we reached the maximum printing dimensions of the 3D
printer device without stitching, we could not increase the length and due to the structure
stability, we could not decrease the width of the beams. A serpentine beam was then
proposed to further decrease the stiffness with these geometric constraints in mind. This
design further reduced the stiffness of the structure (K = 1.05 N/m) but was still too stiff
(Figure 3.2C). The force-displacement curves of these designs are compared in Figure
3.2D. It is worth mentioning that these stiffness data are all calculated in air.

39
Figure 3.2. Design, simulation, and fabrication of the first generation of the single cell pair
stretcher (horizontal). A) Horizontal beam design with 5 parallel beams attached to the sensing island and
1 pair of beams attached to the actuating island. This design had the highest stiffness (K = 1e5 N/m) and was
not able to measure the junction stress. Scale bar = 50 µm. B) Horizontal beam design with 3 pairs of beams
attached to the sensing and actuating islands, with the width decreased from 5 μm to 2.5 μm and length
increased from 80 μm to 150 μm. The new stiffness was 4.6 N/m which is not low enough to measure the
junction stress. Scale bar = 100 µm. C) Horizontal beam design in which the sensing island beams are
changed from the straight to the serpentine design which is less stiff. This design had 1.05 N/m stiffness
which is still too stiff to measure the junction stress. Scale bar = 100 µm. D) The force versus displacement
of different designs has been plotted to compare and find their stiffness.
All the horizontal beam designs have a stiffness higher than our desired values (0.01
N/m – 0.5 N/m). So, a vertical beam design was proposed (Figure 3.3A). The vertical beam
with a height of 280 µm was able to give us a stiffness close to our goal (0.22 N/m).
However, the beams being exactly underneath the islands creates high-intensity
background noise during fluorescent imaging, blocking the signal from cells. Therefore,
we designed a double cantilever beam design by moving the beams’ bases to the sides of

40
the islands (single Λ-shape). Theoretically, this change resulted in increasing the stiffness,
so the design was modified by decreasing the beam thickness from 5 µm to 2.5 μm and
increasing its height to 300 μm. With COMSOL simulation, its stiffness is lower than the
other beam geometry designs (0.08 N/m); however, it collapsed during fabrication (not
shown in the figure). Adding another set of Λ-shape beams (double Λ-shape) to increase
stability still resulted in the collapse of the structures (Figure 3.3B). Finally, a set of trusses
were added horizontally to connect the vertical beams and enhance stability (stabilized A-
shape), while decreasing the beam thickness to 2 µm, resulting in stable structures with
stiffness of 0.11 N/m. (Figure 3.3C, D). It is worth mentioning that these stiffness data are
all calculated in air. Compared with horizontal beams, vertical beams offer greater control
of their length which allows for easy adaptation to this desired stiffness and offers better
structural stability during the TPP fabrication process. A set of vertical “A-shaped” beams
were designed and fabricated considering different constraints in beam stiffness, beam
stability, fabrication limitations, and imaging requirements.

41
Figure 3.3. Design, simulation, and fabrication of the second generation of the single cell pair
stretcher (vertical). A) The vertical beam design was less stiff compared to the horizontal beam design and
more stable during fabrication. The new design had a height of 280 μm and its stiffness was 0.22 N/m, which
allows us to measure the junction stiffness. Scale bar = 50 µm. B) The double Λ-shape design solved the
background noise issue, but it was not stable during fabrication and collapsed. Scale bar = 100 µm. C) The
double A-shape design with the supporting truss was the final design because of its stiffness and stability.
Scale bar = 50 µm. D) The force versus displacement of the vertical beam designs has been plotted to compare
and find their stiffness.
3.2. Device fabrication and calibration
3D models of the micromechanical structures for biological cell mechanical
interrogation were compiled in COMSOL using the built-in CAD. Various preliminary
designs, including planar structures, were implemented using TPP stereolithography and
tested in terms of their processability and susceptibility to damage by capillary forces. The
compiled models were evaluated using the Solid Mechanics module (linear elastic
materials approximation). The finite element analysis (FEA) in COMSOL allowed us to

42
estimate effective spring constants of the flexible beams supporting a pair of microscale
plates for cell attachment. As a result of the FEA analysis and experimental tests applied
to multiple iteratively refined designs, we identified the most promising design that could
be fabricated with high yield and fidelity. The rationale behind this design is as follows.
First, compared to doubly clamped (bridge) structures, singly clamped (cantilever) beams
provide a more linear elastic response with significantly lower sensitivity to intrinsic
stresses. Second, the parallelogram arrangement of the twin-beam leaf springs improves
the leveling of the cell-bearing platforms and the overall mechanical stability of the
devices. Furthermore, vertical beams separated by larger distances from the substrate are
preferable over horizontal beams closer to the substrate due to the better ability of the
former to withstand capillary forces after fabrication. Finally, the thinnest beams that could
be reliably fabricated with high accuracy and yield were approximately 2 mm thick. This
minimum thickness, combined with the targeted stiffness, dictated the width and the length
of the beams in the implemented structures.
To fabricate several batches of structures, microscale 3D printing based on TPP
was used (221). CAD files in STL format exported from COMSOL 4.2 software were
imported into the Describe software (Nanoscribe, GmbH) to compile job files for the
Photonic Professional (GT) tool (Nanoscribe, GmbH). The slicing and hatching distances
were selected to be 0.4 μm and 0.3 μm, respectively. The vendor-supplied liquid
photoresist, IP-S, and a 25x immersion microscope objective were used to print structures
in the galvo-scanning mode using the so-called deep-in laser lithography (DiLL) optical
arrangement.

43
Glass coverslips with diameters ranging from 11 to 25 mm and thicknesses of
approximately 160 μm were used as substrates in the present study. Prior to 3D printing,
the glass substrates were coated with indium tin oxide (ITO) to achieve optical reflectivity
of the IP-S/substrate interface sufficient for autofocusing. The ITO layer had a thickness
of approximately 50 nm and was deposited using direct current sputtering of an ITO target
in an Ar plasma. In our initial tests, we found that mechanical 3D structures printed directly
on ITO-coated glass had insufficient adhesion and would detach from the substrate after
prolonged soaking or incubation in aqueous solutions. To address this commonly
encountered issue of insufficient adhesion between smooth substrates and 3D structures
fabricated using TPP, we used an in-house developed protocol in which an additional layer
of porous silicon oxide (PSO) was deposited on top of ITO-coated coverslips. PSO with a
thickness of approximately 2 μm and a high density of nanopores was found to act as an
excellent anchoring layer, eliminating detachment of the 3D printed structures from the
substrate during soaking and subsequent experiments in aqueous solutions.
To prevent the deposited cells from migration, a bowtie structure was designed and
fabricated with one trapezoid on each island (Figure 3.4C). This makes it more likely for
cells to form a junction between the islands within the gap. Studies showed that an average
cell-cell junction length is between 8 to 12 μm (219). Also, a single cell needs a space of
40 μm by 30 μm when attached to a surface (220). The area of the trapezoid and the length
of its opening edge were optimized to preserve the physiological conditions with an area
large enough to sustain cell growth and an opening edge of 12 μm to facilitate junction
formation at the interface between the two islands (220). The gap between the two movable
islands, particularly between the bowtie opening where the junction forms, should be kept

44
to a minimum to facilitate junction formation, but a gap distance of less than 2 μm leads to
unwanted polymerization of the resin that tethers the two islands during the fabrication
process. We increased the gap of the non-bowtie region to 6 μm to reduce the risk of
attachment of the islands (Figure 3.4D).
To measure the stiffness of the “A-shaped” beam structure, a tipless cantilever
probe with a thermally tuned stiffness was used to apply force on an isolated sensing
structure in Phosphate-buffered saline (PBS) solution. Based on the displacement of the
probe and the force measurement from the AFM probe, the deflection and subsequently
the stiffness of the microstructure were determined. The modulus of elasticity of TPP
fabricated materials varies with laser power, print speed, and post-process curing methods.
In this study, fabrication parameters remained as consistent as possible. A Nanosurf AFM
was used to conduct force spectroscopy experiments on horizontally printed sensing
microstructures to attain an average stiffness value. A tipless cantilever probe (TL-NCL by
Nanosensors) with a known and thermally tuned stiffness, 𝑘𝑝, was used to press on
horizontally fabricated sensing microstructures with beam thickness, 𝑡 = 2 𝜇𝑚 (Figure
3.4E). AFM uses the deflection of the probe, Δ𝑥𝑝, and its known stiffness, 𝑘𝑝, to measure
the applied force, 𝑃𝐴𝐹𝑀. The sensing microstructure is also subjected to the same force as
it produces the reaction to cause the probe deflection:
𝑃𝐴𝐹𝑀 = Δ𝑥𝑝 ∙ 𝑘𝑝 = Δ𝑥𝑠𝑒𝑛𝑠 ∙ 𝑘𝑠𝑒𝑛𝑠 (3-1)
Here, Δ𝑥𝑠𝑒𝑛𝑠 and 𝑘𝑠𝑒𝑛𝑠 are the deflection and stiffness of the sensing microstructure,
respectively. The AFM outputs the data as force, 𝑃𝐴𝐹𝑀, versus displacement, 𝑑 (Figure
3.4F). As shown in Figure 3.4E, the probe is deflected upwards and the structure

45
downwards, therefore the deflection of the microstructure can be calculated by the
following:
Δ𝑥𝑠𝑒𝑛𝑠 = 𝑑 − Δ𝑥𝑝 (3-2)
To evaluate the data to find the stiffness, the probe deflection is first found from equation
(3-1). Next, the structure deflection is solved using equation (3-2). Lastly, by substituting
the values into the sensing part of the equation (3-1), the stiffness can be found:
𝑘𝑠𝑒𝑛𝑠 =
𝑃𝐴𝐹𝑀
Δ𝑥𝑠𝑒𝑛𝑠=
1
𝑑/𝑃𝐴𝐹𝑀 − 1/𝑘𝑝
(3-3)
To analyze the AFM data, a MATLAB script was used to smooth and average the AFM
force versus deflection curves and to calculate the sensing structure stiffness by fitting the
averaged line of the data, where the slope was equal to the stiffness.
For each measurement, the automated detection of the AFM was used to initiate
contact between the probe and the structure. Once contact was established, a constant probe
displacement rate was initiated to apply force on the structure until the force set point was
achieved. The probe was then retracted until it was no longer in contact with the structure
before beginning the process again. This produced the force-displacement curve from
which the stiffness of the beam can be extracted (Figure 3.4F). The calculated beam
stiffness was found to be 0.049 ± 0.005 N/m under liquid conditions (Figure 3.4G), which
is within the desired range. This stiffness value remains valid for a sensing beam deflection
of ~6 µm (i.e., a maximum force of 294 nN), displaying a large linear range. It is worth
mentioning that the TPP printing parameters, including laser power and scan speed, can
have a significant influence on the measured stiffness. Considering the resolution of DIC

46
at a few tens of nanometers, this sensing beam stiffness can resolve the forces of a few
cadherin bonds (~40 pN for each cadherin bond (222)).
Figure 3.4. A single cell-cell adhesion interface mechanical characterization platform. A) A
single cell pair with junctional contacts is formed on Islands 1 and 2. To apply mechanical strain to the cell-
cell junction, an AFM-based manipulation system displaces Island 2. B) The deflection of Island 1 (δ) under
the applied displacement (D) is recorded to determine the force-displacement relationship. C) SEM image of
the structures fabricated on top of a glass substrate. The bowtie structures confine the cells on each island. D)
The two islands were spaced 6 µm apart to prevent attachment of the islands to each other, with a 2 µm gap

47
between the cell-confining bowties to allow formation of the cell-cell junction. E) To measure the stiffness,
an AFM probe applies force to the structure until a displacement set point is achieved, and then retracts. The
AFM records the applied force, 𝑃𝐴𝐹𝑀 , and vertical displacement 𝑑. The vertical structure displacement, Δ𝑥𝑠𝑒𝑛𝑠,
and deflection of the AFM probe, Δ𝑥𝑝, are determined from the AFM output. The inset image shows the probe
applying force onto the structure. F) A representative force-displacement curve obtained at a maximum
applied force of 294 nN is shown. G) Sensing structure stiffness, 𝑘𝑠𝑒𝑛𝑠 vs. structure deflection, Δ𝑥𝑠𝑒𝑛𝑠 is
plotted (n=30). Scale bars: 200 µm in C; 50 µm in D; 100 µm in E (223).
To examine the elasticity of the structure, two experiments were performed with a
controlled displacement and release. The first one was a 25 µm displacement and sudden
release of the structure and the second one was a 50 µm displacement and sudden release.
Since lower strain rates have more impact on the viscoelastic properties of the material, we
used 100 nm/s (0.005 s-1) for both experiments. Figure 3.5 shows the displacement-time
plots for the experiments. For the 25 µm displacement, 0.135 seconds after release, and for
the 50 µm displacement, after 4.72 seconds, both return to the original position within the
resolving power of the DIC, thus ruling out major plastic deformation. Further, the rapid
release and return of the 25 µm test demonstrate that the viscoelastic effect can be
negligible with this displacement, slightly less so with the 50 µm test. In our cell stretch
experiments, the displacement of the sensing island is within 5 µm, in which elastic
deformation dominates according to this experiment.

48
Figure 3.5. Elastic deformation of the structure. A) 25 µm displacement and sudden release.
Scale bar: 50 µm. B) Displacement versus time for the 25 µm displacement. Scale bar: 25 µm. C) 50 µm
displacement and sudden release. Scale bar: 50 µm. D) Displacement versus time for the 50 µm displacement.
Scale bar: 25 µm.
3.3. Cell deposition procedure
Cell manipulation was performed using the well-known Eppendorf cell isolation
system. This setup consists of a microcapillary (Piezo Drill Tip ICSI, Eppendorf) integrated
with a pressure controller (CellTram® 4r Air/Oil, Eppendorf) and a 3D manipulator
(TransferMan® 4r, Eppendorf), allowing for precise 3D cell manipulation. The inner
diameter of the microcapillary was chosen based on the cell diameter (approximately 15
µm). To aspirate and hold a cell on the needle tip, the inner diameter should be less than
the cell diameter. Based on available needle sizes from Eppendorf, we selected Piezo Drill
Tip ICSI with a 6 μm inner diameter. The needle is connected to the capillary and through
a tube to the pressure controller. The tube is filled with mineral oil, and a small

49
displacement of the pressure controller cylinder creates positive or negative pressure at the
needle tip. The needle approaches the cell using the 3D manipulator (Figure 3.6A). When
it touches the cell membrane, a negative pressure is applied to aspirate the cell (Figure
3.6B). While the cell is held at the needle tip, it is positioned above Island 2, and a positive
pressure is applied to detach the cell from the needle and place it on the surface (Figure
3.6C). The same procedures are performed to place the second cell on Island 1 (Figure
3.6D, E, and F). This process is performed inside a temperature-controlled chamber.
Figure 3.6. Cell deposition procedure. A) One cell is targeted and the microcapillary approaches
the cell using the 3D manipulator. B) A negative pressure is applied with the pressure controller to aspirate
and hold the cell. C) The manipulator moves the cell to the structure and a positive pressure is applied to

50
deposit the cell on one of the islands. D-F) The same steps are performed to aspirate and deposit the second
cell on the other island.
3.4. Cell-cell adhesion junction formation
A431 E-cadherin GFP tagged cells were cultured in a growth medium composed of
Dulbecco's modified Eagle's medium (DMEM) and supplemented with 10% fetal bovine
serum (Chemie Brunschwig AG) and 1% penicillin-streptomycin (Invitrogen). The
experimental medium consisted of CO2-independent growth medium (Invitrogen)
supplemented with 2 mM L-glutamine (Sigma-Aldrich Chemie GmbH), 10% fetal bovine
serum, and 1% penicillin-streptomycin. All solutions were filtered through 0.22 μm pore-
size filters before use. Shortly before each experiment, PBS was replaced with 2 ml of the
experimental medium. All experiments were performed in a temperature-controlled
enclosed chamber at 37 °C.
As shown in Figure 3.7A, a pair of E-cadherin GFP-tagged A431 cells were
successfully deposited and placed inside the bowtie structure. 16 hours after cell deposition
and incubation, cells were stained for actin and DAPI and imaged. The cells successfully
grew within the bowtie structures on top of each island and formed a mature junction by
expressing E-cadherin GFP (Figure 3.7B).
Figure 3.7. Cell-cell adhesion junction formation and cell growth on the scaffolds. A) Cell
deposition onto the fabricated structure shows the ability to place cells in the opposing bowtie confinement

51
scaffolds. Scale bar: 100 µm. B) A pair of cells form a mature cell-cell junction 16 hours after cell deposition
and incubation as shown by the expression of E-cadherin GFP. The cell junction spans across the gap between
the two movable islands. Cells were stained for actin and DAPI. Scale bar: 50 µm (223).
The A431 cells were E-cadherin GFP tagged and so the junctions can be seen
without adding staining solutions. Alexa Fluor™ 657 Phalloidin (Invitrogen) was used to
stain the actin filaments and the nuclei were stained with DAPI (Invitrogen). The substrate
with the cells was placed in a glass-bottom petri dish. The cells were washed twice with
PBS, pH 7.4, and fixed using 4% formaldehyde solution in PBS for 15 minutes at room
temperature, and then washed two times with PBS. Subsequently, they permeabilized with
a solution of 0.1% Triton X-100 in PBS for 5 minutes, and then washed twice with PBS.
To enhance the quality of the actin fluorescent intensity, 4 drops of Image-iT™ FX Signal
Enhancer (Thermofisher) were added and incubated at room temperature with a humid
environment for 30 minutes. After removing the solution and washing with PBS, the
Phalloidin staining solution with a ratio of 1:100 in PBS was placed on the substrate for 30
minutes at room temperature and then washed with PBS. Then, the DAPI (Invitrogen)
solution with a ratio of 1:1000 with PBS was placed on the substrate and incubated for 10
minutes at room temperature. The solution was removed, and the substrate was washed
with PBS. Finally, 3 mL of pure water was added to the petri dish for imaging. A Nikon
A1-NiE upright confocal system (60X water immersion objective) driven by NIS-Elements
Confocal image acquisition and analysis program (Nikon software) was used for
immunofluorescent imaging of cells on the structures. All image reconstruction and
channel alignment were performed within the Nikon software.
Since the polymer used for fabricating the device was autofluorescent, we needed to
quench it. The substrate with the structures was placed inside of a glass-bottom petri dish,

52
washed with 70% ethanol, and immediately soaked with PBS for 10 minutes until all the
ethanol dissolved. To enhance the quality of the images, the whole substrate was
submerged in 0.3% Sudan Black B in 70% ethanol for one hour to eliminate the
autofluorescence of the polymer. To dissolve excessive Sudan Black, the substrate was
submerged in 70% ethanol for 1 hour and then soaked with PBS for 10 minutes. The
substrate was then coated with fibronectin to enhance the adhesion and growth of the cells
on the structures. Fibronectin with a concentration of 50 μg/ml was added on the substrate
and left in the incubator for 2 hours. Finally, the fibronectin solution was removed, and the
substrate was washed with PBS two times.
The immunofluorescence images of these cells on the structure prove the
biocompatibility of the polymer. E-cadherin expression shows the cell-cell junction
formation and actin shows that cells spread and grow on the structure (Figure 3.8). As we
expected, the junction is formed within the gap, thus proving the ability to deposit and grow
cells on the novel device and for a junction to form between the cells.
Figure 3.8. Formation of a mature cell-cell adhesion junction. To demonstrate the biocompatibility
of the structures, A431 cells with GFP-tagged E-cadherin were deposited onto the structures. Actin filaments
were stained 16 hours after deposition. E-cadherin imaging shows the formation of a mature cell-cell junction
and actin filaments imaging shows that cells maintain a spread shape on the structure. Scale bar: 50 µm (223).
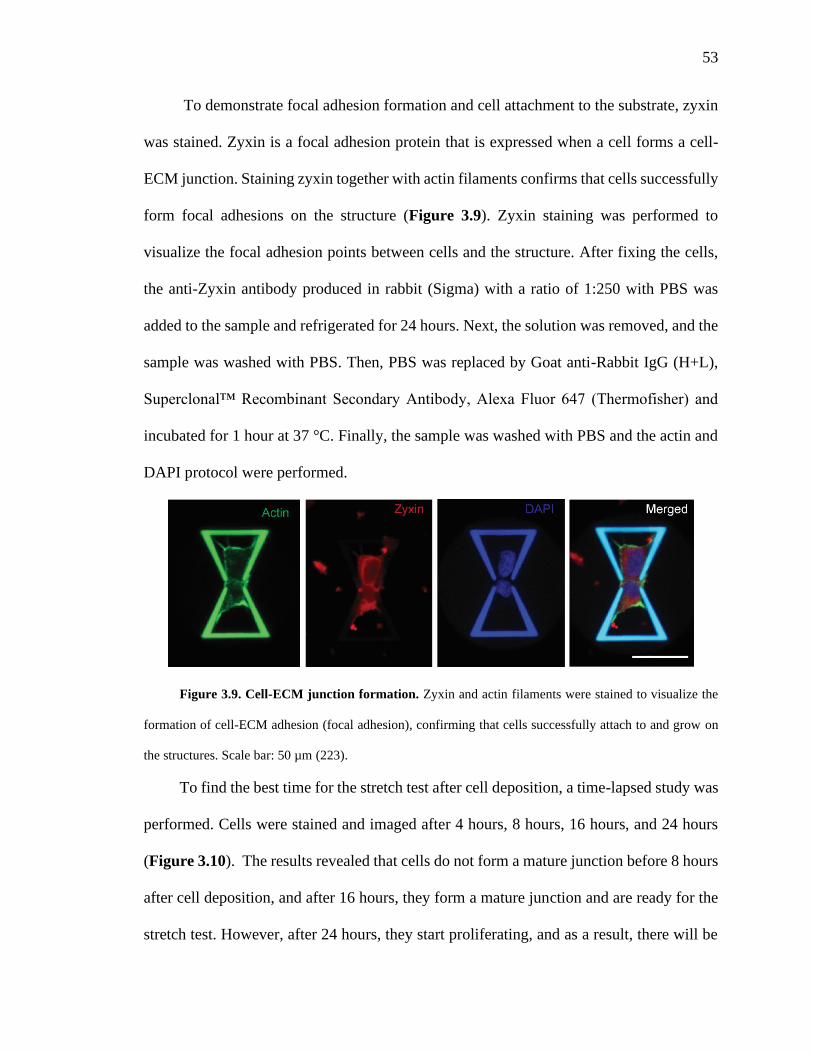
53
To demonstrate focal adhesion formation and cell attachment to the substrate, zyxin
was stained. Zyxin is a focal adhesion protein that is expressed when a cell forms a cell-
ECM junction. Staining zyxin together with actin filaments confirms that cells successfully
form focal adhesions on the structure (Figure 3.9). Zyxin staining was performed to
visualize the focal adhesion points between cells and the structure. After fixing the cells,
the anti-Zyxin antibody produced in rabbit (Sigma) with a ratio of 1:250 with PBS was
added to the sample and refrigerated for 24 hours. Next, the solution was removed, and the
sample was washed with PBS. Then, PBS was replaced by Goat anti-Rabbit IgG (H+L),
Superclonal™ Recombinant Secondary Antibody, Alexa Fluor 647 (Thermofisher) and
incubated for 1 hour at 37 °C. Finally, the sample was washed with PBS and the actin and
DAPI protocol were performed.
Figure 3.9. Cell-ECM junction formation. Zyxin and actin filaments were stained to visualize the
formation of cell-ECM adhesion (focal adhesion), confirming that cells successfully attach to and grow on
the structures. Scale bar: 50 µm (223).
To find the best time for the stretch test after cell deposition, a time-lapsed study was
performed. Cells were stained and imaged after 4 hours, 8 hours, 16 hours, and 24 hours
(Figure 3.10). The results revealed that cells do not form a mature junction before 8 hours
after cell deposition, and after 16 hours, they form a mature junction and are ready for the
stretch test. However, after 24 hours, they start proliferating, and as a result, there will be
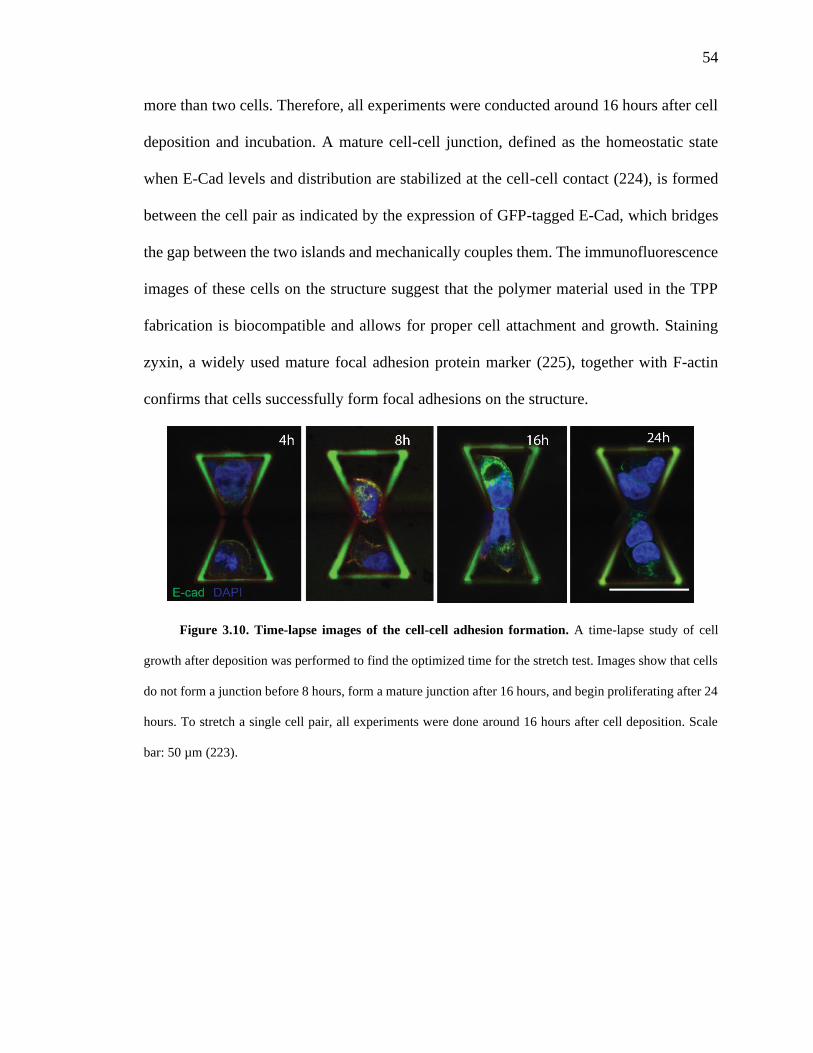
54
more than two cells. Therefore, all experiments were conducted around 16 hours after cell
deposition and incubation. A mature cell-cell junction, defined as the homeostatic state
when E-Cad levels and distribution are stabilized at the cell-cell contact (224), is formed
between the cell pair as indicated by the expression of GFP-tagged E-Cad, which bridges
the gap between the two islands and mechanically couples them. The immunofluorescence
images of these cells on the structure suggest that the polymer material used in the TPP
fabrication is biocompatible and allows for proper cell attachment and growth. Staining
zyxin, a widely used mature focal adhesion protein marker (225), together with F-actin
confirms that cells successfully form focal adhesions on the structure.
Figure 3.10. Time-lapse images of the cell-cell adhesion formation. A time-lapse study of cell
growth after deposition was performed to find the optimized time for the stretch test. Images show that cells
do not form a junction before 8 hours, form a mature junction after 16 hours, and begin proliferating after 24
hours. To stretch a single cell pair, all experiments were done around 16 hours after cell deposition. Scale
bar: 50 µm (223).

55
CHAPTER 4
DISPLACEMENT-CONTROLLED MECHANICAL CHARACTERIZATION OF
THE CELL-CELL JUNCTION
4.1. Cell-cell junction stretch test
For the stretch test, Sudan Black was not used because it blocks the light, which
makes cell deposition and cell tracking impossible to perform. The substrate with the
structures was placed inside of a glass-bottom petri dish, washed with 70% ethanol, and
immediately soaked with PBS for 10 minutes until all the ethanol dissolved. The substrate
was then coated with fibronectin (50 μg/ml) to enhance the adhesion and growth of the
cells on the structures. The fibronectin solution was placed on the substrate and left in the
incubator for 2 hours. The solution was removed, and the substrate was washed with PBS.
To push and pull the structure, an AFM setup was used. For this purpose, the AFM
probe was drilled using FIB etching to make a circular hole with a diameter of 15 μm so
that it could capture the pillar (10 μm diameter) on the structure. When the junction is
mature, the stretch test is performed. The substrate with the structures and cells was placed
under the AFM setup integrated with an inverted microscope. The AFM probe approaches
the pillar on Island 2 and captures it within the through-hole. From here, the AFM can
apply displacement (from 0 to 100 μm with 10 nm resolution) with different displacement
rates (from 50 nm/s to 20 µm/s) to Island 2 to stretch the cell-cell junction. After several
experiments, we found that a 50 μm displacement with a 5 % s-1 strain rate was enough to
break the junction. Hence, we applied this displacement for all experiments and tried
different displacement (strain) rates to study the rate dependency of the junction’s behavior.

56
Strain rate is defined by the displacement rate divided by the initial length. The diameter
of each cell is approximately 20 μm. We assumed a pair of cells that have a junction in
between are attached fully to the substrate and when the force is applied, half of each cell
is detached and contributes to the stretch test. Therefore, the initial length will be 20 μm.
Each stretch test was recorded and analyzed with a customized DIC-based program
to calculate each island’s movement. The displacement of each island was obtained by
averaging the displacement of markers in the ROI in each frame. Similarly to previous
studies on epithelial monolayers (53), the strain was calculated by dividing the difference
of the two islands’ displacements by the initial length: ε = (D − δ)/L0, where D is the
Island 2 (actuation) displacement, δ is the Island 1 (sensing) displacement, and L0 is the
initial length. This initial length was defined as the nucleus-to-nucleus distance of the cell
pair which was measured to be 19.18 ± 0.50 µm (Figure 4.1). We had assumed that
deformation occurred in the region of the cell near the junction, and the region of the cell
behind the nucleus was fully attached to the substrate via cell-ECM adhesion with
negligible deformation. This assumption was validated by tracking the movement of
marker points inside the nucleus region, and the results showed that compared with the
elongation of the region of the cell near to the junction, the region behind the nucleus
remained relatively unmoved (Figure 4-2). Understandably, cells adhered to the device via
discrete focal adhesion spots at the base of the cell, and these adhesions could actively
change during the stretching process. Nevertheless, under large deformation (as the
deformation of the cell pair during the stretch can reach several folds of the initial length),
the influence of the small variation of the initial length on the calculated stress-strain
relationships can be mitigated. Force was calculated using Hooke’s Law, F = kδ, where k

57
is the sensing island stiffness obtained from the AFM experiment. The effective
engineering stress was defined by dividing the calculated force by the cross-section area of
the junctional region, following the same concept adopted by previous studies on epithelial
monolayers (53). The cross-section area was treated as the junction length multiplied by
the thickness of the cell-cell contact region. The measured data showed that the cell-cell
junction length varied significantly from one cell pair to another. Thus, the length data
obtained from the processing of the cell doublet images in each stretch test was used. The
cell-cell contact region was found to be 10.24 µm in thickness with limited variations
measured from confocal z-stack imaging (Figure 4.1C). The length of the junction is
determined by measuring the length of the cell-cell contact with GFP-tagged E-cadherin,
the nucleus-to-nucleus distances are calculated by examining the center-of-mass for the
nucleus DAPI staining, and the thickness of cell-cell junctions are measured by examining
the z-stack images of a single junction on a TPP-printed scaffold to determine the number
of images in which the junction is in focus.

58
Figure 4.1. Cell-cell junction dimension quantification and analysis. A, B) A cell pair adhered
well on the device with a cell-cell junction within the gap. The junction length was measured through the
junction line which is determined with the GFP-tagged E-cadherin. The nucleus-to-nucleus distances are
examined by DAPI staining. C) Z-stack images of a cell-cell junction for thickness measurement (scale bar
= 20 μm). To determine the junction thickness, cells were deposited in bowtie structures and allowed to form
junctions overnight. Then, z-stack images were taken of each bowtie structure with a cell-cell pair with a
spacing of 1 μm between each image. To find the thickness of the junction, the image with the bottom of the
junction in focus was determined, and then each image after was examined until the top of the junction was
just out of focus. From here the thickness was determined based on the number of images between these
identified images (from 2 to 12). Based on the new values, we changed our assumption for the junction area
in stress calculation and recalculated all previous data. D) Cell-cell junction length, thickness, and the
nucleus-to-nucleus distance were measured and plotted (n = 45 for junction length measurements, n = 20 for
thickness measurements, and n = 52 for nucleus-to-nucleus (N-N) distance measurements).
We chose to define the initial length as the distance between the nuclei based on
some observations during the stretching process. We observed that regions of the cell

59
nearest to the junction deformed the most, while regions behind the nucleus remained
relatively unmoved. To show that the region behind the nucleus is almost intact during the
stretch test, we analyzed the change in displacement of a distinctive spot as a marker with
respect to the edge of the bowtie, LM(t), and compared it with the displacement difference
of the two movable islands, L(t). As shown by the representative frames of a stretch test
example, the marker, approximately in the region of the cell nucleus, was displaced only
slightly from its original position relative to the edge of the bowtie (LM(0)) and the
maximum LM(t) reaches only 1.8 µm as compared to the maximum of L(t) at 47.5 µm.
Therefore, we assumed that the cell is fully anchored behind the nucleus, and while there
may be some adhesions on the side near the junction, the majority of the deformation
happens in this region, and these adhesions are most likely ruptured first, making this
assumption more accurate. We do understand this assumption is not perfect and that there
are a number of confounding factors to introduce error into the strain calculation. However,
under large deformation (as the deformation of the cell pair during the stretch can reach
several folds of the initial length), the influence of these errors on the calculated stress-
strain relationships is mitigated.
Figure 4.2. Initial length calculation. A-D) Selected frames from an example stretch test
showing the displacement of the upper island with respect to the lower island, L(t), and the displacement of
a marker close to the nucleus of the cell on the upper island with respect to the edge of the bowtie, LM(t). E)
Plot of the displacement change over the course of the stretch test for L(t) and LM(t). Scale bar = 20 μm.

60
A modified version of MATLAB digital image correlation (DIC) was used to
analyze the frames from the stretch test. The first frame was considered as the reference
and the rest of the frames were compared to the reference frame to calculate the
displacement of each island. A region of interest with markers within the region was
defined for both islands. Then, the MATLAB code calculated the markers’ new coordinates
with respect to the first frame, from which the displacement of the islands was calculated
(Figure 4.3).

61
Figure 4.3. Stress-strain curve calculation from the capture video frame of mechanical testing.
A) Four representative frames showing the initial and new markers for displacement tracking. B) Parameters
definition for strain and stress calculation. C) A representative stress-strain curve.
To interrogate the mechanical behavior of the cell-cell junction, we stretched the
junction by displacing Island 2 at different rates. We examined four strain-rates ranging

62
from 0.005 s-1 to 0.5 s-1 and observed different modes of stress relaxation and cell-cell
adhesion failure that are strongly strain-rate dependent. We first stretched the cell pair at a
strain rate of about 0.005 s-1 (100 nm/s in displacement rate) and observed that none of the
junctions failed at the end of the 50 μm displacement. A typical set of time-series images
shows that there is no sign of rupture in the cell-cell junction (Figure 4.4A). The stress-
strain curve exhibits a typical viscoelastic behavior wherein the stress increases nonlinearly
with a decreasing rate as the strain increases, and the cell pairs are elongated to a maximum
strain of 221.8 ± 8.2% at a maximum stress of 1.72 ± 0.73 kPa (Figure 4.4B). Under a
strain rate of 0.05 s-1, cell-cell junctions begin to show some signs of rupture through a
gradual necking process seen in the time-series images and experience a maximum strain
of 217.8 ± 10.0% and stress of 1.09 ± 0.63 kPa at the point of failure (Figure 4.5A, B).
The stress-strain curve shows three different regions: a viscoelastic region, a plateau region
(i.e. necking process), and a linear region up to failure at 217.8% strain. Among all the
stretch tests performed under this strain rate (n > 20), 47% of them resulted in complete
cell-cell adhesion rupture, indicating that 0.05 s-1 may represent a critical strain rate beyond
which stress accumulation induced by mechanical stretching outperforms stress relaxation.
Similar observations can be made from a strain rate of 0.25 s-1 with a less obvious plateau
region, a higher stress level at failure, and more rapid and complete junction failure (Figure
4.6A, B). All stretch tests at the strain rate of 0.25 s-1 resulted in complete junction rupture,
in clear contrast to the 0.05 s-1 strain rate. At a strain rate of 0.50 s-1, the stress-strain curve
starts with a viscoelastic region, followed by a linear region up to the rupture point. A stress
level of 3.04 ± 1.36 kPa was observed at the failure point and junctions failed at 215.1 ±
37.4% strain (Figure 4.7A, B). The gradual disappearance of the plateau region from low

63
strain rate to high strain rate tests suggests stress accumulation at high strain rate due to
lagging and inadequate stress relaxation.
Our tensile tests demonstrate that the cell pair can withstand a remarkably large
strain level before the cell-cell junction completely ruptures. This clearly contrasts with data
obtained from suspended cell doublets without a mature cell-cell adhesion using dual
micropipette aspiration (DPA), in which cadherin bonds rupture at small strain and low
levels of stress(226). Under low strain rates, the cell-cell junction remains largely intact
even when the strain is higher than 200%. Comparing with the 0.50 s-1 strain rate, the lower
maximum stress under the strain rate of 0.005 s-1, where cell-cell adhesion complexes
remain largely intact, indicates the existence of another effective stress dissipation scheme
inside cells. Considering the dynamic nature of cytoskeletons among all the intracellular
structures, we speculate that the mechanical stress is dissipated via the remodeling and
reorganization of their cytoskeletons. However, under high strain rates, the cell pair
dissipates stress primarily through the dissociation of cell-cell adhesion complexes and
complete breakage occurs at a strain level of ~200%. In addition, all failures occur at the
cell-cell contact symmetrically through the rupture of the cell-cell adhesion complex, as
observed from stretching tests at different strain rates (Figure 4.8). The image series of the
tensile test (Figures 4.4A, 4.5A, 4.6A, 4.7A) and the zoom-in images of the cell-cell
adhesion region (inset of Figures 4.4B, 4.5B, 4.6B, 4.7B) show the decrease in length of
the mutual cell junction until complete separation, suggesting intermediate bond
dissociation accompanying the straining process which leads to ultimate cell adhesion
complex failure. The absence of asymmetrical failure, potentially at the cytoskeleton to cell
membrane tether at one side of the cell pair, implies that the cell-cell adhesion complex

64
represents the weakest link in the cytoskeleton-cell adhesion-cytoskeleton system.
Moreover, the rupture of the cell-cell junction occurs gradually at lower strain rates, like
unzipping a zipper, with localized snap and retraction of the cytoskeleton near the failure
point at the edge of the cell-cell contact.
Figure 4.4. Representative image frames and the corresponding stress-strain curves for stretch
tests performed at strain rates of 0.005 s-1. Average stress-strain curve (Avg. stress, dotted line) ± standard
deviation (blue region) (223).
Figure 4.5. Representative image frames and the corresponding stress-strain curves for stretch
tests performed at strain rates of 0.05 s-1. Average stress-strain curve (Avg. stress, dotted line) ± standard
deviation (blue region) (223).

65
Figure 4.6. Representative image frames and the corresponding stress-strain curves for stretch
tests performed at strain rates of 0.25 s-1. Average stress-strain curve (Avg. stress, dotted line) ± standard
deviation (blue region) (223).
Figure 4.7. Representative image frames and the corresponding stress-strain curves for stretch
tests performed at strain rates of 0.50 s-1. Average stress-strain curve (Avg. stress, dotted line) ± standard
deviation (blue region) (223).

66
Figure 4.8. A representative time-lapse series of frames show the cell junction ruptured
symmetrically under an increasing strain. The arrowhead indicates the cell-cell junction in each frame.
Scale bar: 20 µm.
4.2. A mechanosensing constitutive model for the viscoelastic behavior of a cell pair
The stress-strain relationships from the four types of tensile tests of varied strain
rates can be well fitted with an empirical exponential growth function plus a linear
function: 𝜎 = −𝐴𝑒−𝐵𝜀 + 𝐶𝜀, supporting an overall viscoelastic behavior (Figures 4.4,
4.5, 4.6, and 4.7). Considering that the cell membrane deforms along with their
intracellular components when a pair of cells are stretched, the standard linear solid (SLS)
model (Figure 4.9A), consisting of a Maxwell branch and an elastic branch, is the simplest
model that can effectively capture such a viscoelastic behavior.

67
Figure 4.9. Fitting the stress-strain curves with the Standard Linear Solid (SLS) model. A)
Diagram of the SLS model. B) The predicted spring constant E2 as a function of the strain rate. The equation
for the SLS model: �̇�𝑡𝑜𝑡 +𝐸2
𝜂𝜎𝑡𝑜𝑡 =
𝐸1𝐸2
𝜂𝜀𝑡𝑜𝑡 + (𝐸1 + 𝐸2)𝜀�̇�𝑜𝑡 can be solved for a constant strain rate: 𝜎𝑡𝑜𝑡 =
𝜂𝜀�̇�𝑜𝑡 (1 − 𝑒(−
𝐸2𝜂
𝑡)) + 𝐸1𝜀𝑡𝑜𝑡. This equation was used to fit the stress-strain curves at strain rates: 0.005 s-1,
0.05 s-1, 0.25 s-1 and 0.5 s-1.
The SLS model has been widely used to model the mechanical responses of
suspended cells, where the Maxwell branch represents the intracellular components while
the elastic branch represents the plasma membrane (227). Since minimal deformation of
the cell nuclei was observed even at a strain level as large as 200% in our tensile tests, we
expect that the elastic element in the Maxwell branch is primarily contributed by the
cytoskeleton. Although the SLS model can reproduce the general shape of the stress-strain
relationships, it predicts that the elastic modulus of the spring in the Maxwell branch
increases with the increase in the strain rate (Figure 4.9B). This prediction is in
contradiction to the fact that cytoskeleton growth hardly occurs at high strain rates given
the limited response time. Alternatively, we modified the SLS model by incorporating a
mechanosensing component to account for the stress dissipation mediated by cytoskeleton
remodeling (228, 229). As shown in Figure 4.10A, the spring with Young’s modulus of

68
E1 represents the cell membrane while the second spring with Young’s modulus of E2 and
the dashpot with the viscosity of η represent the elastic and viscous elements of intracellular
components, respectively. The viscous component is contributed by the combined effect
of cytoplasmic and cytoskeleton friction (230). The cytoskeleton of adherent cells
constantly undergoes reorganization through dynamic assembly and disassembly to
maintain its mechanical homeostasis in response to the tensile load. We expect that the
elastic element of intracellular components is primarily contributed by the cytoskeleton,
and E2 can be considered as the collective moduli of all stress fibers that sustain the load
and should be proportional to the number of individual stress fibers within the plane
perpendicular to the stretching direction, as demonstrated by the inset in Figure 4.10A.
The value of 𝐸2 should be collectively determined by the cell-cell junction length and cell-
cell adhesion complex density. The continuous growth of the cytoskeleton is expected to
lead to an increase in the resting length of the second spring, which could partially or even
completely relax the passive stress (𝜎𝑆2) resulting from stretching:
𝜎𝑆2 = 𝐸2(𝜀𝑆2 − 𝜀0) (4-1)
where 𝜀𝑆2 and 𝜀0 are the total strain of the second spring and the strain resulting
from the continuous growth of the cytoskeleton, respectively. We relate the cytoskeleton
growth rate with the strain rate of the second spring through a model parameter 𝛼:
𝜀0̇ = 𝛼𝜀�̇�2 (4-2)
where 0 ≤ 𝛼 ≤ 1. When 𝛼 = 0, 𝜀0̇ = 0, suggesting that the cytoskeleton does not
grow at all, which corresponds to stretch with a very high strain rate. When 𝛼 = 1, equation
(4-2) reduces to 𝜀0̇ = 𝜀�̇�2, indicating that the growth of the cytoskeleton is able to
completely release the passive stress, which could occur under stretch with an extremely

69
low strain rate. Therefore, 𝛼 can be considered as an effective parameter to indicate the
growth level of the cytoskeleton during the stretch test and thus the stress dissipation
efficiency. The model predicts the following time-dependent relationship between stress
(𝜎𝑡𝑜𝑡) and strain (𝜀𝑡𝑜𝑡):
�̇�𝑡𝑜𝑡 +
(1 − 𝛼)𝐸2
𝜂𝜎𝑡𝑜𝑡
= [𝐸1 + (1 − 𝛼)𝐸2]𝜀�̇�𝑜𝑡 +(1 − 𝛼)𝐸1𝐸2
𝜂𝜀𝑡𝑜𝑡
(4-3)
Under a constant strain rate condition, Eqn. (3) yields:
𝜎𝑡𝑜𝑡 = 𝐸1𝜀𝑡𝑜𝑡 + 𝜂𝜀�̇�𝑜𝑡 [1 − exp (−
(1 − 𝛼)𝐸2
𝜂
𝜀𝑡𝑜𝑡
𝜀�̇�𝑜𝑡)]
(4-4)
As shown in Figure 4.10B, C, equation (4-4) can robustly capture the viscoelastic
responses of cells under different strain rates. Fitting the stress-strain curves obtained in
our stretch tests with Eqn. (4) allows us to predict how 𝐸1, (1 − 𝛼)𝐸2 and 𝜂 vary with the
strain rate.
Our model predicts that 𝐸1 is independent of the strain rate and has an average value
of ~1.2 kPa (Figure 4.10D), which is consistent with previously reported values (230, 231).
The viscosity 𝜂 is predicted to monotonically decrease with the strain rate (Figure 4.10E),
suggesting that the cytoplasm is a shear-thinning material. Such a shear-thinning feature
has been identified for the cytoplasm of several other types of cells previously(232, 233).
Plotting the predicted viscosity against the strain rate in a logarithmic scale reveals that the
mechanical behavior of the cytoplasm can be approximated as a power-law fluid following
the Oswald equation, i.e. 𝜂 = 𝐾𝜀̇(𝑛−1), with the exponent of 𝑛 = −0.104 (Figure 4.10G).
In general, shear thinning is caused by flow-facilitated disentanglement of polymer chains,
which is consistent with the expected enhanced alignment of cytoskeleton structures after

70
cells are subjected to uniaxial stretching (234). Since the cells are expected to have similar
cytoskeleton structures to start with, we can directly compare the stress dissipation
efficiency mediated by the cytoskeleton growth by assuming that 𝐸2 has the same value.
The predicted decrease in 𝛼 from low strain rate to high strain rate suggests that the stress
dissipation efficiency decreases with strain rate as a result of reduced cytoskeleton growth
(Figure 4.10F). The predicted rate-dependent growth of the cytoskeleton is supported by
the clear difference in the residual plastic strain after releasing the tensile load in our
hysteresis tests (Figure 4.10H). We stretched the cell pair under two different strain rates
(0.005 s-1 and 0.50 s-1) to a strain level of about 40% and then completely released the
mechanical load. The cell pair stretched under the strain rate of 0.005 s-1 resulted in a plastic
strain of ~20%. However, less than 10% plastic strain is observed for the cell pair stretched
under the strain rate of 0.50 s-1, suggesting limited cytoskeleton growth under the high
strain rate.

71
Figure 4.10. Strain rate-dependent and actomyosin contractility-controlled viscoelastic behavior
of the cell pair. A) Diagram of the modified standard linear solid (MSLS) model that was used for fitting
the experimental data. B, C) The stress-strain curves obtained by applying stretch at different strain rates
(0.005 s-1, 0.5 s-1, 0.25 s-1, and 0.50 s-1) were fitted using Eqn. (4-4) according to the MSLS model. D, F)
Box plots comparing the values of 𝐸1 (d), η (e), and 𝛼 (f) obtained from fitting the stress-strain curves using
Eqn. (4-4) for different strain rates. G) The predicted viscosity is plotted with respect to the strain rates in a
log-log scale. H) Hysteresis analysis is shown by recording the stress-strain relationship following a full
cycle of application and release of tensile load on a cell pair at two strain rates (0.005 s-1 and 0.50 s-1). For
each box plot, the number of experiments is indicated on top of each graph. *: p<0.05, **: p<0.01, ***:
p<0.001 (223).

72
We next subjected the cell pair to cellular contractility modulators, RhoA Activator
I: CN01, and myosin II inhibitor: blebbistatin (Bleb), to examine the impact of actomyosin
activity on the mechanical behavior of the cell pair under mechanical stress. Stress-strain
curves collected at a strain rate of 0.005 s-1 show a clear contrast between samples treated
with CN01, Bleb, and DMSO control. Investigation of cellular contractility was performed
using CN01, control DMSO, and Bleb with a 0.005 s-1 (100 nm/s) strain rate, and
representative frames are shown in Figure 4.11. Control DMSO compared to control at
0.005 s-1 showed a sign of rupture because of DMSO (Figure 4.11A). CN01 increased the
stress level and rupture did not occur in this test (Figure 4.11B). Since Bleb inhibits the
myosin II pathway, the cell-cell adhesion junction ruptured at the initial stages and the
stress level was low compared to other conditions (Figure 4.11C). Specifically, CN01
raises the overall stress level compared with controls at the same strain, while Bleb reduces
the stress accumulation (Figure 4.12A). The stress-strain curves were then analyzed using
the constitutive model. As expected, 𝐸1 stays the same for all conditions (Figure 4.12B).
Enhancement of actomyosin contractility by CN01 significantly increases 𝜂 and 𝐸2, while
Bleb reduces both of them (Figure 4.12C, D). The increase (decrease) in both 𝜂 and 𝐸2 by
CN01 (Bleb) is consistent with the enhanced (reduced) stress fiber formation.
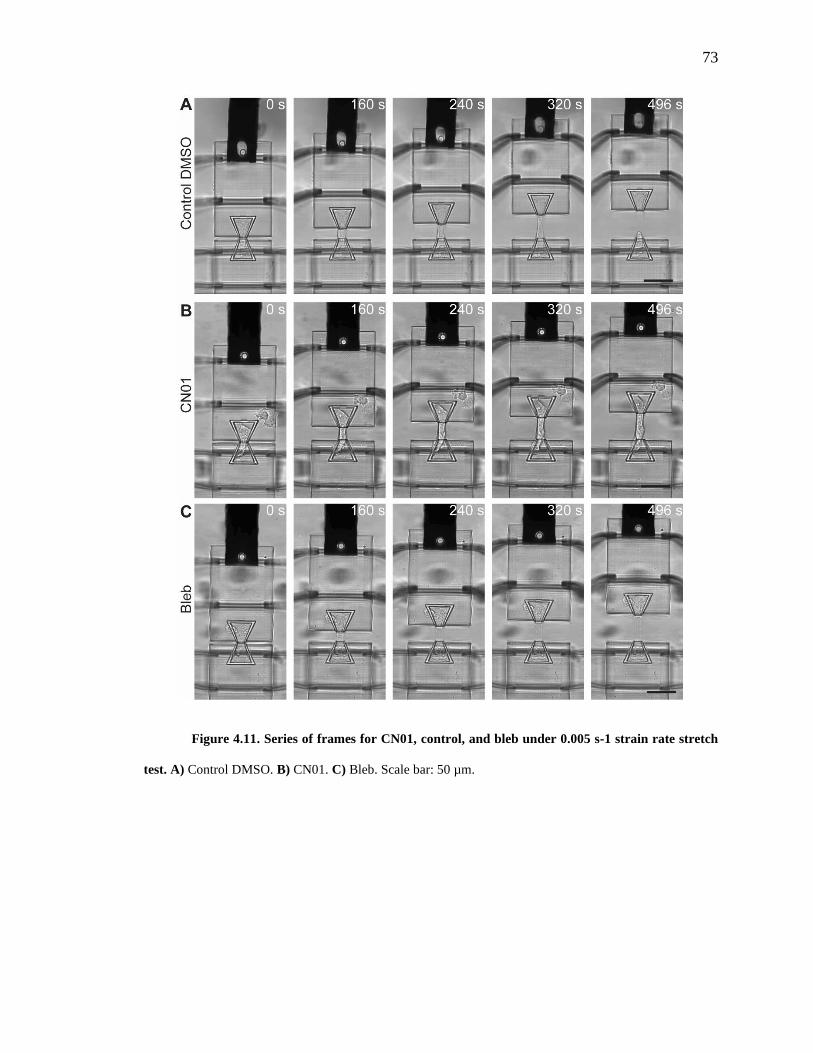
73
Figure 4.11. Series of frames for CN01, control, and bleb under 0.005 s-1 strain rate stretch
test. A) Control DMSO. B) CN01. C) Bleb. Scale bar: 50 µm.

74
Figure 4.12. The effect of cytoskeleton dynamic on the stretch test. A) The stress-strain curves
obtained by stretching cells treated with CN01, Bleb, and DMSO control at a rate of 0.005 s-1 are fitted using
Eqn. (4-4). B-D) Box plots comparing the values of 𝐸1 (B), η (C), and 𝐸2 (D) obtained from fitting the stress-
strain curves for cells treated with CN01 and Bleb using Eqn. (4-4). For each box plot, the number of
experiments is indicated on top of each graph. *: p<0.05, **: p<0.01, ***: p<0.001 (223).
It is worth mentioning that the stress increase induced by CN01 can be partially
suppressed by subsequent addition of ROCK inhibitor, exhibiting a reverse effect on the
contractility modulation which can be captured dynamically by our SCAµTT platform
(Figure 4.13). Collectively, our data support the idea that stress dissipation is facilitated
by the actin filament growth during tensile loading conditions.

75
Figure 4-13. Reversal of the stress modulation effect of a RhoA activator by ROCK inhibitor.
A) Temporal evolution of the force sustained by a cell pair in response to CN01 (1 unit/ml) while maintaining
a constant strain of 0.5. B) Temporal evolution of the force sustained by a cell pair in response to sequential
addition of CN01 (1 unit/ml) and ROCK inhibitor while maintaining a constant strain of 0.5.
4.3. Cadherins strengthening and rupture under rate-dependent stretch of cell-cell
junction
We attribute the observed necking process to the rupture of cell-cell adhesion
bonds, which is most apparent under the intermediate strain rate. A few cadherin bonds are
ruptured in discrete steps at the edge of the cell-cell junction, which corresponds to a small
drop in the measured forces in the force-displacement curve (Figure 4.14). To investigate
the bond rupture, we selected a representative example of the stretch tests at the strain rate
of 0.05 s-1 with obvious regions of junction rupture followed by stiffening, which is
represented by each drop and rise in the curve (Figure 4.14A). The rupture of bonds
releases the force in the stress fibers that were in direct connection with the bonds and
locally relaxes the stretched cell membrane, consequently leading to a drop of the measured
force. One representative region of interest (ROI) is plotted in Figure 4.14B, in which a
total force drop of 5 nN and a junction length reduction of ~3 µm were observed for an
approximately 490 nm displacement. Correspondingly, a total of ten image frames were

76
captured showing the snap and retraction of the cytoskeleton at the edge of the cell-cell
junction (Figure 4.14C), and each discrete snap motion corresponds to a small drop in
force. Considering the strength of a single cadherin bond of around 40 pN (235), this
decline is the result of rupturing about a few hundred cadherin bonds in each discrete event
with a resolution of a few bonds.
The bond dissociation events also exhibit strong strain-rate dependency. First, at a
very low strain rate, the absence of bond rupture may be attributed to cadherin
strengthening. This is confirmed by the clustering of GFP-tagged E-Cad when the cell
doublet is subject to low levels of strain (<100%) at the strain rate of 0.05 s-1 (Figure 4.15).
It has been observed that cadherin bond clustering in epithelial cells under tensile load
occurs in a time scale of minutes, right in line with the time span of a low strain rate tensile
test (about 10 minutes)(40). Second, the critical stress level at which cadherin bonds show
initial signs of dissociation increases significantly with increasing strain rate (Figure
4.14D). As shown in Figure 4.14E, the initiation of bond rupture events occurs at similar
strain levels of around 100% for all three strain rates. However, the critical stress is
significantly higher for 0.50 s-1 (4.04 kPa) compared with 0.5 s-1 and 0.25 s-1 (0.99 kPa and
1.72 kPa, respectively).

77
Figure 4.14. Cadherin bond rupture exhibits rate-dependent behavior during strain-rate
controlled stretch. A) A representative force-displacement curve obtained at a strain rate of 0.05 s-1 is
shown. Inset shows the zoom-in of the portions of the force-displacement curve indicated in the box. B, C)
The force-displacement curve (black curve) and junction length (blue curve) (B) within the region of interest
(ROI) in the inset of a are shown, with the outline of each cell traced in corresponding frames (C). The overlay
in c shows the change in cell-cell junction length and shape of each cell (dark red in the first frame and light
red in the last frame). D, E) Stress levels (D) and strain levels (E) at which the initiation of bond rupturing

78
occurs for the tensile tests at different strain rates: 0.05 s-1 (n = 13), 0.25 s-1 (n = 16), and 0.50 s-1 (n = 7).
*: p<0.05. Scale bars: 25 µm in the inset of C (223).
Figure 4.15. E-cadherin clustering in cell-cell junction under applied strain. A) Under 0 strain,
A431 GFP-tagged E-cadherin cells have a little expression of E-cadherin at cell-cell junction. B-E) As strain
is increased to 10, 25, 50, and 100, respectively, E-cadherin signal increases at the cell-cell junction,
indicating clustering of E-cadherin in response to stretch. F) At 150 strain E-cadherin begins to retract from
the cell-cell contact. Scale bar: 20 µm.
Considering the time span of a few seconds for a tensile test at the strain rate of
0.50 s-1, bond clustering may not be the main contributor to the observed increase in the
critical stress. On the other hand, the observed increase in the strength of cadherin bonds
agrees well with previous reports from single molecule force microscopy studies of E-Cad
bonds, which showed that the peak rupture force in E-Cad bonds increases logarithmically
with the loading rate (235, 236). Knockdown of E-Cad by siRNA resulted in a decrease in
the overall stress level during the strain application. To determine the E-cadherin bond
effect on the stress-strain curve and bond rupture initiation, E-cadherin siRNA was
transfected into A431 GFP-tagged E-cadherin cells. Transfection of E-cadherin siRNA
(SCBT; SC35242) and control siRNA (SCBT; SC37007) were performed using
Lipofectamine RNAiMAX Transfection Reagent (Invitrogen), according to the
manufacturer’s protocol. The expression of GFP was analyzed by fluorescence microscopy

79
after 48h. Full-length human E-cadherin fused at its C-terminus to GFP was constructed
by first inserting an E-cadherin cDNA into pEGFP-N2 (Clontech, Mountain View, CA)
and then inserting the tagged construct into a derivative of the LZRS retroviral expression
vector. The final cDNA construct was fully sequenced to ensure no errors were introduced
during subcloning. Cells were incubated with control siRNA and E-cadherin siRNA both
using the Lipofectamine RNAiMAX reagent. The inhibition of E-cadherin expression was
confirmed by fluorescence microscopy and immunoblotting. A knockdown of E-cadherin
expression could be visualized by fluorescence microscopy after 48 h transfection. Also,
immunoblotting showed that the protein levels of E-cadherin were dramatically decreased
in the E-cadherin siRNA samples (48 h, 72 h, and 96 h) compared to control siRNA. These
results show that E-cadherin siRNA downregulated the E-cadherin expression effectively
(Figure 4.16). Note, since we used A431 cells having GFP-tagged E-cadherin, the
immunoblotting showed two bands for endogenous E-cadherin (120 kDa) and GFP-tagged
E-cadherin (at around 150 kDa due to the addition of GFP of 27 kDa). The control siRNA
sample displayed the same two bands, and E-cadherin siRNA induced decreases in both
bands. Tensile test data (Figure 4.17A-C) compared the control siRNA and E-cadherin
siRNA.

80
Figure 4.16. Confirmation of E-cadherin siRNA silencing. A) A431 GFP-tagged E-cadherin cells
were transfected with control siRNA or E-cadherin siRNA. After 48 h, 72 h, and 96 h post-transfection with
E-cadherin siRNA, expression levels of E-cadherin were decreased in both endogenous E-cadherin (120 kDa)
and GFP-tagged E-cadherin (at around 150 kDa), as assessed by immunoblot. Actin levels were not affected
by the siRNA transfection. B) GFP signal in GFP-tagged E-cadherin A431 cells was observed after 48 h
transfection with control siRNA and E-cadherin siRNA by immunofluorescence.
Figure 4.17. The role of E-cad on the cell stretch test. A-C) Average stress-strain curves (A) as
well as stress levels (B) and strain levels (C) at which the initiation of bond rupturing occurs, for tensile tests
at 0.05 s-1 on cells with E-Cad siRNA knockdown (n = 6) and control siRNA (n = 8). *: p<0.05 (223).

81
Analysis of the stress-strain curves of E-Cad knockdown cell pairs showed a
significant decrease in the critical stress, as compared with controls using control siRNA.
Interestingly, the strain levels at which cadherin bonds initiate unbinding remain
unchanged with E-Cad knockdown (Figure 4.16C). This may suggest that the reduction in
the number of E-Cad bonds decreased the total tension within the cytoskeleton network
and thus the stress level during stretching, while the remaining bonds still rupture at similar
strain levels. Collectively, our results demonstrate that E-Cad adhesions regulate the load-
bearing potential of the cell-cell junction under tensile load and play a major role in the
rate-dependent strengthening of the cell-cell junction.
4.4. Discussion
In this study, we fabricated a polymeric microstructure using TPP for displacement
application and force sensing to examine the rate-dependent mechanical behavior of a
single cell-cell adhesion complex. To faithfully characterize the intricacy of the biophysical
and biochemical response of an individual cell-cell adhesion interface under large strains,
a functional technique needs to fulfill the following requirements. First, it should have a
highly sensitive force sensing component that allows easy quantification of pico- or nano-
newton forces. Second, it should have the capability to apply mechanical strain or stress in
a controlled manner. Third, the testing can be conducted under physiologically relevant
conditions, especially allowing the formation of mature cell-cell junctions and cell-
extracellular matrix (ECM) adhesions. Although several techniques have been developed
for the quantitative assessment of cell-generated forces, including traction force
microscopy (214), elastomer-based micropillar arrays (215), and 3D-printed micro-
scaffolds (209, 216), they are restricted to static observations and unable to apply

82
mechanical stimuli, not to mention strain rate-controlled mechanical stretch. Techniques
do exist to apply mechanical strain to a monolayer of cells, but the stress within individual
cell-cell adhesions cannot be determined (53). Further, when a defined load is applied to
individual cell-cell junctions in studies using AFM-based single-cell force spectroscopy
(SCFS)(222, 237) and DPA (238, 239), it can only be carried out on isolated suspended
cells where mature intercellular junctions are yet to form, and the focus can only be placed
on the separation of cadherin bonds while the effect of stress relaxation of the cytoskeleton
and the cell-ECM interactions are inaccessible (226).
To the best of our knowledge, SCAµTT is the first platform that allows in situ
interrogation of the stress-strain characteristics of a mature cell-cell junction through
defined strain and strain rate, promoting a paradigm shift in the mechanical characterization
of cell-cell adhesions. Besides the capabilities discussed above, the throughput for mature
cell-cell junction interrogation is also increased due to parallel sample preparation and
testing, as the equipment for manipulating or stretching cells does not need to be used to
hold cells in place during junction maturation. The presence of the mature cell-ECM
junction allows for the application of large strains as in DPA, whereas the force sensitivity
of the beams achieves force and displacement resolution comparable to SCFS (10 pN and
50 nm, respectively)(240). Besides its application in the mechanical characterization of
single cell-cell junctions, SCAµTT can also be used to investigate the cytoskeleton
mechanics and dynamics under controlled strains and/or strain rates, as well as in the study
of the crosstalk between cell-cell adhesion and cell-ECM adhesion by incorporating
micropillar array-based TFM into our platform. These studies can be carried out not only

83
on cell doublets but also on single cells and cell monolayers with minimal modification to
the bowtie structure.
The ability of SCAµTT to quantify precisely the stress within a cell doublet at
different strains enables us to decipher the strain rate-dependent behavior of the
cytoskeleton-junction system as part of the adaptive viscoelasticity of epithelial cell-cell
junctions (241). The stress-strain relationship at different strain rates reveals multiple rate-
dependent stress dissipation mechanisms orchestrated by the cytoskeleton and the cell-cell
junction. We showed that the cytoplasm exhibits a passive shear-thinning viscoelastic
behavior following the Oswald equation. This power-law relationship between strain rate
and viscosity suggests that such a passive stress dissipation mechanism plays a significant
role in the stress response, particularly at high strain rates. It is worth mentioning that this
relationship has been identified for the cytoplasm of suspended cells (232, 233), but has
never been shown on adherent cells. In addition, we showed that the active cytoskeleton
remodeling leads to continuous stress relaxation in the network of the cytoskeleton-cell
junction (64). Particularly, loads with a higher strain rate result in limited cytoskeleton
growth, and thus higher stress is accumulated within the network. When stress relaxation
from the cytoskeleton growth fails to catch the increased stress induced by the continuous
increase of the applied strain, a net accumulation of stress occurs. The increase in stress
leads to the gradual unbinding of cadherin bonds to relax the stress at low strain rates. A
robust junction allows a higher capacity for cytoskeleton tension, while a partially ruptured
junction reduces this capacity. Although the expected active cytoskeleton remodeling has
not been confirmed directly with high-resolution immunofluorescence imaging due to the
strong autofluorescence of the printed microstructures on which cells are grown, it has been

84
validated indirectly by both the hysteresis tests and the contractility modulation
experiments using cytoskeleton modulation drugs. Furthermore, as cell-cell adhesion is
intimately coupled with cell-substrate adhesion (71), we expect that changing the ECM
coating may affect the structure of the cell-cell junction and consequently its mechanical
strength. However, we do not expect cell-ECM interaction to fundamentally change its
strain rate-dependent mechanical response.
Directly measuring stress dynamics at a single cell-cell junction captures the real-
time fracture process of junction cadherins at high strain rate. Specifically, we showed that
epithelial cell-cell adhesions are mechanically the weakest linkage in the junction-
cytoskeleton system and they represent the upper limit for the amount of stress that the
system can tolerate before complete junction rupture occurs. However, when the cell-ECM
adhesion is not sufficiently strong, failure is more likely to occur at focal adhesions. We
observed that cells tended to detach from the islands during stretching experiments when a
fibronectin concentration lower than 50 µm/mL was used to functionalize the bowtie
structure. Moreover, we showed that, at high strain rate, stress accumulation cannot be
dissipated fast enough even at low strain levels, and thus characterization of the critical
strain and strain rate at which coordinated stress relaxation and E-Cad clustering can still
be sufficient to mitigate stress buildup and to allow for such a remarkable strain tolerance
is critical to understand epithelial fracture (242). Further, knockdown of E-Cad changed
the strain rate-dependent behavior of the cell-cell junction, agreeing with previous reports
that show E-Cad regulates epithelial viscoelasticity (243). This may also alter the patterns
of cell proliferation and migration, which play important roles in disease outcomes. This

85
suggests that the mechanical interrogation platform could be used for quantifying disease
states and evaluating the effectiveness of treatments.
4.5. Conclusion
In the present work, we developed a mechanical testing platform, SCAµTT, that
can strain the mutual junction of a single cell pair with precisely defined strain and strain
rates while simultaneously recording the junction stress. This platform allows in situ
mechanical characterizations of a mature cell-cell junction under physiologically relevant
conditions and is sensitive enough to resolve bond rupture events with a resolution of a few
bonds. With this innovative platform, we performed strain-rate controlled mechanical
characterization of a single mature cell-cell adhesion junction. We showed that
cytoskeleton growth of the cell doublet could relax the stress buildup and prevent junction
failure at low strain rates. At high strain rates, a synchronized junction failure occurs at
remarkably large strain levels. We expect this platform and our biophysical understanding
to form the foundation for the rate-dependent mechanics of cell-cell junctions.

86
CHAPTER 5
ONGOING PROJECTS
5.1. Stretch and hold analysis of a single cell pair
As one of the applications of the proposed platform, we decided to run some long-
term stretch and hold experiments and interrogate the viscoelastic properties of the cell
pair. After a few experiments, we noticed that cells are being tensed rather than relaxed
after holding them for 30 minutes and the rate and amount of strengthening is strain-rate
dependent. We went through the literature and found that there is a phenomenon called
active remodeling of the cytoskeleton that happened when cells are under tension or
compression. That means, when cells are under tension they try to actively remodel the
cytoskeleton to respond to the external force and strengthen the cell body. In this way, they
become tense and keep the cell shape. As a result, the internal stress increases. We ran this
experiment for different strain rates from 100 nm/s to 10 µm/s and we noticed that at the
lower strain rats, cells relaxed. The hypothesis behind this is that lower strain rates are slow
enough for the cells to adapt to the condition. So, when they are held, there is not much
strengthening while at the higher strain rates, cells have to respond after the stretch (Figure
5.1A, B). To validate this hypothesis, a few drugs have been rested on the cells. CN01
increases the stress level by activating RhoA. ROCK inhibitor decreases this activity but
after about 300 seconds, cells started to remodel. Lat B completely disrupted the
cytoskeleton. Therefore, cells couldn't remodel and stress levels decreased (Figure 5.1 C,
D).

87
Figure 5.1. Active remodeling of the cytoskeleton. A) Strain changes during the stretch and hold
for different strain rates. B) Stress changes during the stretch and hold experiment for different strain rates.
C) Strain changes during the stretch and hold for different drugs. D) Strain changes during the stretch and
hold for different drugs.
5.2. Characterization of IP-Visio microfibers
Nanoscribe company recently introduced a new material for their printers which
has much less autofluorescent compared to IP-S. This material has the potential of being
widely used in biological experiments. However, there is no document showing its
mechanical properties. With our novel device, we printed microfibers of IP-Visio between
the gap and stretched them. This experiment resembles the tensile test of steel but in micro-
levels. Having the displacement of the sensor, we were able to characterize the mechanical

88
properties of the fibers from their stress-strain curves. The effect of printing parameters
such as writing speed as well as geometry parameters such as width and depth of the beam
have been analyzed. Figure 5.2 shows a representative image and its corresponding plates’
movement.
Figure 5.2. Mechanical characterization of microfibers. A) The first frame of the tensile test. B)
The frame at the end of the tensile test. C) Upper plate displacement. D) Lower plate displacement.
5.3. PV screening of a single cell pair
We recently published a paper on the effect of mechanical stimulus on the life‐
threatening autoimmune blistering disease Pemphigus Vulgaris (PV). We showed that
externally applied mechanical stress mitigates antibody‐induced monolayer fragmentation
and inhibits p38 MAPK phosphorylation activated by the anti‐Dsg3 antibody. In this study,
we used a monolayer of cells and stretched it in a PDMS cell culture chamber. Now we
decided to apply the stress to a cell pair and try different anti-bodies to skin cells (HaCaT).

89
In this project, we are planning to run a stretch test until rupture, stretch and hold, AFM,
and immunostaining at different conditions. Figure 5.3 shows a representative curve from
the stretch test. As it can be seen, the force level is much more than cancerous cells (A431).
Figure 5.3. A representative curve from the stretch test of skin cells.
5.4. Desmoplakin mutation of the cell-cell junction
Desmoplakin is one of the proteins at the desmosome junction which plays an
important role in maintaining the junction and keep the tissue integrity. In this experiment,
we want to show this role quantitatively and at the cell level. The efficiency of the
desmoplakin mutation is very low and we don’t know whether the cells being stretched are
muted or not. One way to make sure is to tag this protein with a color. With the current
advances in the polymer for printing, we can detect the mutation and then run the stretch
test. In this way, we will increase the efficiency and gather solid data. For this study, we
will use A431 cells which are suppressed or overexpressed desmoplakin. The addition of
doxycycline will induce the expression or mutation. Figure 5.4 shows the effect of this
induction on the cells.

90
Figure 5.4. mutation and overexpression of desmoplakin in A431 cells (219).
5.5. Traction force microscopy of the cell pair during the stretch test
During the stretch and hold experiments, we noticed that in addition to
strengthening the junction and cytoskeleton, cells were anchoring more points to the
substrate and trying to expand themselves. One way to measure these traction forces is by
growing cells on an array of micropillars. So we modified our design in a way that we can
measure the traction forces simultaneously with the adhesion forces. We added the array
of pillars between the bowtie region and repeated the experiment. By tracking the pillars
bending for each frame, we can correlate the stress-strain curve with the traction force.
Figure 5.5 shows the concept and fabricated design.

91
Figure 5.5. Traction force microscopy of the cell pair on the platform. A) Isometric view of the
modified structure. B) Micropillars within the bowtie region. C) Top view of the fabricated structure. D)
Micropillars within the bowtie
5.6. Application of FRET sensors to study the mechanotransduction pathway
The other application of the platform is to study the mechanotransduction pathway
of cells subjected to external stress. To do this, we engineered FRET sensors to different
proteins within the complex of cell junction and cytoskeleton.

92
REFERENCES
1. N. Wang, J. D. Tytell, D. E. Ingber, Mechanotransduction at a distance: mechanically coupling
the extracellular matrix with the nucleus. Nat. Rev. Mol. Cell Biol. 10, 75-82 (2009).
2. J. D. Humphrey, E. R. Dufresne, M. A. Schwartz, Mechanotransduction and extracellular
matrix homeostasis. Nat. Rev. Mol. Cell Biol. 15, 802-812 (2014).
3. T. J. Kirby, J. Lammerding, Cell mechanotransduction: Stretch to express. Nat Mater 15, 1227-
1229 (2016).
4. B. D. Riehl, J. H. Park, I. K. Kwon, J. Y. Lim, Mechanical stretching for tissue engineering:
two-dimensional and three-dimensional constructs. Tissue Eng Part B Rev 18, 288-300 (2012).
5. D. E. Ingber, Mechanical control of tissue morphogenesis during embryological development.
Int. J. Dev. Biol. 50, 255-266 (2006).
6. S. A. Gudipaty et al., Mechanical stretch triggers rapid epithelial cell division through Piezo1.
Nature 543, 118-121 (2017).
7. H. Wolfenson, B. Yang, M. P. Sheetz, Steps in Mechanotransduction Pathways that Control
Cell Morphology. Annu Rev Physiol 81, 585-605 (2019).
8. B. Ladoux, W. J. Nelson, J. Yan, R. M. Mege, The mechanotransduction machinery at work at
adherens junctions. Integr. Biol. (Camb.) 7, 1109-1119 (2015).
9. W. Y. Wang, C. D. Davidson, D. Lin, B. M. Baker, Actomyosin contractility-dependent matrix
stretch and recoil induces rapid cell migration. Nat Commun 10, 1186 (2019).
10. G. Charras, A. S. Yap, Tensile Forces and Mechanotransduction at Cell-Cell Junctions. Curr.
Biol. 28, R445-R457 (2018).
11. J. M. Anderson, C. M. Van Itallie, Physiology and function of the tight junction. Cold Spring
Harb. Perspect. Biol. 1, a002584 (2009).
12. N. M. Kumar, N. B. Gilula, The gap junction communication channel. Cell 84, 381-388 (1996).
13. N. J. Severs et al., Gap junction alterations in human cardiac disease. Cardiovasc. Res. 62, 368-
377 (2004).
14. T. J. Harris, U. Tepass, Adherens junctions: from molecules to morphogenesis. Nat. Rev. Mol.
Cell Biol. 11, 502-514 (2010).
15. B. W. Benham-Pyle, B. L. Pruitt, W. J. Nelson, Cell adhesion. Mechanical strain induces E-
cadherin-dependent Yap1 and beta-catenin activation to drive cell cycle entry. Science 348,
1024-1027 (2015).
16. L. L. Witcher et al., Desmosomal cadherin binding domains of plakoglobin. J. Biol. Chem.
271, 10904-10909 (1996).
17. J. Waschke, The desmosome and pemphigus. Histochem. Cell Biol. 130, 21-54 (2008).
18. H. J. Choi, W. I. Weis, Structure of the armadillo repeat domain of plakophilin 1. J. Mol. Biol.
346, 367-376 (2005).
19. A. Monemian Esfahani et al., Tissue Regeneration from Mechanical Stretching of Cell-Cell
Adhesion. Tissue Eng Part C Methods 10.1089/ten.TEC.2019.0098 (2019).
20. J. L. Maitre, C. P. Heisenberg, Three functions of cadherins in cell adhesion. Curr. Biol. 23,
R626-633 (2013).
21. S. Yamada, W. J. Nelson, Localized zones of Rho and Rac activities drive initiation and
expansion of epithelial cell-cell adhesion. J. Cell Biol. 178, 517-527 (2007).
22. K. Manibog, H. Li, S. Rakshit, S. Sivasankar, Resolving the molecular mechanism of cadherin
catch bond formation. Nature Communications 5 (2014).
23. W. A. Thomas et al., alpha-Catenin and vinculin cooperate to promote high E-cadherin-based
adhesion strength. J. Biol. Chem. 288, 4957-4969 (2013).
24. M. Yao et al., Force-dependent conformational switch of α-catenin controls vinculin binding.
Nature Communications 5 (2014).

93
25. H. B. Jean-Léon Maître, 2,3 Simon Frederik Gabriel Krens,1 Guillaume Salbreux,2 Frank
Jülicher,2 Ewa Paluch,4* Carl-Philipp Heisenberg, Adhesion Functions in Cell Sorting by
Mechanically Coupling the Cortices of Adhering Cells. Science (2012).
26. N. Rohani, L. Canty, O. Luu, F. Fagotto, R. Winklbauer, EphrinB/EphB signaling controls
embryonic germ layer separation by contact-induced cell detachment. PLoS Biol. 9, e1000597
(2011).
27. E. Tabdanov, N. Borghi, F. Brochard-Wyart, S. Dufour, J. P. Thiery, Role of E-cadherin in
membrane-cortex interaction probed by nanotube extrusion. Biophys. J. 96, 2457-2465 (2009).
28. H. Wang, Y. Q. Huo, Adhesion Molecules and Atherosclerosis. Atherosclerosis: Molecular
and Cellular Mechanisms Book_Doi 10.1002/9783527629589, 43-62 (2010).
29. K. Sundfeldt, Cell-cell adhesion in the normal ovary and ovarian tumors of epithelial origin;
an exception to the rule. Mol. Cell. Endocrinol. 202, 89-96 (2003).
30. E. Lozano, M. Betson, V. M. Braga, Tumor progression: Small GTPases and loss of cell-cell
adhesion. Bioessays 25, 452-463 (2003).
31. G. Berx et al., E-cadherin is inactivated in a majority of invasive human lobular breast cancers
by truncation mutations throughout its extracellular domain. Oncogene 13, 1919-1925 (1996).
32. L. Ding et al., Genome remodelling in a basal-like breast cancer metastasis and xenograft.
Nature 464, 999-1005 (2010).
33. N. A. Najor, Desmosomes in Human Disease. Annu. Rev. Pathol. 13, 51-70 (2018).
34. C. Bierkamp, K. J. McLaughlin, H. Schwarz, O. Huber, R. Kemler, Embryonic heart and skin
defects in mice lacking plakoglobin. Dev. Biol. 180, 780-785 (1996).
35. J. E. Lai Cheong, V. Wessagowit, J. A. McGrath, Molecular abnormalities of the desmosomal
protein desmoplakin in human disease. Clin. Exp. Dermatol. 30, 261-266 (2005).
36. C. Buckley, J. Y. Tan, W. Weis, W. J. Nelson, A. Dunn, The Minimal Cadherin-Catenin
Complex Binds to Actin Filaments under Force. Biophys. J. 108, 11a-11a (2015).
37. J. Jurado, J. de Navascues, N. Gorfinkiel, alpha-Catenin stabilises Cadherin-Catenin complexes
and modulates actomyosin dynamics to allow pulsatile apical contraction. J. Cell Sci. 129,
4496-4508 (2016).
38. D. L. Huang, N. A. Bax, C. D. Buckley, W. I. Weis, A. R. Dunn, Vinculin forms a directionally
asymmetric catch bond with F-actin. Science 357, 703-706 (2017).
39. S. Rakshit, S. Sivasankar, Biomechanics of cell adhesion: how force regulates the lifetime of
adhesive bonds at the single molecule level. PCCP 16, 2211-2223 (2014).
40. C. Bertocchi et al., Nanoscale architecture of cadherin-based cell adhesions. Nat. Cell Biol. 19,
28-37 (2017).
41. J. L. Bays et al., Vinculin phosphorylation differentially regulates mechanotransduction at cell-
cell and cell-matrix adhesions. J. Cell Biol. 205, 251-263 (2014).
42. J. L. Bays, H. K. Campbell, C. Heidema, M. Sebbagh, K. A. DeMali, Linking E-cadherin
mechanotransduction to cell metabolism through force-mediated activation of AMPK. Nat.
Cell Biol. 19, 724-731 (2017).
43. Y. Kametani, M. Takeichi, Basal-to-apical cadherin flow at cell junctions. Nat. Cell Biol. 9,
92-98 (2007).
44. R. Priya, A. S. Yap, G. A. Gomez, E-cadherin supports steady-state Rho signaling at the
epithelial zonula adherens. Differentiation 86, 133-140 (2013).
45. J. S. Bois, F. Julicher, S. W. Grill, Pattern formation in active fluids. Phys. Rev. Lett. 106,
028103 (2011).
46. R. Priya et al., Bistable front dynamics in a contractile medium: Travelling wave fronts and
cortical advection define stable zones of RhoA signaling at epithelial adherens junctions. PLoS
Comput. Biol. 13 (2017).
47. S. K. Wu et al., Cortical F-actin stabilization generates apical-lateral patterns of junctional
contractility that integrate cells into epithelia. Nat. Cell Biol. 16, 167-178 (2014).

94
48. J. F. Joanny, J. Prost, Active gels as a description of the actin-myosin cytoskeleton. Hfsp
Journal 3, 94-104 (2009).
49. Y. Wu, P. Kanchanawong, R. Zaidel-Bar, Actin-delimited adhesion-independent clustering of
E-cadherin forms the nanoscale building blocks of adherens junctions. Dev. Cell 32, 139-154
(2015).
50. M. Smutny et al., Myosin II isoforms identify distinct functional modules that support integrity
of the epithelial zonula adherens. Nat. Cell Biol. 12, 696-U147 (2010).
51. S. Verma et al., A WAVE2-Arp2/3 actin nucleator apparatus supports junctional tension at the
epithelial zonula adherens. Mol. Biol. Cell 23, 4601-4610 (2012).
52. T. P. Wyatt et al., Emergence of homeostatic epithelial packing and stress dissipation through
divisions oriented along the long cell axis. Proc. Natl. Acad. Sci. U. S. A. 112, 5726-5731
(2015).
53. A. R. Harris et al., Characterizing the mechanics of cultured cell monolayers. Proc. Natl. Acad.
Sci. U. S. A. 109, 16449-16454 (2012).
54. K. C. Hart et al., E-cadherin and LGN align epithelial cell divisions with tissue tension
independently of cell shape. Proc. Natl. Acad. Sci. U. S. A. 114, E5845-E5853 (2017).
55. C. Collinet, M. Rauzi, P. F. Lenne, T. Lecuit, Local and tissue-scale forces drive oriented
junction growth during tissue extension. Nat. Cell Biol. 17, 1247-+ (2015).
56. P. Campinho et al., Tension-oriented cell divisions limit anisotropic tissue tension in epithelial
spreading during zebrafish epiboly. Nat. Cell Biol. 15, 1405-+ (2013).
57. E. Walck-Shannon, J. Hardin, Cell intercalation from top to bottom. Nat. Rev. Mol. Cell Biol.
15, 34-48 (2014).
58. J. Prost, F. Julicher, J. F. Joanny, Active gel physics. Nat. Phys. 11, 111-117 (2015).
59. N. Khalilgharibi, J. Fouchard, P. Recho, G. Charras, A. Kabla, The dynamic mechanical
properties of cellularised aggregates. Curr. Opin. Cell Biol. 42, 113-120 (2016).
60. X. Liang, M. Michael, G. A. Gomez, Measurement of Mechanical Tension at Cell-cell
Junctions Using Two-photon Laser Ablation. Bio-protocol 6, e2068 (2016).
61. D. T. Tambe et al., Collective cell guidance by cooperative intercellular forces. Nat Mater 10,
469-475 (2011).
62. J. N. Jodoin et al., Stable Force Balance between Epithelial Cells Arises from F-Actin
Turnover. Dev. Cell 35, 685-697 (2015).
63. R. Clement, B. Dehapiot, C. Collinet, T. Lecuit, P. F. Lenne, Viscoelastic Dissipation Stabilizes
Cell Shape Changes during Tissue Morphogenesis. Curr. Biol. 27, 3132-+ (2017).
64. T. Wyatt, B. Baum, G. Charras, A question of time: tissue adaptation to mechanical forces.
Curr. Opin. Cell Biol. 38, 68-73 (2016).
65. M. Fritzsche, A. Lewalle, T. Duke, K. Kruse, G. Charras, Analysis of turnover dynamics of the
submembranous actin cortex. Mol. Biol. Cell 24, 757-767 (2013).
66. T. Onodera et al., Btbd7 Regulates Epithelial Cell Dynamics and Branching Morphogenesis.
Science 329, 562-565 (2010).
67. T. Sakai, M. Larsen, K. M. Yamada, Fibronectin requirement in branching morphogenesis.
Nature 423, 876-881 (2003).
68. Y. Izu et al., Type XII collagen regulates osteoblast polarity and communication during bone
formation. J. Cell Biol. 193, 1115-1130 (2011).
69. A. Al-Kilani, O. de Freitas, S. Dufour, F. Gallet, Negative Feedback from Integrins to
Cadherins: A Micromechanical Study. Biophys. J. 101, 336-344 (2011).
70. N. Borghi, M. Lowndes, V. Maruthamuthu, M. L. Gardel, W. J. Nelson, Regulation of cell
motile behavior by crosstalk between cadherin- and integrin-mediated adhesions. Proc. Natl.
Acad. Sci. U. S. A. 107, 13324-13329 (2010).
71. M. L. McCain, H. Lee, Y. Aratyn-Schaus, A. G. Kleber, K. K. Parker, Cooperative coupling
of cell-matrix and cell-cell adhesions in cardiac muscle. Proc. Natl. Acad. Sci. U. S. A. 109,
9881-9886 (2012).

95
72. M. von Schlippe et al., Functional interaction between E-cadherin and alpha v-containing
integrins in carcinoma cells. J. Cell Sci. 113, 425-437 (2000).
73. G. Livshits, A. Kobielak, E. Fuchs, Governing epidermal homeostasis by coupling cell-cell
adhesion to integrin and growth factor signaling, proliferation, and apoptosis. Proc. Natl. Acad.
Sci. U. S. A. 109, 4886-4891 (2012).
74. J. T. Parsons, A. R. Horwitz, M. A. Schwartz, Cell adhesion: integrating cytoskeletal dynamics
and cellular tension. Nat. Rev. Mol. Cell Biol. 11, 633-643 (2010).
75. K. L. Mui, C. S. Chen, R. K. Assoian, The mechanical regulation of integrin-cadherin crosstalk
organizes cells, signaling and forces. J. Cell Sci. 129, 1093-1100 (2016).
76. N. Borghi et al., E-cadherin is under constitutive actomyosin-generated tension that is
increased at cell-cell contacts upon externally applied stretch. Proc. Natl. Acad. Sci. U. S. A.
109, 12568-12573 (2012).
77. B. W. Benham-Pyle, B. L. Pruitt, W. J. Nelson, Mechanical strain induces E-cadherin–
dependent Yap1 and β-catenin activation to drive cell cycle entry. Science 348, 1024-1027
(2015).
78. Y. X. Wang et al., Integrins regulate VE-cadherin and catenins: Dependence of this regulation
on Src,, but not on Ras. Proc. Natl. Acad. Sci. U. S. A. 103, 1774-1779 (2006).
79. L. A. Barnes et al., Mechanical Forces in Cutaneous Wound Healing: Emerging Therapies to
Minimize Scar Formation. Adv Wound Care (New Rochelle) 7, 47-56 (2018).
80. M. Chiquet, V. Tunc-Civelek, A. Sarasa-Renedo, Gene regulation by mechanotransduction in
fibroblasts. Appl. Physiol. Nutr. Metab. 32, 967-973 (2007).
81. B. Eckes et al., Mechanical tension and integrin alpha 2 beta 1 regulate fibroblast functions. J.
Investig. Dermatol. Symp. Proc. 11, 66-72 (2006).
82. R. Agha, R. Ogawa, G. Pietramaggiori, D. P. Orgill, A review of the role of mechanical forces
in cutaneous wound healing. J. Surg. Res. 171, 700-708 (2011).
83. H. S. Yu, J. J. Kim, H. W. Kim, M. P. Lewis, I. Wall, Impact of mechanical stretch on the cell
behaviors of bone and surrounding tissues. J Tissue Eng 7, 2041731415618342 (2016).
84. T. Zulueta-Coarasa, R. Fernandez-Gonzalez, Tension (re)builds: Biophysical mechanisms of
embryonic wound repair. Mech. Dev. 144, 43-52 (2017).
85. L. I. Plotkin et al., Mechanical stimulation prevents osteocyte apoptosis: requirement of
integrins, Src kinases, and ERKs. Am J Physiol-Cell Ph 289, C633-C643 (2005).
86. N. Boutahar, A. Guignandon, L. Vico, M. H. Lafage-Proust, Mechanical strain on osteoblasts
activates autophosphorylation of focal adhesion kinase and proline-rich tyrosine kinase 2
tyrosine sites involved in ERK activation. J. Biol. Chem. 279, 30588-30599 (2004).
87. M. A. Razzak et al., Cellular and Molecular Responses to Mechanical Expansion of Tissue.
Front. Physiol. 7 (2016).
88. C. Huang et al., Talin phosphorylation by Cdk5 regulates Smurf1-mediated talin head
ubiquitylation and cell migration. Nat. Cell Biol. 11, 624-U404 (2009).
89. C. M. Laukaitis, D. J. Webb, K. Donais, A. F. Horwitz, Differential dynamics of alpha 5
integrin, paxillin, and alpha-actinin during formation and disassembly of adhesions in
migrating cells. J. Cell Biol. 153, 1427-1440 (2001).
90. D. L. Butler et al., The Impact of Biomechanics in Tissue Engineering and Regenerative
Medicine. Tissue Eng Part B-Re 15, 477-484 (2009).
91. V. F. Shimko, W. C. Claycomb, Effect of mechanical loading on three-dimensional cultures of
embryonic stem cell-derived cardiomyocytes. Tissue Eng Pt A 14, 49-58 (2008).
92. C. A. Powell, B. L. Smiley, J. Mills, H. H. Vandenburgh, Mechanical stimulation improves
tissue-engineered human skeletal muscle. Am J Physiol-Cell Ph 283, C1557-C1565 (2002).
93. K. C. Clause, J. P. Tinney, L. J. Liu, B. B. Keller, K. Tobita, Engineered Early Embryonic
Cardiac Tissue Increases Cardiomyocyte Proliferation by Cyclic Mechanical Stretch via p38-
MAP Kinase Phosphorylation. Tissue Eng Pt A 15, 1373-1380 (2009).
96
94. K. Bilodeau, F. Couet, F. Boccafoschi, D. Mantovani, Design of a perfusion bioreactor specific
to the regeneration of vascular tissues under mechanical stresses. Artif. Organs 29, 906-912
(2005).
95. J. Lammerding, R. D. Kamm, R. T. Lee, Mechanotransduction in cardiac myocytes. Cardiac
Engineering: From Genes and Cells to Structure and Function 1015, 53-70 (2004).
96. J. S. Park et al., Differential effects of equiaxial and uniaxial strain on mesenchymal stem cells.
Biotechnol Bioeng 88, 359-368 (2004).
97. G. H. Altman et al., Cell differentiation by mechanical stress. FASEB J. 15, 270-+ (2001).
98. Y. L. Fan, H. C. Zhao, B. Li, Z. L. Zhao, X. Q. Feng, Mechanical Roles of F-Actin in the
Differentiation of Stem Cells: A Review. Acs Biomaterials Science & Engineering 5, 3788-
3801 (2019).
99. C. H. Huang, M. H. Chen, T. H. Young, J. H. Jeng, Y. J. Chen, Interactive Effects of
Mechanical Stretching and Extracellular Matrix Proteins on Initiating Osteogenic
Differentiation of Human Mesenchymal Stem Cells. J. Cell. Biochem. 108, 1263-1273 (2009).
100. B. Y. Xu et al., RhoA/ROCK, cytoskeletal dynamics, and focal adhesion kinase are
required for mechanical stretch-induced tenogenic differentiation of human mesenchymal stem
cells. J. Cell. Physiol. 227, 2722-2729 (2012).
101. G. Song, Y. Ju, H. Soyama, T. Ohashi, M. Sato, Regulation of cyclic longitudinal
mechanical stretch on proliferation of human bone marrow mesenchymal stem cells. Mol. Cell.
Biomech. 4, 201-210 (2007).
102. B. Zhang et al., Cyclic mechanical stretching promotes migration but inhibits invasion of
rat bone marrow stromal cells. Stem Cell Res 14, 155-164 (2015).
103. X. Liang, X. Huang, Y. Zhou, R. Jin, Q. Li, Mechanical Stretching Promotes Skin Tissue
Regeneration via Enhancing Mesenchymal Stem Cell Homing and Transdifferentiation. Stem
Cells Transl Med 5, 960-969 (2016).
104. I. Owan et al., Mechanotransduction in bone: osteoblasts are more responsive to fluid
forces than mechanical strain. Am J Physiol 273, C810-815 (1997).
105. Y. Han, S. C. Cowin, M. B. Schaffler, S. Weinbaum, Mechanotransduction and strain
amplification in osteocyte cell processes. Proc. Natl. Acad. Sci. U. S. A. 101, 16689-16694
(2004).
106. S. W. Verbruggen, T. J. Vaughan, L. M. McNamara, Strain amplification in bone
mechanobiology: a computational investigation of the in vivo mechanics of osteocytes. Journal
of the Royal Society Interface 9, 2735-2744 (2012).
107. F. Assanah, Y. Khan, Cell responses to physical forces, and how they inform the design of
tissue-engineered constructs for bone repair: a review. J. Mater. Sci. 53, 5618-5640 (2018).
108. D. P. Pioletti, J. Muller, L. R. Rakotomanana, J. Corbeil, E. Wild, Effect of
micromechanical stimulations on osteoblasts: development of a device simulating the
mechanical situation at the bone-implant interface. J. Biomech. 36, 131-135 (2003).
109. X. Trepat et al., Viscoelasticity of human alveolar epithelial cells subjected to stretch.
American Journal of Physiology-Lung Cellular and Molecular Physiology 287, L1025-L1034
(2004).
110. B. J. Pfister, T. P. Weihs, M. Betenbaugh, G. Bao, An in vitro uniaxial stretch model for
axonal injury. Annals of biomedical engineering 31, 589-598 (2003).
111. H. Wang, W. Ip, R. Boissy, E. S. Grood, Cell orientation response to cyclically deformed
substrates: experimental validation of a cell model. Journal of biomechanics 28, 1543-1552
(1995).
112. C. Hung, J. Williams, A method for inducing equi-biaxial and uniform strains in
elastomeric membranes used as cell substrates. Journal of biomechanics 27, 227-232 (1994).
113. J. L. Schaffer et al., Device for the application of a dynamic biaxially uniform and isotropic
strain to a flexible cell culture membrane. J. Orthop. Res. 12, 709-719 (1994).

97
114. D. Somjen, I. Binderman, E. Berger, A. Harell, Bone remodelling induced by physical
stress is prostaglandin E2 mediated. Biochimica et Biophysica Acta (BBA)-General Subjects
627, 91-100 (1980).
115. G. Jin, G. H. Yang, G. Kim, Tissue engineering bioreactor systems for applying physical
and electrical stimulations to cells. J Biomed Mater Res B 103, 935-948 (2015).
116. C. P. Ursekar et al., Design and construction of an equibiaxial cell stretching system that
is improved for biochemical analysis. PLoS One 9, e90665 (2014).
117. R. Yang, J. A. Broussard, K. J. Green, H. D. Espinosa, Techniques to stimulate and
interrogate cell-cell adhesion mechanics. Extreme Mechanics Letters (2017).
118. M. Bottlang, M. Simnacher, H. Schmitt, R. Brand, L. Claes, A Cell Strain System for Small
Homogeneous Strain Applications-Ein Zellstimulations-System zur Applikation kleiner
homogener Dehnungen. Biomedizinische Technik/Biomedical Engineering 42, 305-309
(1997).
119. J. Williams, J. Chen, D. Belloli, Strain fields on cell stressing devices employing clamped
circular elastic diaphragms as substrates. J. Biomech. Eng. 114, 377-384 (1992).
120. P. McMillen, S. A. Holley, Integration of cell-cell and cell-ECM adhesion in vertebrate
morphogenesis. Curr. Opin. Cell Biol. 36, 48-53 (2015).
121. K. Goodwin et al., Cell-cell and cell-extracellular matrix adhesions cooperate to organize
actomyosin networks and maintain force transmission during dorsal closure. Mol. Biol. Cell
28, 1301-1310 (2017).
122. R. Yang, J. A. Broussard, K. J. Green, H. D. Espinosa, Techniques to Stimulate and
Interrogate Cell-Cell Adhesion Mechanics. Extreme Mechanics Letters In Press (2017).
123. M. Levesque, R. Nerem, E. Sprague, Vascular endottielial cell proliferation in culture and
the influence of flow. Biomaterials 11, 702-707 (1990).
124. C. Dong, X. X. Lei, Biomechanics of cell rolling: shear flow, cell-surface adhesion, and
cell deformability. Journal of biomechanics 33, 35-43 (2000).
125. T.-H. Chun et al., Shear stress augments expression of C-type natriuretic peptide and
adrenomedullin. Hypertension 29, 1296-1302 (1997).
126. T. G. Diacovo et al., Interactions of human alpha/beta and gamma/delta T lymphocyte
subsets in shear flow with E-selectin and P-selectin. J. Exp. Med. 183, 1193-1203 (1996).
127. J. Frangos, L. McIntire, S. Eskin, Shear stress induced stimulation of mammalian cell
metabolism. Biotechnology and bioengineering 32, 1053-1060 (1988).
128. C. T. Hung, S. R. Pollack, T. M. Reilly, C. T. Brighton, Real-time calcium response of
cultured bone cells to fluid flow. Clin. Orthop. Relat. Res. 313, 256-269 (1995).
129. P. Kuijper et al., Platelet-dependent primary hemostasis promotes selectin-and integrin-
mediated neutrophil adhesion to damaged endothelium under flow conditions. Blood 87, 3271-
3281 (1996).
130. M. Levesque, R. Nerem, The elongation and orientation of cultured endothelial cells in
response to shear stress. J. Biomech. Eng. 107, 341-347 (1985).
131. H. Tseng, T. E. Peterson, B. C. Berk, Fluid shear stress stimulates mitogen-activated
protein kinase in endothelial cells. Circ. Res. 77, 869-878 (1995).
132. J. W. Song et al., Computer-controlled microcirculatory support system for endothelial cell
culture and shearing. Analytical chemistry 77, 3993-3999 (2005).
133. E. Tkachenko, E. Gutierrez, M. H. Ginsberg, A. Groisman, An easy to assemble
microfluidic perfusion device with a magnetic clamp. Lab on a Chip 9, 1085-1095 (2009).
134. E. W. Young, A. R. Wheeler, C. A. Simmons, Matrix-dependent adhesion of vascular and
valvular endothelial cells in microfluidic channels. Lab on a Chip 7, 1759-1766 (2007).
135. H. Lu et al., Microfluidic shear devices for quantitative analysis of cell adhesion. Analytical
chemistry 76, 5257-5264 (2004).
136. C. Dewey Jr, Effects of fluid flow on living vascular cells. J. Biomech. Eng. 106, 31-35
(1984).

98
137. K. S. Furukawa et al., Quantitative analysis of cell detachment by shear stress. Materials
Science and Engineering: C 17, 55-58 (2001).
138. C. Hermann, A. M. Zeiher, S. Dimmeler, Shear stress inhibits H2O2-induced apoptosis of
human endothelial cells by modulation of the glutathione redox cycle and nitric oxide synthase.
Arteriosclerosis, thrombosis, and vascular biology 17, 3588-3592 (1997).
139. M. Mohtai et al., Expression of interleukin‐6 in osteoarthritic chondrocytes and effects of
fluid‐induced shear on this expression in normal human chondrocytes in vitro. J. Orthop. Res.
14, 67-73 (1996).
140. A. v. van Grondelle et al., Altering hydrodynamic variables influences PGI2 production by
isolated lungs and endothelial cells. J. Appl. Physiol. 57, 388-395 (1984).
141. M. Dembo, Y. L. Wang, Stresses at the cell-to-substrate interface during locomotion of
fibroblasts. Biophysical Journal 76, 2307-2316 (1999).
142. J. L. Martiel et al., Measurement of cell traction forces with ImageJ. Method Cell Biol 125,
269-287 (2015).
143. Q. Tseng et al., Spatial organization of the extracellular matrix regulates cell-cell junction
positioning. Proc. Natl. Acad. Sci. U. S. A. 109, 1506-1511 (2012).
144. S. J. Han, Y. Oak, A. Groisman, G. Danuser, Traction microscopy to identify force
modulation in subresolution adhesions. Nat Methods 12, 653-656 (2015).
145. Anonymous, (!!! INVALID CITATION !!! {}).
146. C. Franck, S. A. Maskarinec, D. A. Tirrell, G. Ravichandran, Three-dimensional traction
force microscopy: a new tool for quantifying cell-matrix interactions. PLoS One 6, e17833
(2011).
147. W. R. Legant et al., Measurement of mechanical tractions exerted by cells in three-
dimensional matrices. Nature Methods 7, 969-U113 (2010).
148. J. Steinwachs et al., Three-dimensional force microscopy of cells in biopolymer networks.
Nat Methods 13, 171-176 (2016).
149. A. F. Mertz et al., Cadherin-based intercellular adhesions organize epithelial cell-matrix
traction forces. Proc Natl Acad Sci U S A 110, 842-847 (2013).
150. C. A. Reinhart-King, M. Dembo, D. A. Hammer, Cell-Cell Mechanical Communication
through Compliant Substrates. Biophysical Journal 95, 6044-6051 (2008).
151. J. Y. Sim et al., Spatial distribution of cell-cell and cell-ECM adhesions regulates force
balance while maintaining E-cadherin molecular tension in cell pairs. Mol Biol Cell 26, 2456-
2465 (2015).
152. C. Martinez-Rico, F. Pincet, J. P. Thiery, S. Dufour, Integrins stimulate E-cadherin-
mediated intercellular adhesion by regulating Src-kinase activation and actomyosin
contractility. J Cell Sci 123, 712-722 (2010).
153. G. F. Weber, M. A. Bjerke, D. W. DeSimone, Integrins and cadherins join forces to form
adhesive networks. J Cell Sci 124, 1183-1193 (2011).
154. V. Maruthamuthu, B. Sabass, U. S. Schwarz, M. L. Gardel, Cell-ECM traction force
modulates endogenous tension at cell-cell contacts. Proc. Natl. Acad. Sci. U. S. A. 108, 4708-
4713 (2011).
155. J. Y. Sim et al., Spatial distribution of cell–cell and cell–ECM adhesions regulates force
balance while maintaining E-cadherin molecular tension in cell pairs. Mol Biol Cell 26, 2456-
2465 (2015).
156. J. L. Tan et al., Cells lying on a bed of microneedles: an approach to isolate mechanical
force. Proceedings of the National Academy of Sciences 100, 1484-1489 (2003).
157. N. J. Sniadecki et al., Magnetic microposts as an approach to apply forces to living cells.
Proceedings of the National Academy of Sciences 104, 14553-14558 (2007).
158. R. Rand, A. Burton, Mechanical properties of the red cell membrane: I. Membrane stiffness
and intracellular pressure. Biophys. J. 4, 115-135 (1964).

99
159. R. M. Hochmuth, Micropipette aspiration of living cells. Journal of biomechanics 33, 15-
22 (2000).
160. R. Hochmuth, H. Ting-Beall, B. Beaty, D. Needham, R. Tran-Son-Tay, Viscosity of
passive human neutrophils undergoing small deformations. Biophys. J. 64, 1596-1601 (1993).
161. M. Sato, M. J. Levesque, R. M. Nerem, Micropipette aspiration of cultured bovine aortic
endothelial cells exposed to shear stress. Arteriosclerosis, thrombosis, and vascular biology 7,
276-286 (1987).
162. T. Secomb, Red blood cell mechanics and capillary blood rheology. Cell Biochem.
Biophys. 18, 231-251 (1991).
163. T. Secomb, R. Hsu, Red blood cell mechanics and functional capillary density.
International Journal of Microcirculation 15, 250-254 (1995).
164. J. Wu, W. Herzog, M. Epstein, Modelling of location-and time-dependent deformation of
chondrocytes during cartilage loading. Journal of biomechanics 32, 563-572 (1999).
165. K.-L. P. Sung, L. A. Sung, M. Crimmins, S. J. Burakoff, S. Chien, Determination of
junction avidity of cytolytic T cell and target cell. Science 234, 1405-1409 (1986).
166. K. P. Sung, E. Saldivar, L. Phillips, Interleukin-1β induces differential adhesiveness on
human endothelial cell surfaces. Biochemical and biophysical research communications 202,
866-872 (1994).
167. H. Miyazaki, Y. Hasegawa, K. Hayashi, A newly designed tensile tester for cells and its
application to fibroblasts. Journal of biomechanics 33, 97-104 (2000).
168. K. Nagayama, S. Yanagihara, T. Matsumoto, A novel micro tensile tester with feed-back
control for viscoelastic analysis of single isolated smooth muscle cells. Med. Eng. Phys. 29,
620-628 (2007).
169. A. Ashkin, J. M. Dziedzic, Optical trapping and manipulation of viruses and bacteria.
Science 235, 1517-1521 (1987).
170. A. D. Mehta, M. Rief, J. A. Spudich, D. A. Smith, R. M. Simmons, Single-molecule
biomechanics with optical methods. Science 283, 1689-1695 (1999).
171. J.-D. Wen et al., Force unfolding kinetics of RNA using optical tweezers. I. Effects of
experimental variables on measured results. Biophys. J. 92, 2996-3009 (2007).
172. M. Dao, C. T. Lim, S. Suresh, Mechanics of the human red blood cell deformed by optical
tweezers. Journal of the Mechanics and Physics of Solids 51, 2259-2280 (2003).
173. J. Mills, L. Qie, M. Dao, C. Lim, S. Suresh, Nonlinear elastic and viscoelastic deformation
of the human red blood cell with optical tweezers. MCB-TECH SCIENCE PRESS- 1, 169-180
(2004).
174. K. Svoboda, S. M. Block, Biological applications of optical forces. Annual review of
biophysics and biomolecular structure 23, 247-285 (1994).
175. J. Sleep, D. Wilson, R. Simmons, W. Gratzer, Elasticity of the red cell membrane and its
relation to hemolytic disorders: an optical tweezers study. Biophys. J. 77, 3085-3095 (1999).
176. J. Mills et al., Effect of plasmodial RESA protein on deformability of human red blood
cells harboring Plasmodium falciparum. Proceedings of the National Academy of Sciences 104,
9213-9217 (2007).
177. S. Suresh et al., Reprint of: connections between single-cell biomechanics and human
disease states: gastrointestinal cancer and malaria. Acta biomaterialia 23, S3-S15 (2015).
178. J. Guck, R. Ananthakrishnan, C. C. Cunningham, J. Käs, Stretching biological cells with
light. J. Phys.: Condens. Matter 14, 4843 (2002).
179. J. Guck et al., The optical stretcher: a novel laser tool to micromanipulate cells. Biophys.
J. 81, 767-784 (2001).
180. J. Guck, J. Chiang, J. Kas (1998) The optical stretcher ua novel tool to characterize the
cytoskeleton. in Molecular Biology of the Cell (AMER SOC CELL BIOLOGY PUBL
OFFICE, 9650 ROCKVILLE PIKE, BETHESDA, MD 20814 USA), pp 105A-105A.

100
181. F. Crick, A. Hughes, The physical properties of cytoplasm: A study by means of the
magnetic particle method Part I. Experimental. Exp. Cell Res. 1, 37-80 (1950).
182. G. N. Maksym et al., Mechanical properties of cultured human airway smooth muscle cells
from 0.05 to 0.4 Hz. J. Appl. Physiol. 89, 1619-1632 (2000).
183. M. Puig-De-Morales et al., Measurement of cell microrheology by magnetic twisting
cytometry with frequency domain demodulation. J. Appl. Physiol. 91, 1152-1159 (2001).
184. B. Fabry, G. N. Maksym, R. D. Hubmayr, J. P. Butler, J. J. Fredberg, Implications of
heterogeneous bead behavior on cell mechanical properties measured with magnetic twisting
cytometry. Journal of magnetism and magnetic materials 194, 120-125 (1999).
185. Y. Tseng, T. P. Kole, D. Wirtz, Micromechanical mapping of live cells by multiple-
particle-tracking microrheology. Biophys. J. 83, 3162-3176 (2002).
186. G. Charras, P. P. Lehenkari, M. Horton, Atomic force microscopy can be used to
mechanically stimulate osteoblasts and evaluate cellular strain distributions. Ultramicroscopy
86, 85-95 (2001).
187. M. Radmacher, 4.-Measuring the Elastic Properties of Living Cells by the Atomic Force
Microscope. Methods Cell Biol. 68, 67-90 (2002).
188. R. Mahaffy, S. Park, E. Gerde, J. Käs, C. Shih, Quantitative analysis of the viscoelastic
properties of thin regions of fibroblasts using atomic force microscopy. Biophys. J. 86, 1777-
1793 (2004).
189. A. Vaziri, H. Lee, M. K. Mofrad, Deformation of the cell nucleus under indentation:
mechanics and mechanisms. J. Mater. Res. 21, 2126-2135 (2006).
190. M. Benoit, 5.-Cell Adhesion Measured by Force Spectroscopy on Living Cells. Methods
Cell Biol. 68, 91-114 (2002).
191. P. Hinterdorfer, 6.-Molecular Recognition Studies Using the Atomic Force Microscope.
Methods Cell Biol. 68, 115-141 (2002).
192. O. H. Willemsen et al., Biomolecular interactions measured by atomic force microscopy.
Biophys. J. 79, 3267-3281 (2000).
193. B. T. Marshall, M. Long, J. W. Piper, T. Yago, Direct observation of catch bonds involving
cell-adhesion molecules. Nature 423, 190 (2003).
194. M. Benoit, D. Gabriel, G. Gerisch, H. E. Gaub, Discrete interactions in cell adhesion
measured by single-molecule force spectroscopy. Nat Cell Biol 2, 313-317 (2000).
195. J. Friedrichs et al., A practical guide to quantify cell adhesion using single-cell force
spectroscopy. Methods 60, 169-178 (2013).
196. P. H. Puech, K. Poole, D. Knebel, D. J. Muller, A new technical approach to quantify cell-
cell adhesion forces by AFM. Ultramicroscopy 106, 637-644 (2006).
197. M. Krieg et al., Tensile forces govern germ-layer organization in zebrafish. Nature Cell
Biology 10, 429-U122 (2008).
198. A. Heisterkamp et al., Pulse energy dependence of subcellular dissection by femtosecond
laser pulses. Opt Express 13, 3690-3696 (2005).
199. S. Kumar et al., Viscoelastic retraction of single living stress fibers and its impact on cell
shape, cytoskeletal organization, and extracellular matrix mechanics. Biophys J 90, 3762-3773
(2006).
200. A. Brugues et al., Forces driving epithelial wound healing. Nat Phys 10, 683-690 (2014).
201. R. Yang et al., Cellular level robotic surgery: Nanodissection of intermediate filaments in
live keratinocytes. Nanomedicine: Nanotechnology, Biology and Medicine 11, 137-145 (2015).
202. K. Seiffert-Sinha et al., Nanorobotic investigation identifies novel visual, structural and
functional correlates of autoimmune pathology in a blistering skin disease model. PLoS One 9,
e106895 (2014).
203. S. Yang, T. Saif, Reversible and repeatable linear local cell force response under large
stretches. Exp. Cell Res. 305, 42-50 (2005).

101
204. J. Rajagopalan, A. Tofangchi, M. T. A. Saif, Linear high-resolution bioMEMS force
sensors with large measurement range. Journal of Microelectromechanical Systems 19, 1380-
1389 (2010).
205. S. Eppell, B. Smith, H. Kahn, R. Ballarini, Nano measurements with micro-devices:
mechanical properties of hydrated collagen fibrils. Journal of the Royal Society Interface 3,
117-121 (2006).
206. N. Scuor et al., Design of a novel MEMS platform for the biaxial stimulation of living
cells. Biomed. Microdevices 8, 239-246 (2006).
207. A. M. Greiner, B. Richter, M. Bastmeyer, Micro-engineered 3D scaffolds for cell culture
studies. Macromol. Biosci. 12, 1301-1314 (2012).
208. A. M. Greiner et al., Multifunctional polymer scaffolds with adjustable pore size and
chemoattractant gradients for studying cell matrix invasion. Biomaterials 35, 611-619 (2014).
209. F. Klein et al., Two-component polymer scaffolds for controlled three-dimensional cell
culture. Adv Mater 23, 1341-1345 (2011).
210. B. Richter et al., Guiding Cell Attachment in 3D Microscaffolds Selectively Functionalized
with Two Distinct Adhesion Proteins. Adv Mater 29 (2017).
211. B. Richter et al., Three-dimensional microscaffolds exhibiting spatially resolved surface
chemistry. Adv Mater 25, 6117-6122 (2013).
212. F. Klein et al., Elastic fully three-dimensional microstructure scaffolds for cell force
measurements. Adv Mater 22, 868-871 (2010).
213. A. C. Scheiwe, S. C. Frank, T. J. Autenrieth, M. Bastmeyer, M. Wegener, Subcellular
stretch-induced cytoskeletal response of single fibroblasts within 3D designer scaffolds.
Biomaterials 44, 186-194 (2015).
214. W. R. Legant et al., Multidimensional traction force microscopy reveals out-of-plane
rotational moments about focal adhesions. P Natl Acad Sci USA 110, 881-886 (2013).
215. Z. J. Liu et al., Mechanical tugging force regulates the size of cell-cell junctions.
Proceedings of the National Academy of Sciences of the United States of America 107, 9944-
9949 (2010).
216. F. Klein et al., Elastic Fully Three-dimensional Microstructure Scaffolds for Cell Force
Measurements. Advanced Materials 22, 868-+ (2010).
217. R. Kaunas, P. Nguyen, S. Usami, S. Chien, Cooperative effects of Rho and mechanical
stretch on stress fiber organization. Proceedings of the National Academy of Sciences of the
United States of America 102, 15895-15900 (2005).
218. R. Yang, J. A. Broussard, K. J. Green, H. D. Espinosa, Techniques to stimulate and
interrogate cell-cell adhesion mechanics. Extreme Mech Lett 20, 125-139 (2018).
219. J. A. Broussard et al., The desmoplakin/intermediate filament linkage regulates cell
mechanics. Mol. Biol. Cell, mbc. E16-07-0520 (2017).
220. Z. Liu et al., Mechanical tugging force regulates the size of cell-cell junctions. Proc. Natl.
Acad. Sci. U. S. A. 107, 9944-9949 (2010).
221. B. H. Cumpston et al., Two-photon polymerization initiators for three-dimensional optical
data storage and microfabrication. Nature 398, 51-54 (1999).
222. P. Panorchan, J. P. George, D. Wirtz, Probing intercellular interactions between vascular
endothelial cadherin pairs at single-molecule resolution and in living cells. J. Mol. Biol. 358,
665-674 (2006).
223. A. M. Esfahani et al., Characterization of the strain-rate-dependent mechanical response
of single cell-cell junctions. Proc. Natl. Acad. Sci. U. S. A. 118 (2021).
224. S. de Beco, C. Gueudry, F. Amblard, S. Coscoy, Endocytosis is required for E-cadherin
redistribution at mature adherens junctions. Proceedings of the National Academy of Sciences
of the United States of America 106, 7010-7015 (2009).

102
225. C. K. Choi et al., Actin and alpha-actinin orchestrate the assembly and maturation of
nascent adhesions in a myosin II motor-independent manner. Nat. Cell Biol. 10, 1039-U1036
(2008).
226. Y. S. Chu et al., Force measurements in E-cadherin-mediated cell doublets reveal rapid
adhesion strengthened by actin cytoskeleton remodeling through Rac and Cdc42. J. Cell Biol.
167, 1183-1194 (2004).
227. C. Lim, E. Zhou, S. Quek, Mechanical models for living cells—a review. J. Biomech. 39,
195-216 (2006).
228. J. J. Muñoz, S. Albo, Physiology-based model of cell viscoelasticity. Physical Review E
88, 012708 (2013).
229. N. Khalilgharibi et al., Stress relaxation in epithelial monolayers is controlled by the
actomyosin cortex. Nat. Phys. 15, 839-847 (2019).
230. J. Hu et al., Size- and speed-dependent mechanical behavior in living mammalian
cytoplasm. Proc. Natl. Acad. Sci. U. S. A. 114, 9529-9534 (2017).
231. N. Slomka, C. W. Oomens, A. Gefen, Evaluating the effective shear modulus of the
cytoplasm in cultured myoblasts subjected to compression using an inverse finite element
method. Journal of the mechanical behavior of biomedical materials 4, 1559-1566 (2011).
232. R. Waugh, M. Tsai, "Shear rate-dependence of leukocyte cytoplasmic viscosity" in Cell
Mechanics and Cellular Engineering. (Springer, 1994), pp. 33-44.
233. S. Marion, N. Guillen, J.-C. Bacri, C. Wilhelm, Acto-myosin cytoskeleton dependent
viscosity and shear-thinning behavior of the amoeba cytoplasm. Eur. Biophys. J. 34, 262-272
(2005).
234. A. Nikoubashman, M. P. Howard, Equilibrium dynamics and shear rheology of
semiflexible polymers in solution. Macromolecules 50, 8279-8289 (2017).
235. P. Panorchan et al., Single-molecule analysis of cadherin-mediated cell-cell adhesion. J.
Cell Sci. 119, 66-74 (2006).
236. W. E. Thomas, Understanding the counterintuitive phenomenon of catch bonds. Current
Nanoscience 3, 63-77 (2007).
237. J. Friedrichs et al., A practical guide to quantify cell adhesion using single-cell force
spectroscopy. Methods 60, 169-178 (2013).
238. S. Vedula et al., Quantifying forces mediated by integral tight junction proteins in cell–cell
adhesion. Experimental mechanics 49, 3-9 (2009).
239. H. Tabdili et al., Cadherin-dependent mechanotransduction depends on ligand identity but
not affinity. J. Cell Sci. 125, 4362-4371 (2012).
240. C. Franz, P.-H. Puech, Atomic force microscopy: a versatile tool for studying cell
morphology, adhesion and mechanics. Cell. Mol. Bioeng. 1, 289-300 (2008).
241. K. E. Cavanaugh, M. F. Staddon, S. Banerjee, M. L. Gardel, Adaptive viscoelasticity of
epithelial cell junctions: from models to methods. Curr. Opin. Genet. Dev. 63, 86-94 (2020).
242. L. Casares et al., Hydraulic fracture during epithelial stretching. Nat. Mater. 14, 343-351
(2015).
243. K. V. Iyer, R. Piscitello-Gómez, J. Paijmans, F. Jülicher, S. Eaton, Epithelial viscoelasticity
is regulated by mechanosensitive E-cadherin turnover. Curr. Biol. 29, 578-591. e575 (2019).