A Simple, Effective Method for a “Detailed” Building ... · PDF filetailed...
4
www.SandV.com 10 SOUND & VIBRATION/AUGUST 2014 The National Institute of Health’s (NIH) building on the campus of Johns Hopkins University will be approximately 300 feet from a newly proposed at-grade, light-rail transit (LRT) system called the Baltimore Red Line. However, research and experiments being conducted inside the building are extremely sensitive to vibration; involving such things as electron microscopes, MRI machines and animal experiments. Consequently, a comprehensive vibration assessment was performed in May 2012 to ensure the proposed Red Line will not adversely affect NIH’s operations. This article describes the vibration study, which is particularly noteworthy in that it utilized a simpler and less expensive method to obtain results consistent with the “Detailed” method described in the Fed- eral Transit Administration’s (FTA) Transit Noise and Vibration Impact Assessment Manual. The study made use of a 200-pound drop weight apparatus and multiple accelerometers along the ground and inside the building to develop an empirical model of the building’s potential response to future Red Line vibration. The results were compared against existing vibration levels and evaluated for acceptability in accordance with FTA’s vibration criteria for sensitive devices. The study involved performing a series of vibration measure- ments and tests at the National Institute of Health (NIH) Biomedical Research Center located on the Johns Hopkins Bayview Campus in Baltimore, MD. The measurements and tests were conducted on May 7th and 8th, 2012. The goal was to collect vibration data that, upon analysis, could determine if vibration levels associated with future Baltimore Red Line transit vehicle operations may or may not adversely impact animal experiments or extremely sensitive devices used inside the NIH building. More specifically, the areas of concern focused on an electron microscope (EM) and magnetic resonance imaging machine (MRI) that are in use in the building’s northwest corner of the sub-basement, and a laboratory located in the building’s southwest corner of the sub-basement, where animal experiments on monkeys and rats are conducted. The NIH building, as shown in Figure 1, is a 13-story building (10 floors above grade, three floors below grade) built into a hillside. The building is brick and glass and is built on a poured-concrete foundation with spread footings. Of particular interest is a massive underground retention wall along the building’s southwest corner near the animal lab. It is a 4-foot-wide, earth-filled concrete wall that was necessary for support of excavation during construc- tion. There is also a “floating floor” under the EM and MRI in the building’s northwest sub-basement corner specifically intended to reduce ambient vibration levels affecting these devices. Technical Approach The technical approach used to predict future Red Line LRT vibration levels inside the NIH building involved four steps, as described below. The general methodology is similar to the “De- tailed Vibration Analysis” method described in the Federal Transit Administration’s (FTA) Transit Noise and Vibration Impact Assess- ment Manual (2006), but in this case the analysis was completed using simpler and less expensive measurement methods while still yielding meaningful results. In all cases, vibration data were collected as (or reduced to) verti- cal vibration velocity levels in decibels relative to 1 micro-inch/ second (i.e., VdB re 1 µ-inch/sec). Vibration data were measured in unweighted third-octave-band format over the frequency range of 1 to 100 Hz, and all subsequent prediction modeling was done in third-octave bands to account for the frequency-dependant ef- fects of vibration generation and propagation through the ground and into the building. The steps of the analysis were as follows: 1. Determine anticipated vibration emission levels at a reference distance of 25 feet from a light-rail transit vehicle similar to the one expected to be used on the future Baltimore Red Line. This was done using published vibration data from the Central Cor- ridor Light Rail Transit (CCLRT) project in Minneapolis, MN. The CCLRT emission data were collected in 2008 along the Hiawatha Line for a Bombardier FLEXITY Swift low-floor train traveling at different speeds over ballast-and-tie tracks at a reference distance of 25 feet from the tracks. It is anticipated that a similar trainset and track configuration will be used on the future Baltimore Red Line. Comparable source emission vibration data were also collected during this assignment on existing MTA Baltimore Blue Line trains. 2. Establish ground propagation vibration reduction character- istics as a function of distance through the actual ground that will separate the future Red Line trains from the NIH building. This was done by performing a series of drop-weight impact tests on the ground surrounding the NIH building. The vibration resulting from a 200-pound, drop-weight apparatus was measured at distances of 25 feet, 50 feet, 100 feet, 200 feet and 300 feet. Based on the resulting data, the attenuation of vibration as a function of distance was computed and normalized to apply as adjustment factors for different distances compared to a reference distance of 25 feet. 3. Establish building coupling transmissibility loss (attenuation) as vibration passes from outside to inside the NIH building. This was done by using the 200-pound, drop-weight apparatus at a fixed position proximate to the NIH building’s exterior and measuring the resulting vibration levels on the ground immediately adjacent to the building’s exterior wall and on the basement floor inside the building immediately adjacent to the same wall. This process had to be performed in two locations due to the building’s different foundation conditions affecting the EM and MRI devices and the animal laboratory area. 4. Predict vibration levels inside the NIH building and evaluate the results for the sensitive devices and the animal laboratory in accordance with FTA vibration criteria, manufacturer recom- mendations, and existing ambient vibration conditions. This was accomplished by simply adding the results of Steps 1, 2 and 3 together to yield the predicted vibration levels anticipated to occur inside the NIH building due to future LRT operations. Two areas of the building were analyzed, the area housing the EM and MRI devices and the area housing the animal laboratory. A Simple, Effective Method for a “Detailed” Building Vibration Analysis Erich Thalheimer and Jacob Poling, Parsons Brinkerhoff, Boston, Massachusetts Tom Herzog, AECOM, New York, New York Figure 1. National Institute of Health building, Johns Hopkins University, Baltimore, MD. Based on a paper presented at Noise-Con 2013, 26th Annual Conference on Noise Control Engineering, August 2013.
Transcript of A Simple, Effective Method for a “Detailed” Building ... · PDF filetailed...
www.SandV.com10 SOUND & VIBRATION/AUGUST 2014
The National Institute of Health’s (NIH) building on the campus of Johns Hopkins University will be approximately 300 feet from a newly proposed at-grade, light-rail transit (LRT) system called the Baltimore Red Line. However, research and experiments being conducted inside the building are extremely sensitive to vibration; involving such things as electron microscopes, MRI machines and animal experiments. Consequently, a comprehensive vibration assessment was performed in May 2012 to ensure the proposed Red Line will not adversely affect NIH’s operations. This article describes the vibration study, which is particularly noteworthy in that it utilized a simpler and less expensive method to obtain results consistent with the “Detailed” method described in the Fed-eral Transit Administration’s (FTA) Transit Noise and Vibration Impact Assessment Manual. The study made use of a 200-pound drop weight apparatus and multiple accelerometers along the ground and inside the building to develop an empirical model of the building’s potential response to future Red Line vibration. The results were compared against existing vibration levels and evaluated for acceptability in accordance with FTA’s vibration criteria for sensitive devices.
The study involved performing a series of vibration measure-ments and tests at the National Institute of Health (NIH) Biomedical Research Center located on the Johns Hopkins Bayview Campus in Baltimore, MD. The measurements and tests were conducted on May 7th and 8th, 2012. The goal was to collect vibration data that, upon analysis, could determine if vibration levels associated with future Baltimore Red Line transit vehicle operations may or may not adversely impact animal experiments or extremely sensitive devices used inside the NIH building. More specifically, the areas of concern focused on an electron microscope (EM) and magnetic resonance imaging machine (MRI) that are in use in the building’s northwest corner of the sub-basement, and a laboratory located in the building’s southwest corner of the sub-basement, where animal experiments on monkeys and rats are conducted.
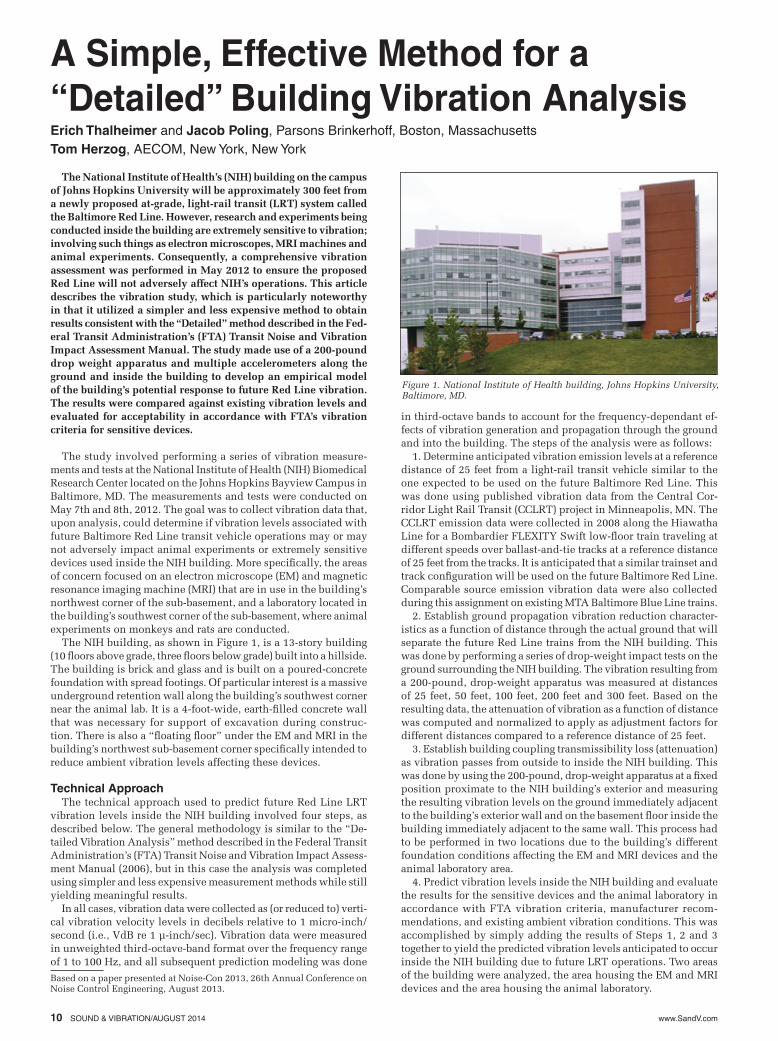
The NIH building, as shown in Figure 1, is a 13-story building (10 floors above grade, three floors below grade) built into a hillside. The building is brick and glass and is built on a poured-concrete foundation with spread footings. Of particular interest is a massive underground retention wall along the building’s southwest corner near the animal lab. It is a 4-foot-wide, earth-filled concrete wall that was necessary for support of excavation during construc-tion. There is also a “floating floor” under the EM and MRI in the building’s northwest sub-basement corner specifically intended to reduce ambient vibration levels affecting these devices.
Technical ApproachThe technical approach used to predict future Red Line LRT
vibration levels inside the NIH building involved four steps, as described below. The general methodology is similar to the “De-tailed Vibration Analysis” method described in the Federal Transit Administration’s (FTA) Transit Noise and Vibration Impact Assess-ment Manual (2006), but in this case the analysis was completed using simpler and less expensive measurement methods while still yielding meaningful results.
In all cases, vibration data were collected as (or reduced to) verti-cal vibration velocity levels in decibels relative to 1 micro-inch/second (i.e., VdB re 1 µ-inch/sec). Vibration data were measured in unweighted third-octave-band format over the frequency range of 1 to 100 Hz, and all subsequent prediction modeling was done
in third-octave bands to account for the frequency-dependant ef-fects of vibration generation and propagation through the ground and into the building. The steps of the analysis were as follows:
1. Determine anticipated vibration emission levels at a reference distance of 25 feet from a light-rail transit vehicle similar to the one expected to be used on the future Baltimore Red Line. This was done using published vibration data from the Central Cor-ridor Light Rail Transit (CCLRT) project in Minneapolis, MN. The CCLRT emission data were collected in 2008 along the Hiawatha Line for a Bombardier FLEXITY Swift low-floor train traveling at different speeds over ballast-and-tie tracks at a reference distance of 25 feet from the tracks. It is anticipated that a similar trainset and track configuration will be used on the future Baltimore Red Line. Comparable source emission vibration data were also collected during this assignment on existing MTA Baltimore Blue Line trains.
2. Establish ground propagation vibration reduction character-istics as a function of distance through the actual ground that will separate the future Red Line trains from the NIH building. This was done by performing a series of drop-weight impact tests on the ground surrounding the NIH building. The vibration resulting from a 200-pound, drop-weight apparatus was measured at distances of 25 feet, 50 feet, 100 feet, 200 feet and 300 feet. Based on the resulting data, the attenuation of vibration as a function of distance was computed and normalized to apply as adjustment factors for different distances compared to a reference distance of 25 feet.
3. Establish building coupling transmissibility loss (attenuation) as vibration passes from outside to inside the NIH building. This was done by using the 200-pound, drop-weight apparatus at a fixed position proximate to the NIH building’s exterior and measuring the resulting vibration levels on the ground immediately adjacent to the building’s exterior wall and on the basement floor inside the building immediately adjacent to the same wall. This process had to be performed in two locations due to the building’s different foundation conditions affecting the EM and MRI devices and the animal laboratory area.
4. Predict vibration levels inside the NIH building and evaluate the results for the sensitive devices and the animal laboratory in accordance with FTA vibration criteria, manufacturer recom-mendations, and existing ambient vibration conditions. This was accomplished by simply adding the results of Steps 1, 2 and 3 together to yield the predicted vibration levels anticipated to occur inside the NIH building due to future LRT operations. Two areas of the building were analyzed, the area housing the EM and MRI devices and the area housing the animal laboratory.
A Simple, Effective Method for a “Detailed” Building Vibration AnalysisErich Thalheimer and Jacob Poling, Parsons Brinkerhoff, Boston, MassachusettsTom Herzog, AECOM, New York, New York
Figure 1. National Institute of Health building, Johns Hopkins University, Baltimore, MD.
Based on a paper presented at Noise-Con 2013, 26th Annual Conference on Noise Control Engineering, August 2013.

www.SandV.com SOUND & VIBRATION/AUGUST 2014 11
Relevant CriteriaA well-accepted set of vibra-
tion criteria was used, which originated with the Institute of Environmental Sciences and Technology (IEST) and were published in its Standards RP-CC012.2 and RP-CC024. This family of vibration criterion curves is intended to protect sensitive devices from exces-sive vibration. The Federal Transit Administration (FTA)
subsequently adopted and recommended these criteria in its FTA Transit Noise and Vibration Impact Assessment Manual (May 2006). The FTA Manual only shows VC curves down to VC-E (125 micro-inches/second, or 42 VdB), however the curves can also be extended lower to VC-F and VC-G. In general, each lower VC curve represents half the vibration velocity level of the one above it. Table 1 provides the vibration velocity levels for each VC curve expressed in engineering units and decibels and a description for the intended use of each criterion curve.
In addition, the manufacturer of the electron microscope pro-vided a recommended ambient vibration specification limit, as relayed through NIH staff, of 300 micro-inches/second (50 VdB). Finally, future predicted Red Line vibration levels were also com-pared to the existing ambient vibration levels to which the sensitive devices and animal laboratory areas are currently exposed. The sensitive devices and animal experiments are being successfully operated and performed today; so it can be reasonably assumed that these activities would remain unaffected by future Red Line LRT vibration provided they remain below current ambient levels.
Vibration Measurement EquipmentFor this study, a portable vibration monitoring and data record-
ing system was configured using a high-sensitivity PCB 393B05 accelerometer (nominal 10 V/g) as a transducer. The accelerometer’s signal was conditioned using a PCB 480E09 signal conditioner, channeled through a B&K ZR0020 adaptor and input to a CEL 593 analyzer that was set to an RMS “slow” time response in accordance with FTA manual recommendations. The CEL 593 allowed for optimization of the signal’s dynamic range that was then output to a Marantz PMD670 solid-state recorder. The recorded signals (wav files) were later analyzed using SpectraPLUS software to yield vibration acceleration levels for third-octave bands ranging from 1 to 100 Hz. The third-octave-band acceleration spectra were then imported into MS Excel spreadsheets for further data reduction, integration to vibration velocity levels, trend curve-fitting, summa-tion of broadband VdB results and final presentation.
The PCB 393B05 accelerometer was magnetically attached to a custom-made, 35-pound steel mounting cube to facilitate good coupling connection to various kinds of surfaces. This mounting method is recommended in the FTA manual. A picture of the ac-celerometer and the mounting cube ready for a measurement in NIH’s lawn can be seen in Figure 2.
The PCB 393B05 accelerometer is too sensitive to be calibrated by a typical hand-held field calibrator. So its published sensitiv-ity was used in a comparison calibration method with the results obtained from a less-sensitive Endevco 7703A-1000 accelerometer mounted on a PCB 394C06 vibration calibrator that produces 1 g RMS. This method allowed for proper calibration of the entire vibration data collection and analysis system.
A heavy drop-weight apparatus (Figure 3) was fabricated to allow for repetitive generation of vibration impulses. Impulses are useful signals because they excite vibration energy in all frequency bands simultaneously. Eight 25-pound barbell weights were cinched together with a long eye bolt to form a solid 200-pound mass. The mass was then lifted via hand-cranked winch on a heavy tripod to 4 feet above the ground and then released upon command when a given test was ready to be conducted. The apparatus produced sufficient vibration energy to yield good signal-to-noise ratios at distances as far away as 300 feet from the drop-weight position.
LRT Source Vibration Emission LevelsFor the first step in the analysis process, LRT passby vibration
emission data were reviewed for potential use as source emission levels in this study. Vibration emission data for a Bombardier FLEXITY Swift low-floor train traveling at different speeds over ballast and tie tracks were collected by ATS Consulting in 2008 along the Hiawatha Line as part of the Central Corridor Light Rail Transit (CCLRT) project in Minneapolis, MN. The CCLRT emission data were collected at train speeds of 20, 30, 40 and 50 mph. The results at a reference distance of 25 feet from the track’s centerline can be seen in Figure 4 (solid lines).
Comparable source emission vibration data were also collected during this assignment on existing MTA Baltimore Blue Line trains. Vibration emission data from eight MTA train passbys were col-lected at speeds ranging from 28 to 45 mph. These data are also
Table 1. FTA vibration criteria limits and intended use.
Vibration Limit VdB re 1 VC Curve µ-in/sec µ-in/sec Intended Use
VC-A 2,000 66 Adequate for medium- to high-power optical microscopes (400X), microbalances, optical balances, and similar specialized equipment
VC-B 1,000 60 Adequate for high-power optical microscopes (1000×), inspection and lithography equipment to 3- micron line widths
VC-C 500 54 Appropriate for most lithography and inspection equipment to 1- micron detail size
VC-D 250 48 Suitable in most casesfor most demanding equipment, including electron microscopes operating to the limits of their capability
VC-E 125 42 The most demanding criterion for extremely sensitive equipment
Figure 3. 200-pound drop-weight apparatus.
Figure 2. Accelerometer and mount-ing cube.
Figure 4. LRT train vibration emission levels at 25 feet.

www.SandV.com12 SOUND & VIBRATION/AUGUST 2014
shown in Figure 4 (dashed lines) for comparison to the CCLRT train vibration data. There is excellent agreement between the two sets of vibration data;, giving credibility to the use of either set for this study. But it was determined that emission data from the CCLRT project would be better to use since it involved the Bombardier FLEXITY Swift train, which is anticipated to be the trainset used on the future Baltimore Red Line. Moreover, the CCLRT vibration levels were slightly higher overall at 63 Hz and above, so using it would yield conservative (worst-case) vibration predictions for this NIH study.
Ground Propagation TestThe next step in the analysis required performing a series of
drop-weight tests on the lawn surrounding the NIH building to measure the vibration reduction characteristics through the ground. The 200-pound drop-weight apparatus was positioned at one end of the lawn, and a traverse line of measurements points was laid out at distances of 25, 50, 100, 200 and 300 feet. The weight was then dropped several times, and the resulting vibration impulse levels were measured at each test point. Care was taken to ensure repeat-able data results, and six to eight measurements were performed at each distance to allow for statistical averaging of the results.
The resulting average third-octave-band vibration velocity levels can be seen in Figure 5 for various distances from the drop weight. The broadband VdB levels are also shown in the figure and confirm the expected trend of reduced vibration levels with increasing distance. The absolute levels are not important; rather, it is the relative differences in vibration levels from point to point when normalized to a distance of 25 feet as a reference. This will be used in the vibration propagation model.
The ground propagation portion of the model must be analyzed on a frequency basis to properly predict vibration behavior through the ground. Therefore, the results shown in Figure 6 were generated by plotting the measured vibration levels for each individual third-octave band as a function of distance. By doing so, a logarithmic curve-fitting routine (trend line) could be used to establish math-ematical propagation functions for each third-octave band. The resulting equations generally showed good curve-fit correlation. This is illustrated by the equation for broadband VdB levels at the top of Figure 3, which produced a coefficient of determination (R2) of 0.93, or a nearly perfect fit.
In this prediction method, the key to using the third-octave-band ground vibration loss factors is to normalize each equation to a reference distance of 25 feet. This is done by first calculating the absolute vibration level at 25 feet using the original equations shown in Figure 6, and then subtracting that value from the con-stant at the end of the equations. Once this change is made, the 25-foot reference distance for the equation now matches the reference distance of the trainset’s source emission levels. The equations are then used as distance adjustment factors for calculating ground attenuation at distances beyond 25 feet from the source.
The equations shown in Figure 6 are natural log curve fits for each third-octave band. However, it is more common in the acous-tics industry to express these types of equations in a log (base 10) format, which can be done simply by multiplying the leading mul-tiplier by 2.303 and keeping the constant the same. For example, the ground propagation loss equation for broadband VdB levels was converted to log (base 10) by multiplying the –6.522 term by 2.303, and the result was then normalized to start at a reference distance of 25 feet by subtracting 63.0 (the absolute broadband VdB level at 25 feet) from the constant of 84.0. The new ground vibration at-tenuation equation can be expressed as VdB = –15.02 log (distance from source in feet) +21.0. The ground propagation attenuation equations for each individual third-octave band are developed in the same manner. The equations are provided in Figure 7.
Building Coupling TransmissibilityThe next step in the analysis involved determining the transmis-
sibility of vibration from outside to inside the NIH building itself. This is also called foundation coupling loss or attenuation. In this case, the transmissibility measurements had to be performed at two different locations in the NIH building due to two very different
structural conditions.The EM and MRI devices
were located in the sub-base-ment (two floors below grade) at the building’s northwest corner. The floor under the EM and MRI machines is a “floating” floor, meaning it has intentionally been detached from the building’s walls and foundation so that ambient vibration levels from outside the building are reduced con-siderably before reaching the EM or MRI devices. Using the drop weight at a fixed point outside the building, vibration levels were measured outside the building proximate to the exterior wall at grade and in-side the building’s basement in mechanical room B1A327,
as directly as possible under the point where the exterior measure-ments had been conducted.
Similarly, separate vibration transmissibility measurements were performed at the building’s southwest corner to evaluate the animal laboratory located in the sub-basement (three floors below grade). In this case, there was a 4-foot-wide, earth-filled concrete retention wall buried underground. Therefore, the drop weight was positioned outside of the retention wall to include its effects in the transmissibility results. Drop-weight vibration measurements were performed on the ground outside of the retention wall and inside the basement on the floor in storage room B1C901, as directly as possible under the point where the exterior measurements had been conducted.
In both cases, several drop-weight tests were performed to have sufficient data samples for statistical averaging purposes. The measurement instrumentation was carefully examined during the tests to ensure that there was sufficient vibration signal-to-noise ratio produced by the drop weight to yield meaningful results.
When expressed as vibration velocity levels in decibels, the transmissibility results were computed by simply subtracting the interior vibration levels from the exterior vibration levels, as shown
Figure 5. Ground propagation vibration levels at various distances.
Figure 6. Ground propagation curve-fit equations.
Figure 7. Ground vibration equations.

www.SandV.com SOUND & VIBRATION/AUGUST 2014 13
ments were performed directly at the base of the microscope in room B1A323. The electron microscope was labeled FEI Tecnia G Type: FP 5016/40. For the MRI, ambient vibration measurements were performed in the adjacent control room B1A737, which is on the same floor slab as the actual MRI machine. Two sets of ambi-ent vibration data were collected for the MRI machine, one with the MRI running at normal speed and one with the MRI at high speed. Finally, for the animal laboratory, ambient vibration data were collected in store room B1C909, which shared common walls and floor slab with rooms containing the animals.
The resulting ambient vibration levels are shown in Figure 9 along with the FTA’s vibration criteria curves. As can be seen, measured broadband ambient vibration levels of 45 VdB approach or exceed VC-E criteria for the MRI at high speed and for the animal lab area. Somewhat lower broadband ambient vibration levels of 39 VdB were found for the MRI at normal speed and for the EM area.
Results And FindingsThe results of the various analysis steps described above were
summed together to complete the vibration prediction model for this study. In general, conservative (worst-case) assumptions were made to predict the highest vibration levels that might be reason-ably expected. The important variables used in the final vibration model included the following:• Distance from proposed Red Line track location to NIH building’s
northeast corner = 470 feet• Distance from proposed Red Line track location to NIH building’s
southwest corner = 310 feet• Type of LRT vehicle assumed for proposed Red Line service =
Bombardier FLEXITY Swift trains• Type of track assumed for proposed Red Line service = ballast-
and-tie track• Speed assumed for proposed Red Line LRT vehicles = 30 miles
per hourGiven these assumptions and input data, the results of the vibra-
tion prediction model can be seen in Figure 10 for both the EM and MRI area and the animal lab area. The future Red Line LRT-induced broadband vibration level for the EM and MRI area is predicted to be an extremely low 23 VdB due largely to its floating floor. The future LRT-induced broadband vibration level affecting the animal lab area is expected to be a slightly higher – but still a very low 33 VdB. The results indicate that none of these areas inside the NIH building is expected to be exposed to future Red Line vibration levels approaching or exceeding FTA’s stringent vibration criteria.
Moreover, the predicted Red Line LRT vibration levels are expected to remain well below the electron microscope manufac-turer’s recommended limit of 300 micro-inches/second (or 50 VdB) as well as remaining several orders of magnitude below existing ambient vibration levels that currently have no adverse effect on these respective areas.
The predicted Red Line LRT vibration levels inside the NIH building, relevant criteria limits, ambient levels and conclusions regarding compliance are summarized in Table 2. Consequently, it is reasonably concluded that the Red Line LRT project poses no risk of adversely impacting the vibration-sensitive areas inside the NIH building.
ConclusionThe process of collecting site-specific, empirical ground-borne
vibration propagation data as well as building coupling and trans-missibility data was successfully performed using a simple drop weight rather than a more complex and expensive force density test apparatus as described in the FTA’s “Detailed” method. In this simpler method there is no need to compute transfer mobility. By using repetitive drop tests and data averaging, the vibration charac-teristics of the pathway could be established on both a broadband and spectral basis. Then by simply normalizing the pathway results to a reference distance of 25 feet (i.e. zero adjustment at 25 feet), the vibration levels at any location could be predicted for an LRT or other source whose vibration emission levels are known at the reference distance of 25 feet.The author can be contacted at [email protected].
in Figure 8. As can be seen, the resulting effect on the broadband vibration level from outside to inside the building was –20 VdB for the animal lab area with the underground retention wall, and as much as –34 VdB for the EM and MRI area due to the extra at-tenuation attributable to the floating floor.
Ambient Vibration LevelsA related step in this assignment involved measuring existing
ambient vibration levels near the EM and MRI devices and in the animal laboratory area. While it is instructive to compare current ambient vibration levels to future predicted Red Line vibration levels, existing ambient vibration levels are not required for de-veloping the Red Line vibration prediction model. It is noteworthy however, that the vibration-sensitive devices and animal experi-ments inside the NIH building are currently being successfully operated and conducted when exposed to the existing ambient vibration levels documented through these measurements.
Ambient vibration level measurements were performed in close proximity to the vibration-sensitive areas in the NIH building. Ambient data were collected for periods of about 15 to 30 minutes during the mid-day on May 8, 2012. For the EM, ambient measure-
Figure 9. Ambient vibration levels.
Figure 10. Predicted Red Line LT vibration results inside NIH building.
Figure 8. Building coupling transmissibility results.
Table 2. Summary of Red Line vibration results inside NIH building(all measurements VdB re 1 µ-in/sec).
NIH Compliance/Location Predicted Ambient FTA VC Mfr. Spec Exceedance
Electron 23 39 VC-D 48 50 Compliesmicroscope
Magnetic 23 39 - 45 VC-C 54 N/A Compliesres. imaging
Animal lab 33 45 72 N/A Comnplies