A simple criterion to evaluate the rupture of materials in ... · Striking bulbous bow impacts the...
20
A simple criterion to evaluate the rupture of materials in ship collision simulations B. Liu a, 1 , R. Villavicencio b, 2 , S. Zhang b, 3 , C. Guedes Soares a, *, 4 a Centre for Marine Technology and Ocean Engineering (CENTEC), Instituto Superior T ecnico, Universidade de Lisboa, Lisboa 1049-001, Portugal b Global Technology Centre, Lloyd's Register EMEA, Southampton S016-7QF, UK article info Article history: Received 22 November 2016 Received in revised form 1 March 2017 Accepted 28 March 2017 Available online 12 April 2017 Keywords: Ship structures Ship collision Critical failure strain Finite element simulation Force-displacement response Energy dissipation abstract The paper is dedicated to enhance the industry practice in collision simulations of ship structures when only limited time and material data are available. The idea is to establish a simple, but effective procedure to determine the ‘critical failure strain’ as a function of coarse mesh sizes, so as to predict the critical energy to be absorbed during the impact. For this reason, more complicated effects, such as strain-state dependence, strain concentra- tion on the lateral stiffening, welding, as well as accurate deformation mechanisms, are omitted. A new expression is introduced to estimate the failure strain of coarse meshed ship structures struck by an indenter with hemispherical shape where the ship side or bottom sustains local penetration during a bulbous bow collision or stranding. The expression is valid for mild and high strength steels, accounts for the size of the elements, and is derived from finite element simulations of coarse meshed plates punched until the onset of necking, which critical point is first determined by using fine meshed plates. This ‘simple’ criterion is validated against reported experiments of 3 stiffened plates and 6 double-hull structures quasi-statically punched by an indenter. For the 6 double-hull specimens evaluated here, the absorbed energy at the end of the impact event is predicted with sufficient accuracy when a coarse mesh of size 10 times the plate thickness is used (the difference is about 10%). © 2017 Elsevier Ltd. All rights reserved. 1. Introduction Ship collisions can result in loss of human lives and severe environmental damages. Therefore, increased attention has being paid to reduce the risk and consequences of such accidents. Currently, ship collision analyses take relevance not only for the design of large tankers and LNGs, but also for LNG-fuelled vessels, since the LNG tank should not be damaged by a collision. * Corresponding author. E-mail address: [email protected] (C. Guedes Soares). 1 Present address: School of Transportation, Wuhan University of Technology, Wuhan, China. 2 Member ISSC2018 Committee III.2 Fatigue and Fracture. 3 Member ISSC2015 Committee III.1 Ultimate Strength. 4 Chair ISSC2015, Chair ISSC-ITTC Joint Committee. Contents lists available at ScienceDirect Marine Structures journal homepage: www.elsevier.com/locate/marstruc http://dx.doi.org/10.1016/j.marstruc.2017.03.006 0951-8339/© 2017 Elsevier Ltd. All rights reserved. Marine Structures 54 (2017) 92e111
Transcript of A simple criterion to evaluate the rupture of materials in ... · Striking bulbous bow impacts the...
Marine Structures 54 (2017) 92e111
Contents lists available at ScienceDirect
Marine Structures
journal homepage: www.elsevier .com/locate/marstruc
A simple criterion to evaluate the rupture of materials in shipcollision simulations
B. Liu a, 1, R. Villavicencio b, 2, S. Zhang b, 3, C. Guedes Soares a, *, 4
a Centre for Marine Technology and Ocean Engineering (CENTEC), Instituto Superior T�ecnico, Universidade de Lisboa, Lisboa 1049-001,Portugalb Global Technology Centre, Lloyd's Register EMEA, Southampton S016-7QF, UK
a r t i c l e i n f o
Article history:Received 22 November 2016Received in revised form 1 March 2017Accepted 28 March 2017Available online 12 April 2017
Keywords:Ship structuresShip collisionCritical failure strainFinite element simulationForce-displacement responseEnergy dissipation
* Corresponding author.E-mail address: [email protected]
1 Present address: School of Transportation, Wuh2 Member ISSC2018 Committee III.2 Fatigue and3 Member ISSC2015 Committee III.1 Ultimate Stre4 Chair ISSC2015, Chair ISSC-ITTC Joint Committe
http://dx.doi.org/10.1016/j.marstruc.2017.03.0060951-8339/© 2017 Elsevier Ltd. All rights reserved.
a b s t r a c t
The paper is dedicated to enhance the industry practice in collision simulations of shipstructures when only limited time and material data are available. The idea is to establish asimple, but effective procedure to determine the ‘critical failure strain’ as a function ofcoarse mesh sizes, so as to predict the critical energy to be absorbed during the impact. Forthis reason, more complicated effects, such as strain-state dependence, strain concentra-tion on the lateral stiffening, welding, as well as accurate deformation mechanisms, areomitted.A new expression is introduced to estimate the failure strain of coarse meshed shipstructures struck by an indenter with hemispherical shape where the ship side or bottomsustains local penetration during a bulbous bow collision or stranding. The expression isvalid for mild and high strength steels, accounts for the size of the elements, and is derivedfrom finite element simulations of coarse meshed plates punched until the onset ofnecking, which critical point is first determined by using fine meshed plates. This ‘simple’criterion is validated against reported experiments of 3 stiffened plates and 6 double-hullstructures quasi-statically punched by an indenter. For the 6 double-hull specimensevaluated here, the absorbed energy at the end of the impact event is predicted withsufficient accuracy when a coarse mesh of size 10 times the plate thickness is used (thedifference is about 10%).
© 2017 Elsevier Ltd. All rights reserved.
1. Introduction
Ship collisions can result in loss of human lives and severe environmental damages. Therefore, increased attention hasbeing paid to reduce the risk and consequences of such accidents. Currently, ship collision analyses take relevance not only forthe design of large tankers and LNGs, but also for LNG-fuelled vessels, since the LNG tank should not be damaged by acollision.
lisboa.pt (C. Guedes Soares).an University of Technology, Wuhan, China.Fracture.ngth.e.
B. Liu et al. / Marine Structures 54 (2017) 92e111 93
Recently, Guidance Notes for Collision Assessment for the Location of Low-flashpoint Fuel Tanks have been published [1].These Guidance Notes recommend a simplified analytical method to estimate the energy absorbed by destroying shipstructural members in tension and crushing mode, as the scatter between experimental results and other alternativemethods, such as finite element simulations, is ‘still’ relatively large. While the accuracy of the simplified method wasdemonstrated and proven by Zhang and Pedersen [2] with 20 quality model tests from the public literature (absolute de-viations < 10%), Storheim et al. [3] found that the ‘mean absorbed energy’ predicted by 47 simulations (using different meshsizes and failure criteria) of 3 experiments of stiffened plates, supported between webs, deviates from 2.0% to 52% at peakforce and from 6.0% to 26% at the end of the simulations (Table 9 in Ref. [3]). This implies that a ship-to-ship collisionsimulation relies on an accurate definition of the material nonlinearities, andmost importantly, the size of the finite elementsconsidering the large dimensions of ship structures [4].
The nonlinear behaviour of the material includes plastic strain hardening and true fracture strain. Commonly, the me-chanical properties of the material are determined by tensile tests. Hence, the true stress-strain relationship is obtained fromthe recorded engineering stress-strain data in a power law form [5], or by combining the logarithmic flow stress curve untilthe onset of necking followed by a simple power law relation beyond localisation [6e8]. It should be mentioned that veryaccurate flowmaterial curves can be obtained by using optical systems that record the strain to failure in a uniaxial tensile test[9,10], but unfortunately, most structural analysts do not have tensile test data to define the flow stress curve as input intotheir finite element codes [11]. In fact, the information available from standards only includes the yield stress, the ultimatetensile stress and the engineering fracture strain [12]. Therefore, simplified formulae to define the true material curverepresent a valuable design tool, as that proposed by Server et al. [13].
The failure due to material rupture is still not well resolved numerically, because the fracture length is much smaller thanthe side length of finite elements [14]. Thus, it is difficult to establish a procedure suitable for the prediction of failure in theengineering practice, considering additionally, that the failure strain is highly dependent on the mesh size, and that it shouldaccount for the stress triaxiality to control the initiation of ductile fracture [15e17].
Storheim et al. [3] reviewed various failure criteria and named, and grouped, them as ‘simple strain-state-independent’and ‘advanced strain-state-dependent’ fracture criteria. The ‘simple’ criteria assume a constant critical equivalent strain oftendefined as mesh dependent, thus they are preferred for industrial application. Storheim et al. [3] concluded from the 47simulations that while at peak force the ‘advanced’ criteria behave significantly better than the ‘simple’ ones, as the defor-mation process becomes complex at the end of the impact event, the ‘simple’ criteria are able to represent the combinedprocess better than the ‘advanced’ ones. In practical industrial applications, such as collision assessment for the appraisal ofship structures [1], the interest is on the critical energy at a prescribed maximum penetration. Thus, a simple strain-state-independent criterion should represent advantages as a rapid and fair design tool.
A ship collision simulation with a relatively large mesh size and a true material curve based on a power law expressionprovides relatively accurate prediction of purely plastic responses [18,19]. However, necking and fracture occur over a narrowzone which is much smaller than the side length of the elements, and thus the large meshes (>5t, where t is the platethickness) cannot capture such local phenomena.
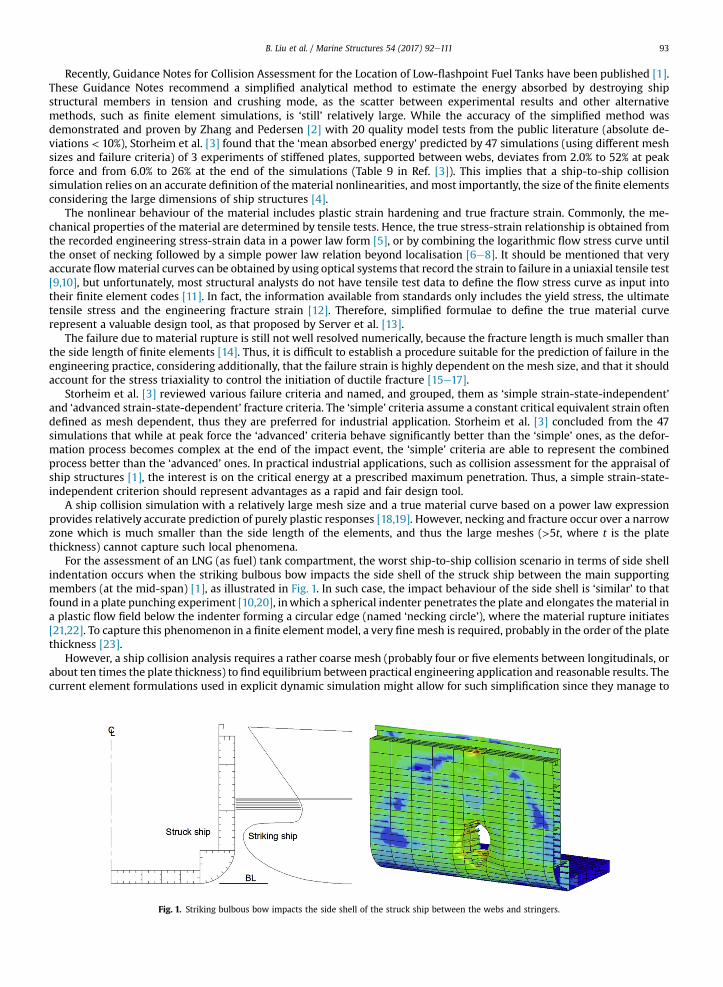
For the assessment of an LNG (as fuel) tank compartment, the worst ship-to-ship collision scenario in terms of side shellindentation occurs when the striking bulbous bow impacts the side shell of the struck ship between the main supportingmembers (at the mid-span) [1], as illustrated in Fig. 1. In such case, the impact behaviour of the side shell is ‘similar’ to thatfound in a plate punching experiment [10,20], inwhich a spherical indenter penetrates the plate and elongates thematerial ina plastic flow field below the indenter forming a circular edge (named ‘necking circle’), where the material rupture initiates[21,22]. To capture this phenomenon in a finite element model, a very fine mesh is required, probably in the order of the platethickness [23].
However, a ship collision analysis requires a rather coarse mesh (probably four or five elements between longitudinals, orabout ten times the plate thickness) to find equilibrium between practical engineering application and reasonable results. Thecurrent element formulations used in explicit dynamic simulation might allow for such simplification since they manage to
Fig. 1. Striking bulbous bow impacts the side shell of the struck ship between the webs and stringers.
B. Liu et al. / Marine Structures 54 (2017) 92e11194
capture the plastic behaviour of the structures with sufficient accuracy. On the other hand, both localisation and strainconcentration will be difficult to predict.
The present paper is dedicated to enhance the industry practice in collision simulations of ship structures when onlylimited time and material data are available. The idea is to establish a simple, but effective procedure to estimate the ‘criticalfailure strain’ as a function of themesh size, so that to predict the critical absorbed energy until a prescribed displacement. Forthis reason, more complicated effects, such as strain-state dependence, strain concentration on the lateral stiffening, welding,as well as accurate deformation mechanisms, are omitted, since they will be out of the scope of an appraisal assessment [1].
The paper introduces a new expression to estimate the failure strain of coarse meshed ship structures struck by anindenter with hemispherical shape so that to simulate a collision scenario similar to that shown in Fig. 1, or a strandingscenario [24,25]. This new expression can be considered as a ‘simple strain-state-independent failure criterion’ with a formsimilar to those proposed by Peschmann [26] and Zhang et al. [27], respectively named as PES and GL in Refs. [3,4].
The expression is valid for mild and high strength steel materials, accounts for the size of the elements, and is derived fromfinite element simulations of coarsemeshed plates punched until the onset of necking, which critical point is first determinedby simulations of finemeshed plates. This ‘simple criterion’ is validated against reported experiments of 3 stiffened plates [28]and 6 double-hull structures [29,30] quasi-statically punched by a conical indenter with hemispherical nose. For the 6double-hull specimens evaluated here, the absorbed energy at the end of the impact event is predicted with sufficient ac-curacy when a coarse mesh of size 10t is used (the difference is about 10%).
2. Material characterisation
The true stress-strain material curve is determined with the analytical expression reported in Ref. [13], but it is ‘slightly’modified as described in Section 2.1. To estimate the critical failure strain, it is proposed a new expression for coarsemeshes asdetailed in Section 2.2.
2.1. Flow material curve
For design purposes, the material properties of structural steels are obtained from standards and include: yield stress,ultimate tensile strength and engineering fracture strain [12]. In practice, the engineering stress-strain curve is not availableat the design stage to determine the strain hardening of the material, and thus analytical expressions are required to estimatethe flow stress curve, as the one recommended next.
Sever et al. [13] proposed to determine the true material stress-strain curve with the yield stress and the ultimate tensilestrength. Here, this approach is slightly modified to obtain a better approximation with the logarithmic true stress untilnecking [5]. For simplicity, it is assumed that (Fig. 2a): (1) the true strain at the ‘origin’ of the flow curve is εt ¼ 0.006, (2) theengineering strain at the ultimate tensile strength (εu) is equal to the strain hardening exponent (n), (3) the yield stress andthe origin of the flow curve are simply connected by a line (negligible yield plateau). Thus, the strength coefficient (K) and thestrain hardening exponent (n) can be determined by Eqs. (1) and (2) when the yield stress (sy) and the ultimate tensilestrength (suts) are known:
sy ¼ K,0:006n (1)
sutsð1þ nÞ ¼ K½lnð1þ nÞ�n (2)
n
Later, the true stress is determined by the power law relation st ¼ K εt when εt > 0.006.Eqs. (1) and (2) are valid for mild and high tensile strength steels (yield stress between 235 and 355 MPa, as defined inRef. [31]), since the flow stress curve of these steels can be described by simple power law relations [5]. Fig. 2b shows a
Fig. 2. Flow material curve. (a): Assumptions for the definition of true material stress-strain curve. (b): Comparison with experimental data from Ref. [28].
B. Liu et al. / Marine Structures 54 (2017) 92e111 95
comparison of the true material curve, which parameters are determined by Eqs. (1) and (2), with the logarithmic stress untilnecking obtained from a tensile test experiment; good agreement is observed.
For this material model, the origin of the flow curve is assumed at 0.006 only to determine the material parameters K andn. This negligible extension of the yield plateau (from 0.001 to 0.006), which for steels can extend until about 0.02, affects onlyslightly the strain hardening and associated strain localisation [3,32]. The assumption that εu ¼ n, which helps to definesimply and rapidly the true stress at the ultimate tensile strength (suts(1þεu)), is also justified since the material ductility isoverestimated no more than 5.0% when compared with the simplified expression ln(1þεu) ¼ n reported in Ref. [5].
2.2. Critical failure strain
The behaviour of laterally impacted ship stiffened plates between primary supporting members (Fig. 1), suffering largeout-of-plane deformation, is similar to that found in plate punching tests in which the stress localisation develops at thenecking circle [16,33,34]. Therefore, it is suggested that the ‘new expression’ to estimate the failure strain of coarse meshes isderived using finite element simulations of plate punching tests.
This type of simulations requires a very fine mesh to capture the width of the neck since it approximates the platethickness [23]. Here, a mesh equal to twice the plate thickness (2t) is first used to determine the penetration at the onset ofnecking (Section 2.2.1) [22]. Later, simulations of coarse meshed plates (5e20t) are selected to derive the new expression(Section 2.2.2).
2.2.1. Determination of the onset of neckingAmesh size of 2t is first used to determine the onset of necking where it is assumed that failure occurs (initial rupture). In
practice, however, the indenter continues displacing vertically ‘very few’millimetres before the rupture occurs at the neckingcircle. Thus, a ‘very similar’ response is obtained whether the critical failure strain is defined as the strain at necking or atrupture, as assumed in various theoretical approaches [16,33,34].
Here, the critical displacement of the indenter df (critical deflection of the plate at rupture), used in the simulations, isestimated by the analytical expression proposed by Simonsen and Lauridsen [33] which is valid for circular and square platespunched laterally by a spherical indenter:
df ¼ 1:41n0:33R0:480 R0:52b (3)
where n is the material strain hardening exponent (0.1 < n < 0.3), Rb is the radius of a spherical indenter and R0 is the radius ofa circular plate or the half width of a square plate.
Eq. (3) is valid for 2 < R0/Rb < 10 and assumes that the plate elements displace only vertically during the deformation [33].Out of this range, the critical deflection is respectively over or under estimated for a smaller or a larger ratio R0/Rb [35,36]. Thisexpression is selected since it provides good agreement with experimental results, as demonstrated in Appendix A (Table A1).
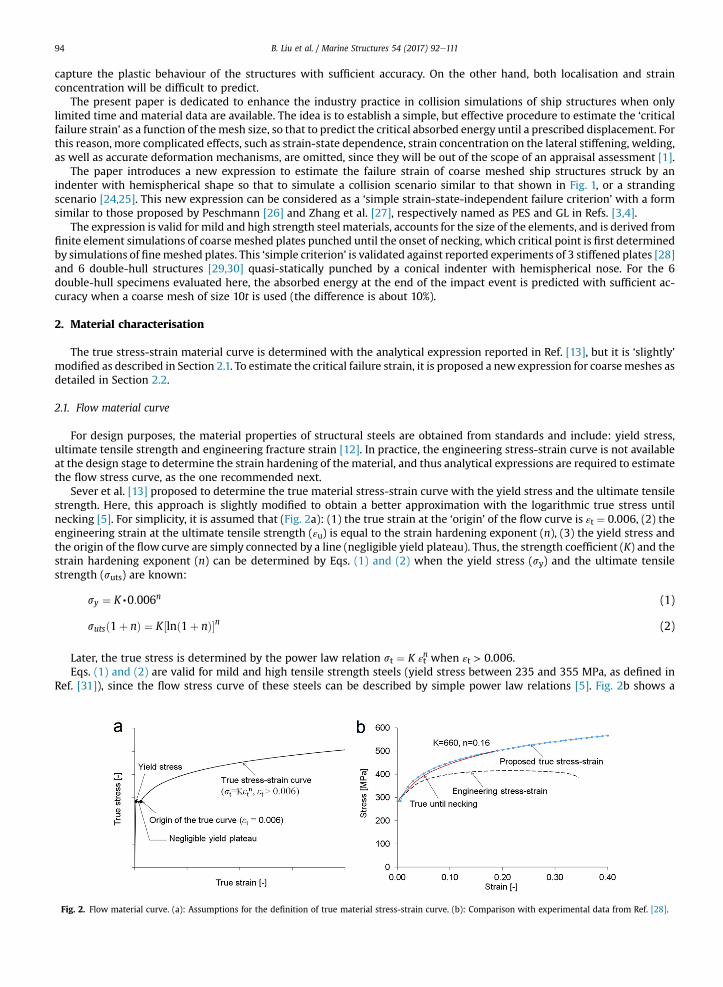
The main characteristics of the simulations of the fine meshed plates are: (1) the maximum vertical displacement of theindenter is estimated by Eq. (3), and at this point the simulation stops, (2) a square plate is modelled by shell finite elements ofsize 2t to capture the onset of necking [16], see Fig. 3, (3) R0/Rb ¼ 2 so that to punch the largest number of elements.
The spherical indenter penetrates the square plate with ductile enlargement to elongate the material in a plastic flow fieldbelow the indenter forming the necking circle, as shown in Fig. 4. The finite element that experiences the maximum plasticdeformation at the necking circle will fail first just few millimetres beyond localisation (onset of necking); this element isnamed here ‘first failing element’. Once the simulation stops, the plate could have fail (rupture) or not, but the post-processing of the element suffering themaximumplastic strain demonstrates that localisation at the necking circle is evident.
Five square plates from experiments reported in the literature are selected to conduct the simulations (see Table 1). Theonset of necking of the first failing element is represented by a quick change in the slope of the curve ‘strain of the first failingelement’ versus ‘vertical displacement of the indenter’. The intersection of dashed lines in Fig. 5 shows this transition point forthe PlateModels 2 and 4 (see Table 1). Beyond this point, the plastic strain of this element increases rapidly as the indentationprogresses. It should be mentioned that for all plates the post-processed necking strain (εn) is about 0.50 and that a similarnumerical magnitude for the necking strainwas reported in Refs. [16,34] (Fig. 12 in Ref. [16] and Fig. 18 in Ref. [34]). Moreover,
Fig. 3. Square plate model to determine the onset of necking.
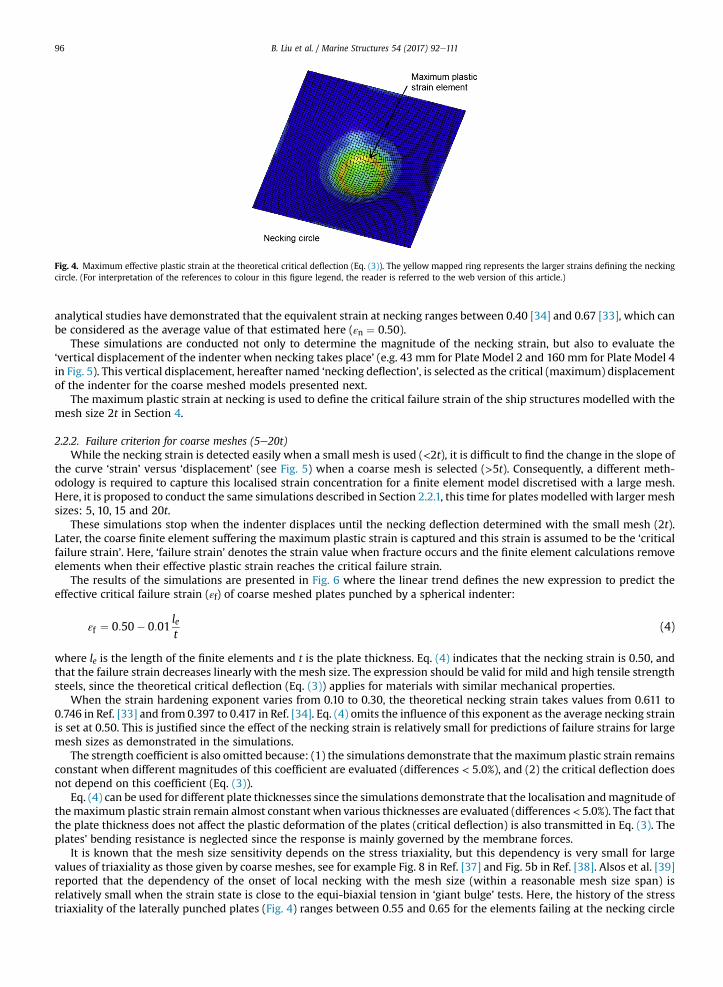
Fig. 4. Maximum effective plastic strain at the theoretical critical deflection (Eq. (3)). The yellow mapped ring represents the larger strains defining the neckingcircle. (For interpretation of the references to colour in this figure legend, the reader is referred to the web version of this article.)
B. Liu et al. / Marine Structures 54 (2017) 92e11196
analytical studies have demonstrated that the equivalent strain at necking ranges between 0.40 [34] and 0.67 [33], which canbe considered as the average value of that estimated here (εn ¼ 0.50).
These simulations are conducted not only to determine the magnitude of the necking strain, but also to evaluate the‘vertical displacement of the indenter when necking takes place’ (e.g. 43 mm for Plate Model 2 and 160 mm for Plate Model 4in Fig. 5). This vertical displacement, hereafter named ‘necking deflection’, is selected as the critical (maximum) displacementof the indenter for the coarse meshed models presented next.
The maximum plastic strain at necking is used to define the critical failure strain of the ship structures modelled with themesh size 2t in Section 4.
2.2.2. Failure criterion for coarse meshes (5e20t)While the necking strain is detected easily when a small mesh is used (<2t), it is difficult to find the change in the slope of
the curve ‘strain’ versus ‘displacement’ (see Fig. 5) when a coarse mesh is selected (>5t). Consequently, a different meth-odology is required to capture this localised strain concentration for a finite element model discretised with a large mesh.Here, it is proposed to conduct the same simulations described in Section 2.2.1, this time for plates modelled with larger meshsizes: 5, 10, 15 and 20t.
These simulations stop when the indenter displaces until the necking deflection determined with the small mesh (2t).Later, the coarse finite element suffering the maximum plastic strain is captured and this strain is assumed to be the ‘criticalfailure strain’. Here, ‘failure strain’ denotes the strain value when fracture occurs and the finite element calculations removeelements when their effective plastic strain reaches the critical failure strain.
The results of the simulations are presented in Fig. 6 where the linear trend defines the new expression to predict theeffective critical failure strain (εf) of coarse meshed plates punched by a spherical indenter:
εf ¼ 0:50� 0:01let
(4)
where le is the length of the finite elements and t is the plate thickness. Eq. (4) indicates that the necking strain is 0.50, andthat the failure strain decreases linearly with the mesh size. The expression should be valid for mild and high tensile strengthsteels, since the theoretical critical deflection (Eq. (3)) applies for materials with similar mechanical properties.
When the strain hardening exponent varies from 0.10 to 0.30, the theoretical necking strain takes values from 0.611 to0.746 in Ref. [33] and from 0.397 to 0.417 in Ref. [34]. Eq. (4) omits the influence of this exponent as the average necking strainis set at 0.50. This is justified since the effect of the necking strain is relatively small for predictions of failure strains for largemesh sizes as demonstrated in the simulations.
The strength coefficient is also omitted because: (1) the simulations demonstrate that themaximum plastic strain remainsconstant when different magnitudes of this coefficient are evaluated (differences < 5.0%), and (2) the critical deflection doesnot depend on this coefficient (Eq. (3)).
Eq. (4) can be used for different plate thicknesses since the simulations demonstrate that the localisation andmagnitude ofthemaximum plastic strain remain almost constant when various thicknesses are evaluated (differences < 5.0%). The fact thatthe plate thickness does not affect the plastic deformation of the plates (critical deflection) is also transmitted in Eq. (3). Theplates' bending resistance is neglected since the response is mainly governed by the membrane forces.
It is known that the mesh size sensitivity depends on the stress triaxiality, but this dependency is very small for largevalues of triaxiality as those given by coarse meshes, see for example Fig. 8 in Ref. [37] and Fig. 5b in Ref. [38]. Alsos et al. [39]reported that the dependency of the onset of local necking with the mesh size (within a reasonable mesh size span) isrelatively small when the strain state is close to the equi-biaxial tension in ‘giant bulge’ tests. Here, the history of the stresstriaxiality of the laterally punched plates (Fig. 4) ranges between 0.55 and 0.65 for the elements failing at the necking circle
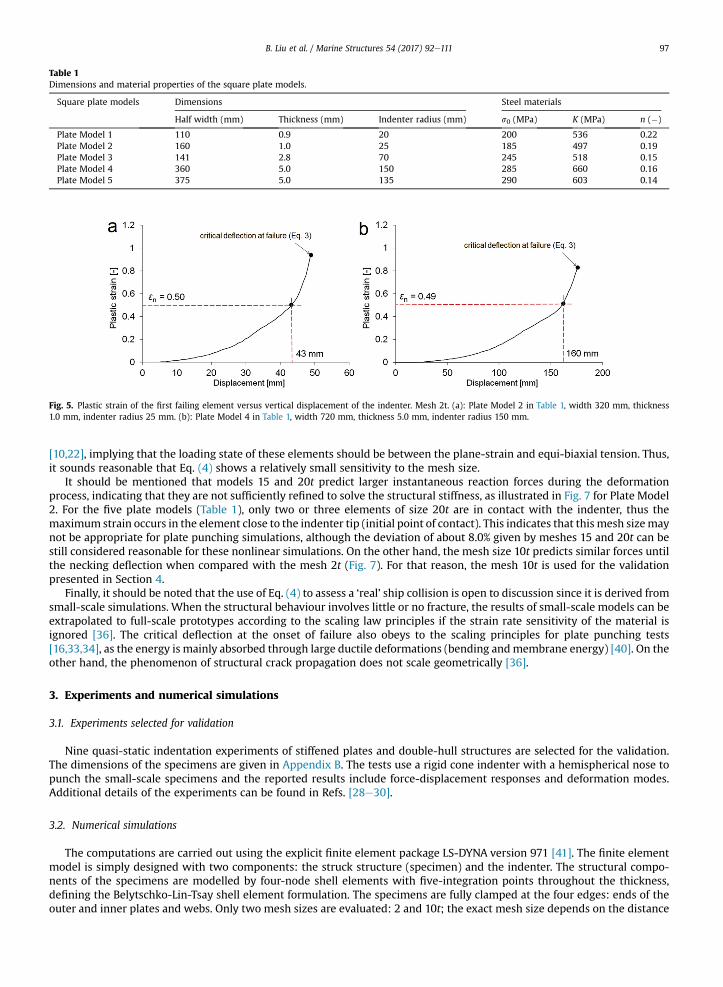
Table 1Dimensions and material properties of the square plate models.
Square plate models Dimensions Steel materials
Half width (mm) Thickness (mm) Indenter radius (mm) s0 (MPa) K (MPa) n (�)
Plate Model 1 110 0.9 20 200 536 0.22Plate Model 2 160 1.0 25 185 497 0.19Plate Model 3 141 2.8 70 245 518 0.15Plate Model 4 360 5.0 150 285 660 0.16Plate Model 5 375 5.0 135 290 603 0.14
Fig. 5. Plastic strain of the first failing element versus vertical displacement of the indenter. Mesh 2t. (a): Plate Model 2 in Table 1, width 320 mm, thickness1.0 mm, indenter radius 25 mm. (b): Plate Model 4 in Table 1, width 720 mm, thickness 5.0 mm, indenter radius 150 mm.
B. Liu et al. / Marine Structures 54 (2017) 92e111 97
[10,22], implying that the loading state of these elements should be between the plane-strain and equi-biaxial tension. Thus,it sounds reasonable that Eq. (4) shows a relatively small sensitivity to the mesh size.
It should be mentioned that models 15 and 20t predict larger instantaneous reaction forces during the deformationprocess, indicating that they are not sufficiently refined to solve the structural stiffness, as illustrated in Fig. 7 for Plate Model2. For the five plate models (Table 1), only two or three elements of size 20t are in contact with the indenter, thus themaximum strain occurs in the element close to the indenter tip (initial point of contact). This indicates that this mesh sizemaynot be appropriate for plate punching simulations, although the deviation of about 8.0% given by meshes 15 and 20t can bestill considered reasonable for these nonlinear simulations. On the other hand, the mesh size 10t predicts similar forces untilthe necking deflection when compared with the mesh 2t (Fig. 7). For that reason, the mesh 10t is used for the validationpresented in Section 4.
Finally, it should be noted that the use of Eq. (4) to assess a ‘real’ ship collision is open to discussion since it is derived fromsmall-scale simulations. When the structural behaviour involves little or no fracture, the results of small-scale models can beextrapolated to full-scale prototypes according to the scaling law principles if the strain rate sensitivity of the material isignored [36]. The critical deflection at the onset of failure also obeys to the scaling principles for plate punching tests[16,33,34], as the energy is mainly absorbed through large ductile deformations (bending andmembrane energy) [40]. On theother hand, the phenomenon of structural crack propagation does not scale geometrically [36].
3. Experiments and numerical simulations
3.1. Experiments selected for validation
Nine quasi-static indentation experiments of stiffened plates and double-hull structures are selected for the validation.The dimensions of the specimens are given in Appendix B. The tests use a rigid cone indenter with a hemispherical nose topunch the small-scale specimens and the reported results include force-displacement responses and deformation modes.Additional details of the experiments can be found in Refs. [28e30].
3.2. Numerical simulations
The computations are carried out using the explicit finite element package LS-DYNA version 971 [41]. The finite elementmodel is simply designed with two components: the struck structure (specimen) and the indenter. The structural compo-nents of the specimens are modelled by four-node shell elements with five-integration points throughout the thickness,defining the Belytschko-Lin-Tsay shell element formulation. The specimens are fully clamped at the four edges: ends of theouter and inner plates and webs. Only two mesh sizes are evaluated: 2 and 10t; the exact mesh size depends on the distance
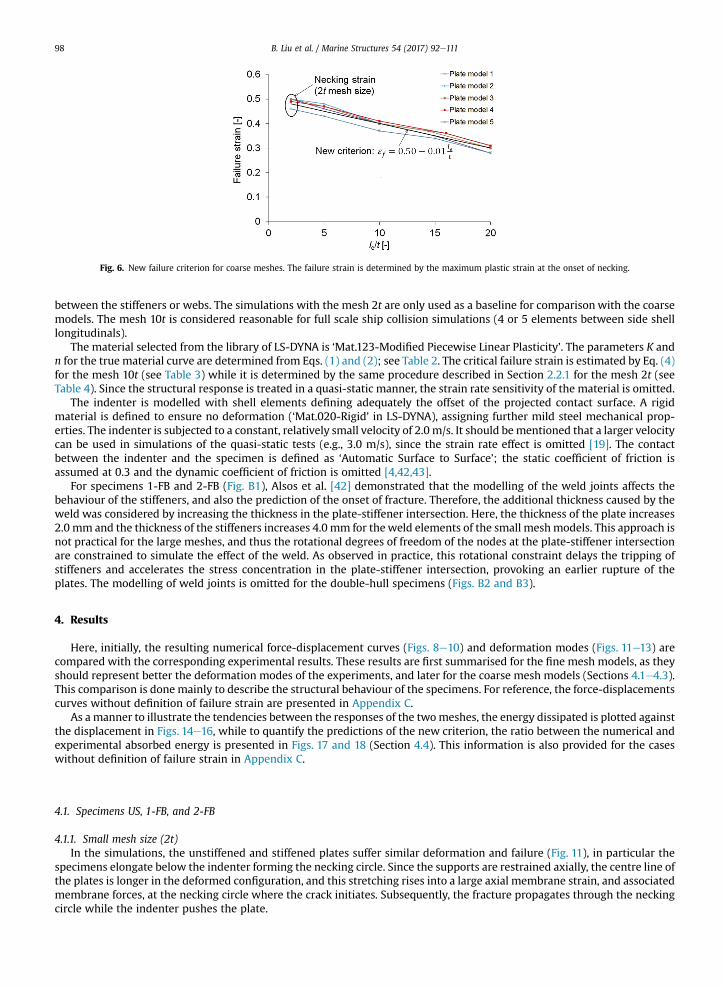
Fig. 6. New failure criterion for coarse meshes. The failure strain is determined by the maximum plastic strain at the onset of necking.
B. Liu et al. / Marine Structures 54 (2017) 92e11198
between the stiffeners or webs. The simulations with the mesh 2t are only used as a baseline for comparison with the coarsemodels. The mesh 10t is considered reasonable for full scale ship collision simulations (4 or 5 elements between side shelllongitudinals).
The material selected from the library of LS-DYNA is ‘Mat.123-Modified Piecewise Linear Plasticity’. The parameters K andn for the true material curve are determined from Eqs. (1) and (2); see Table 2. The critical failure strain is estimated by Eq. (4)for the mesh 10t (see Table 3) while it is determined by the same procedure described in Section 2.2.1 for the mesh 2t (seeTable 4). Since the structural response is treated in a quasi-static manner, the strain rate sensitivity of the material is omitted.
The indenter is modelled with shell elements defining adequately the offset of the projected contact surface. A rigidmaterial is defined to ensure no deformation (‘Mat.020-Rigid’ in LS-DYNA), assigning further mild steel mechanical prop-erties. The indenter is subjected to a constant, relatively small velocity of 2.0 m/s. It should bementioned that a larger velocitycan be used in simulations of the quasi-static tests (e.g., 3.0 m/s), since the strain rate effect is omitted [19]. The contactbetween the indenter and the specimen is defined as ‘Automatic Surface to Surface’; the static coefficient of friction isassumed at 0.3 and the dynamic coefficient of friction is omitted [4,42,43].
For specimens 1-FB and 2-FB (Fig. B1), Alsos et al. [42] demonstrated that the modelling of the weld joints affects thebehaviour of the stiffeners, and also the prediction of the onset of fracture. Therefore, the additional thickness caused by theweld was considered by increasing the thickness in the plate-stiffener intersection. Here, the thickness of the plate increases2.0 mm and the thickness of the stiffeners increases 4.0 mm for theweld elements of the small meshmodels. This approach isnot practical for the large meshes, and thus the rotational degrees of freedom of the nodes at the plate-stiffener intersectionare constrained to simulate the effect of the weld. As observed in practice, this rotational constraint delays the tripping ofstiffeners and accelerates the stress concentration in the plate-stiffener intersection, provoking an earlier rupture of theplates. The modelling of weld joints is omitted for the double-hull specimens (Figs. B2 and B3).
4. Results
Here, initially, the resulting numerical force-displacement curves (Figs. 8e10) and deformation modes (Figs. 11e13) arecompared with the corresponding experimental results. These results are first summarised for the fine mesh models, as theyshould represent better the deformation modes of the experiments, and later for the coarse mesh models (Sections 4.1e4.3).This comparison is done mainly to describe the structural behaviour of the specimens. For reference, the force-displacementscurves without definition of failure strain are presented in Appendix C.
As a manner to illustrate the tendencies between the responses of the twomeshes, the energy dissipated is plotted againstthe displacement in Figs. 14e16, while to quantify the predictions of the new criterion, the ratio between the numerical andexperimental absorbed energy is presented in Figs. 17 and 18 (Section 4.4). This information is also provided for the caseswithout definition of failure strain in Appendix C.
4.1. Specimens US, 1-FB, and 2-FB
4.1.1. Small mesh size (2t)In the simulations, the unstiffened and stiffened plates suffer similar deformation and failure (Fig. 11), in particular the
specimens elongate below the indenter forming the necking circle. Since the supports are restrained axially, the centre line ofthe plates is longer in the deformed configuration, and this stretching rises into a large axial membrane strain, and associatedmembrane forces, at the necking circle where the crack initiates. Subsequently, the fracture propagates through the neckingcircle while the indenter pushes the plate.
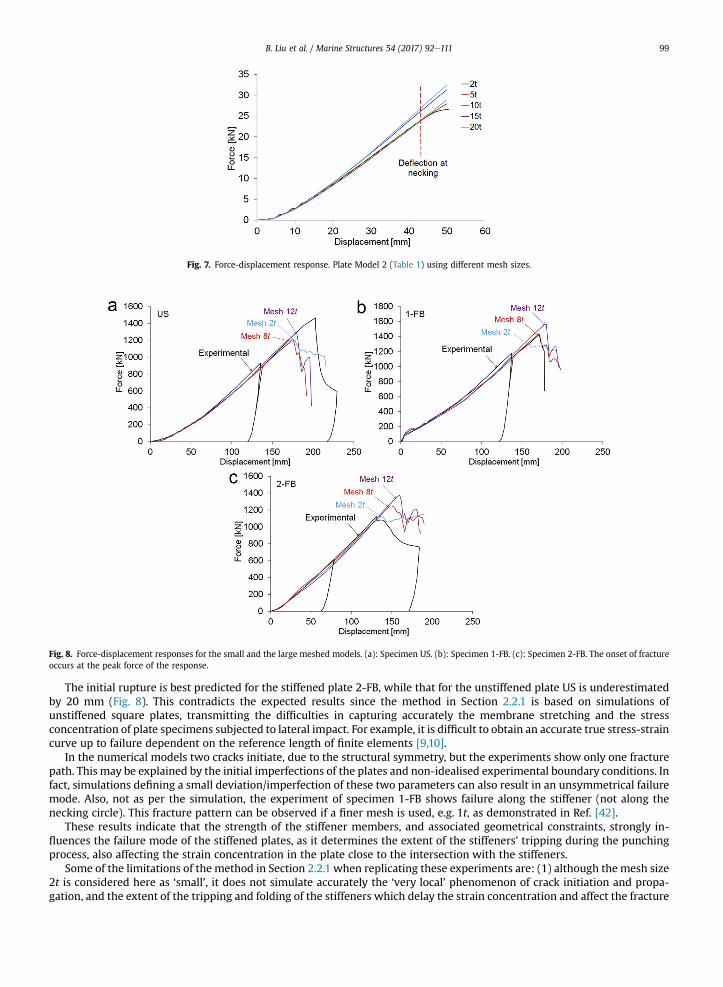
Fig. 7. Force-displacement response. Plate Model 2 (Table 1) using different mesh sizes.
Fig. 8. Force-displacement responses for the small and the large meshed models. (a): Specimen US. (b): Specimen 1-FB. (c): Specimen 2-FB. The onset of fractureoccurs at the peak force of the response.
B. Liu et al. / Marine Structures 54 (2017) 92e111 99
The initial rupture is best predicted for the stiffened plate 2-FB, while that for the unstiffened plate US is underestimatedby 20 mm (Fig. 8). This contradicts the expected results since the method in Section 2.2.1 is based on simulations ofunstiffened square plates, transmitting the difficulties in capturing accurately the membrane stretching and the stressconcentration of plate specimens subjected to lateral impact. For example, it is difficult to obtain an accurate true stress-straincurve up to failure dependent on the reference length of finite elements [9,10].
In the numerical models two cracks initiate, due to the structural symmetry, but the experiments show only one fracturepath. This may be explained by the initial imperfections of the plates and non-idealised experimental boundary conditions. Infact, simulations defining a small deviation/imperfection of these two parameters can also result in an unsymmetrical failuremode. Also, not as per the simulation, the experiment of specimen 1-FB shows failure along the stiffener (not along thenecking circle). This fracture pattern can be observed if a finer mesh is used, e.g. 1t, as demonstrated in Ref. [42].
These results indicate that the strength of the stiffener members, and associated geometrical constraints, strongly in-fluences the failure mode of the stiffened plates, as it determines the extent of the stiffeners' tripping during the punchingprocess, also affecting the strain concentration in the plate close to the intersection with the stiffeners.
Some of the limitations of the method in Section 2.2.1 when replicating these experiments are: (1) although the mesh size2t is considered here as ‘small’, it does not simulate accurately the ‘very local’ phenomenon of crack initiation and propa-gation, and the extent of the tripping and folding of the stiffeners which delay the strain concentration and affect the fracture
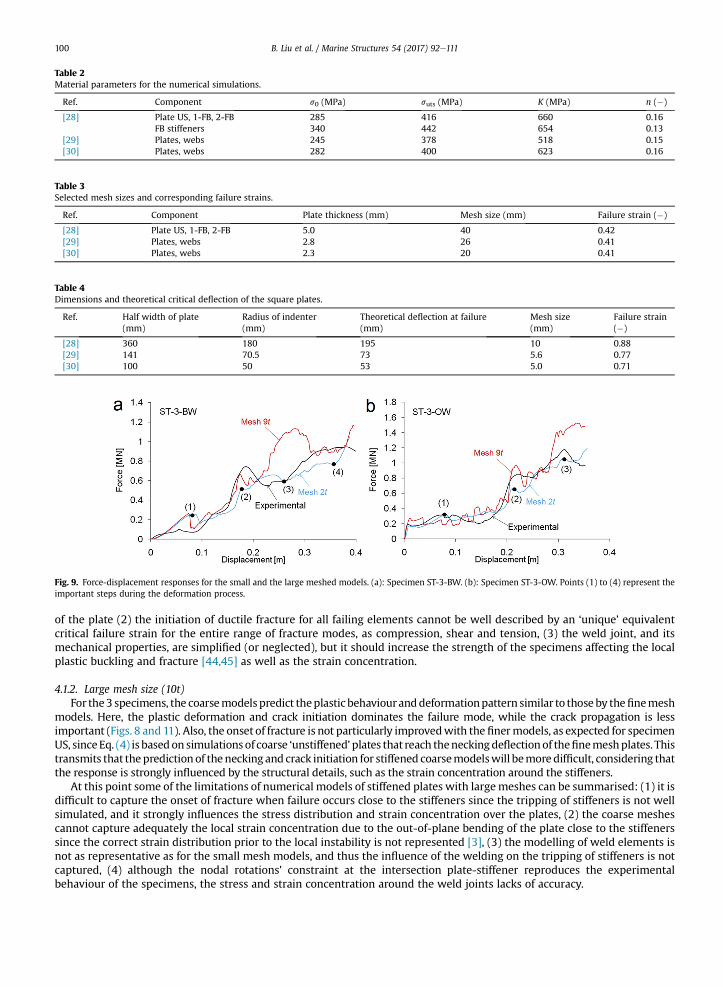
Table 2Material parameters for the numerical simulations.
Ref. Component s0 (MPa) suts (MPa) K (MPa) n (�)
[28] Plate US, 1-FB, 2-FB 285 416 660 0.16FB stiffeners 340 442 654 0.13
[29] Plates, webs 245 378 518 0.15[30] Plates, webs 282 400 623 0.16
Table 3Selected mesh sizes and corresponding failure strains.
Ref. Component Plate thickness (mm) Mesh size (mm) Failure strain (�)
[28] Plate US, 1-FB, 2-FB 5.0 40 0.42[29] Plates, webs 2.8 26 0.41[30] Plates, webs 2.3 20 0.41
Table 4Dimensions and theoretical critical deflection of the square plates.
Ref. Half width of plate(mm)
Radius of indenter(mm)
Theoretical deflection at failure(mm)
Mesh size(mm)
Failure strain(�)
[28] 360 180 195 10 0.88[29] 141 70.5 73 5.6 0.77[30] 100 50 53 5.0 0.71
Fig. 9. Force-displacement responses for the small and the large meshed models. (a): Specimen ST-3-BW. (b): Specimen ST-3-OW. Points (1) to (4) represent theimportant steps during the deformation process.
B. Liu et al. / Marine Structures 54 (2017) 92e111100
of the plate (2) the initiation of ductile fracture for all failing elements cannot be well described by an ‘unique’ equivalentcritical failure strain for the entire range of fracture modes, as compression, shear and tension, (3) the weld joint, and itsmechanical properties, are simplified (or neglected), but it should increase the strength of the specimens affecting the localplastic buckling and fracture [44,45] as well as the strain concentration.
4.1.2. Large mesh size (10t)For the3 specimens, the coarsemodels predict theplastic behaviouranddeformationpattern similar to those by thefinemesh
models. Here, the plastic deformation and crack initiation dominates the failure mode, while the crack propagation is lessimportant (Figs. 8 and 11). Also, the onset of fracture is not particularly improvedwith the finermodels, as expected for specimenUS, sinceEq. (4) is basedon simulations of coarse ‘unstiffened’plates that reach theneckingdeflectionof thefinemeshplates. Thistransmits that thepredictionof thenecking and crack initiation for stiffened coarsemodelswill bemoredifficult, considering thatthe response is strongly influenced by the structural details, such as the strain concentration around the stiffeners.
At this point some of the limitations of numerical models of stiffened plates with largemeshes can be summarised: (1) it isdifficult to capture the onset of fracture when failure occurs close to the stiffeners since the tripping of stiffeners is not wellsimulated, and it strongly influences the stress distribution and strain concentration over the plates, (2) the coarse meshescannot capture adequately the local strain concentration due to the out-of-plane bending of the plate close to the stiffenerssince the correct strain distribution prior to the local instability is not represented [3], (3) the modelling of weld elements isnot as representative as for the small mesh models, and thus the influence of the welding on the tripping of stiffeners is notcaptured, (4) although the nodal rotations' constraint at the intersection plate-stiffener reproduces the experimentalbehaviour of the specimens, the stress and strain concentration around the weld joints lacks of accuracy.
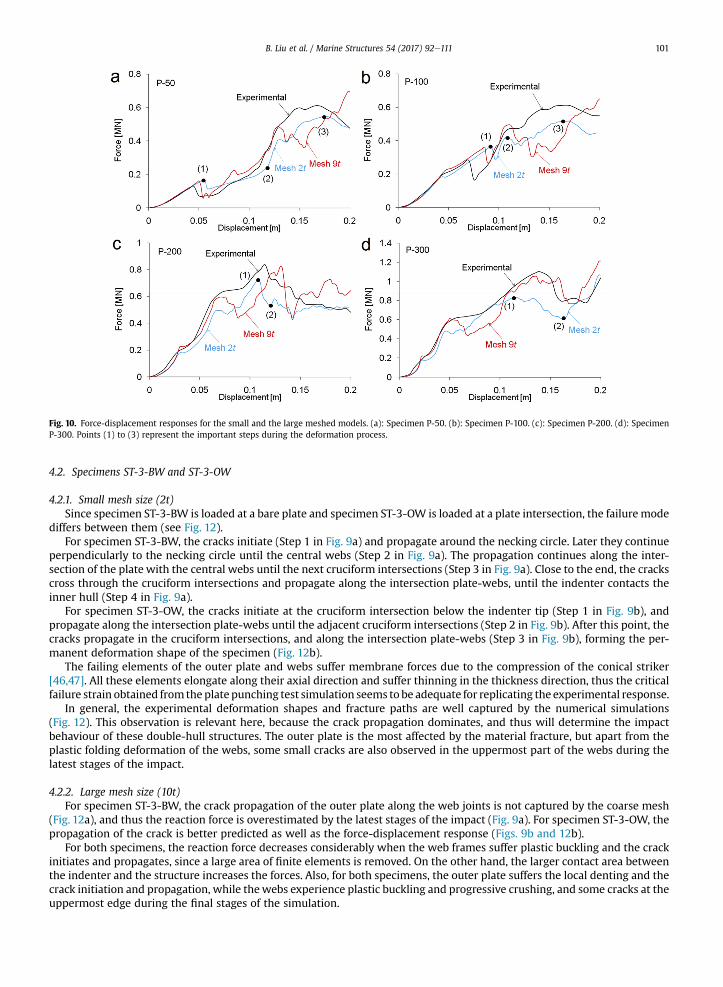
Fig. 10. Force-displacement responses for the small and the large meshed models. (a): Specimen P-50. (b): Specimen P-100. (c): Specimen P-200. (d): SpecimenP-300. Points (1) to (3) represent the important steps during the deformation process.
B. Liu et al. / Marine Structures 54 (2017) 92e111 101
4.2. Specimens ST-3-BW and ST-3-OW
4.2.1. Small mesh size (2t)Since specimen ST-3-BW is loaded at a bare plate and specimen ST-3-OW is loaded at a plate intersection, the failuremode
differs between them (see Fig. 12).For specimen ST-3-BW, the cracks initiate (Step 1 in Fig. 9a) and propagate around the necking circle. Later they continue
perpendicularly to the necking circle until the central webs (Step 2 in Fig. 9a). The propagation continues along the inter-section of the plate with the central webs until the next cruciform intersections (Step 3 in Fig. 9a). Close to the end, the crackscross through the cruciform intersections and propagate along the intersection plate-webs, until the indenter contacts theinner hull (Step 4 in Fig. 9a).
For specimen ST-3-OW, the cracks initiate at the cruciform intersection below the indenter tip (Step 1 in Fig. 9b), andpropagate along the intersection plate-webs until the adjacent cruciform intersections (Step 2 in Fig. 9b). After this point, thecracks propagate in the cruciform intersections, and along the intersection plate-webs (Step 3 in Fig. 9b), forming the per-manent deformation shape of the specimen (Fig. 12b).
The failing elements of the outer plate and webs suffer membrane forces due to the compression of the conical striker[46,47]. All these elements elongate along their axial direction and suffer thinning in the thickness direction, thus the criticalfailure strain obtained from the plate punching test simulation seems tobe adequate for replicating the experimental response.
In general, the experimental deformation shapes and fracture paths are well captured by the numerical simulations(Fig. 12). This observation is relevant here, because the crack propagation dominates, and thus will determine the impactbehaviour of these double-hull structures. The outer plate is the most affected by the material fracture, but apart from theplastic folding deformation of the webs, some small cracks are also observed in the uppermost part of the webs during thelatest stages of the impact.
4.2.2. Large mesh size (10t)For specimen ST-3-BW, the crack propagation of the outer plate along the web joints is not captured by the coarse mesh
(Fig. 12a), and thus the reaction force is overestimated by the latest stages of the impact (Fig. 9a). For specimen ST-3-OW, thepropagation of the crack is better predicted as well as the force-displacement response (Figs. 9b and 12b).
For both specimens, the reaction force decreases considerably when the web frames suffer plastic buckling and the crackinitiates and propagates, since a large area of finite elements is removed. On the other hand, the larger contact area betweenthe indenter and the structure increases the forces. Also, for both specimens, the outer plate suffers the local denting and thecrack initiation and propagation, while thewebs experience plastic buckling and progressive crushing, and some cracks at theuppermost edge during the final stages of the simulation.
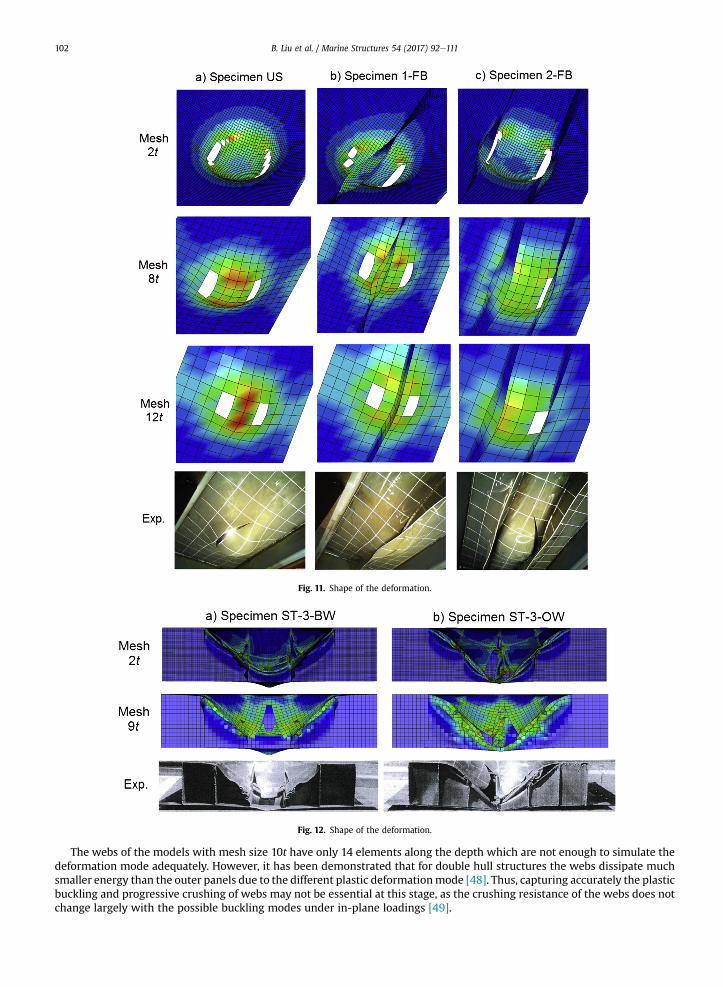
Fig. 11. Shape of the deformation.
Fig. 12. Shape of the deformation.
B. Liu et al. / Marine Structures 54 (2017) 92e111102
The webs of the models with mesh size 10t have only 14 elements along the depth which are not enough to simulate thedeformation mode adequately. However, it has been demonstrated that for double hull structures the webs dissipate muchsmaller energy than the outer panels due to the different plastic deformationmode [48]. Thus, capturing accurately the plasticbuckling and progressive crushing of webs may not be essential at this stage, as the crushing resistance of the webs does notchange largely with the possible buckling modes under in-plane loadings [49].
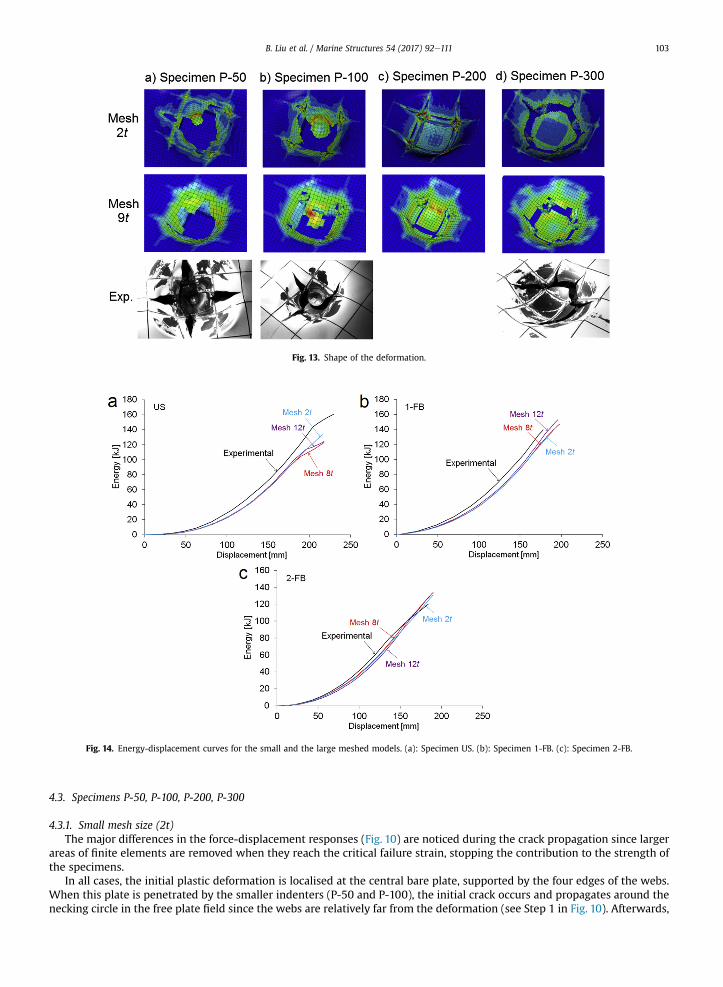
Fig. 13. Shape of the deformation.
Fig. 14. Energy-displacement curves for the small and the large meshed models. (a): Specimen US. (b): Specimen 1-FB. (c): Specimen 2-FB.
B. Liu et al. / Marine Structures 54 (2017) 92e111 103
4.3. Specimens P-50, P-100, P-200, P-300
4.3.1. Small mesh size (2t)The major differences in the force-displacement responses (Fig. 10) are noticed during the crack propagation since larger
areas of finite elements are removed when they reach the critical failure strain, stopping the contribution to the strength ofthe specimens.
In all cases, the initial plastic deformation is localised at the central bare plate, supported by the four edges of the webs.When this plate is penetrated by the smaller indenters (P-50 and P-100), the initial crack occurs and propagates around thenecking circle in the free plate field since the webs are relatively far from the deformation (see Step 1 in Fig. 10). Afterwards,
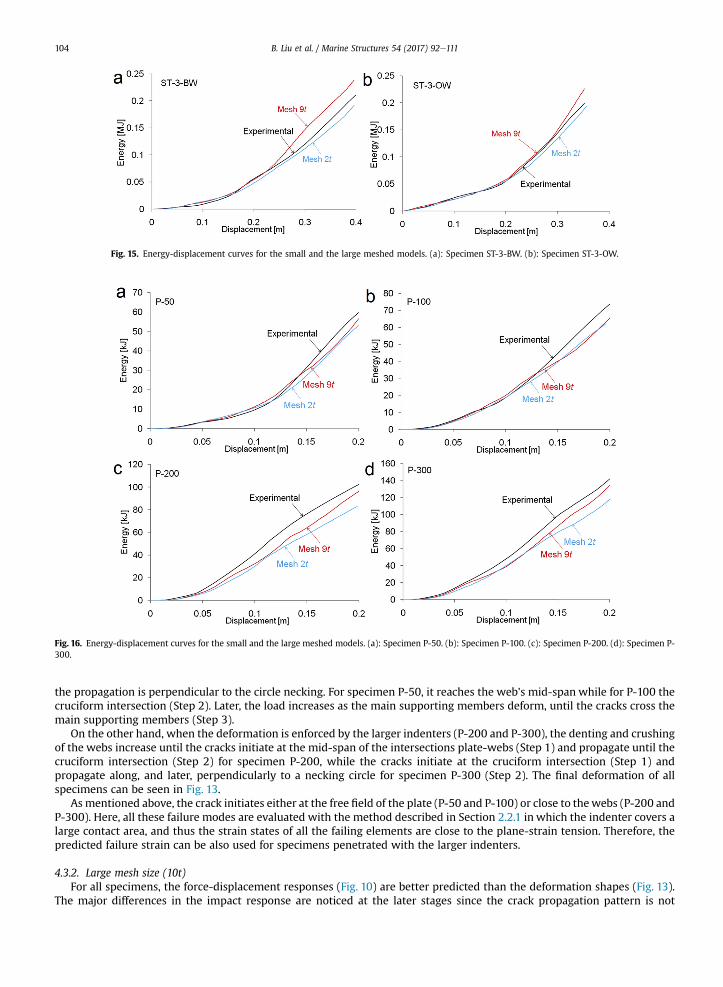
Fig. 15. Energy-displacement curves for the small and the large meshed models. (a): Specimen ST-3-BW. (b): Specimen ST-3-OW.
Fig. 16. Energy-displacement curves for the small and the large meshed models. (a): Specimen P-50. (b): Specimen P-100. (c): Specimen P-200. (d): Specimen P-300.
B. Liu et al. / Marine Structures 54 (2017) 92e111104
the propagation is perpendicular to the circle necking. For specimen P-50, it reaches the web's mid-span while for P-100 thecruciform intersection (Step 2). Later, the load increases as the main supporting members deform, until the cracks cross themain supporting members (Step 3).
On the other hand, when the deformation is enforced by the larger indenters (P-200 and P-300), the denting and crushingof the webs increase until the cracks initiate at the mid-span of the intersections plate-webs (Step 1) and propagate until thecruciform intersection (Step 2) for specimen P-200, while the cracks initiate at the cruciform intersection (Step 1) andpropagate along, and later, perpendicularly to a necking circle for specimen P-300 (Step 2). The final deformation of allspecimens can be seen in Fig. 13.
As mentioned above, the crack initiates either at the free field of the plate (P-50 and P-100) or close to thewebs (P-200 andP-300). Here, all these failure modes are evaluated with the method described in Section 2.2.1 in which the indenter covers alarge contact area, and thus the strain states of all the failing elements are close to the plane-strain tension. Therefore, thepredicted failure strain can be also used for specimens penetrated with the larger indenters.
4.3.2. Large mesh size (10t)For all specimens, the force-displacement responses (Fig. 10) are better predicted than the deformation shapes (Fig. 13).
The major differences in the impact response are noticed at the later stages since the crack propagation pattern is not
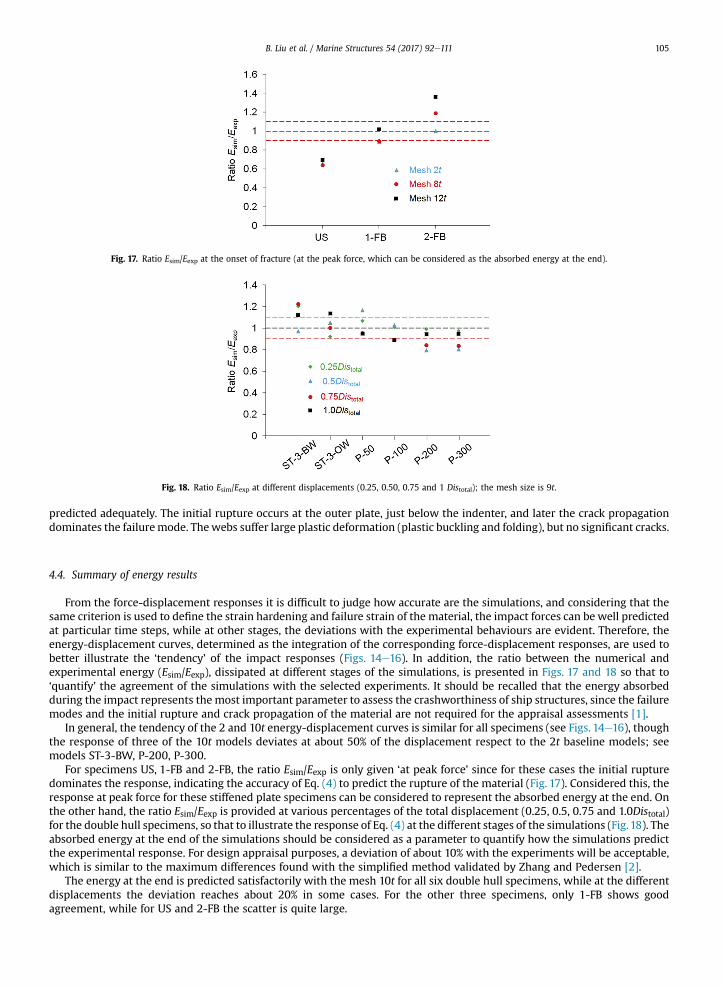
Fig. 17. Ratio Esim/Eexp at the onset of fracture (at the peak force, which can be considered as the absorbed energy at the end).
Fig. 18. Ratio Esim/Eexp at different displacements (0.25, 0.50, 0.75 and 1 Distotal); the mesh size is 9t.
B. Liu et al. / Marine Structures 54 (2017) 92e111 105
predicted adequately. The initial rupture occurs at the outer plate, just below the indenter, and later the crack propagationdominates the failuremode. Thewebs suffer large plastic deformation (plastic buckling and folding), but no significant cracks.
4.4. Summary of energy results
From the force-displacement responses it is difficult to judge how accurate are the simulations, and considering that thesame criterion is used to define the strain hardening and failure strain of the material, the impact forces can be well predictedat particular time steps, while at other stages, the deviations with the experimental behaviours are evident. Therefore, theenergy-displacement curves, determined as the integration of the corresponding force-displacement responses, are used tobetter illustrate the ‘tendency’ of the impact responses (Figs. 14e16). In addition, the ratio between the numerical andexperimental energy (Esim/Eexp), dissipated at different stages of the simulations, is presented in Figs. 17 and 18 so that to‘quantify’ the agreement of the simulations with the selected experiments. It should be recalled that the energy absorbedduring the impact represents the most important parameter to assess the crashworthiness of ship structures, since the failuremodes and the initial rupture and crack propagation of the material are not required for the appraisal assessments [1].
In general, the tendency of the 2 and 10t energy-displacement curves is similar for all specimens (see Figs. 14e16), thoughthe response of three of the 10t models deviates at about 50% of the displacement respect to the 2t baseline models; seemodels ST-3-BW, P-200, P-300.
For specimens US, 1-FB and 2-FB, the ratio Esim/Eexp is only given ‘at peak force’ since for these cases the initial rupturedominates the response, indicating the accuracy of Eq. (4) to predict the rupture of the material (Fig. 17). Considered this, theresponse at peak force for these stiffened plate specimens can be considered to represent the absorbed energy at the end. Onthe other hand, the ratio Esim/Eexp is provided at various percentages of the total displacement (0.25, 0.5, 0.75 and 1.0Distotal)for the double hull specimens, so that to illustrate the response of Eq. (4) at the different stages of the simulations (Fig.18). Theabsorbed energy at the end of the simulations should be considered as a parameter to quantify how the simulations predictthe experimental response. For design appraisal purposes, a deviation of about 10% with the experiments will be acceptable,which is similar to the maximum differences found with the simplified method validated by Zhang and Pedersen [2].
The energy at the end is predicted satisfactorily with the mesh 10t for all six double hull specimens, while at the differentdisplacements the deviation reaches about 20% in some cases. For the other three specimens, only 1-FB shows goodagreement, while for US and 2-FB the scatter is quite large.
B. Liu et al. / Marine Structures 54 (2017) 92e111106
5. Discussion
The material characterisation suggested in Section 2 should help to enhance the industry practice in collision simulationsof ship structures when limited material data is available for estimating the critical energy until a prescribed displacement,which is the interest for collision assessments [1]. As already mentioned in the introduction (Section 1), the ‘simple strain-state-independent’ criteria are able to represent the complex collision process at the end of the impact event better than the‘advanced strain-state-dependent’ [3], and hence they will be preferred for engineering practice to evaluate large-scaledamage, e.g. as required for the assessment of LNG tank compartments [1]. However, the ‘advanced’ criteria should pre-dict better the initiation of rupture [3].
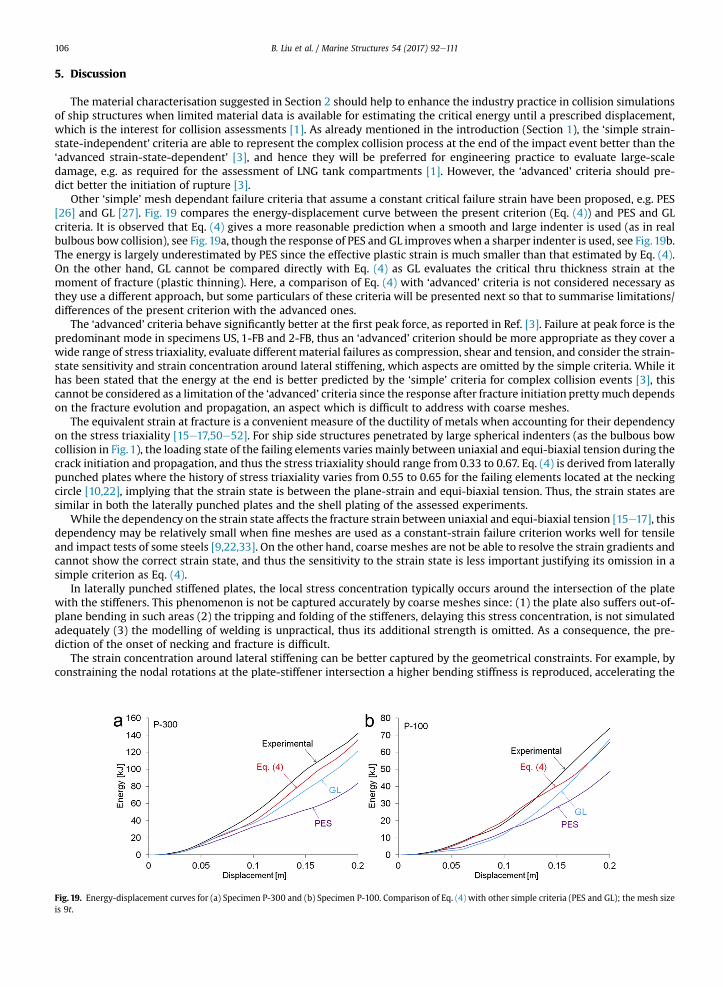
Other ‘simple’ mesh dependant failure criteria that assume a constant critical failure strain have been proposed, e.g. PES[26] and GL [27]. Fig. 19 compares the energy-displacement curve between the present criterion (Eq. (4)) and PES and GLcriteria. It is observed that Eq. (4) gives a more reasonable prediction when a smooth and large indenter is used (as in realbulbous bow collision), see Fig. 19a, though the response of PES and GL improveswhen a sharper indenter is used, see Fig.19b.The energy is largely underestimated by PES since the effective plastic strain is much smaller than that estimated by Eq. (4).On the other hand, GL cannot be compared directly with Eq. (4) as GL evaluates the critical thru thickness strain at themoment of fracture (plastic thinning). Here, a comparison of Eq. (4) with ‘advanced’ criteria is not considered necessary asthey use a different approach, but some particulars of these criteria will be presented next so that to summarise limitations/differences of the present criterion with the advanced ones.
The ‘advanced’ criteria behave significantly better at the first peak force, as reported in Ref. [3]. Failure at peak force is thepredominant mode in specimens US, 1-FB and 2-FB, thus an ‘advanced’ criterion should be more appropriate as they cover awide range of stress triaxiality, evaluate differentmaterial failures as compression, shear and tension, and consider the strain-state sensitivity and strain concentration around lateral stiffening, which aspects are omitted by the simple criteria. While ithas been stated that the energy at the end is better predicted by the ‘simple’ criteria for complex collision events [3], thiscannot be considered as a limitation of the ‘advanced’ criteria since the response after fracture initiation prettymuch dependson the fracture evolution and propagation, an aspect which is difficult to address with coarse meshes.
The equivalent strain at fracture is a convenient measure of the ductility of metals when accounting for their dependencyon the stress triaxiality [15e17,50e52]. For ship side structures penetrated by large spherical indenters (as the bulbous bowcollision in Fig. 1), the loading state of the failing elements varies mainly between uniaxial and equi-biaxial tension during thecrack initiation and propagation, and thus the stress triaxiality should range from 0.33 to 0.67. Eq. (4) is derived from laterallypunched plates where the history of stress triaxiality varies from 0.55 to 0.65 for the failing elements located at the neckingcircle [10,22], implying that the strain state is between the plane-strain and equi-biaxial tension. Thus, the strain states aresimilar in both the laterally punched plates and the shell plating of the assessed experiments.
While the dependency on the strain state affects the fracture strain between uniaxial and equi-biaxial tension [15e17], thisdependency may be relatively small when fine meshes are used as a constant-strain failure criterion works well for tensileand impact tests of some steels [9,22,33]. On the other hand, coarse meshes are not be able to resolve the strain gradients andcannot show the correct strain state, and thus the sensitivity to the strain state is less important justifying its omission in asimple criterion as Eq. (4).
In laterally punched stiffened plates, the local stress concentration typically occurs around the intersection of the platewith the stiffeners. This phenomenon is not be captured accurately by coarse meshes since: (1) the plate also suffers out-of-plane bending in such areas (2) the tripping and folding of the stiffeners, delaying this stress concentration, is not simulatedadequately (3) the modelling of welding is unpractical, thus its additional strength is omitted. As a consequence, the pre-diction of the onset of necking and fracture is difficult.
The strain concentration around lateral stiffening can be better captured by the geometrical constraints. For example, byconstraining the nodal rotations at the plate-stiffener intersection a higher bending stiffness is reproduced, accelerating the
Fig. 19. Energy-displacement curves for (a) Specimen P-300 and (b) Specimen P-100. Comparison of Eq. (4) with other simple criteria (PES and GL); the mesh sizeis 9t.
B. Liu et al. / Marine Structures 54 (2017) 92e111 107
stress concentration and improving the numerical prediction. However, this numerical technique as well as the other pa-rameters accounted for the advanced criteria has not been considered while deriving Eq. (4).
Generally, the selection and definition of a failure criterion should consider specific collision scenarios and the materialproperties of particular steels. Although various criteria have been validated against experimental results, it has not beenfound a universal failure criterion that provides consistent predictions/tendency with the available benchmark experiments;all criteria have shown limitations (see for example Figs. 8e16 in Ref. [3]). This also implies that the uncertainty in fracturepredictions is significant when evaluating the results of various collision simulations. Here, the agreement obtained with the6 double-hull specimens indicates that Eq. (4) can be used with a certain degree of confidence to assess a collision scenariosimilar to that illustrated in Fig.1, inwhich evaluation of large-scale damage, as that indicated in Ref. [1], is required. However,a different scenario and/or analysis requirement can be satisfied by other failure criterion or by a more detailed modelling(finer mesh) of the structures subjected to impact.
The force-displacement responses shown in Appendix C indicate that the instantaneous forces decrease after the initialrupture of the outer shell plating; this is more evident for the specimens in Fig. C1. The ratio Esim/Eexp in Fig. C3 also indicatesthat the omission of failure largely overestimates the absorption of energy at the end, about 86% for specimens in Fig. C1 and34% for those in Fig. C2. While for 3 of the specimens in Fig. C2 the ratio Esim/Eexp is quite favourable at intermediate dis-placements, the tendencies of the force displacement responses and the ratio of the energies at the end indicate that Eq. (4)improves the required outcome of the analysis.
6. Conclusions
A new expression (Eq. (4)) is introduced to estimate the critical failure strain of coarse meshed ship structures struck by anindenter with hemispherical shape so as to assess a ship collision scenario similar to that illustrated in Fig. 1. This ‘simplecriterion’ is validated against reported experiments of 3 stiffened plates and 6 double-hull structures. For the double hullspecimens the energy released at the end of the impact event is predicted satisfactorily when defining a coarse mesh of size10t (the difference is about 10%).
The expression can be used to enhance the industry practice in collision simulations of ship structures when limited timeand material data are available to estimate the critical absorbed energy until a prescribed displacement, as required forappraisal assessments [1].
The deformation shapes of the coarse models as well as the onset of the necking, crack initiation and propagation, and thestress concentration below the indenter are not predicted as those given by the fine meshes. While Eq. (4) is valid for coarsemeshes, a fine mesh will be required to describe better the structural plastic deformation of the stiffened plates, in particularthe deformation of the lateral stiffening so that to resolve the effect of the bending stiffness and strain concentrations aroundthe stiffeners.
Acknowledgement
The work of the first and last authors was performed within the Strategic Research Plan of the Centre for Marine Tech-nology and Ocean Engineering (CENTEC), which is financed by Portuguese Foundation for Science and Technology (Fundaç~aopara a Ciencia e Tecnologia-FCT). The views expressed in this paper are those of the authors, and are not necessarily those ofLloyd's Register.
Appendix A. Theoretical critical deflection at failure for circular and square plates punched by a hemisphericalindenter
In order to evaluate the accuracy of the theoretical critical deflection (Eq. (3)) used in the current investigation, a com-parisonwith other two approaches is conducted. Lee et al. [16] derived an analytical expression to predict the deflection untilfailure of thin clamped circular or square plates laterally punched by a spherical indenter:
df ¼ffiffiffiffiffiffiffiffi2Dc
pR0:620 R0:38b (A1)
where Dc is the material critical damage value for ductile fracture, defined as the product of the true failure strain and theaverage stress triaxiality, which can be taken as 0.27 for punch indentation tests. Rb is the radius of the spherical indenter andR0 is the radius or half width of the plate.
Liu et al. [34] proposed a similar expression to estimate the critical deflection at failure:
df ¼ 1:15n0:18R0:50 R0:5b (A2)
where n is the material strain hardening exponent.Table A1 shows the theoretical deflections predicted by Eq. (3), (A1) and (A2), and compares themwith the experimental
results reported in Refs. [16,22,28,33]. It is observed that Eq. (3) predicts better the experimental critical deflection.
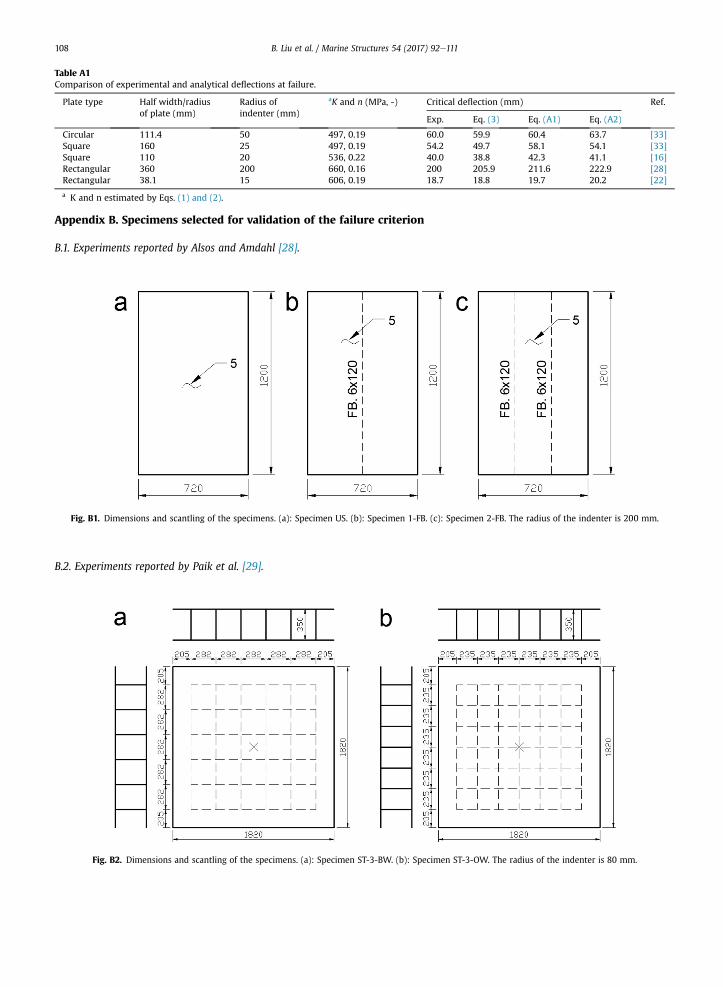
Table A1Comparison of experimental and analytical deflections at failure.
Plate type Half width/radiusof plate (mm)
Radius ofindenter (mm)
aK and n (MPa, -) Critical deflection (mm) Ref.
Exp. Eq. (3) Eq. (A1) Eq. (A2)
Circular 111.4 50 497, 0.19 60.0 59.9 60.4 63.7 [33]Square 160 25 497, 0.19 54.2 49.7 58.1 54.1 [33]Square 110 20 536, 0.22 40.0 38.8 42.3 41.1 [16]Rectangular 360 200 660, 0.16 200 205.9 211.6 222.9 [28]Rectangular 38.1 15 606, 0.19 18.7 18.8 19.7 20.2 [22]
a K and n estimated by Eqs. (1) and (2).
B. Liu et al. / Marine Structures 54 (2017) 92e111108
Appendix B. Specimens selected for validation of the failure criterion
B.1. Experiments reported by Alsos and Amdahl [28].
Fig. B1. Dimensions and scantling of the specimens. (a): Specimen US. (b): Specimen 1-FB. (c): Specimen 2-FB. The radius of the indenter is 200 mm.
B.2. Experiments reported by Paik et al. [29].
Fig. B2. Dimensions and scantling of the specimens. (a): Specimen ST-3-BW. (b): Specimen ST-3-OW. The radius of the indenter is 80 mm.
B. Liu et al. / Marine Structures 54 (2017) 92e111 109
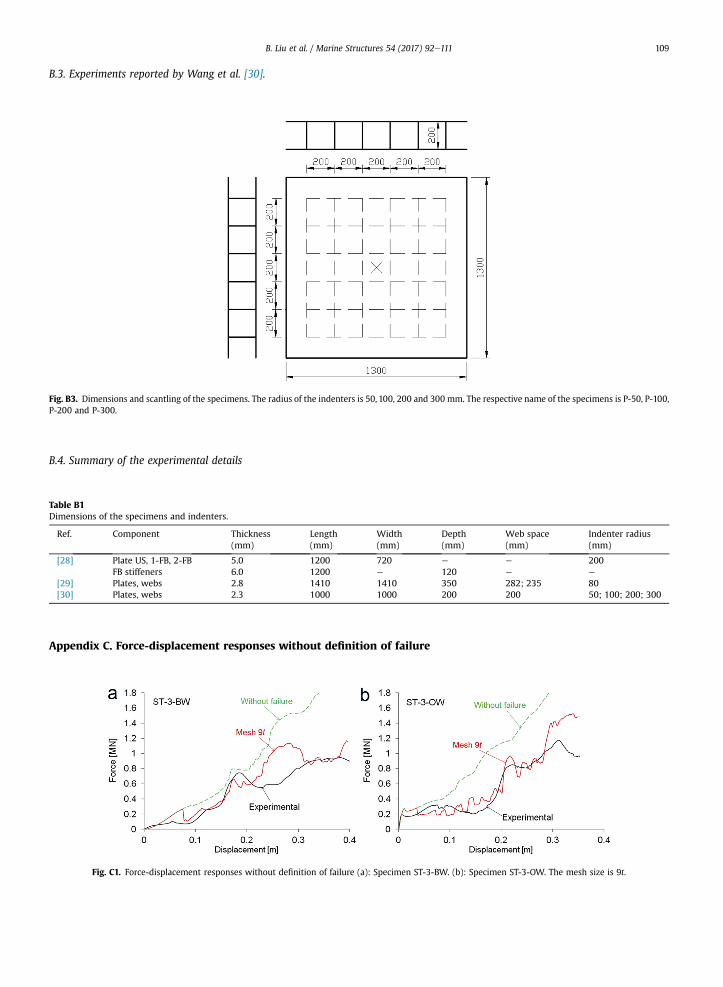
B.3. Experiments reported by Wang et al. [30].
Fig. B3. Dimensions and scantling of the specimens. The radius of the indenters is 50, 100, 200 and 300 mm. The respective name of the specimens is P-50, P-100,P-200 and P-300.
B.4. Summary of the experimental details
Table B1Dimensions of the specimens and indenters.
Ref. Component Thickness(mm)
Length(mm)
Width(mm)
Depth(mm)
Web space(mm)
Indenter radius(mm)
[28] Plate US, 1-FB, 2-FB 5.0 1200 720 e e 200FB stiffeners 6.0 1200 e 120 e e
[29] Plates, webs 2.8 1410 1410 350 282; 235 80[30] Plates, webs 2.3 1000 1000 200 200 50; 100; 200; 300
Appendix C. Force-displacement responses without definition of failure
Fig. C1. Force-displacement responses without definition of failure (a): Specimen ST-3-BW. (b): Specimen ST-3-OW. The mesh size is 9t.
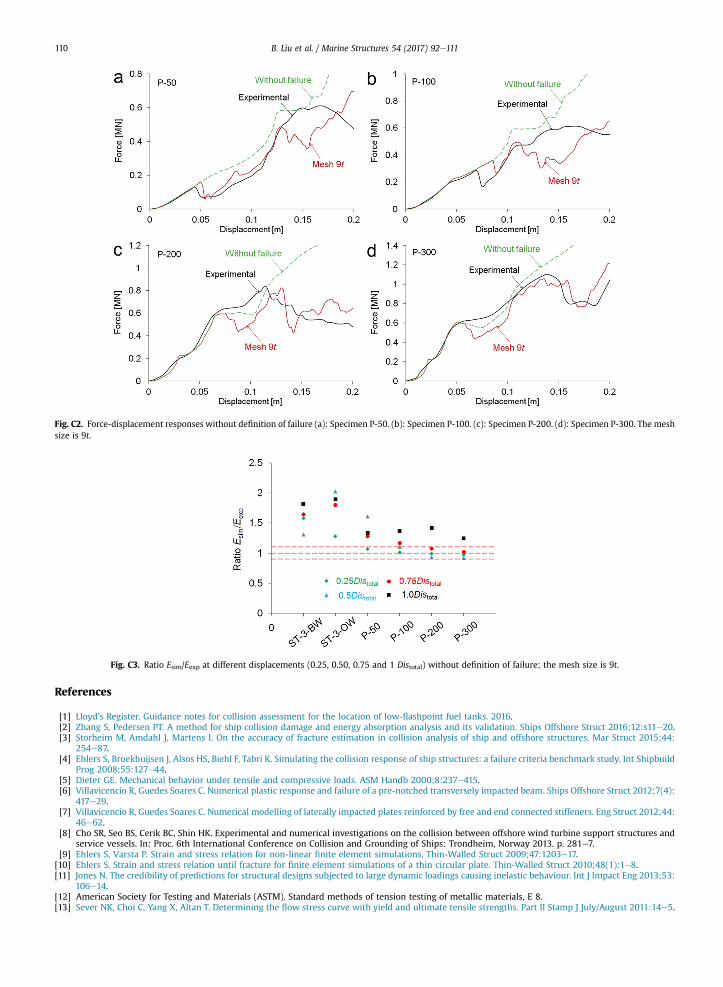
Fig. C2. Force-displacement responses without definition of failure (a): Specimen P-50. (b): Specimen P-100. (c): Specimen P-200. (d): Specimen P-300. The meshsize is 9t.
Fig. C3. Ratio Esim/Eexp at different displacements (0.25, 0.50, 0.75 and 1 Distotal) without definition of failure; the mesh size is 9t.
B. Liu et al. / Marine Structures 54 (2017) 92e111110
References
[1] Lloyd’s Register. Guidance notes for collision assessment for the location of low-flashpoint fuel tanks. 2016.[2] Zhang S, Pedersen PT. A method for ship collision damage and energy absorption analysis and its validation. Ships Offshore Struct 2016;12:s11e20.[3] Storheim M, Amdahl J, Martens I. On the accuracy of fracture estimation in collision analysis of ship and offshore structures. Mar Struct 2015;44:
254e87.[4] Ehlers S, Broekhuijsen J, Alsos HS, Biehl F, Tabri K. Simulating the collision response of ship structures: a failure criteria benchmark study. Int Shipbuild
Prog 2008;55:127e44.[5] Dieter GE. Mechanical behavior under tensile and compressive loads. ASM Handb 2000;8:237e415.[6] Villavicencio R, Guedes Soares C. Numerical plastic response and failure of a pre-notched transversely impacted beam. Ships Offshore Struct 2012;7(4):
417e29.[7] Villavicencio R, Guedes Soares C. Numerical modelling of laterally impacted plates reinforced by free and end connected stiffeners. Eng Struct 2012;44:
46e62.[8] Cho SR, Seo BS, Cerik BC, Shin HK. Experimental and numerical investigations on the collision between offshore wind turbine support structures and
service vessels. In: Proc. 6th International Conference on Collision and Grounding of Ships: Trondheim, Norway 2013. p. 281e7.[9] Ehlers S, Varsta P. Strain and stress relation for non-linear finite element simulations. Thin-Walled Struct 2009;47:1203e17.
[10] Ehlers S. Strain and stress relation until fracture for finite element simulations of a thin circular plate. Thin-Walled Struct 2010;48(1):1e8.[11] Jones N. The credibility of predictions for structural designs subjected to large dynamic loadings causing inelastic behaviour. Int J Impact Eng 2013;53:
106e14.[12] American Society for Testing and Materials (ASTM). Standard methods of tension testing of metallic materials, E 8.[13] Sever NK, Choi C, Yang X, Altan T. Determining the flow stress curve with yield and ultimate tensile strengths. Part II Stamp J July/August 2011:14e5.
B. Liu et al. / Marine Structures 54 (2017) 92e111 111
[14] Naar H, Kujala P, Simonsen BC, Ludolphy H. Comparison of the crashworthiness of various bottom and side structures. Mar Struct 2002;15:443e60.[15] Bao Y, Wierzbicki T. On fracture locus in the equivalent strain and stress triaxiality Space. Int J Mech Sci 2004;46:81e98.[16] Lee YW, Woertz JC, Wierzbicki T. Fracture prediction of thin plates under hemi-spherical punch with calibration and experimental verification. Int J
Mech Sci 2004;46:751e81.[17] Wierzbicki T, Bao Y, Lee YW, Bai Y. Calibration and evaluation of seven fracture models. Int J Mech Sci 2005;47:719e43.[18] AbuBakar A, Dow RS. Simulation of ship grounding damage using the finite element method. Int J Solids Struct 2013;50:623e36.[19] Marinatos JN, Samuelides MS. Towards a unified methodology for the simulation of rupture in collision and grounding of ships. Mar Struct 2015;42:
1e32.[20] Ehlers S. The influence of the material relation on the accuracy of collision simulations. Mar Struct 2010;23:462e74.[21] Shen WQ, Rieve NO, Baharun B. A study on the failure of circular plates struck by masses. Part 1: experimental results. Int J Impact Eng 2002;27:
399e412.[22] Liu B, Villavicencio R, Guedes Soares C. Experimental and numerical plastic response and failure of laterally impacted rectangular plates. J Offshore
Mech Arct Eng 2013;135(4):041602.[23] Hosford WF, Caddle RM. Metal forming - mechanics and metallurgy. fourth ed. New York, USA: Cambridge University Press; 2014.[24] Haris S, Amdahl J. An analytical model to assess a ship side during a collision. Ships Offshore Struct 2012;7(4):431e48.[25] Wang G, Spencer J, Chen Y. Assessment of a ship's performance in accidents. Mar Struct 2002;15:313e33.[26] Peschmann J. Energy absorption computations of ship steel structures under collision and grounding (translated from German language) [PhD thesis].
Technical University of Hamburg; 2001.[27] Zhang L, Egge ED, Bruhns H. Approval procedure concept for alternative arrangements. In: Proc. 3rd International Conference on Collision and
Grounding of Ships: Izu, Japan 2004. p. 87e96.[28] Alsos HS, Amdahl J. On the resistance of stiffened plates, Part I: Experiments. Int J Impact Eng 2009;36:799e807.[29] Paik JK, Chung JY, Choe IH, Thayamballi AK, Pedersen PT, Wang G. On rational design of double hull tanker structures against collision. Trans Soc Nav
Archit Mar Eng 1999;107:323e63.[30] Wang G, Arita K, Liu D. Behavior of a double hull in a variety of stranding or collision scenarios. Mar Struct 2000;13:147e87.[31] Lloyd’s Register. Rules for the Manufacture, Testing and Certification of Materials. 2016.[32] Storheim M, Amdahl J. On the sensitivity to work hardening and strain rate effects in nonlinear FEM analysis of ship collisions. Ships Offshore Struct
2017;12(1):100e15.[33] Simonsen BC, Lauridsen LP. Energy absorption and ductile failure in metal sheets under lateral indentation by a sphere. Int J Impact Eng 2000;24:
1017e39.[34] Liu B, Villavicencio R, Guedes Soares C. On the failure criterion of aluminium and steel plates subjected to low-velocity impact by a spherical indenter.
Int J Mech Sci 2014;80:1e15.[35] Wang G, Ohtsubo H, Arita K. Large deflection of a rigid-plastic circular plate pressed by a rigid sphere. J Appl Mech 1998;65:533e5.[36] Jones N. Structural impact. second ed. New York, USA: Cambridge University Press; 2012.[37] Walters CL. Framework for adjusting for both stress triaxiality and mesh size effect for failure of metals in shell structures. Int J Crashworthiness 2014;
19(1):1e12.[38] K€orgesaar M, Romanoff J. Influence of mesh size, stress triaxiality and damage induced softening on ductile fracture of large-scale shell structures. Mar
Struct 2014;38:1e17.[39] Alsos HS, Hopperstad OS, T€ornqvist R, Amdahl J. Analytical and numerical analysis of sheet metal instability using a stress based criterion. Int J Solids
Struct 2008;45:2042e55.[40] Jones N. Some recent developments in the dynamic inelastic behaviour of structures. Ships Offshore Struct 2006;1(1):37e44.[41] Hallquist JO. LS-DYNA theory manual. California, USA: Livermore Software Technology Corporation; 2006.[42] Alsos HS, Amdahl J, Hopperstad O. On the resistance of stiffened plates, Part II: numerical analysis. Int J Impact Eng 2009;36:875e87.[43] Villavicencio R, Liu B, Guedes Soares C. Experimental and numerical analysis of a tanker side panel laterally punched by a knife edge indenter. Mar
Struct 2014;37:173e202.[44] Werner B, Heyer H, Sander M. Numerical investigations of collision experiments considering weld joints. Eng Fail Anal 2015;58:351e68.[45] Liu B, Guedes Soares C. Experimental and numerical analysis of the crushing behaviour of stiffened web girders. Int J Impact Eng 2016;88:20e38.[46] Liu B, Villavicencio R, Guedes Soares C. Shear and tensile failure of thin aluminium plates struck by cylindrical and spherical indenters. Ships Offshore
Struct 2015;10(1):45e58.[47] Liu B, Villavicencio R, Guedes Soares C. Influence of striker nose shape on the fracture initiation and propagation of thin aluminium plates. J Offshore
Mech Arct Eng 2015;137(5):051402.[48] Liu B, Guedes Soares C. Assessment of the strength of double-hull tanker side structures in minor ship collisions. Eng Struct 2016;120:1e12.[49] Liu B, Guedes Soares C. Simplified analytical method for evaluating web girder crushing during ship collision and grounding. Mar Struct 2015;42:
71e94.[50] Gruben G, Fagerholt E, Hopperstad OS, Børvik T. Fracture characteristics of a cold-rolled dual-phase steel. Eur J Mech A/Solids 2011;30:204e18.[51] Gruben G, Hopperstad OS, Børvik T. Evaluation of uncoupled ductile fracture criteria for the dual-phase steel Docol 600DL. Int J Mech Sci 2012;62:
133e46.[52] Gruben G, Hopperstad OS, Børvik T. Simulation of ductile crack propagation in dual-phase steel. Int J Fract 2013;180:1e22.