A sensitivity study of the effects of evaporation ... · evaporation and condensation modeling...
17
A sensitivity study of the effects of evaporation/condensation accommodation coefficients on transient heat pipe modeling MICHAEL L. HALL Los Alamos National Laboratory, Group N-6, MS KS59, P.O. Box 1663, Los Alamos. NM 87545, U.S.A. and J. MICNAEL DOSTER Nuclear Engineering Department, North Carolina State University, Box 7909. Raleigh. NC 27695, U.S.A. (Received 12 December 1988 and in$naiform 6 June 1989) Abstract-The dynamic behavior of liquid metal heat pipe models is strongly inthtenced by the choice of evaporation and condensation modeling techniques. Classic kinetic theory descriptions of the evaporation and condensation processes are often inadequate for real situations; empirical accommodation coefficients are commonly utilized to reflect nonideal mass transfer rates. The complex geometries and flow fields found in proposed heat pipe systems cause considerable deviation from the classical models. The THROHPUT code, which has been described in previous works, was developed to model transient liquid metal heat pipe behavior from frozen startup conditions to steady state full power operation. It is used here to evaluate the sensitivity of transient liquid metal heat pipe models to the choice of evaporation and condensation accommodation coefficients. Comparisons are made with experimental liquid metal heat pipe data. It is found that heat pipe behavior can be predicted with the proper choice of the accommodation coefficients. However, the common assumption of spatially constant accommodation coefficients is found to be a limiting factor in the model. 1. INTRODUCTION A HEAT pipe is a closed heat transfer system, generally in the form of a simple cylind~c~ pipe sealed at both ends and partially filled with a working fluid. Heat from an external source is added at one end of the heat pipe, causing the working fluid to evaporate. The vapor expands into the heat pipe core and travels down a central adiabatic region (adiabatic only with respect to the surroundings) to the far end of the heat pipe where it condenses on the inner walls. The latent heat released in the condensation process is trans- ferred through the walls of the heat pipe to the exterior surfaces and subsequently to the environment. The condensate is then ‘pumped’ back to the evaporator section through the capillary action of an embedded wick structure. A side view of this process is shown in Fig. 1. The net result of this cycle is the transfer of a large amount of heat, equal to the latent heat of the working fluid, all without the use of pumps, working parts of even gravitational forces. These charac- teristics make heat pipes particularly attractive to designers of space satellites. Heat pipes can be constructed to operate with a variety of working fluids, the choice depending primarily on a match between the evaporation temperature and the desired operating temperature. Many of the recent designs of space satellites have employed heat pipes to form isothermal fins on a radiator panel assembly or to transfer heat from the reactor [l-6]. Both of these require high operating temperatures, such that a liquid metal, usuaily liquid lithium, is the working fluid of choice. However, the choice of lithium as a working fluid is not without problems. At ambient temperatures, lithium exists as a solid. Since the satellite will be launched in a cold state, the heat pipe should be able to begin operation with its lithium frozen. The ability of the heat pipe to self-prime is crucial to its usefulness. If operation is stopped during flight, the lithium will again solidify. A restart from this situation differs from the original startup in the distribution of the solid lithium. In this case, the solid will probably be concentrated in the condenser section, making startup even more difficult. Of additional concern is the reaction of the heat pipe FIG. 1. Variation of the radius of curvature along the heat pipe. 465
Transcript of A sensitivity study of the effects of evaporation ... · evaporation and condensation modeling...
A sensitivity study of the effects of evaporation/condensation accommodation coefficients on transient heat pipe modeling
MICHAEL L. HALL
Los Alamos National Laboratory, Group N-6, MS KS59, P.O. Box 1663, Los Alamos. NM 87545, U.S.A.
and
J. MICNAEL DOSTER
Nuclear Engineering Department, North Carolina State University, Box 7909. Raleigh. NC 27695, U.S.A.
(Received 12 December 1988 and in$naiform 6 June 1989)
Abstract-The dynamic behavior of liquid metal heat pipe models is strongly inthtenced by the choice of evaporation and condensation modeling techniques. Classic kinetic theory descriptions of the evaporation and condensation processes are often inadequate for real situations; empirical accommodation coefficients are commonly utilized to reflect nonideal mass transfer rates. The complex geometries and flow fields found in proposed heat pipe systems cause considerable deviation from the classical models. The THROHPUT code, which has been described in previous works, was developed to model transient liquid metal heat pipe behavior from frozen startup conditions to steady state full power operation. It is used here to evaluate the sensitivity of transient liquid metal heat pipe models to the choice of evaporation and condensation accommodation coefficients. Comparisons are made with experimental liquid metal heat pipe data. It is found that heat pipe behavior can be predicted with the proper choice of the accommodation coefficients. However, the common assumption of spatially constant accommodation coefficients is found
to be a limiting factor in the model.
1. INTRODUCTION
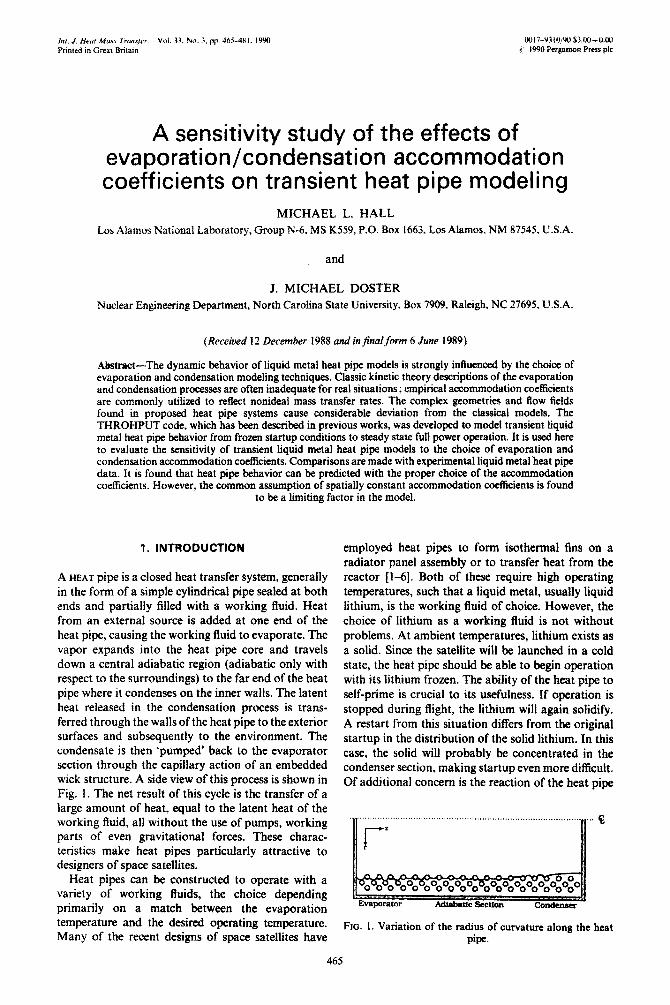
A HEAT pipe is a closed heat transfer system, generally in the form of a simple cylind~c~ pipe sealed at both ends and partially filled with a working fluid. Heat from an external source is added at one end of the heat pipe, causing the working fluid to evaporate. The vapor expands into the heat pipe core and travels down a central adiabatic region (adiabatic only with respect to the surroundings) to the far end of the heat pipe where it condenses on the inner walls. The latent heat released in the condensation process is trans- ferred through the walls of the heat pipe to the exterior surfaces and subsequently to the environment. The condensate is then ‘pumped’ back to the evaporator section through the capillary action of an embedded wick structure. A side view of this process is shown in Fig. 1. The net result of this cycle is the transfer of a large amount of heat, equal to the latent heat of the working fluid, all without the use of pumps, working parts of even gravitational forces. These charac- teristics make heat pipes particularly attractive to designers of space satellites.
Heat pipes can be constructed to operate with a variety of working fluids, the choice depending primarily on a match between the evaporation temperature and the desired operating temperature. Many of the recent designs of space satellites have
employed heat pipes to form isothermal fins on a radiator panel assembly or to transfer heat from the reactor [l-6]. Both of these require high operating temperatures, such that a liquid metal, usuaily liquid lithium, is the working fluid of choice. However, the choice of lithium as a working fluid is not without problems. At ambient temperatures, lithium exists as a solid. Since the satellite will be launched in a cold state, the heat pipe should be able to begin operation with its lithium frozen. The ability of the heat pipe to self-prime is crucial to its usefulness. If operation is stopped during flight, the lithium will again solidify. A restart from this situation differs from the original startup in the distribution of the solid lithium. In this case, the solid will probably be concentrated in the condenser section, making startup even more difficult. Of additional concern is the reaction of the heat pipe
FIG. 1. Variation of the radius of curvature along the heat pipe.
465

466 M. L. HALL and J. M. DOSTER
A
h
2 D'
area [m’]
Dh 9
.4,
I1 Ah,,
H
.i k
L
m
tiz
P
APa,
QW Qm
velocity ratio [dimensionless] specific heat [J kg- ’ K- ‘1 diffusion coefficient [m’ s- ‘1 diffusion parameter defined in equation (21) [kg mol kg- ‘1 hydraulic diameter [m] friction coefficient [kg mm 3 s- ‘1 r-component of the gravity vector [m SC’]
enthalpy [J kg- ‘1 melting enthalpy difference, k, - h,
[J k- ‘I heat transfer coefficient [W m-’ K- ‘1 diffusive flux [kg rn- 2 s ‘1 thermal conductivity [W mm ’ K- ‘1 axial length [m] molecular weight [kg kg- ’ mol- ‘1
evaporation/condensation mass flux [kgm-‘s-‘1 pressure [Pa]
capillary pressure difference, Pm-P,
Pal heat transfer rate from x to 4’ [W m- ‘1
external to wall heat transfer rate [W me31
total heat throughput [W] radius [m]
radius of curvature of the interphasic meniscus [m]
inner radius of the heat pipe, liquid outer radius [m] outer radius of the heat pipe, wall outer radius [m] pore radius or minimum radius of curvature [m]
gas constant [J kg- ’ K - ‘1 time [s]
Greek symbols
;
volume fraction [dimensionless] evaporation rate constant defined in equation (24)
r,, mass transfer rate from s to j’ [kgm- ‘s-‘1
E, flow volume fraction in the wick [dimensionless]
8. surface fraction of the wick available for phasic interface [dimensionless]
QT I 1’,
I’,
I’”
I’P
R
I T
c v
I’ x
:
temperature [K] Internal energy [J kg- ‘1 voluinc [&I
velocity [m s- ‘1 mass fraction fdimensionIess] axial distance [ml.
NOMENCLATURE
11 cosine of surface contact angle [dimensionless]
iE ratio of the circumference to the diameter [dimensionless]
P density [kg rn- ‘1 0 liquid surface tension [N m ‘1 6, condensation accommodation coefficient
[dimensionless]
g, evaporation accommodation coefficient [dimensionless].
Superscripts K related to Knudsen diffusion M based on molecular fluxes or molecular
average velocities n time step x related to a mass fraction
l- related to interphase transfer 1’ normal (to the surface) value
P related to a density.
Subscripts
:El a;b
b C
e
eff
g
i
I m
n 0
P s sat sur V
W
.y, _I’
adiabatic section value
species in a binary mixture
ambient value bulk fluid value
condenser (or condensing) value evaporator (or evaporating) value effective value
lithium gas value wall inner radius value
liquid value mixture value (lithium gas and noncondensible) noncondensible value wall outer radius value pore value solid value saturation value liquid-vapor surface value wick inner radius value wall value arbitrary species.
Operators U(f) linearization functional 6A time step or iterate difference, A”+ I -A”
AA incremental change in variable A
R(b) function defined by equation (26)
(A) average value of A
A vector quantity VA grad A
V-A divA 8/51(A) partial derivative with respect to t i?/&(A) partial derivative with respect to 2.
A sensitivity study of the effects of evaporation/condensation accommodation coefficients 467
to short-lived concentrated heat inputs, which could be caused by military attacks. The design concerns associated with space reactor heat pipes have provided the major impetus for increased accuracy and detail in transient heat pipe analysis.
The pioneering work in steady state heat pipe analy- sis was carried out by Cotter [7]. His work assumed steady state incompressible flow in both the liquid and the vapor regions with constant boundary conditions in the evaporator. adiabatic and condenser sections. His model predicted heat pipe fluid velocity and pres- sure profiles, as well as delineating some of the theor- etical limits to heat pipe operation. In his vapor flow model, Cotter made use of the work of Yuan and Finkelstein [8] which describes pipe flow with injection or suction through a porous wall and expresses the axial pressure distribution in a polynomial of the rad- ial Reynolds number. Slight modifications to Cotter’s theory have been made since its publication, e.g. a cor- rection concerning the proper location to equate the liquid and vapor pressures proposed by Ernst [9]. A more detailed steady state analysis was carried out by Busse [lo] who made many of the same assumptions that Cotter did, but allowed for a radial variation of the axial velocity with a fourth-order polynomial. In later work, Busse and Prenger [l l] describe the computer code AGATHE which expanded the velocity in an n-degree polynomial. Cotter’s theory and some of the later modi- fications were implemented by Prenger in the computer code HTPIPE [ 121. A similar steady state code named A-37 was written by Ernst [13]. Steady state heat pipe theory has been outlined in several texts [ 14-161.
With a desire to model transient effects, Cullimore [ 171 developed the computer code ASAHP which uses a thermal and flow resistance technique. The appli- cability of ASAHP to transient situations is limited because it assumes quasi-steady state hydrodynamics. Colwell and co-workers [18, 191 developed a two- dimensional (r, z) finite difference model of the tran- sient thermal behavior of low temperature heat pipes. His model does not include the hydraulic properties of heat pipe operation, but does have a thermal model for rewetting (which occurs after a section of the heat pipe has been boiled dry). Peery and Best [20] modeled a water heat pipe with mass, momentum and energy transfer using the Navier-Stokes equations. Their model included the vapor and wick regions, but assumed that vapor and liquid pressures are equal at the end of the condenser. Numerical problems were experienced because of their method of solution which decoupled the equations. Costello et al. [2 I] developed a program which models the transient behavior of high temperature heat pipes. Their program uses the Kachina method to determine the flow field charac- teristics and has some treatment of the solid startup phenomenon. Costello’s code includes a rough treat- ment of noncondensible gas and the condenser pool- ing effect. The numerical method used to solve the flow equations is an explicit method which is iterated upon until convergence to an ‘implicit’ value.
The reactor transient code RELAPS [22] has been adapted to heat pipe systems [23-251. This adaptation, entitled ATHENA, uses a semi-implicit temporal dis- cretization to solve the area averaged Navier-Stokes equations. ATHENA uses a volume-based capillary pressure relation to specify the liquid-vapor pressure difference, but it is evaluated explicitly. This has led to severe time step restrictions (much less than the Courant limit). The ATHENA model uses an area averaged pressure in both its continuity and energy equations, such that the liquid and vapor have differ- ent pressures only in the momentum equations.
The preliminary research for this paper [26-281 developed a detailed model of the vapor core of the heat pipe along with a more rudimentary wall, wick model. This model also used a semi-implicit discretization of the area averaged Navier-Stokes equations. including a noncondensible gas and the phenomenon of concentration driven mass diffusion. Conduction in the core gas was not modeled, and the wall/wick model was a lumped parameters thermal model. Severe time step restrictions were caused by a Fourier modulus limitation associated with the explicit discretization of the diffusion terms.
With the exception of the ATHENA code and the preliminary research for this paper, there has not been an accurate, detailed transient thermal hydraulic model of high temperature heat pipe response. The work that has been carried out by other researchers to date is either incomplete (Cullimore, and Colwell and co-workers include only transient thermal aspects) or numerically nonoptimal (Peery and Best, and Costello et al. both utilize deleterious numerical methods). The ATHENA code, the development of which is contemporary to this work, uses an accurate numerical scheme to determine the entire thermo- hydraulic behavior of the heat pipe. However, it does include diffusion and has no provision for solid lithium. It is subject to the small time steps necessary to ensure stability and accuracy because of the explicit capillary pressure relation discretization. The pre- liminary research for this paper included an accurate core model. but lacked axial conduction in the core, a hydraulic wick model, and a solid treatment. It was limited in time step size by the explicit diffusion discretization.
The previously mentioned transients of frozen startup, restart, and reaction to threats necessitate accurate, detailed modeling of the thermohydraulic behavior of both the wick and the core. Toward this end, the authors have developed the computer code THROHPUT (Thermal Hydraulic Response Of Heat Pipes Under Transients), which seeks to overcome the limitations of prior codes and to model the important phenomena of transient heat pipe behavior. (Previous descriptions of the THROHPUT code can be found in refs. [29, 301.) THROHPUT models the heat pipe using a fully implicit numerical technique that increases computational time per time step but removes most of the time step restrictions associated
468 M. L. HALL and J. M. DOSTER
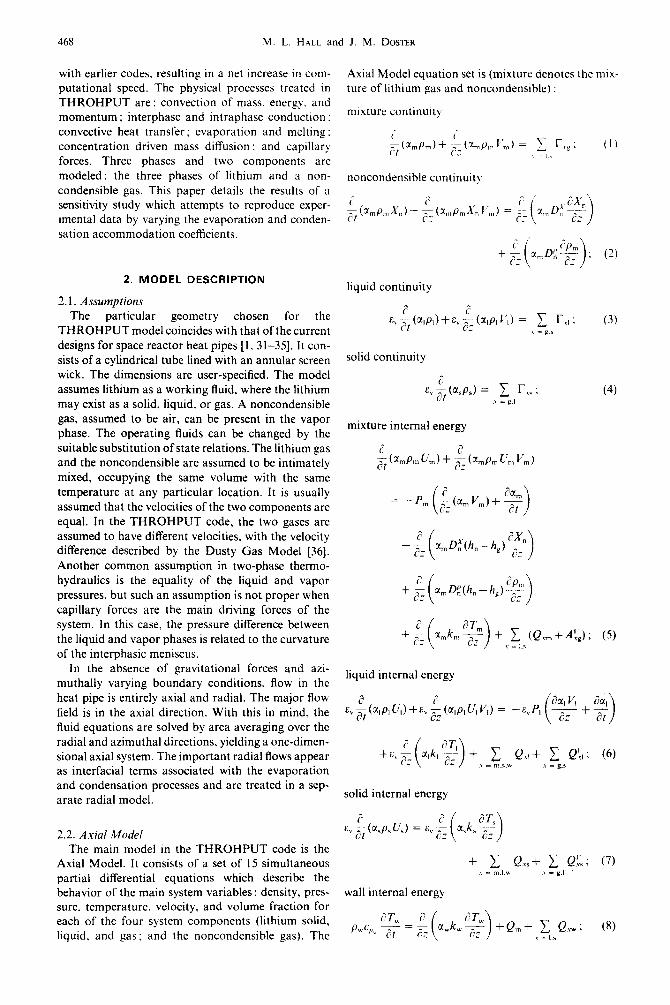
with earlier codes, resulting in a net increase in com- putational speed. The physical processes treated in THROHPUT are: convection of mass. energy. and momentum : interphase and intraphase conduction : convective heat transfer; evaporation and melting : concentration driven mass diffusion : and capillary forces. Three phases and two components are modeled: the three phases of lithium and a non-
condensible gas. This paper details the results of a sensitivity study which attempts to reproduce exper- imental data by varying the evaporation and conden- sation accommodation coefficients.
2. MODEL DESCRIPTION
2.1. Assumptions The particular geometry chosen for the
THROHPUT model coincides with that of the current designs for space reactor heat pipes [ 1, 3 I-351. It con- sists of a cylindrical tube lined with an annular screen wick. The dimensions are user-specified. The model assumes lithium as a working fluid. where the lithium may exist as a solid, liquid. or gas. A noncondensible gas, assumed to be air, can be present in the vapor phase. The operating fluids can be changed by the suitable substitution of state relations. The lithium gas and the noncondensible are assumed to be intimately mixed, occupying the same volume with the same temperature at any particular location. It is usually assumed that the velocities of the two components are equal. In the THROHPUT code, the two gases are assumed to have different velocities, with the velocity difference described by the Dusty Gas Model [36]. Another common assumption in two-phase thermo- hydraulics is the equality of the liquid and vapor
pressures, but such an assumption is not proper when capillary forces are the main driving forces of the system. In this case, the pressure difference between the liquid and vapor phases is related to the curvature of the interphasic meniscus.
In the absence of gravitational forces and azi- muthally varying boundary conditions. flow in the heat pipe is entirely axial and radial. The major flow field is in the axial direction. With this in mind, the fluid equations are solved by area averaging over the radial and azimuthal directions, yielding a one-dimen- sional axial system. The important radial flows appear as interfacial terms associated with the evaporation and condensation processes and are treated in a sep- arate radial model.
2.2. Axial Model The main model in the THROHPUT code is the
Axial Model. It consists of a set of 15 simultaneous partial differential equations which describe the behavior of the main system variables : density, pres- sure. temperature. velocity, and volume fraction for each of the four system components (lithium solid, liquid, and gas; and the noncondensible gas). The
(2)
liquid continuity
^ ^
c:\ II,(a,p,)+s.&N = c I-,,: (3) I - g-5
solid continuity
9
e, &S/4) = c I,,: (4) \ = $.I
mixture internal energy
Axial Model equation set is (mixture denotes the mix- ture of lithium gas and noncondensible) :
mixture continuity
+,,,P~)+ I_l(~~~,,l~~~,) = 1 I,,: (1) 8 -,.
noncondensible continuit)
^
? + z
i
+ 1 C2m+A~g); (5) \ = ,.I
liquid internal energy
+ 1 P,,+ c Q:,; (6) \ = m.\.u I = g.5
solid internal energy
+ c CL,+ 1 Qts; (7) 1 _ m.l.u \- = g.,
wall internal energy
A sensitivity study of the effects of evaporation/condensation accommodation coefficients 469
mixture momentum
-9, V, + %&ng.- ; (9)
liquid momentum * d ap,
&,~(a,plV,)+&,~(a,P,V:) = --EVaI--- a= *
-F,V,-APL,: +.z,aIpIgz; (10)
mixture state
Pin = P,~ln(~“~“+(l--~“)~,); (11)
liquid state
solid state
PI = Pl(PI, r,) ; (12)
PI = P,(K) ;
volume fraction sum
(13)
.~ =c,,,., a-Y = 1 ; (14)
capillary pressure relation
p, --PI = WAP&,)) (15)
where the system variables are: P,,,, p,, p.. X,, a,,,, a,,
a,, P,, V,,,, V,, T,, T,, T,, and T,. The interphase transfer terms (r,,., Q”., Q.:,.) are all functions of P,,,. X,, T,,,, T,, T,, and T,,, and are defined in the Radial Model.
The axial model equation set is d&ret&d using a staggered spatial mesh, with the conventional donor- ing and upwind differencing techniques. Temporal discretization is accomplished using a fully implicit scheme. This results in a nonlinear system which is solved using Newton’s method. The Jacobian matrix for this system is block tridiagonal, with 15 x 15 blocks and as many blocks as there are axial nodes. Multiple passes are made through the system, updat- ing the Jacobian at each pass, until the error norm of the variables is less than a user-specified value. This differs from the previous THROHPUT model [30], which made only one pass through the same system. The temporal discretization of the previous model was described as a linearized fully implicit model, and yielded the same accuracy with less stability. The main impetus behind going to a multiple pass technique was not the stability of the method, but rather the time step size. Multiple passes allow the updating of several highly nonlinear equations (namely, the mixture state equation and the capillary pressure relationship) and, thereby, the reduction of linear- ization error. Since the linearization error in these two equations was the limiting factor in time step control, eliminating the error was very attractive. The THROHPUT code is not limited by Fourier modulus or Courant limits due to the fully implicit temporal discretization scheme. Time step size is governed only
by the ability to converge to a solution within the allowed number of passes, and by the preservation of the physical significance of the variables. However, the time step must also be small enough to capture the fluctuations of the heat input data.
2.3. Radial Model The Radial Model was developed as a means of
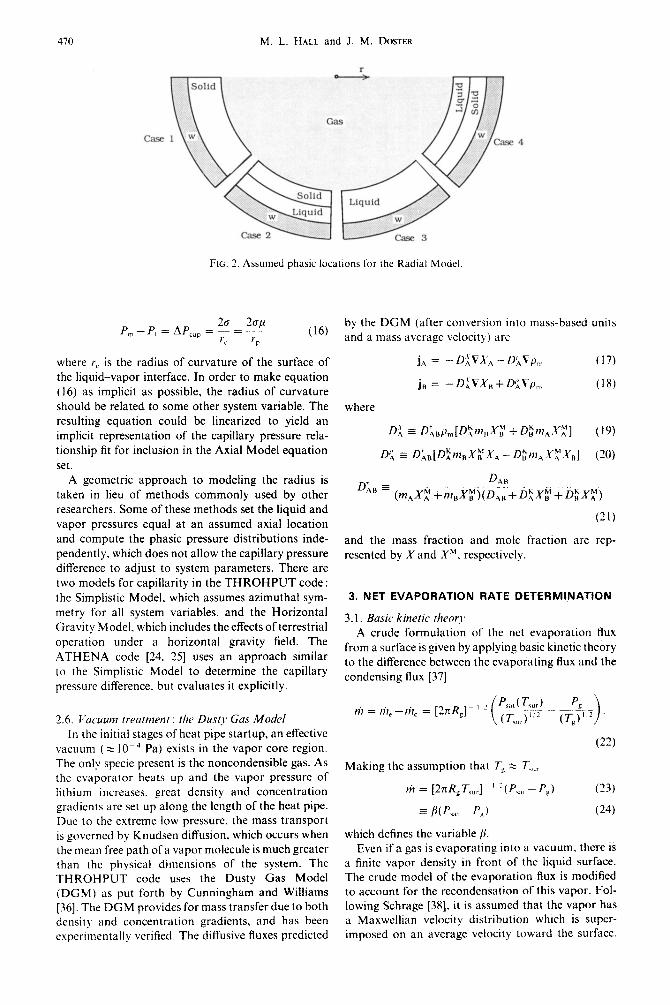
incorporating radial heat and mass transfer into the Axial Model. Its main objective is to provide inter- phase linkage terms to the Axial Model that are as implicitly determined as possible without sacrificing linearity. Interphase mass transfer between all of the phases is modeled. Melting and freezing are modeled with a discontinuous heat flux at the liquid-solid boundary. In order to simplify the Radial Model, some assumptions about the radial locations of the phases have been made. It is assumed that the phases exist in radial layers. in one of four specific con- figurations. These configurations represent the fol- lowing conditions (see Fig. 2) : cold state (all solid) ; startup or melting (liquid-solid) ; normal operation (all liquid) ; and shutdown or freezing (solid-liquid). The THROHPUT code assumes that the radial tem- perature distributions are parabolic in each nonvapor layer. The three coefficients for each region are deter- mined by forcing the equations to satisfy boundary conditions and to match the average values computed in the Axial Model. This solution strategy gives a temperature distribution in each region which can be evaluated to yield the surface temperatures. If the crossover between two cases is overstepped, a rebal- ance is done after the time step that conserves both mass and energy.
2.4. Axial Melt Front model Melt front propagation in the evaporator section is
predominantly in the radial direction. After the initial melting of the evaporator section, the melt front pro- gresses down the length of the heat pipe axially. This type of melt front is not accurately modeled with a radial propagation model, hence the development of an Axial Melt Front (AMF) model. The Radial Model is used twice by the AMF model : once for the liquid side and once for the solid side. The total heat and mass transfer for an AMF node is then deter- mined by a volume weighted average of the two radial submodel results. along with some terms derived from a lumped parameters treatment of the axial inter- phasic boundary. Similar actions are taken when the axial melt front is coincident with a cell boundary.
2.5. Surfhce model The heat pipe concept is based on the recirculation
of the condensate liquid to the evaporator, which would be impossible without the capillary pressure head supplied by the wick. The capillary pressure relationship is therefore of utmost importance in heat pipe modeling. This relationship is
470 M. L. HALL and J. M. DCISTER
FIG. 2. Assumed phasic locatIons fbr the Radial Model
Pl,-P,=,ApC*p=%2 r, I’P
(16)
where r, is the radius of curvature of the surface of the liquid-vapor interface. In order to make equation (16) as implicit as possible, the radius of curvature
should be related to some other system variable. The resulting equation could be linearized to yield an implicit representation of the capillary pressure rela- tionship fit for inclusion in the Axial Model equation
set. A geometric approach to modeling the radius is
taken in lieu of methods commonly used by other researchers. Some of these methods set the liquid and vapor pressures equal at an assumed axial location and compute the phasic pressure distributions inde- pendently. which does not allow the capillary pressure difference to adjust to system parameters. There are two models for capillarity in the THROHPUT code : the Simplistic Model. which assumes azimuthal sym- metry for all system variables, and the Horizontal Gravity Model. which includes the effects of terrestrial operation under a horizontal gravity field. The
ATHENA code [24. 251 uses an approach similar to the Simplistic Model to determine the capillary pressure difference. but evaluates it explicitly.
In the initial stages of heat pipe startup, an effective vacuum ( 3 10-j Pa) exists in the vapor core region. The only specie present is the noncondensible gas. As the evaporator heats up and the vapor pressure of lithium increases. great density and concentration gradients are set up along the length of the heat pipe. Due to the extreme low pressure, the mass transport is governed by Knudsen diffusion. which occurs when the mean free path of a vapor molecule is much greater than the physical dimensions of the system. The THROHPUT code uses the Dusty Gas Model (DGM) as put forth by Cunningham and Williams [36]. The DGM provides for mass transfer due to both density and concentration gradients, and has been experimentally verified. The diffusive fluxes predicted
by the DGM (after conversion into mass-based units and a mass average velocity) are
j, = - D~VX’,~ - D<Vp, (17)
j, = - D%VX, + Di;Gp,,, (18)
where
and the mass fraction and mole fraction are rep- resented by X and X”. respectively.
3. NET EVAPORATION RATE DETERMINATION
3.1. Basic kinetic theorem
A crude formulation of the net evaporation flux from a surface is given by applying basic kinetic theory to the difference between the evaporating flux and the
condensing flux [37]
Making the assumption that r, z r.,,
ti? = [27&T,,,] ’ ‘(P,., - P,,) (23)
= B( P,;,, - P, 1 (24)
which defines the variable /j. Even if a gas is evaporating into a vacuum. there is
a finite vapor density in front of the liquid surface. The crude model of the evaporation flux is modified to account for the recondensation of this vapor. Fol- lowing Schrage [38]. it is assumed that the vapor has a Maxwellian velocity distribution which is supcr- imnosed on an average velocity toward the surface. .

A sensitivity study of the effects of evaporation/condensation accommodation coefficients 471
The flux of this gas toward the surface is readily shown from kinetic theory to be
ril, = Q(b)/IP, (25)
where b is the ratio of the overall speed to the most probable velocity of the gas, and R(b) is given by
R(b) = e&+brt”{l+erf (b)). (26)
Approximations to this function are given by Collier [37] as
{
1 fbn”2 for b <c 1 Q(b) = 2hn, 2 for b >> 1. (27)
Data in the transition range given by Collier have been fitted using a linear least squares method. Transition points are determined by equating the various lines. The resulting form is
1 +ba”2 for b < 0.1192
R(b) = 0.8959+2.64576 for be (0.1192,0.9962)
2br’12 for b > 0.9962.
(28)
The net evaporation flux is then
h = B(P,at - Q(b)P,). (29)
When a noncondensible gas is present, it is carried by the condensing specie to the surface, where it accumulates. The condensing gas must then diffuse through the noncondensible barrier in order to reach the surface. Collier (371 gives the following relation- ship for condensation in the presence of a non- condensible :
3.2. Accommodation coejicients Equation (29) gives the net evaporation flux found
by subtracting the maximum condensation flux from the maximum evaporation flux, the inherent assump- tion being that every atom that hits the surface con- denses and every atom on the surface that evaporates remains in the vapor. Physically, this assumption is not valid : there are many phenomena that hinder the phase change process. Less than optimal evaporation and condensation fluxes are usually modeled with accommodation coefficients (a, and a,) that vary from zero to one :
ti = fl(a,P,, -oC,n(b)Pg). (31)
For most fluids, in most situations, the accom- modation coefficients are assumed to be equal to one. However, for liquid metal evaporation from a wick surface in a cylindrical tube, the accommodation coefficients may be far from unity.
There are limited experimental data in the area
FIG. 3. Experimental and postulated variation of u, with T for various metal vapors (roughly redrawn from ref. [39]).
of liquid metal condensation. Hsieh [39] cites the ex- perimental results of a number of researchers who have found condensation heat transfer in liquid metals to be a fraction of the predictions of Nusseh theory (Misra and Bonilla, 5-15% of theory ; Cohn, l-13% ; Englebrecht and Bonilla, 2-10% ; Barry and Balzhiser, 9%). These consistently low condensation heat transfer coefficients can be translated directly into low condensation accommodation coefficients. Experimentally determined values for 6, and pos- tulated temperature behavior for various liquid metals are shown in Fig. 3. Many of these researchers attri- bute the low condensation coefficients to the dimer content of the metal vapor. Most organic fluids, which do not exhibit low accommodation coefficients, are monatomic as a vapor. It is speculated that metal gases which exist as dimers might undergo a rate limiting reorientation upon condensation. Or, dimers might behave like a noncondensible or semicondensible gas and inhibit the condensation process by forming a barrier cloud over the condensing surface. The dimer content of a metal gas is a function of its temperature and pressure : the dimer model fraction of saturated lithium gas reaches 0.1 at 1500 K.
Huang (cited in ref. [39]) allows for the fact that certain molecules which hit the surface with low grazing angles were not condensed. His theoretical analysis determines the maximum value of u, to be 0.88 instead of unity. Narusawa and Springer (cited in ref. [39]) find that the condensation accommodation coefficient depends upon surface contamination. For a clean sur- face. they find a, > 0.67, but for a contaminated sur- face their value for a, is 0.16.
Somorjai [40] observes that the evaporation rate will be maximized if the activation energy for over- coming the attractive forces of the surface is less than the free energy of evaporation, such that the evap- oration process itself is rate determining. Substances which undergo a reorientation during vaporization should exhibit an evaporation rate less than the maximum. Somorjai further states that, in some cir- cumstances, an evaporating surface may have deep
472 M. L. HALL and J. M. DOSTER
cracks and crevices even if it is primarily flat. These inner channels may act as small Knudsen cells in which the evaporating molecules undergo many col- lisions before their final exit, providing a further resist- ance to vaporization. For a heat pipe with the liquid surface receding into the wick. it is easy to envision the macroscopic crevices (pores) and their related hindrance to evaporation.
In summary, the accommodation coefficient for liquid metal condensation (a,) in a heat pipe situation is affected by the following phenomena :
l Dimer content of the vapor. At higher tem- peratures, the dimer content of the vapor increases, which may necessitate an additional activation energy for reorientation upon condensation. l Surface contamination. There is a large dis-
crepancy between a screen wick surface and a flat interface. l Surface grazing angle. During lithium heat pipe
startups, the axial vapor velocity reaches large values, which tends to increase the number of particles that stick to the surface.
Similarly, the accommodation coefficient for liquid metal evaporation (a,) in a heat pipe situation is affected by the following phenomena :
l Surface recession into the wick. The further the liquid recedes into the wick, the greater the resistance to evaporation. A wick with less porosity would heighten the effect. l Dimer content of the vapor. At higher tem-
peratures, the dimer content of the vapor increases, which may necessitate an additional activation energy for reorientation upon evaporation. l The local flow regime. A continuum flow situ-
ation would mitigate the influence of the reentrant cylindrical geometry, whereas free molecular flow would encourage recondensation for all evaporating particles.
The THROHPUT code uses equation (31) to model the net evaporation rate. The evaporation flux is first converted to an evaporation rate (mass addition per volume)
where E, is the fraction of the wick surface available for interphasic transport. The accommodation co- efficients are input by the user and are constant for any given code run. Equation (30), which accounts for inhibition of the evaporation/condensation pro- cess due to the presence of a noncondensible, is used only if it predicts a value less than the maximum value predicted by kinetic theory. During the code runs executed to date, this condition has never occurred.
4. DISCUSSION OF RESULTS
4.1. Problem setup
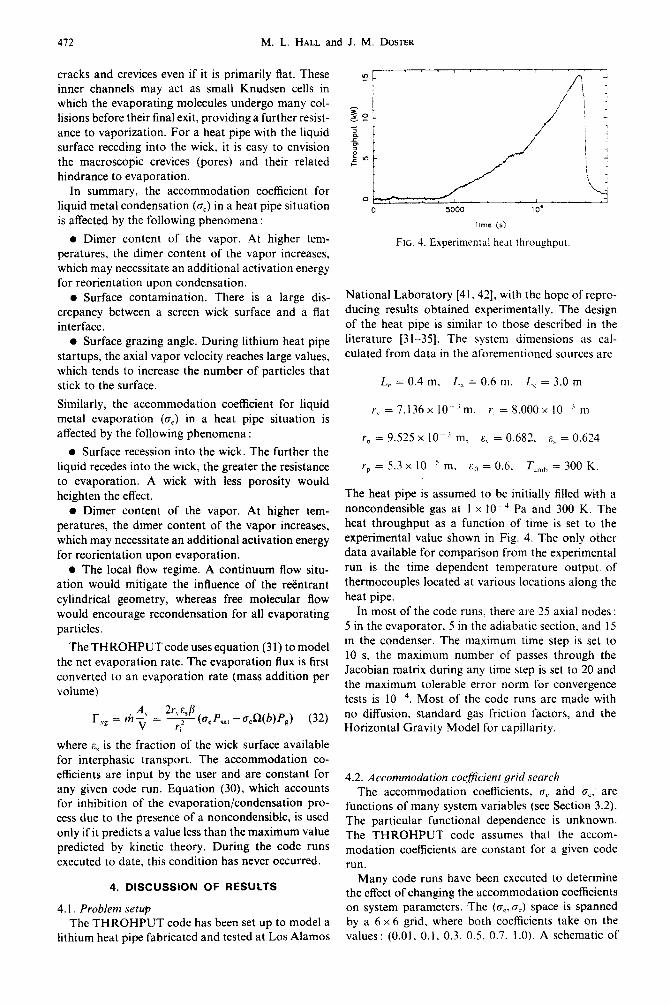
The THROHPUT code has been set up to model a lithium heat pipe fabricated and tested at Los Alamos
0 5000 10’
iime (5)
FIG. 4. Experimental heat throughput
National Laboratory [41.42], with the hope of repro- ducing results obtained experimentally. The design of the heat pipe is similar to those described in the literature [31-351. The system dimensions as cal- culated from data in the aforementioned sources are
L, = 0.4 m. L, = 0.6 m. L, = 3.0 m
r, =7.136x lOV’m, r, = 8.000~ 10~ ’ ITI
r, = 9.525 x IO--’ m, C, = 0.682. 8, = 0.624
rp = 5.3 x IO-’ m. c0 = 0.6. Ttlrnh = 300 K.
The heat pipe is assumed to be initially filled with a noncondensible gas at 1 x 10. ’ Pa and 300 K. The heat throughput as a function of time is set to the experimental value shown in Fig. 4. The only other data available for comparison from the experimental run is the time dependent temperature output of thermocouples located at various locations along the heat pipe.
In most of the code runs, there are 25 axial nodes : 5 in the evaporator. 5 in the adiabatic section, and 15 in the condenser. The maximum time step is set to 10 s. the maximum number of passes through the Jacobian matrix during any time step is set to 20 and the maximum tolerable error norm for convergence tests is 10e4. Most of the code runs are made with no diffusion. standard gas friction factors, and the Horizontal Gravity Model for capillarity.
4.2. Accommodation uwficient grid search
The accommodation coefficients. (T, and cc, are functions of many system variables (see Section 3.2). The particular functional dependence is unknown. The THROHPUT code assumes that the accom- modation coefficients are constant for a given code run.
Many code runs have been executed to determine the effect of changing the accommodation coefficients on system parameters. The (a,,~,) space is spanned by a 6 x 6 grid, where both coefficients take on the values: (0.01. 0.1. 0.3, 0.5. 0.7. 1.0). A schematic of
A sensitivity study of the effects of evaporation/condensation accommodation coefficients
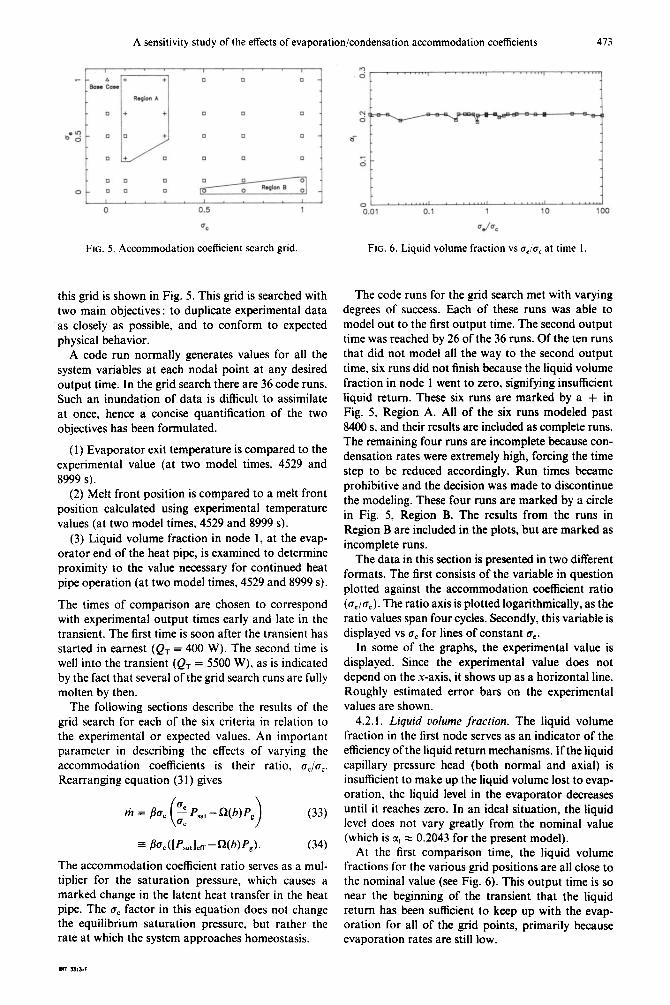
FIG. 5. Accommodation coefficient search grid FIG. 6. Liquid volume fraction vs o,,o, at time 1.
this grid is shown in Fig. 5. This grid is searched with two main objectives: to duplicate experimental data as closely as possible, and to conform to expected physical behavior.
A code run normally generates values for all the system variables at each nodal point at any desired output time. In the grid search there are 36 code runs. Such an inundation of data is difficult to assimilate at once, hence a concise quantification of the two objectives has been formulated.
(1) Evaporator exit temperature is compared to the experimental value (at two model times, 4529 and 8999 s).
(2) Melt front position is compared to a melt front position calculated using experimental temperature values (at two model times, 4529 and 8999 s).
(3) Liquid volume fraction in node 1, at the evap- orator end of the heat pipe, is examined to determine proximity to the value necessary for continued heat pipe operation (at two model times, 4529 and 8999 s).
The times of comparison are chosen to correspond with experimental output times early and late in the transient. The first time is soon after the transient has started in earnest (QT = 400 W). The second time is well into the transient (Qr = 5500 W), as is indicated by the fact that several of the grid search runs are fully molten by then.
The following sections describe the results of the grid search for each of the six criteria in relation to the experimental or expected values. An important parameter in describing the effects of varying the accommodation coefficients is their ratio, ge/cr,. Rearranging equation (3 1) gives
= Ba,([P~a,l,R-R(b)P~). (34)
The accommodation coefficient ratio serves as a mul- tiplier for the saturation pressure, which causes a marked change in the latent heat transfer in the heat pipe. The 8, factor in this equation does not change the equilibrium saturation pressure, but rather the rate at which the system approaches homeostasis.
The code runs for the grid search met with varying degrees of success. Each of these runs was able to model out to the first output time. The second output time was reached by 26 of the 36 runs. Of the ten runs that did not model all the way to the second output time, six runs did not finish because the liquid volume fraction in node 1 went to zero, signifying insufficient liquid return. These six runs are marked by a + in Fig. 5, Region A. All of the six runs modeled past 8400 s, and their results are included as complete runs. The remaining four runs are incomplete because con- densation rates were extremely high, forcing the time step to be reduced accordingly. Run times became prohibitive and the decision was made to discontinue the modeling. These four runs are marked by a circle in Fig. 5, Region B. The results from the runs in Region B are included in the plots, but are marked as incomplete runs.
The data in this section is presented in two different formats. The first consists of the variable in question plotted against the accommodation coefficient ratio (a,/crJ. The ratio axis is plotted logarithmically, as the ratio values span four cycles. Secondly, this variable is displayed vs uC for lines of constant a,.
In some of the graphs, the experimental value is displayed. Since the experimental value does not depend on the x-axis, it shows up as a horizontal line. Roughly estimated error bars on the experimental values are shown.
4.2.1. Liquid aolume fraction. The liquid volume fraction in the first node serves as an indicator of the efficiency of the liquid return mechanisms. If the liquid capillary pressure head (both normal and axial) is insufficient to make up the liquid volume lost to evap- oration, the liquid level in the evaporator decreases until it reaches zero. In an ideal situation, the liquid level does not vary greatly from the nominal value (which is CI , e 0.2043 for the present model).
At the first comparison time, the liquid volume fractions for the various grid positions are all close to the nominal value (see Fig. 6). This output time is so near the beginning of the transient that the liquid return has been sufficient to keep up with the evap- oration for all of the grid points, primarily because evaporation rates are still low.
474 M. L. HALL and J. M. DOSTER
P -:
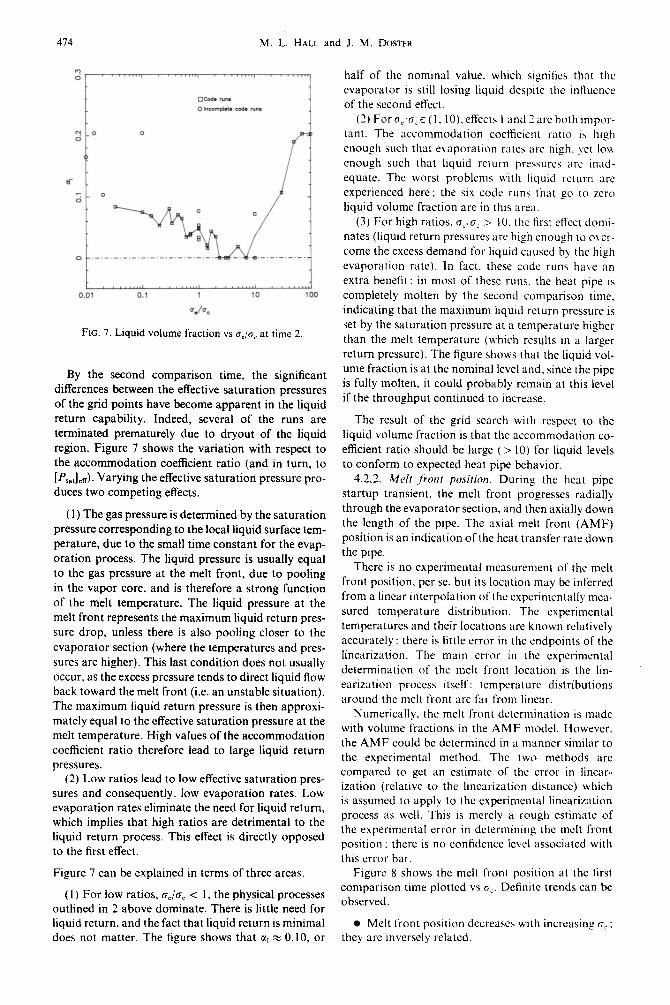
FIG. 7. Liquid volume fraction vs CT,/U, at time 2.
By the second comparison time, the significant differences between the effective saturation pressures of the grid points have become apparent in the liquid return capability. Indeed, several of the runs are terminated prematurely due to dryout of the liquid region. Figure 7 shows the variation with respect to
the accommodation coefficient ratio (and in turn, to [Ps,,lefi). Varying the effective saturation pressure pro- duces two competing effects.
(1) The gas pressure is determined by the saturation pressure corresponding to the local liquid surface tem- perature, due to the small time constant for the evap- oration process. The liquid pressure is usually equal to the gas pressure at the melt front, due to pooling in the vapor core, and is therefore a strong function
of the melt temperature. The liquid pressure at the melt front represents the maximum liquid return pres- sure drop. unless there is also pooling closer to the
evaporator section (where the temperatures and pres-
sures are higher). This last condition does not usually occur, as the excess pressure tends to direct liquid flow back toward the melt front (i.e. an unstable situation). The maximum liquid return pressure is then approxi- mately equal to the effective saturation pressure at the melt temperature. High values of the accommodation coefficient ratio therefore lead to large liquid return pressures.
(2) Low ratios lead to low effective saturation pres- sures and consequently, low evaporation rates. Low evaporation rates eliminate the need for liquid return, which implies that high ratios are detrimental to the liquid return process. This effect is directly opposed to the first effect.
Figure 7 can be explained in terms of three areas.
(1) For low ratios, cre/gi, < 1, the physical processes outlined in 2 above dominate. There is little need for liquid return, and the fact that liquid return is minimal does not matter. The figure shows that a, z 0.10, or
half of the nominal value. which signifies that the evaporator is still losing liquid despite the influence of the second effect.
(2) Forcr,,cr,E(l. lO).effccts I and2arc bothimpor-
tant. The accommodation coefficient ratio is htgh enough such that evaporation rates arc high. vet IOU
enough such that liquid return pressures arc inad- equate. The worst problems with liquid return arc experienced here: the six code runs that go to zero liquid volume fraction are in this area.
(3) For high ratios. (T, CT> > IO. the first etl’ect domi- nates (liquid return pressures are high enough to ovcr-
come the excess demand for liquid caused by the high evaporation rate). In fact. these code runs have an extra benefit: in most of these runs. the heat pipe is completely molten by the second comparison time. indicating that the maximum liquid return pressure is <et by the saturation pressure at a temperature higher than the melt temperature (which results in a larger
return pressure). The figure shows that the liquid vol- ume fraction is at the nominal level and. since the pipe is fully molten. it could probably remain at this level if the throughput continued to increase.
The result of the grid search with respect to the
liquid volume fraction is that the accommodation co-
efficient ratio should be large ( > 10) for liquid levels to conform to expected heat pipe behavior.
4.22. Melt front positim. During the heat pipe
startup transient, the melt front progresses radially through the evaporator section, and then axially down the length of the pipe. The axial melt front (AMF) position is an indication of the heat transfer rate down the pipe.
There is no experimental measurement of the melt
front position, per se. but its location may be inferred from a linear interpolation of the cxpcrimentally mca-
sured temperature distribution. The experimental temperatures and their locations are known relatively accurately : there is little error in the endpoints of the linearization. The main error in the experimental determination of the melt front location is the Irn- earization process itself: temperature distributions around the melt front are far from linear.
Numerically. the melt front determination is made with volume fractions in the AMF model. However, the AMF could be determined in a manner similar to the experimental method. The two methods arc compared to get an cstimatc of the error in linear- ization (relative to the linearization distance) which is assumed to apply to the experimental linearization process as well. This is merely a rough estimate of the experimental error in determining the melt front position : there is no confidence level associated with this error bar.
Figure 8 shows the meit front position at the first comparison time plotted vs mC. Dctinitc trends can bc
observed.
l Melt front position decreases with increasing 0,: they are inversely related.
A sensitivity study of the effects of evaporation/condensation accommodation coefficients 475
_ I:o; kT\ it, : , ‘\ ‘..,, \
2 v) I i, : ‘\ 6% \ \, ‘.. \ p ( \ ‘, ‘,.
I ‘\ ‘.. \ 2
i *.,....,,.,
I ‘\ ‘:
g 2 z \ :,
‘\
’ \ ‘1. ‘6 _, ‘\ \ ‘.\ ‘..
. . . .._ \ % x \ l -.--r:y,.~ . . . . . . . . . .._. x
‘+, I ‘\
-w.._.‘~
d --+---_-+
II
--
4
_; j --_--- ___
I I cc
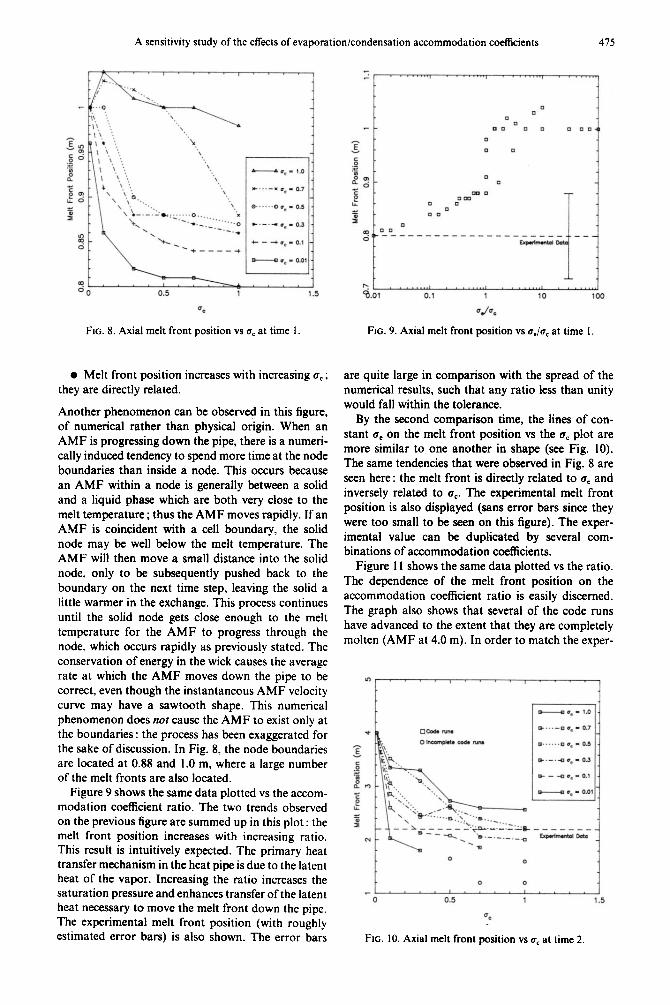
FIG. 8. Axial melt front position vs a, at time 1.
%4
FIG. 9. Axial melt front position vs a,/~, at time I.
l Melt front position increases with increasing a, ; they are directly related.
Another phenomenon can be observed in this figure, of numerical rather than physical origin. When an AMF is progressing down the pipe, there is a numeri- cally induced tendency to spend more time at the node boundaries than inside a node. This occurs because an AMF within a node is generally between a solid and a liquid phase which are both very close to the melt temperature ; thus the AMF moves rapidly. If an AMF is coincident with a cell boundary, the solid node may be well below the melt temperature. The AMF will then move a small distance into the solid node, only to be subsequently pushed back to the boundary on the next time step, leaving the solid a little warmer in the exchange. This process continues until the solid node gets close enough to the melt temperature for the AMF to progress through the node, which occurs rapidly as previously stated. The conservation of energy in the wick causes the average rate at which the AMF moves down the pipe to be correct, even though the instantaneous AMF velocity curve may have a sawtooth shape. This numerical phenomenon does not cause the AMF to exist only at the boundaries : the process has been exaggerated for the sake of discussion. In Fig. 8, the node boundaries are located at 0.88 and 1.0 m, where a large number of the melt fronts are also located.
Figure 9 shows the same data plotted vs the accom- modation coefficient ratio. The two trends observed on the previous figure are summed up in this plot: the melt front position increases with increasing ratio. This result is intuitively expected. The primary heat transfer mechanism in the heat pipe is due to the latent heat of the vapor. Increasing the ratio increases the saturation pressure and enhances transfer of the latent heat necessary to move the melt front down the pipe. The experimental melt front position (with roughly estimated error bars) is also shown. The error bars
are quite large in comparison with the spread of the numerical results, such that any ratio less than unity would fall within the tolerance.
By the second comparison time, the lines of con- stant 0, on the melt front position vs the a, plot are more similar to one another in shape (see Fig. 10). The same tendencies that were observed in Fig. 8 are seen here: the melt front is directly related to 0, and inversely related to u,. The experimental melt front position is also displayed (sans error bars since they were too small to be seen on this figure). The exper- imental value can be duplicated by several com- binations of accommodation coefficients.
Figure 11 shows the same data plotted vs the ratio. The dependence of the melt front position on the accommodation coefficient ratio is easily discerned. The graph also shows that several of the code runs have advanced to the extent that they are completely molten (AMF at 4.0 m). In order to match the exper-
In .,,.,,.,.,.,,,
1
0 0
0 0
-0 0.5 1 1.5
*e
FIG. IO. Axial melt front position vs o, at time 2.
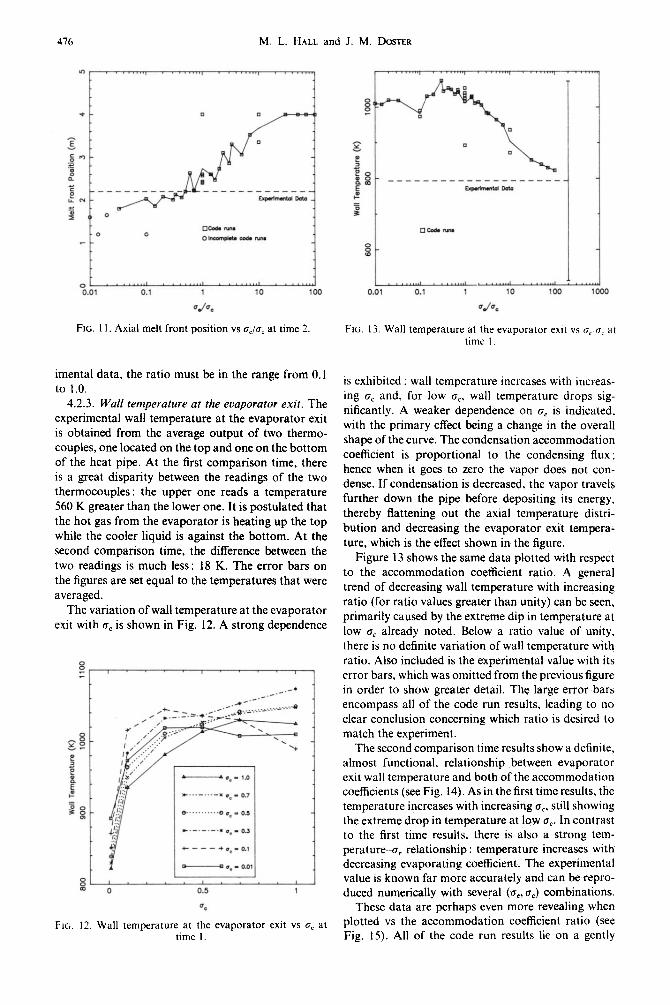
416 M. L. HALL and J. M. DOVER
FIG. 11. Axial melt front position vs CT,/U, at time 2.
imental data, the ratio must be in the range from 0.1 to 1.0.
42.3. Wall temperature at the evaporator exit. The experimental wall temperature at the evaporator exit is obtained from the average output of two thermo- couples, one located on the top and one on the bottom of the heat pipe. At the first comparison time, there is a great disparity between the readings of the two thermocouples: the upper one reads a temperature 560 K greater than the lower one. It is postulated that the hot gas from the evaporator is heating up the top while the cooler liquid is against the bottom. At the second comparison time, the difference between the two readings is much less : 18 K. The error bars on the figures are set equal to the temperatures that were averaged.
The variation of wall temperature at the evaporator exit with 0, is shown in Fig. 12. A strong dependence
0 0.5 1
0.
FIG. I?. Wall temperature at the evaporator exit vs 6, at time 1.
Do
FIG. 13. Wall temperature at the evaporator exit vs or (r, at time I.
is exhibited : wall temperature increases with increas- ing uC and, for low ocr wall temperature drops sig- nificantly. A weaker dependence on o’e is indicated, with the primary effect being a change in the overall shape of the curve. The condensation accommodation coefficient is proportional to the condensing flux; hence when it goes to zero the vapor does not con- dense. If condensation is decreased. the vapor travels further down the pipe before depositing its energy, thereby flattening out the axial temperature distri- bution and decreasing the evaporator exit tempera- ture, which is the effect shown in the figure.
Figure 13 shows the same data plotted with respect to the accommodation coefficient ratio. A general trend of decreasing wall temperature with increasing ratio (for ratio values greater than unity) can be seen, primarily caused by the extreme dip in temperature at low a, already noted. Below a ratio value of unity, there is no definite variation of wall temperature with ratio. Also included is the experimental value with its error bars, which was omitted from the previous figure in order to show greater detail. The large error bars encompass all of the code run results, leading to no clear conclusion concerning which ratio is desired to match the experiment.
The second comparison time results show a definite, almost functional, relationship between evaporator exit wall temperature and both of the accommodation coefficients (see Fig. 14). As in the first time results, the temperature increases with increasing o,, still showing the extreme drop in temperature at low rrC. In contrast to the first time results, there is also a strong tem- perature-o, relationship : temperature increases with decreasing evaporating coefficient. The experimental value is known far more accurately and can be repro- duced numerically with several (ue, a,) combinations.
These data are perhaps even more revealing when plotted vs the accommodation coefficient ratio (see Fig. 15). All of the code run results lie on a gently

A sensitivity study of the effects of evaporation/condensation accommodation coefficients 417
0 0.5 1 1.5
00
FIG. 14. Wall temperature at the evaporator exit vs nc at time 2.
sloping curve, the temperature varying from 1000 to 1800 K over the four cycles of the ratio. The smooth- ness and exactness of this relationship is in contrast to the jaggedness of the liquid volume fraction or the melt front position relationships at the second comparison time, suggesting less dependence on the numerics of the solution and more dependence on the physics of the situation. Including the effects of the error bars, the experimental value can be reproduced with a ratio somewhere between 2 and 3.
The underlying reason for the incomplete code runs is most apparent on this figure. The evaporator exit temperatures for the incomplete runs are extremely high and, since the amount of heat throughput is a constant for all of the runs, the temperatures in the rest of the pipe are correspondingly low. The temperature
FIG. 15. Wall temperature at the evaporator exit vs u,/u, at time 2.
I I. . IL . I-. ‘\
a-- .?%-7=mri 0 1 2 3 4
D*taa (4
FIG. 16. Comparisons of the experimental wall temperature distribution with the best compromise code run (a, = 0.3,
oc = 0.3).
disparity between the hot gas and the cool condensing surface causes a situation which is difficult to model : the large condensation rates remove more of the lith- ium gas from the vapor phase than is present unless the time step is very small. The time step is restricted to the point that the solution proceeds with excruciating slowness, hence the termination of these runs before completion. The exit temperatures for the incomplete runs all lie below the curve in Fig. 15, which is expected because the exit temperature increases with time.
42.4. Conclusions. The examination of each of the variables in the search of the accommodation coefficient grid has yielded preferred values of the coefficients for agreement with experimental results or expected behavior.
l Liquid volume fraction: to conform with expected behavior, the accommodation coefficient ratio must be greater than 10. l Melt front position: to match experimental
values, the ratio must be between 0.1 and 1. l Evaporator exit wall temperature : to agree with
experiment, the ratio must be between 2 and 3.
The three criteria on the ratio are disjoint : only one may be satisfied at a time. This indicates that the initial assumption that the accommodation coefficients could be modeled as constants, instead of spatially varying functions, was incorrect. To reproduce the experimental data and to conform to expected heat pipe behavior, the coefficients should depend on tem- perature, liquid level, wick porosity, gas velocity and gas flow regime (see Section 3.2).
Although the three criteria may not be strictly sat- isfied simultaneously, the code run which sets both accommodation coefficients equal to 0.3 forms the best compromise. Liquid return is still very small for this run (a, at node 1 is 0.0337), but the temperature distribution compares favorably with the exper- imental temperature distribution at time 2 (see Fig. 16). Figure 17 shows how the temperature distribution
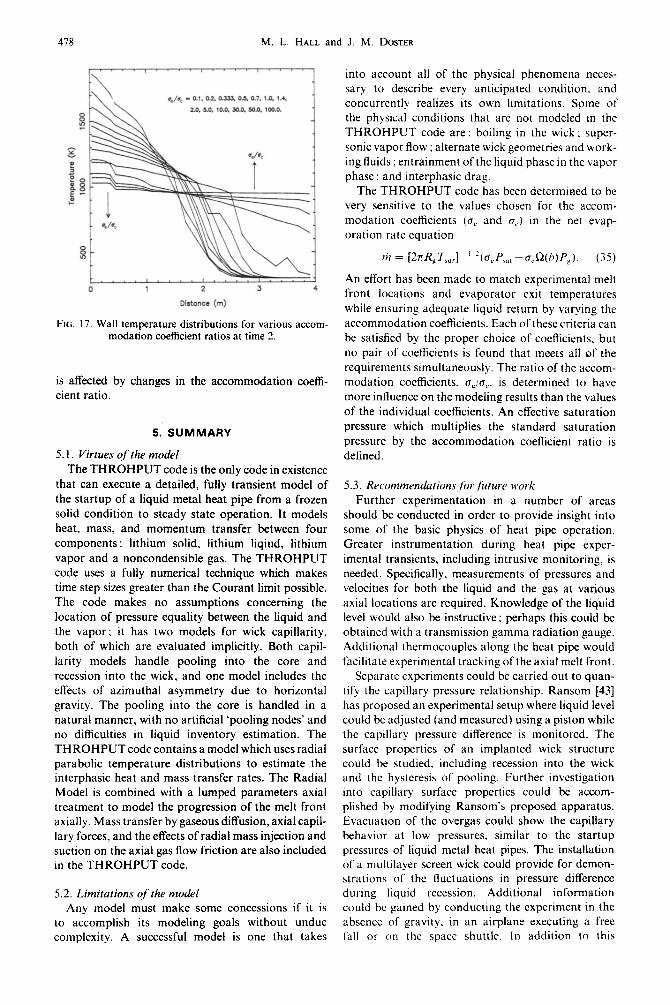
478 M. L. HALL and J. M. DOSTER
0 1 2 3 4
DMam (m)
FIG. 17. Wall temperature distributions for various aecom- modation coefficient ratios at time 2.
is affected by changes in the accommodation coeffi- cient ratio.
5. SUMMARY
5.1. Virtues qf the model
The THROHPUT code is the only code in existence
that can execute a detailed, fully transient model of the startup of a liquid metal heat pipe from a frozen solid condition to steady state operation. It models heat, mass, and momentum transfer between four components : lithium solid. lithium liqiud, lithium
vapor and a noncondensible gas. The THROHPUT code uses a fully numerical technique which makes time step sizes greater than the Courant limit possible. The code makes no assumptions concerning the location of pressure equality between the liquid and the vapor; it has two models for wick capillarity, both of which are evaluated implicitly. Both capil- larity models handle pooling into the core and recession into the wick, and one model includes the effects of azimuthal asymmetry due to horizontal gravity. The pooling into the core is handled in a natural manner, with no artificial ‘pooling nodes’ and no difficulties in liquid inventory estimation. The THROHPUT code contains a model which uses radial parabolic temperature distributions to estimate the interphasic heat and mass transfer rates. The Radial Model is combined with a lumped parameters axial treatment to model the progression of the melt front axially. Mass transfer by gaseous diffusion, axial capil- lary forces, and the effects of radial mass injection and suction on the axial gas flow friction are also included in the THROHPUT code.
5.2. Limitations qfthe model Any model must make some concessions if it is
to accomplish its modeling goals without undue complexity. A successful model is one that takes
into account all of the physical phenomena neces- sary to describe every anticipated condition. and concurrently realizes its own limitations. Some of the physical conditions that are not modeled in the THROHPUT code are : boiling in the wick ; super- sonic vapor flow ; alternate wick geometries and work- ing fluids ; entrainment of the liquid phase in the vapor phase : and interphasic drag.
The THROHPUT code has been determined to be very sensitive to the values chosen for the accom- modation coefficients (a, and a,) in the net evap- oration rate equation
riz = [L?nR,T,,,]_ ’ 2(a,P,,,-a,c2(b)P,). (35)
An effort has been made to match experimental melt front locations and evaporator exit temperatures while ensuring adequate liquid return by varying the accommodation coefficients. Each of these criteria can
be satisfied by the proper choice of coefficients, but no pair of coefficients is found that meets all of the requirements simultaneously. The ratio of the accom-
modation coefficients, (~,:cr,. is determined to have more influence on the modeling results than the values of the individual coefficients. An effective saturation
pressure which multiplies the standard saturation pressure by the accommodation coefficient ratio is defined.
5.3. Recommendations,ftir,fiuure work
Further experimentation in a number of areas should be conducted in order to provide insight into some of the basic physics of heat pipe operation. Greater instrumentation during heat pipe exper- imental transients, including intrusive monitoring, is needed. Specifically. measurements of pressures and velocities for both the liquid and the gas at various axial locations are required. Knowledge of the liquid level would also be instructive; perhaps this could be obtained with a transmission gamma radiation gauge. Additional thermocouples along the heat pipe would facilitate experimental tracking of the axial melt front.
Separate experiments could be carried out to quan- tify the capillary pressure relationship. Ransom [43] has proposed an experimental setup where liquid level could be adjusted (and measured) using a piston while the capillary pressure difference is monitored. The surface properties of an implanted wick structure could be studied. including recession into the wick and the hysteresis of pooling. Further investigation into capillary surface properties could be accom- plished by modifying Ransom’s proposed apparatus. Evacuation of the overgas could show the capillary behavior at low pressures, similar to the startup pressures of liquid metal heat pipes. The installation of a multilayer screen wick could provide for demon- strations of the fluctuations in pressure difference during liquid recession. Additional information could be gained by conducting the experiment in the absence of gravity, in an airplane executing a free fall or on the space shuttle. In addition to this
A sensitivity study of the effects of evaporation/condensation accommodation coefficients 419
experiment. the validity of the axial capillary force term could be explored by observing the flow of liquid
through a porous medium in zero gravity.
Experimentation concerning the dependence of the accommodation coefficients on system parameters is needed. In particular, the dependencies mentioned in Section 3.2 should be examined. Tests of two varieties could be performed: steady state tests in which the effective saturation pressure for various situations is measured ; and instantaneous rate tests in which the evaporation/condensation process is allowed to con- tinue for a short period of time before being halted to determine the state of the system. The length of time necessary for the rate tests would be dependent upon the accuracy of the measuring process (the amount of liquid or the amount of gas present at the beginning and at the end of the test would have to be measured), the minimization of startup and shutdown end effects on the test, and the magnitude of the evaporation rate itself. The difficulties in measuring the phasic masses and the rapid rate at which the system goes to steady state may preclude instantaneous rate tests altogether. Nevertheless, the results of this paper indicate that there is a greater need for steady state tests, as the effective saturation pressure is much more pivotal to heat pipe behavior than the time constant for the mass exchange process. Steady state tests should be conducted which measure the effective saturation pressure as a function of temperature, liquid recession into a wick structure and the average grazing angle of the gas with respect to the surface. This last parameter could be varied by changing the velocity of a gas jet directed over the condensing surface. While the capillarity tests could be carried out using water or a freon, the evaporation/condensation tests should be executed with a liquid metal working fluid. inasmuch as the molecular properties of ionicly bonded species differ significantly from those of covalently bonded species. The ultimate objective of the evaporation/ condensation tests is to determine functional forms for the accommodation coefficients which incorporate the relevant physical phenomena and can be easily applied to heat pipe modeling.
Ackno#,/e~~m4nr-The research was performed under appointment to the Nuclear Engineering. Heat Physics. and Radioactive Waste Management Fellowships -program administered by Oak Ridge Associated Universities for the U.S. Department of Energy.
REFERENCES 21.
J. E. Boudreau and D. Buden, A new generation of reactors for space power. In Proc. Symp. on Advanced Reuctor Sysfems, CONF-821148~Summs., Washington. DC, IS-17 November (1982). P. W. Garrison and K. T. Neck, Nuclear electric pro- pulsion (NEP) spacecraft for the outer planet orbiter mission. In Proc. AIAAISAEIASME 18th Joinr Pro- pulsion Co!K, AIAA-82-1276, Cleveland, Ohio, 21-23 June (1982). R. G. Palmer, L. B. Lundberg, E. S. Keddy and D. R. Koenig, Nuclear Reactor System Study for NASA/JPL,
22.
23.
Final Report, LA-9498-MS, Los Alamos National Lab- oratory, Los Alamos, New Mexico (1982).
4. F. C. Prenger and J. A. Sullivan, Conceptual designs for lOO-MW space radiators. In Proc. Advanced Nuclear Systems Symp., CONF-821103-Summs., LA-UR-82- 3279 (1982).
5. W. A. Ranken, Status of high-temperature heat pipe technology. In Proc. National Research Council Symp. on Advanced Reactor Sysrems. Washington, DC, 15-l 7 November (1982).
6. W. A. Ranken. Space reactors, October 1981-March 1982. Program Report LA-9598-PR, Los Alamos National Laboratorv. Los Alamos. New Mexico (1983).
7. T. P. Cotter, Theory of heat pipes, LA-3246-M‘S, Los Alamos Scientific Laboratory, Los Alamos, New Mexico (1965).
8. S. W. Yuan and A. B. Finkelstein, Laminar pipe flow with injection and suction through a porous wall, ASME Trans. 78,719-724 (1956).
9. D. M. Ernst, Evaluation of theoretical heat pipe per- formance. In Proc. Thermionic Conversion Specialist Co&, Palo Alto, California, 30 October-l November, pp. 349-354 (1967).
10. C. A. Busse, Pressure drop in the vapor phase of long heat pipes. In Proc. Thermionic Conversion Specialist Cons, Palo Alto, California, 30 October-l November, pp. 391-398 (1967).
11. C. A. Busse and F. C. Prenger, Numerical analysis of the vapour flow in cylindrical heat pipes. In Proc. Fph Int. Heat Pipe Co& Tsukuba Science City, Japan, 14 18 May (1984).
12. F. C. Prenger, Heat Pipe Computer Program (HTPIPE) User’s Manual, LA-8101-M, Los Alamos National Lab- oratory, Los Alamos, New Mexico (1979).
13. D. M. Ernst, Study of a heat rejection system for the nuclear electric propulsion (NEP) spacecraft, NASA-CR- 169921, Jet Propulsion Laboratory, Pasa- dena, California (1983).
14. S. W. Chi, Hear Pipe Theory and Practice. Hemisphere, New York (1976).
15. D. Chisholm. The Hear Pipe. Mills & Boone, London (1971).
16. P. Dunn and D. A. Reay, Hear Pipes. Pergamon Press, Oxford (1976).
17. B. A. Cullimore, Modeling of transient heat pipe effects using a generalized thermal analysis program. Pres- entation to the Transient Heat Pipe Modeling Work- shop, Los Alamos, New Mexico, 4-5 March (1986).
18. W. S. Chang and G. T. Colwell, Mathematical modeling of the transient operating characteristics of a low- temperature heat pipe, Numer. Heat Transfir 8, 169-186
19.
20.
(1985). G. T. Colwell and C. Camarda, Heat pipe modeling and experimental data. Presentation to the Transient Heat Pipe Modeling Workshop, Los Alamos, New Mexico, 4-5 March (1986). J. Peery and F. Best, Simulation of heat pipe rapid tran- sients. Presentation to the Transient Heat Pipe Modeling Workshop, Los Alamos, New Mexico, 4-5 March (1986). F. A. Costello, M. Merrigan and T. R. Scollon, Jr., Detailed transient model of a liquid-metal heat pipe. Presentation to the Transient Heat Pipe Modeling Workshop, Los Alamos, New Mexico, 4-5 March (1986). V. H. Ransom er al., RELAPSIMOD2 Code Manual, Volume I : Code Strucrure, System Models and Solution Methods, EGG-SAAM-6377. Idaho National Engin- eering Laboratory, EGBG Idaho, Inc., Idaho Falls, Idaho (1984). C. D. Fletcher and H. Chow, Simulation of the General Electric SP-100 space reactor concept using the ATHENA computer code. In Trans. 3rd Symp. on

480 M. L. HALL and J. M. DUSTER
24
Spuce Nucleur Pouw Sys~cms. CONF-860102-Summs.. Albuquerque. New Mexico, 13- 16 January (19X6). V. H. Ransom. ATHENA heat pipe model. Presentation to the Transient Heat Pipe Modeling Workshop. Los Alamos, New Mexico. 4-5 March (1986).
25 V. H. Ransom. Some new directions in system transient simulation. In Pmt. Second In!. Conf: on Simululion Method.7 in Nuclear Engineering, Montreal. Canada, 14 16 October (1986).
26 M. L. Hall. Computer modeling of the transient ther- mohydraulic behavior of a high temperature heat pipe for space reactor applications. Presentation to the Tran- sient Heat Pipe Modeling Workshop, Los Alamos. New Mexico, 45 March (1986).
21
28.
29.
M. L. Hall and J. M. Doster. Transient modeling of the thermohydraulic behavior of high temperature heat pipes for space reactor applications. In Proc 14rli Space Simulation Cot$.. Baltimore, Maryland. 3-6 November. pp. 313-330 (1986). M. L. Hall and J. M. Doster. Transient thermohydraulic heat pipe modeling. In Truns. 4rk Symp. on Space Nuclear Power S_wems. Albuquerque. New Mexico. 12 16 January, pp. 407410 (1987). M. L. Hall and J. M. Doster, Transient thermohydraulic heat pipe modeling. In Space Nuclear Power S~sfems 1987 (Edited by M. S. El-Genk and M. D. Hoover). Orbit, Malabar, Florida (1987).
30.
31.
M. L. Halland J. M. Doster. The THROHPUT code: thermohydraulic heat pipe modeling. In Trans. S/h &imp. on Space Nuclear Power Systems, Albuquerque. New Mexico, I l-14 January (1988). E. S. Keddy and H. E. Martinez, Development of high temperature liquid metal heat pipes for isothermal irradiation assemblies. In Proc. 17th Intersocieq Energ), Conrersion Engineering Cont. Los Angeles. California. August (1982).
32. M. A. Merrigan. J. E. Runyan, H. E. Martinez and E.
73
34
35
36.
37.
38.
39.
40.
41.
42.
43.
S. Keddy. Development and test of a space-reactor-core heat “me. In Proc,. AlA A 18th -I‘ill,mfophl,.tit.r C‘otlf . Monireal. Quebec. I-3 June (1983). ’ hl. .A. Merriean. H. E. Martinez. E. S. Keddv. J. Runvan and J. E. Kemme. Performance demonstration ofa high- power space-reactor heat-pipe design. In Proc. i81h Inrcrsocrcrl~ Encrql, Conrer.w~r~ Enyineeriny Con/.. Orlando. Florida..21 26 August (1983). M. A Merriean. E. S. Keddv. J. Runvan and H. E. Martinez. D&elopment and extended operation of a high power radiation loaded heat pipe. In Proc. 19rh AIA.4 Thermoph,vsic.s Coyf.. Snowmass. Colorado. 2-l 28 June (1984). M. A. Merrigan. E. S. Keddy and J. T. Sena. Transient performance investigation of a space power system heat pipe. In Proc. AL4AlASME 4th Jomr T1rermopl~~sic.s and Heut Transfer Cor~f:. AIAA-86-1273. Boston. Mas- sachusetts. 2-I June (1986). R. E. Cunningham and R. J. J. Williams, fXjfu.siorz it? Gases and Porous Media. Plenum Press. New York (1980). J. G. Collier. Comecrire Boiling ami Cundetzsurion. pp. 316-328. McGraw-Hill. New York (1981). R. W. Schrage. A Theoreknl Sru<v’qf Interphase Muss Trmyfer. Columbia University Press. New York (1953). S. Hsieh. Metal vapor condensation under high pressure. Ph.D. Thesis. Columbia University (1975). G. A. Somorjai, The evaporation- rate and mechanism of CdS and CdSe. In Proc. 1111. S~nm. on Condensution and Eraporarion of Solids. Dayton.’ Ohio. 12-14 Sep- tember. pp. 417433 (1962). E. S. Keddv. Personal communication. Los Alamos Lab- oratory. Los Alamos. New Mexico. I7 December (1986). R. S. Reid. Letter to Michael L. Hall, Los Alamos Lab- oratory. Los Alamos. New Mexico. I1 February (1987). V. H. Ransom. Personal communication. North Carolina State University. Raleigh, North Carolina. 25 March (1988).
UNE ETUDE DE SENSIBILITE DES EFFETS DES COEFFICIENTS D’ACCOMMODATION EVAPORATION/CONDENSATION SUR LA MODELISATION EN
TRANSITION DES CALODUCS Rbum&Le comportement dynamique des modeles de caloducs a metal liquide est fortement influence par le choix des techniques de modelisation de l’evaporation et de la condensation. Les descriptions de la thlorie cinetique classique de l’ivaporation et de la condensation sont souvent inadequates pour les situations rielles: on utilise communement des coefficients d’accommodation empiriques pour traduire le transfert de masse. Les geometries complexes et les champs d’ecoulement dans les systemes proposes de caloduc causent une deviation importante par rapport aux modeles classiques. Le code THROHPUT qui a et& dtcrit dans des travaux anterieurs, est developpe pour modeliser le comportement variable d’un caloduc a metal liquide a partir des conditions de depart jusqu’au fonctionnement permanent de pleine puissance. Ce code est utilisee ici pour evaluer la sensibilite des modeles au choix des coefficients d’ac- commodation evaporation/condensation. Des comparaisons sont faites avec des risultats experimentaux. On trouve que le comportement du caloduc peut etre predit avec un choix convenable des coefficients d’accommodation. Neanmoins, I’hypothese commune de coefficients d’accommodation spatialement con-
stants est un facteur limitant dans lc modele.
UNTERSUCHUNG DER EMPFINDLICHKEIT EINES TRANSIENTEN WARMEROHR- MODELLS AUF EINFLtiSSE DER ANPASSUNGS-KOEFFIZIENTEN FUR VERDAMPFUNG
UND KONDENSATION Zusammenfassung-Das dynamische Verhalten eines Modells fur Fliissigmetall-Warmerohre wird stark davon beeinflugt, wie die Vorginge der Verdampfung und Kondensation beschrieben werden. Die klass- ische kinetische Theorie der Verdampfungs- und Kondensationsvorgange ist fur die Beschreibung realer Vorgange oft ungeeignet ; empirische Anpassungs-Koeffizienten werden hlufig zur Berticksichtigung des nicht-idealen Stofftransports verwendet. Die komplizierten geometrischen und Striimungshedingungen. die man von Warmerohren her kennt, fiihren au erheblichen Abweichungen von klassischen Modellen. Das “THROHPUT”-Rechenprogramm, das in friiheren Arbeiten vorgestellt worden ist. wurde entwickelt, urn das transiente Verhalten von Fliissigmetall-Wirmerohren au beschreiben. ausgehend von den Start- bedingungen mit erstarrtem Metall bis bin zum stationlren Betrieb mit voller Leistung. Dieses Programm wird hier dazu vetwendet. die Empfindlichkeit des transienten Wirmerohr-Modells fur Fliissigmetall aufdie Wahl der Anpassungs-Koeffizienten fiir Verdampfung und Kondensation zu beschreiben. Die Ergebnisse werden mit entsprechenden Versuchsdaten verglichen. Dabei ergibt sich. da13 das Verhalten bei richtiger Wahl der Anpassungs-Koeffizienten gut wiedergegeben werden kann. Allerdings stellt die iibliche Annahme
riumlich konstanter Koeffizienten eine Begrenzung fur das Model1 dar.
A sensitivity study of the effects of evaporation/condensation accommodation coefficients 481
MCCJIE~OBAHHE BJIMIIHHl AKKOMO&%LJkiOHHbIX K03DWiL&-iEHTOB W3lAPEHWJI/KOH~EHCAI&iki HA MO~EJIHPOBAHME HECTAUMOHAPHOft
TEl-lJIOBOtt TPY6bI
~&IHaMHuCCKHe xapaxTepm3IID! MOnwCii ~~~KOM~‘WIJIHY~O~ TWIJIOBO~~ ~py6ar mnbno
~~BHCXT OT cnoco6a ouuca~~n Hcnapetm H XotrnemauHH. Knaccwecxoe onwzamre npoueccos Hcnape- Iill1 Ii KOHAeHCallAH C I’lOMOu@JO XRHeTH’leClCOii TCOPHH HeWeRBaTH PeZUlbHOfi CHTj’aIlHB; 3MllHPHYeC-
me XowHumembx axxoMo&uuiH 06~~x0 ucnom3ym~cn AJM yToweHHp pacwra nepemca Macxm. B caywe CnoIHbIx reoMerpHl H nond wteHHn, xaparTepHbn n.an paccMaqiaaehwx CH~T~M Temonblx ~py6, npOHCXOJWT CyIlWCrBeHHOe OTXJlOHeHHe OT UlaCCli’teCRHX MOAeJIek &lX HCCJIeIIOBaHHl i&HYUHO-
HHPOBWUX HeCT83I.ViOHapHOii XiHAKOMeT an.miwcrroti Tennonok ~py6u n mianaaoee ~~SHM~B OT Haqa-
JIbHOrO (3anyCXa) A0 yCTaHOBHBIIIemcX COCTaBneHa QOrpaMMa “THROHPm”, OuHCaHHe KOTOpOfi
LWHO B PHee OIQ’6JIHKOBaHHblX @OTaX. B HaCTOXUeM HCCJleLIOBaHHH 3Ta IlpOrpaMMa HCnOJIb3yeTCr
MS OueHXE BJIH- BbI6Op aLXOMOlUlIJJiOHHbIX LO3@@HLlJieHTOB HCllaIle2lHX H LOIiJIeHCauHH Ha BMY-
BFlTHOCTb MOlWJleii HeCTarulOHapHOfi WJIKOM~~H’I~KOii TeIIJlOB0i-i rpy6u. &KWIeHO CpSABHeHHe C 3KCne&ulMCHTaJIbHbIbfH LWiHblMH &ilX XWlXOMeTaJUui’leCrOti TellJlOBOfi Tpj’6bL HailneMo, ST0 XapaKTe- PHCTEXH TeIlJIOBOfi TP)‘6bl MOlMO IlOCTaTOYHO TO’IHO PXCWTaTb B CJl)‘¶ae lIpaBHJlbHOr0 llOA6Opl4
KO~lWEeEITOB I1I(LOMOAauHH. nOWaIi0, ‘IT0 OQaHH~BaIOlIIHM @CTOpOM B IlPHHSTOfi MOIIeJlH SBJI-
ncTcn IuHpoKO HCUOJlb3yeMOe nonywemie 0 nocTomicTBe KO3@@iWieHTOB LLKKOMO~UHH B IIPOCT-