Deterministic and Probabilistic Serviceability Assessment ...

1
A semi-destructive tension method for evaluating the strength and
stiffness of clear wood zones of structural timber elements in-service
Ricardo D. Brites
ISISE, Department of Civil Engineering, University of Minho, Campus Azurem, 4800-058
Guimarães, Portugal
Paulo B. Lourenço
ISISE, Department of Civil Engineering, University of Minho, Campus Azurem, 4800-058
Guimarães, Portugal
J. Saporiti Machado
Timber Structures Division, National Laboratory for Civil Engineering, 1700-066 Lisboa,
Portugal
Corresponding author
email: [email protected]
Address: LNEC, Avenida do Brasil, 101, 1700-066 Lisboa, Portugal
Telephone: + 351 21 844 3299
Fax: +351 21 844 3071
Abstract
The paper presents a new semi destructive method for obtaining a prediction of the tension
parallel to the grain properties of clear wood of structural timber members. This method is less

2
intrusive than other existing methods and consists in extracting four small specimens along the
length of the timber members. The tension strength and stiffness obtained is intended to be used
as input data for the assessment of timber members in situ. Since the method only provides
information regarding clear wood, it will have to be used together with other non or semi-
destructive methods that could accommodate the effect of defects on the loss of clear wood
properties. The validation of the method was carried out by a comparison with results obtained
from a standard method used for determination of clear wood properties. The results show a
good agreement between stiffness values but a medium agreement in the case of tension strength.
Keywords: semi-destructive; assessment; timber; strength; stiffness; maritime pine; chestnut
1. Introduction
The assessment of the structural performance of existing timber structures is strongly dependent
on the capacity to evaluate in situ the physical and mechanical properties of timber elements.
Current in situ evaluation is made through the visual assessment of the quality of timber
elements (identifying the wood species and their features) having as reference a Visual Strength
Grading Standard (VSGS). This procedure leads to the allocation of characteristic strength
values or allowable stresses to the timber members. These values can then be modified taken into
consideration the load and moisture history of the structure and also its status of conservation
(biological and mechanical deterioration). This general process is followed by the Italian
standard UNI 11119 [1]. This same standard makes reference to a possible use of non-destructive
techniques (NDT) but it does not indicate the available NDT and in what way they could assist in
the definition of the mechanical properties of timber elements.

3
It is usually accepted that the application of VSGS and of structural design codes intended for
new constructions assures over conservative serviceability and safety confidence levels [2]. This
approach frequently leads to the demolition or to undertake heavy strengthening (often non-
reversible) of timber structures even in cases where no deterioration signals exists and the
structures are in service for more than 100 years. This result is critical for historic timber
structures where the safety concerns balance with the principle of the conservation of cultural
heritage.
The application of VSGS could also deliver unsafe characteristic values in some particular cases
(adoption of VSGS developed for other wood species or from wood species with a different
provenance) [3]. VSGS along with other available non-destructive methods evaluates the
strength and stiffness indirectly by using the correlation between parameters as sound time-of-
flight or knot’s dimension and the mechanical properties of timber.
A procedure for the prediction of the bending behaviour of timber in service using different non-
destructive methods was proposed [4]. This procedure applies the concept that assumes a timber
member as a heterogeneous element composed of clear wood and weak wood zones (defined by
the presence of knots) [5]. More recent results indicate the usefulness of having semi-destructive
methods that could validate the results obtained from the usual non-destructive methods[3].
The need to get more reliable data on the real strength capacity of timber elements was the basis
for the studies on semi-destructive or low–destructive methods carried out so far [6-9]. These
methods do not estimate but instead actually measure the strength and stiffness of wood by
destructive testing of small samples removed from the structural element.
Semi-destructive tests were developed for determining the Young’s Modulus and the
compression strength along the grain of clear wood [6, 8]. These methods use cylindrical wood

4
cores extracted from the timber elements. The samples are then subject to a diametric
compression along the grain. A coefficient of determination of 0.89 and 0.76 was obtained
between cylindrical specimens (cores) and ASTM standard clear wood specimens, respectively
for compression strength and modulus of elasticity parallel to the grain [6], respectively.
This method is relatively easy to perform using a drill-borer and does not affect the mechanical
behaviour of the element since it involves the extraction of a small amount of wood material.
However the method requires a careful adjustment of force and grain directions since any
slightly deviation can significantly affect the results obtained.
Other authors present a semi-destructive method to determine the tension behaviour of timber
elements [7, 9]. This method is based on the extraction of a small piece of wood by means of two
diagonal cuts along the grain of the timber element. As a result a prismatic specimen with 3 to 8
mm (side dimensions) is obtained. The ends of the specimen are glued to grooved wooden blocks
to reduced the effect of clamping and the specimen is tested in tension, being registered the
Young’s Modulus and the tension strength. The comparable cross-sectional area of the
semi-destructive specimen and the ASTM tension specimen led the authors to conclude that no
correction was necessary (assumed a unitary coefficient of determination). The application of
this method to structural timber members in service implies the use of a thin-kerf saw blade to
carry out the cuts along the grain. The weight of equipment and its operation in-situ are two of
the setbacks of this method. Also it is not easy to obtain a constant angle between parallel cuts,
necessary to get a prismatic section with a minimum removal of wooden material. Another
setback is the difficulty in coping with wood variability, since the cross-section of the test pieces
only includes a small proportion of the growth rings that exist in a structural timber cross-section
[10]. This setback could be minimized by extracting and testing more specimens. However the

5
size of the test pieces limits the number of pieces that could be extracted from the structural
members.
When comparing results from test pieces of different dimensions it should be taken into account
a possible size effect. The reduction of wood mechanical properties as wood element dimensions
increase supports the different studies that have been carried out on size effect [11]. Most of the
studies assume a weakest-link model, where rupture takes place at the weakest point along the
length of a test element. As the size of the wood element increases the probability of occurrence
of a weak point increases. This model seems suitable when considering the brittle behaviour of
wood subject to tension parallel to grain. Although the size effect have to be taken into account
when comparing results from small clear wood samples, the need to consider it for structural
dimension test pieces (containing knots and other gross defects) are not so clear [12].
The present paper presents a new semi-destructive method to assess the tension behaviour of
clear wood zones of structural members. The prediction capacity of this method is studied by
comparing the results from the new method with the results obtained from a standard test
method, used for the determination of the tension parallel to the grain properties of clear wood in
the laboratory. The hypothesis tested was that the results obtained using the average result of
four mesospecimen were not significantly different from the result obtained using a standard
specimen. The comparison study included two different wood species (one hardwood and one
softwood) commonly found in timber structures in Portugal.
The data obtained is intended to be used in combination with information provided by other non
and semi-destructive techniques for predicting the mechancial properties of timber structural
members in service [3].

6
2. Description of the semi-destructive tension method proposed
The method was developed having in mind:
getting direct information (destructive testing) about the strength and stiffness of clear wood
zones of structural timber members;
involving the extraction of small volumes of wood;
defining a simple and easy procedure to extract the wood sample on site.
Therefore it was devised a method based in the extraction of a small amount of wood material
from the arris of the element. The sample corresponds to a prismatic cross section (around 15 x
15 x 25 mm3) with 150 mm length. The amount of wood material corresponds to the presence of
wane within the limits generally accepted by VSGS (not reducing the width or thickness of the
timber element by more than 2/3 of the original dimensions).
The extraction is made using an electric jig saw. The wood sample is obtained by performing a
cut along the arris (between face and edge) of the timber element, Fig. 1. Compared with a
similar method [10] this procedure has the advantage of removing a smaller amount of material
and being easier to execute in situ.
The wood sample is then prepared to obtain a specimen with a shape analogous to that used in
tension tests of polymeric materials (dumb-shell-shaped) [13]. The modifications made to the
dimensions stated in EN ISO 527-2 [13] had in mind: the application of the strain gauge in the
middle of the element; the tension grips available; and the necessity to have grip areas long
enough to avoid slip and to reduce as much as possible the wood crushing at the jaws areas. The
nominal dimensions of the specimens are presented in Figure 2a). The small cross-section of the

7
specimens at the testing zone (uniform cross-section – 10 x 5 mm2) makes the test to be carried
out at growth ring’s scale. For this reason the specimens are thereafter called mesospecimens.
Regarding the representativeness of the test results two aspects should be taken into
consideration:
1. the method only represents the tension properties of the external layer of the timber
members at a particular location in the beam. To deal with the lengthwise variation of
properties it is proposed that at least four mesospecimen should be taken from a beam.
Regarding the variation in the cross-section this should be checked by using other semi-
destructive methods (e.g. drilling resistance or extraction of wood cores);
2. The method only gives information about the tension properties of clear wood zones.
Therefore this method is not intended to be used as a standalone method but instead to be
used in combination with information obtained from other non or semi destructive
methods [3, 4]. Namely, the prediction of the global behaviour of these members has to
consider not only the clear wood properties but also, and often predominately in the case
of strength, the information obtained from the visual appraisal of defects (knots, slope of
grain, etc.).
2. Experimental work
2.1 Materials
The comparison of the application of the meso and standard specimens was made using two
different wood species, a softwood and a hardwood. Maritime pine (Pinus pinaster Ait.) is the
major source of wood raw material in Portugal [14]. This species has been mainly used in timber

8
structures found in the central and south part of Portugal. Chestnut (Castanea sativa Mill.) is
usually found in old timber structures located in the north of Portugal.
From each wood species twenty-five timber planks were collected from the sawnmill. In each
plank one standard specimen and four mesospecimens were obtained. The mesospecimens were
obtained by extracting wood samples along the four arris (between face and edge) of the timber
plank. Afterwards a standard specimen was cut close to the surface of the plank and as close as
possible from the location of the mesospecimens.
An ordinary electric jig saw machine oriented at 45º was used, with the steel base fully supported
in the surface of the member in order to assure a stable cutting process. The extracted prismatic
piece was then prepared to obtain a regular shaped specimen.
The standard clear wood specimen for tension parallel to the grain was prepared following the
dimensions and geometry proposed by the Brazilian standard NBr 7190 [15], Fig. 2b).
Before performing the mechanical tests all specimens were placed in a climatic room (20 ºC
2 ºC temperature and 65 % 5 % relative humidity) until a variation of weight inferior to 0.1 %
in a interval of six hours was observed.
2.2. Tension tests
Tension tests were carried out using a Shimadzu mechanical universal testing machine equipped
with a load cell of 250 kN capable of measuring the load applied with an accuracy of 1 %. The
grips consisted of mechanical wedge-shaped jaws providing an automatic increase of the
clamping pressure as the longitudinal tension load increases. One MFA 25 extensometer with an
accuracy of 0.5 % were used for measuring the strain in the central segment (uniform cross-
section) of the specimens, gauge length of 50 mm. Fig. 3 and Fig. 4 show some details of meso
and standard specimens under tension testing, respectively.

9
The tension tests were carried out under deformation-control at a rate of 1.50 mm/min for the
mesospecimens and 4.00 mm/min for the standard specimens. The deformation rate was adjusted
so that rupture took place in the interval 300 120 [16]. The tests were conducted inside a
conditioning room showing the same standard environment used for conditioning the test pieces.
Therefore no adjustment for moisture content was applied to the tension results [17].
For each specimen the tension strength (ft,0) and the modulus of elasticity parallel to the grain
(Et,0) was obtained. The Et,0 was determined according with EN 408 [16] by applying a
regression curve to the load/deformation curve between the 10% and 40% of the maximum load.
2.3. Data analysis
Regression analysis was carried out using the software STATISTICA [18]. The fitting of
Lognormal cumulative distribution functions to tension strength and modulus of elasticity was
achieved using the package Distribution Fitting Tool from MATLAB [19]. Lognormal
distribution function was adopted for these two wood properties based in the probabilistic model
code proposed by the Joint Committee for Structural Safety (JCSS) [20]. The goodness-of-fit of
the curves was assessed using the Anderson-Darling test. This test was chosen since, by
comparison with other test as the Kolmogorov-Smirnov test, it is fitted to compare small samples
and also is more sensitive to tails.
The evaluation of the significance of the coefficients of determination (r2) followed the principle
adopted by the Joint Committee on Structural Safety [20] for the coefficient of correlation (r):
0.8 r (High); 0.6 r < 0.8 (Medium); 0.4 r < 0.6 (Low); 0.2 r < 0.4 (Very low) and; 0.0 r
< 0.2 (No correlation).

10
For testing the null hypothesis that a certain number of regression curves are coincident, i.e. all
the regression (b) and interception (a) parameters of the regression curves xbay are
identical, it was used the statistic shown in Eq. 1 [21].
p
p
pt
2
DF
SS
SSSS
F
(1)
In Eq. 1 SS represents the regression residual sum of squares, DF the degrees of freedom and
indices p and t the “pooled regression” and “total regression”, respectively.
3. Results and Discussion
3.1 Failure modes
Clear wood under tension parallel to grain presents four different failure modes [22] illustrated in
Fig. 5 (types a to d). A tension failure at or in vicinity of the jaws is also frequent and is mention
in the present paper as failure mode (e).
Fig. 6 compares the different types and distribution of failure modes observed in standard and
mesospecimens, for the two different wood species tested. The results show a significant
increase of the percentage of failures at or in the close vicinity of the jaws for the meso as
compared with the standard specimens. These failures are mostly due to a moderate wood
crushing under the jaws faces.
3.2 Representativeness of the sample
The capacity of a mesospecimen to predict clear wood tension properties (considering as
reference the testing result from a standard specimen) can be affected by the significant
difference in cross section dimensions of the two types of specimens. The different volume of
material (number of growth rings) under testing can affect the representativeness of the results

11
provided by the mesospecimens, Fig. 7. This bias could be estimate by evaluating the number of
latewood rings (pine) or the number of earlywood rings (chestnut) included in the cross section
of both types of specimens. The choice of growth rings in each species is based on the fact that
differences observed in the growth ring’s width, and therefore density, are related with variations
in the width of earlywood (pine) or latewood (chestnut) rings [23].
For maritime pine a modulus of elasticity in tension parallel to the fibers a ratio
earlywood/latewood of 0.82 and 0.49, for a “cambial age” of 2 to 4 years and an age of 8 to 10
years, respectively, can be observed [24]. From these results it can be expect, for mature wood,
that latewood could show a modulus of elasticity double of the one presented by earlywood. For
chestnut the earlywood volume of ring-porous hardwoods has a relatively high proportion of
vessels with a minimum contribution to the mechanical strength and stiffness of wood material.
Therefore at the meso scale (growth ring) the results are more sensible to the variation between
earlywood and latewood properties.
Fig. 7 shows the comparison between the number of rings (latewood in the case of pine and
earlywood in the case of chestnut) contained in a standard and in a mesospecimen.
The mesospecimens shown on average three latewood rings in the case of pine and one
earlywood ring in the case of chestnut whereas the standard specimens shows an average of
fourteen and seven, respectively. These differences represent a volume (representativeness)
effect. To compensate this effect it was extracted from each plank four meso and their average
tension strength and stiffness compared with the result obtained from one standard specimen
(ratio 4:1).
3.3. Results for maritime pine wood

12
An overview of the experimental results obtained for maritime pine wood is presented in Table
1. The results from mesospecimens are presented considering: all the individual results obtained
from all twenty-five planks (global set of one hundred pieces tested); and considering only the
cluster of the average values corresponding to the four mesospecimens tested per plank.
Regarding modulus of elasticity the results obtained with the mesospecimens are very similar
with the ones obtained from the standard specimens. A slight improvement, less variability, was
achieved by taking into consideration the average of the four mesospecimens extracted from
each timber plank. The similar mean value and variability between meso and standard specimens
support the use of four mesospecimens for predicting the modulus of elasticity of clear wood
zones of maritime pine timber.
The mesospecimens show however a significantly higher mean strength value than the standard
specimen. This can be the result of a size effect; higher volume of wood increases the probability
that a weak point (defect), not detectable at the naked eye, could exist, with direct influence on
the ultimate load capacity of the specimen. The significant difference between mean tension
strength values for the two different types of specimens (meso and standard), Table 1, indicates
that some precautions should be taken when using the results from mesospecimens.
Fig. 9 shows the Lognormal cumulative probability curves fitted to tension strength and modulus
of elasticity results. The Anderson-Darling tests did not reject the fitting of the Lognormal
distribution (p-value > 0.05) to all the curves.
Table 2 presents the characteristic values (5 percentile) using the Lognormal distribution. A 1.11
modulus of elasticity ratio between meso/standard characteristic values was obtained being the
same ratio for tension strength of 1.49. These ratios reveal an eleven and forty-nine percent
deviation between the characteristic values obtained using the meso and the standard specimens

13
for the modulus of elasticity and the tension strength, respectively. Regarding the mean value it
should be stressed the significant low ratio (1.02) observed for modulus of elasticity.
The correlations between the standard specimens and the average of the four mesospecimens
taken from each test piece are presented in Fig. 10. This figure indicates a medium correlation (r2
= 0.53) for modulus of elasticity, superior to the low correlation obtained for tension strength (r2
= 0.25).
The coefficients of determination now achieved are significantly lower if compared with results
obtained using wood core specimens in compression [6]. However a direct comparison could not
be done since a different stress mode was involved compression and also the regression included
five different wood species, enlarging in this way the range of stiffness and strength values
which tends to have a positive impact in terms of coefficient of correlation (or determination).
In the present case the significant value of the intercept coefficient in the regression curves
shows the need to consider the correction of the mesospecimens results using the conversion
equations given in Fig 10.
3.4. Results for chestnut wood
The results for chestnut wood specimens are presented in the same manner as for maritime pine
specimens. In general the results obtained for chestnut follows the same pattern already observed
for maritime pine wood specimens, Table 3. The modulus of elasticity is similar for the two
types of specimens but a significant higher rupture value is once more observed for the
mesospecimens as was already observed in the case of maritime pine specimens.
The coefficients of variation are larger than the ones observed for maritime pine. However, and
once more, the variability between the results obtained for meso and standard specimens are
similar. Also by taking for each test piece the average of the results obtained for the four

14
mesospecimens a very slight improvement is observed in terms of variability (lower coefficient
of variation).
From the fitted Lognormal distribution the characteristic values (five percentile) were
determined, Table 4. The Anderson-Darling tests did not reject the fitting of the Lognormal
distribution (p-value > 0.05) to all the curves. A 0.95 modulus of elasticity ratio between
meso/standard characteristic values was obtained, a better relationship than the one found for
maritime pine wood specimens. As regards strength the ratio increases to 1.22, but clearly lower
than the one found for maritime pine.
In terms of correlation between meso and standard specimens, the results are clearly superior to
the ones obtained for maritime pine wood. These results can be due probably to the increase of
variability already mentioned. A high correlation (r2 = 0.67) was achieved in the case of the
modulus of elasticity, Fig. 12(b). A considerable lower correlation was obtained for tension
strength (r2 = 0.45), Fig. 12(a). This last result is clearly superior to the one obtained for
maritime pine wood (r2 = 0.25), Fig. 10(a).
These results confirm the conclusions of the regression analysis carried out for maritime pine.
The mesospecimens can therefore be used for assessing the modulus of elasticity of clear wood
zones. As concerns tension strength some precaution should be taken.
3.5. Combining maritime pine and chestnut wood results
Though maritime pine and chestnut are the wood species most often found in historic timber
structures in Portugal, other species (e.g. Pinus palustris Miller, Quercus sp., Pinus strobus L.)
can also be found. With the purpose of assessing the possibility of extrapolating the results
obtained to other wood species, the effect of combining in a same sample the results from pine
and chestnut was analysed. The importance of establishing the existence of a general regression

15
curve, applicable to several wood species, is related with the fact that is not feasible to verify the
concomitance between standard and mesospecimens results for all possible wood species. Also it
is not feasible to extract standard specimens from structural elements in situ for making local
verifications.
Before merging the results of the two wood species, a test for verifying the equality of the
regression curves, obtained for pine and chestnut, was carried out using the statistic shown in Eq.
1.
The application of the statistical test resulted in a F value equal to 5.558 which rejects the null
hypothesis of coincidental regressions at a significance level of 5% but accepts at the level of
1%. Considering this result the merging of the two wood species results was done. As expected it
was observed an increase of the correlation between meso and standard specimens, both in terms
of strength and modulus of elasticity. Concerning modulus of elasticity, the high coefficient of
determination considering the two species as one sample (r2 = 0.75) is superior to those obtained
for maritime pine (r2 = 0.53) and chestnut wood (r2 = 0.67) alone. For tension strength the
coefficient of determination is also higher (r2=0.50) than the ones obtained for each wood species
individually (maritime pine – 0.25 ; chestnut – 0.45) and can be now classified as medium.
4. Conclusions
A new semi-destructive method for assisting in the definition of the mechanical properties of
timber structural elements in-service is presented and discussed. The method is based on the
testing of small tension specimens called mesospecimens. The mesospecimen method is not
intended to be used as a standalone method, namely additional information to clear wood
properties shall be provided regarding the presence of defects (knots, slope of grain, etc.) and the
level of conservation of the timber elements.

16
For testing the reliability of this new method a comparison was carried out between the results of
mesospecimens and the results from standard specimens normally used to determine the clear
wood tension parallel to the grain properties. The regression curves obtained for modulus of
elasticity show a coefficient of determination of 0.53 and 0.67 for maritime pine and chestnut,
respectively. These result show that the new method can help, combine with other method (e.g.
ultrasounds), on the prediction of the modulus of elasticity of clear wood zones of structural
timber members. However some limitations exist in the assessment of the tension strength. The
regression curves show a coefficient of determination of 0.25 and 0.45 for maritime pine and
chestnut, respectively. Improvement of piece geometry and/or grip conditions will be evaluated
in future works in order to reduce the number of mesospecimens showing failure at or in the
close vicinity of the grips.
The possible extrapolation to other wood species led to combine the result obtained for maritime
pine and chestnut. The combine regression curve shows an increased of the coefficient of
determination (0.50 and 0.75 for tension strength and modulus of elasticity, respectively).
5. Acknowledgments
The authors acknowledge the support given by the Fundação para a Ciência e a Tecnologia
(FCT) for the PhD Grant SFRH/BD/27353/2006, as well as for the research Project “Safety
evaluation of timber structures by means of non-destructive tests and stochastic analysis”
(FCT PTDC/ECM/66527/2006).
References
[1] UNI 11119:2004. Cultural Heritage. Wooden artefacts. Load-bearing structures - On site
inspections for the diagnosis of timber members. Ente Nazionale Italiano di Unificazione.

17
[2] Piazza M, Riggio M. Visual strength-grading and NDT of timber in traditional structures.
Journal of Building Appraisal 2008; 3:267-296.
[3] Machado J S, Lourenço P B, Palma P. Assessment of the structural properties of timber
members in situ – a probabilistic approach. In: SHATIS’11 International Conference on
Structural Health Assessment of Timber Structures, Lisbon, Portugal; 2011.
[4] Machado J S, Palma P. Non-destructive evaluation of the bending behaviour of in-service
pine timber structural elements. Materials and Structures; 44: 901-910.
[5] Riberholt H, Madesn P H. Strength distribution of timber structures. Measured variation of
the cross sectional strength of structural lumber. Technical University of Denmark, Report R
114. 1979
[6] Kasal B. Semi-destructive method for in-situ evaluation of compressive strength of wood
structural members. Forest Products Journal 2003;53:55-58.
[7] Minster J, Drdácký M, Jirovský I, Kloiber M, Micka M, Slízková Z., Václavík P. Diagnostic
techniques to assess mechanical characteristics of historical timber. In: Heritage, weathering &
conservation, Madrid: Fort, M Alvarez de uergo, M. Gomez-Heras & C. Vazquez-Calvo Ed.,
Taylor & Francis Group; 2006, p. 667-773.
[8] Rug W, Seemann A. Strength of old timber. Building Research and Information 1991;
19:31-37.
[9] Kasal B, Anthony R. Advances in situ evaluation of timber structures. Progress in Structural
Engineering and Materials 2004; 27:94–103.
[10] Kasal B. Tension micro-specimen. In In situ assessment of structural timber. Rilem State of
the Art Reports. Springer. Ed. Bohumil Kasal and Thomas Tannert. 2010.

18
[11] Barrett J D, Lam F, Lau W. Size effect in visually graded softwood structural lumber.
Journal of Materials in Civil Engineering (1995) 7:19-30.
[12] Burger N, Glos P. Effect of size on tensile strength of timber. In International Council for
Building Research Studies and Documentation – Working Commission W18 – Timber
Structures. 1996. Paper CIB-W18/29-6-1.
[13] EN ISO 527-2: 1996. Plastics – Determination of tension properties – Part 2: Test
conditions for moulding and extrusion plastics. European Committee for Standardisation.
[14] Cruz H, Lina L, Machado J S. Update assessment of portuguese maritime pine timber.
Forest Product Journal 1998;48:60-64.
[15] NBr 7190:1997. Projeto de estruturas de madeira. ABNT – Associação Brasileira de
Normas Técnicas. Rio de Janeiro, Brasil.
[16] EN 408:2003. Timber structures – Structural timber and glued laminated timber –
Determination of some physical and mechanical properties. European Committee for
Standardization.
[17] EN 384:2010. Structural timber – Determination of characteristic values of mechanical
properties and density. European Committee for Standardization.
[18] StatSoft, Inc. (2011) STATISTICA - data analysis software system. version 10. 2011.
[19] MathWorks, Inc. (2010). MATLAB – The language of Technical Computing. version
R2010a.
[20] Joint Committee on Structural Safety. Probabilistic model code. Part 3.5 – Timber. ISBN
978-3-909386-79-6. www.jcss.ethz.ch/publications_pmc.html (2011-10-20).
[21] Zar J H. Biostatistical analysis. Prentice-Hall, Inc; 1996.

19
[22] Bodig J, Jayne B A. Mechanics of wood and wood composites. Ed. Krieger Publishing
Company; 1993.
[23] Zobel B J, Buijtenen J P van. Wood variation. Its causes and control. Ed. Springer-Verlag;
1989.
[24] Castéra P, Nepveu G, Chantre G. Principaux facteurs de contrôle de la variabilité du bois
chez le Pin maritime (Pinus pinaster Ait.). In: De la forêt cultivée a l’industrie de demain.
Propriétés et usages du pin maritime. Actes du Vème Colloque. ARBORA – Association pour la
recherche sur la production forestière et le bois en région Aquitaine; 1999, p. 91-101.

Table 1 Results for maritime pine tests. Et,0 and ft,0 stands for modulus of elasticity and tension strength (respectively) in tension parallel to the grain.
Specimen type Property Mean value
[N/mm2]
Standard deviation [N/mm2]
(Coef. of variation [%])
Sample size
Standard specimens ft,0 66.9 15.7 (24%) 25 Et,0 15038 3484 (23%) 25
Mesospecimens (considering all the results)
ft,0 92.3 21.8 (24%) 100 Et,0 15346 3953 (26% 100
Mesospecimens (average of four)
ft,0 92.3 16.9 (18%) 25 Et,0 15346 3065 (20%) 25
Table 2 Meso/standard relationships for maritime pine wood
Parameter Test Mean value
[N/mm2] Characteristic value
[N/mm2] Meso/Standard
Mean Characteristic
Modulus of elasticity, Et,0
Meso 15346 10415 1.02 1.11
Standard 15038 9418
Tension strength, ft,0 Meso 92.3 67.2
1.38 1.49 Standard 66.9 45.2
Table 3 Results for chestnut wood tests. Et,0 and ft,0 stands for modulus of elasticity and tension strength (respectively) in tension parallel to the grain.
Specimen type Property Mean value
[N/mm2]
Standard deviation [N/mm2]
(Coef. of variation [%])
Sample size
Standard specimens ft,0 49.8 16.1 (32%) 25 Et,0 9817 3475 (35%) 25
Mesospecimens (considering all the results)
ft,0 60.9 22.3 (37%) 100 Et,0 9338 9338 (36%) 100
Mesospecimens (average of four per set)
ft,0 60.9 20.6 (34%) 25 Et,0 9338 3232 (35%) 25
Table 4 Meso/Standard relationships for chestnut wood
Parameter Test Mean value
[N/mm2] Characteristic value
[N/mm2] Meso/Standard
Mean Characteristic
Modulus of elasticity, Et,0
Meso 9338 4697 0.95 0.95
Standard 9817 4959
Tension strength, ft,0 Meso 60.9 30.3
1.22 1.22 Standard 49.8 24.9

Fig. 1. Method of extraction of the mesospecimen, from left to right: cut of the face-edge corner with a jigsaw, the obtained triangular prism specimen and final arrangements to reach the desired shape
Fig. 2. Nominal dimensions (in mm) of the mesospecimen (a) and standard specimen (b)
Fig. 3. Details regarding the testing of mesospecimens; a) setup; b) rupture

Fig. 4. Details regarding the testing of standard clear pine wood specimens; a) setup; b) rupture
Fig. 5. Type of tensile failures observed in chestnut specimens. (a) splintering tension; (b) combined tension and shear; (c) shear; (d) brittle tension; (e) at the vicinity of the jaws
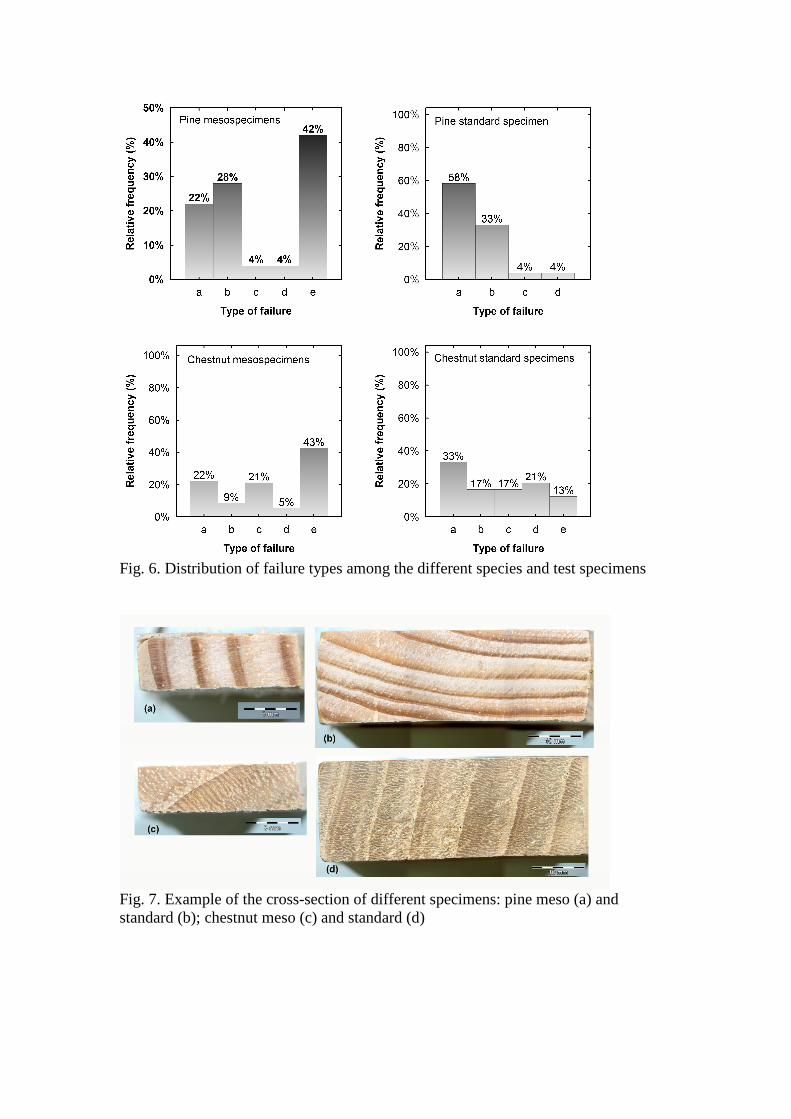
Fig. 6. Distribution of failure types among the different species and test specimens
Fig. 7. Example of the cross-section of different specimens: pine meso (a) and standard (b); chestnut meso (c) and standard (d)

Fig. 8. Histogram showing the number of latewood (pine) and earlywood (chestnut) rings present in each type of specimen tested (meso and standard)
Fig. 9. Fitted Lognormal cumulative probability function for (a) tensile strength and (b) modulus of elasticity (solid line – mesospecimens; dashed line – standard specimens). Fade lines corresponds to 95% confidence intervals

Fig. 10. Regression curves for maritime pine test specimens (a) tensile strength; (b) modulus of elasticity
Fig. 11. Fitted Lognormal cumulative probability function for (a) tensile strength and (b) modulus of elasticity (solid line – mesospecimens; dashed line – standard specimens). Fade lines corresponds to 95% confidence intervals
Fig. 12. Regression curves for chestnut wood test specimens: (a) tensile strength; (b) modulus of elasticity

Fig. 13. Regression curve for maritime pine and chestnut test specimens: (a) tensile strength and (b) modulus of elasticity