A Semantic Network Model for Measuring Engagement and ... et al_CAE2018.pdf · A Semantic Network...
21
1 A Semantic Network Model for Measuring Engagement and Performance in Online Learning Platforms 1 Sunghoon Lim 1 , Conrad S. Tucker 2,1 , Kathryn Jablokow 3,2 , Bart Pursel 4 1. Department of Industrial and Manufacturing Engineering, The Pennsylvania State University, University Park, PA 16802, USA 2. School of Engineering Design, Technology, and Professional Programs, The Pennsylvania State University, University Park, PA 16802, USA 3. School of Graduate Professional Studies, The Pennsylvania State University, Malvern, PA 19355, USA 4. College of Information Sciences and Technology, The Pennsylvania State University, University Park, PA 16802, USA Correspondence to: Conrad S. Tucker (E-mail: [email protected]) 1. INTRODUCTION Online learning platforms are widely used in engineering education because of their scalability (i.e., fewer physical limitations) and accessibility (i.e., improvements in internet connectivity) [1,2]. For example, cyberinfrastructure tools and technologies are currently applied to engineering education and 1 Best Paper Award: 2017 ASME IDETC/CIE Design Education (DEC); Conference Version: DETC2017- 67339 ABSTRACT Due to the increasing global availability of the internet, online learning platforms such as Massive Open Online Courses (MOOCs), have become a new paradigm for distance learning in engineering education. While interactions between instructors and students are readily observable in a physical classroom environment, monitoring student engagement is challenging in MOOCs. Monitoring student engagement and measuring its impact on student performance are important for MOOC instructors, who are focused on improving the quality of their courses. The authors of this work present a semantic network model for measuring the different word associations between instructors and students in order to measure student engagement in MOOCs. Correlation analysis is then performed for identifying how student engagement in MOOCs affect student performance. Real-world MOOC transcripts and MOOC discussion forum data are used to evaluate the effectiveness of this research. KEYWORDS: (MOOC, discussion forums, student engagement, semantic network, correlation analysis)
Transcript of A Semantic Network Model for Measuring Engagement and ... et al_CAE2018.pdf · A Semantic Network...

1
A Semantic Network Model for Measuring Engagement and Performance in Online Learning Platforms1
Sunghoon Lim1, Conrad S. Tucker2,1, Kathryn Jablokow3,2, Bart Pursel4
1. Department of Industrial and Manufacturing Engineering, The Pennsylvania State University,
University Park, PA 16802, USA
2. School of Engineering Design, Technology, and Professional Programs, The Pennsylvania State
University, University Park, PA 16802, USA
3. School of Graduate Professional Studies, The Pennsylvania State University, Malvern, PA 19355, USA
4. College of Information Sciences and Technology, The Pennsylvania State University, University Park,
PA 16802, USA
Correspondence to: Conrad S. Tucker (E-mail: [email protected])
1. INTRODUCTION
Online learning platforms are widely used in engineering education because of their scalability
(i.e., fewer physical limitations) and accessibility (i.e., improvements in internet connectivity) [1,2]. For
example, cyberinfrastructure tools and technologies are currently applied to engineering education and
1 Best Paper Award: 2017 ASME IDETC/CIE Design Education (DEC); Conference Version: DETC2017-
67339
ABSTRACT
Due to the increasing global availability of the internet, online learning platforms such as Massive
Open Online Courses (MOOCs), have become a new paradigm for distance learning in engineering
education. While interactions between instructors and students are readily observable in a physical
classroom environment, monitoring student engagement is challenging in MOOCs. Monitoring student
engagement and measuring its impact on student performance are important for MOOC instructors,
who are focused on improving the quality of their courses. The authors of this work present a semantic
network model for measuring the different word associations between instructors and students in
order to measure student engagement in MOOCs. Correlation analysis is then performed for
identifying how student engagement in MOOCs affect student performance. Real-world MOOC
transcripts and MOOC discussion forum data are used to evaluate the effectiveness of this research.
KEYWORDS: (MOOC, discussion forums, student engagement, semantic network, correlation analysis)

2
student learning. Recently, web-based platforms for communicating between educators and students [3]
and IT-enabled remote laboratories [4] are used for online learning. Massive Open Online Courses
(MOOCs) expand on the scope and scale of traditional online learning systems by enabling tens or at times,
hundreds of thousands of individuals across the world, to connect to a common course or platform [5].
As the scale and scope of MOOCs expand, so do the challenges of maintaining the quality of learning and
understanding that takes place within these MOOC platforms.
A MOOC instructor’s objective is to maximize student performance (i.e., learning outcomes). Even
though students enrolled in MOOCs can communicate with instructors or other students through MOOC
discussion forums or email messages, less face-to-face interactions between instructors and students
make it hard to ensure that students stay on track through an entire course. Despite the increasing
popularity of MOOCs, it is challenging to keep students motivated to learn and stay engaged in the course,
especially when they lose interest in the course content. An instructor may assume that his/her students
are interested and engaged in the course content in the manner intended, but if that instructor does not
receive direct feedback from students, it will be difficult to confirm his/her assumption [6]. A lack of direct
feedback from students affects the instructor’s ability to improve his/her lecture content structure and
motivate students to learn. It is essential for instructors to measure and interpret student-course content
interactions, because students learn better when they discuss course content with instructors or other
enrolled students. It has been shown that low student-course content interactions, negatively affects
student performance [7].
This research introduces a semantic network model in order to investigate the different word
associations between (1) course content and (2) student discussions, which indicate student engagement
in MOOCs. Correlation analysis is then performed in order to identify how the different word associations
between course content and student-discussed content (i.e., student disengagement) affect student
performance, such as (1) students’ average assignment scores and (2) the number of submitted

3
assignments. A real-world case study involving MOOC transcripts and MOOC discussion forum data (i.e.,
posts and comments written in MOOC forums) validates the proposed research. In this research, a post
and a comment are defined as a new discussion thread and a response related to a given post written in
MOOC discussion forums, respectively.
This research will help instructors classify (1) the content that interest and engage students in the
course and (2) the content that result in lower course retention (i.e., disengagement), while the course is
going on. It is also expected that this work will support MOOC instructors as well as MOOC providers in
developing intervention mechanisms that improve student performance in MOOC platforms.
The remainder of this paper is organized as follows. Section 2 describes the background and work
related to the research, while Section 3 outlines the proposed research. Section 4 presents a case study
that demonstrates the feasibility of this research. The results of the case study are discussed in Section 5.
Finally, Section 6 provides conclusions and directions for future research.
2. BACKGROUND AND RELATED WORK
2.1. MOOC Content Structure
Although the structure of MOOCs may differ across course offerings, they can be categorized
based on their design intent and course content structure [8,9]. One of the earliest MOOCs,
Connectivism and Connective Knowledge by Siemens and Downes [10], was intentionally designed to be
a very social experience, allowing learners to leverage a wide variety of technologies to connect with
each other and drive their own learning through discovery and discussion. This category of MOOCs is
often called a connectivist MOOC or cMOOC. These cMOOCs focus on knowledge co-creation by
harnessing the power of social media and interaction with peers, adopting a connectivist learning
approach in which students’ creativity, autonomy, and networking are encouraged [11]. In cMOOCs,
students are expected to add to and enrich the course content.
4
In contrast, some MOOCs are organized similarly to Stanford University’s Introduction to
Artificial Intelligence MOOC. This course focuses more on one-way dissemination of content or an
instructivist approach to learning. As more universities began to offer MOOCs, many followed Stanford’s
approach, which was categorized later as an xMOOC [12]. These xMOOCs focus on more traditional
interaction with fixed content, centralized discussion forums, and automated or peer-graded evaluation,
adopting a behaviorist learning approach. Students are expected to master what they are taught
without adding substantially to the course content. In the end, defining a dichotomy of “cMOOCs” and
“xMOOCs” may be overly simplistic, since many MOOCs offered today include elements of both –
including the MOOC that serves as a case study for this article.
2.2. Mining Educational Textual Data
Mining educational textual data is an active research area that employs data mining methods with
educational data to understand student learning and performance [13]. Mostow et al. present an
intelligent tutoring system to browse the interactions between a tutor and students with MySQL
databases [14]. Sacin et al. develop a student decision support system that helps students plan their
academic itinerary (e.g., courses, classrooms, and instructors) using data mining methods [15]. Natek and
Zwilling present data mining techniques for small student datasets to predict the success rate of students
enrolled in their courses, since relatively small data sets are normal in educational environment [16].
Recently, text mining methods, including both unsupervised and supervised machine learning
techniques, have been widely employed in the education system [17]. The objective of unsupervised
machine learning algorithms, such as clustering, is to discover natural patterns with unlabeled data (e.g.,
the discovery of the clusters of students that share similarity in their learning styles). On the other hand,
the objective of supervised machine learning techniques is to predict class variables with a set of attributes
[18]. For example, Kelly and Tangney present a system to predict the learning styles of students using a

5
Naïve Bayesian machine learning algorithm [19]. Hsia et al. analyze the course preferences and course
completion rates of enrolled students using decision trees, link analysis, and decision forest [20]. Perera
et al. develop a better understanding of group behavior by mining educational data in online virtual
environments [21]. Şen et al. predict education placement test results to understand the internal structure
of placement tests and develop more effective assessment tools using artificial neural networks, support
vector machines, decision trees, and logistic regression [22].
2.3. Understanding Student Behavior and Feedback in MOOCs
MOOCs are a relatively new development that has gained significant interest in the educational
research community. MOOCs provide free access to knowledge for everyone with a reliable internet
connection, regardless of geographic, demographic, or economic constraints [23,24]. One limitation in
MOOCs is a limited use of integrating meaningful, frequent, and synchronous face-to-face interactions
between instructors and students. MOOC instructors more likely rely on textual information, such as
students’ reviews written in MOOC discussion forums, which is unlike synchronous interactions between
instructors and students in a traditional classroom, where facial and body expressions can convey
student feedback on course content. Measuring student textual feedback has the potential to help
MOOC instructors, who more likely rely on student textual feedback rather than face-to-face
interactions, to learn about student learning and performance [6].
Student behavior and performance in solving problems in MOOCs may differ from those in on-
campus education settings, since MOOCs have course formats that differ from traditional education
systems [25]. Margaryan et al. propose a systematic analysis of MOOCs’ instructional design quality
using a course survey instrument [26]. Recently, the relationships among the social, teaching, and
cognitive elements, online satisfaction, and academic achievement in online learning environments are

6
investigated [27]. Research models and case studies are presented to identify the factors that enhance
the effectiveness and sustainability of MOOCs [28,29].
Recently, new metrics have been proposed for measuring the impact of MOOCs, such as the
Distributed Intelligence Framework [30]. The Distributed Intelligence Framework considers students’
intentions, because some students can complete the course without their intentions in a MOOC
environment. Investigating MOOC forums and course-based social networks is a useful option for
analyzing students’ intentions, since the forums and social networks provide a venue for numerous
students to share opinions on a common subject [31,32]. Most analyses on MOOC discussion forums
and course-based social networks are related to the frequency of use and student responses to surveys
about their experiences in the forums and social networks. Mackness et al. discover that the openness
of the forums can cause negative experiences for students and discourage them from participating in
the forums, since they can be overcome by the number of posts, comments, and trolls [33]. Breslow et
al. discover that the surveys are more frequently used than homework assignments and lecture videos
as resources for measuring the impact of MOOCs [34].
Reich et al. explore student-generated text in MOOCs that uncovers variations in patterns across
covariates [35]. This type of analysis, if it can be achieved in real-time, can provide important feedback
for instructors and the MOOC design team to make important pedagogical decisions and to take course
corrections. Joksimović et al. also examine social media interactions associated with MOOCs, in order to
better understand topics of discussion by learners [36]. One of the research questions directly examines
the extent by which the readings suggested by the course instructors were similar to the topics of
discussion by students on social media. They discover that conversations about content early in MOOCs
often continue throughout the duration of the course; learner discussion on social media does not
necessarily follow new themes introduced by the instructor later in the course.
7
While understanding student behavior and feedback in MOOCs is an active research area,
considerations on understanding how student engagement affects course performance are still limited.
Comprehending how student engagement affects student performance is important for transforming
the learning experience from being a passive consumption-based system to a dynamic system based on
instructor-student interactions and improving the quality of MOOCs.
3. MATERIAL AND METHODS
Figure 1 presents an overview of the method. First, textual data are retrieved from (1) MOOC
transcriptions, which are comprised of lecture notes, lecture manuscripts, and video lecture
transcriptions in MOOCs, and (2) student textual feedback written in MOOC discussion forums. Semantic
graphs are then provided to visualize word associations in MOOC transcriptions and student textual
feedback, respectively. A semantic network analysis model is then presented to measure the different
word associations between MOOC transcriptions and student textual feedback. Finally, correlation
analysis is performed to understand how the different word associations (i.e., student disengagement in
MOOCs) affect student performance (e.g., students’ average scores, the number of assignment
submissions, etc.).
[Insert Figure 1]
3.1. Data Extraction and Data Preprocessing
(1) MOOC transcriptions and (2) student textual feedback data from MOOC discussion forums
are used in this research. MOOC transcriptions include lecture notes created by the instructors,
manuscripts, and transcriptions extracted from video lectures. Student textual feedback data include
8
students’ dialogue about the lectures and course activities (e.g., posts and comments written in MOOC
discussion forums).
Raw textual data, such as video lecture transcriptions, posts, and comments in MOOC discussion
forums, are full of noise that causes unexpected results. In this work, data preprocessing is therefore
employed to remove noise within the data. User ID, punctuation, and URLs, which are unnecessary for
semantic network analysis, are disregarded. Stop words (e.g., “are”, “to”, “in”), which would be
superfluous for semantic network analysis, are also removed [37]. Out-of-vocabulary (OOV) words, such
as typos (e.g., “bisiness” instead of “business”), single-word abbreviations (e.g., “luv” instead of “love”),
and phonetic substitutions (e.g., “2morrow” instead of “tomorrow”) are transformed to in-vocabulary
(IV) words using existing OOV word databases (e.g., Apache Lucene [38] and Spell Checker Oriented
Word Lists [39]). Stemming is implemented using the Porter stemming algorithm [40] in order to
improve result accuracy.
3.2. Term Frequency and Semantic Networks
In this research, (1) a term frequency and (2) semantic network model are employed for
comparing semantic structures between MOOC transcriptions and student textual feedback. Term
frequency is defined as the number of times that a term (i.e., one word in this method) occurs in a
document [41]. Term frequencies are counted based on the bag of words model (i.e., a text model that
only considers word multiplicity, while disregarding word order and grammar) [42].
A co-occurrence is a word interconnection based on their paired existence within a document
[43]. For example, the terms “trouble” and “assignment” co-occur in the sentence “I'm having trouble
uploading the file that contains my assignment.” Let w1i and w2i be the ith frequently used term, which is
not a stop word, in MOOC transcriptions and student textual feedback data, respectively. W1 and W2 are
a set of top t1 frequent terms in MOOC transcriptions and a set of top t2 frequent terms in student
9
feedback data in descending order, respectively, as seen in Eq. (1). Equation (2) shows the weighted
adjacency matrix A1 that expresses co-occurrence between top t1 frequent terms in MOOC
transcriptions [44].
𝑊1 = [𝑤11, 𝑤12, ⋯ , 𝑤1𝑘1−1, 𝑤1𝑘1],𝑊2 = [𝑤21, 𝑤22, ⋯ , 𝑤2𝑘2−1, 𝑤2𝑘2
] (1)
𝐴1 =
[
− 𝑜112 𝑜113 ⋯ 𝑜11𝑡1
𝑜121 − 𝑜123 ⋯ 𝑜12𝑡1
𝑜131 𝑜132 − ⋯ 𝑜13𝑡1
⋯ ⋯ ⋯ − ⋯𝑜1𝑡11 𝑜1𝑡12 𝑜1𝑡13 ⋯ − ]
(2)
where o1ij represents the frequency in which both term w1i and w1j co-occur in the same document. The
weighted adjacency matrix A1 is a triangular symmetric matrix, since o1ij = o1ji. The weighted adjacency
matrix for student textual feedback data (i.e., A2) can be generated in the same manner.
Semantic graphs are defined as a visual representation of knowledge patterns in terms of
semantic relationships between concepts [45]. (Undirected) semantic graphs can be generated based on
the results of term frequency analysis and the weighted adjacency matrix. A semantic graph for MOOC
transcriptions can be represented as G1: (T1, E1), where T1 and E1 are a set of nodes and a set of edges
that represent the relationship between two different nodes, respectively. The number of nodes and the
number of edges of the semantic network for MOOC transcriptions can be expressed as |𝑇1| = 𝑡1 and
|𝐸1| =∑ ∑ 1𝑂1𝑚𝑛
𝑡1𝑚=1,𝑚≠𝑛
𝑡1𝑛=1
2, respectively. G2 (i.e., a semantic graph for student textual feedback data),
|𝑇2|, and |𝐸2| can be defined in the same manner.
3.3. Semantic Network Metrics
In order to characterize the semantic structures of MOOC transcriptions and student textual
feedback data, four different semantic network metrics are used in this work as described below.

10
Average Degree
The average degree of a network represents the average number of edges incident on the nodes
in the network [46]. The average degree of G1 (i.e., <k1>) can be defined as Eq. (3), where the number of
edges of the term w1m is k1m. The average degree of G2 (i.e., <k2>) can be defined in the same manner.
< 𝑘1 >=∑ 𝑘1𝑚
|𝑇1|𝑚=1
|𝑇1| (3)
Average Clustering Coefficient
The clustering coefficient of the term w1m (i.e., C1m) represents the proportion of existing edges
between neighbors of the term w1m (i.e., E1m) out of the maximum possible number of edges of the term
w1m (Eq. (4)). The average clustering coefficient of MOOC transcripts (i.e., C1) is defined as Eq. (5). The
average clustering coefficient of student feedback data (i.e., C2) is defined in the same manner [46].
𝐶1𝑚 =2 ∙ 𝐸1𝑚
𝑘1𝑚 ∙ (𝑘1𝑚 − 1) (4)
𝐶1 =∑ 𝐶1𝑚
|𝑇1|𝑚=1
|𝑇1| (5)
Average Geodesic Distance
The geodesic distance (i.e., d1mn) means the shortest path between two different nodes (i.e., the
minimum number of edges connecting w1m and w1n) in the semantic graph [46]. The average geodesic
distance of MOOC transcriptions (i.e., L1) is defined as Eq. (6). The average geodesic distance of student
feedback data (i.e., L2) is defined in the same manner. The geodesic distance evaluates the cohesion of
the semantic network (i.e., how close the ideas of MOOC transcripts or student feedback are developed)
[44].
11
𝐿1 =∑ ∑ 𝑑1𝑚𝑛
|𝑇1|𝑚=1,𝑚≠𝑛
|𝑇1|𝑛=1
|𝑇1| ∙ (|𝑇1| − 1) (6)
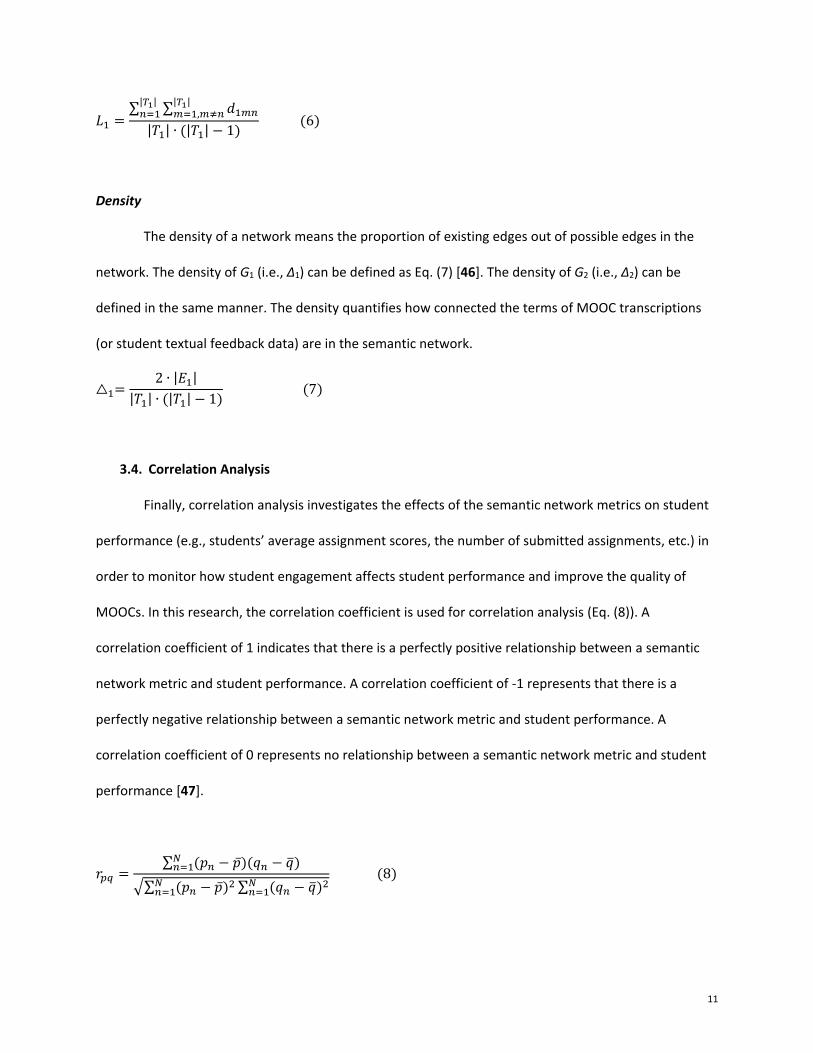
Density
The density of a network means the proportion of existing edges out of possible edges in the
network. The density of G1 (i.e., ∆1) can be defined as Eq. (7) [46]. The density of G2 (i.e., ∆2) can be
defined in the same manner. The density quantifies how connected the terms of MOOC transcriptions
(or student textual feedback data) are in the semantic network.
△1=2 ∙ |𝐸1|
|𝑇1| ∙ (|𝑇1| − 1) (7)
3.4. Correlation Analysis
Finally, correlation analysis investigates the effects of the semantic network metrics on student
performance (e.g., students’ average assignment scores, the number of submitted assignments, etc.) in
order to monitor how student engagement affects student performance and improve the quality of
MOOCs. In this research, the correlation coefficient is used for correlation analysis (Eq. (8)). A
correlation coefficient of 1 indicates that there is a perfectly positive relationship between a semantic
network metric and student performance. A correlation coefficient of -1 represents that there is a
perfectly negative relationship between a semantic network metric and student performance. A
correlation coefficient of 0 represents no relationship between a semantic network metric and student
performance [47].
𝑟𝑝𝑞 =∑ (𝑝𝑛 − �̅�)(𝑞𝑛 − �̅�)𝑁
𝑛=1
√∑ (𝑝𝑛 − �̅�)2𝑁𝑛=1 ∑ (𝑞𝑛 − �̅�)2𝑁
𝑛=1
(8)

12
where:
N: Sample size
pn: Value of nth observation from sample p (n:1 to N). In this research, pn represents the values of the
semantic network metrics (e.g., average degree, average clustering coefficient, average geodesic
distance, or density).
�̅�: Average value of all observations from sample p
qn: Value of nth observation from sample q (n:1 to N). In this research, qn represents course performance
(e.g., students’ average assignment scores, the number of submitted assignments, or the numbers of
posts and comments written in MOOC discussion forums).
�̅�: Average value of all observations from sample q.
4. APPLICATION
In this case study, a Penn State's Coursera MOOC (“Creativity, Innovation, and Change (CIC)”)
[48,49] is used to validate the proposed research. The course goal is to provide concepts and tools to
help students realize their creative potential and encourage their innovative behavior. This process-
oriented course also builds a global creativity community and connects students around the world with
a passion for change. Each lesson is structured around the following online components; video lectures,
exercises, and MOOC discussion forums. Due to the general nature of the course content, there is no
recommended prerequisite for the course. Full details about the original course structure and content
are provided in [48].
The participant population for the MOOC under study is very diverse. Figure 2 illustrates the
census data for the participants in the MOOC. Overall, 39,069 individuals participate in the MOOC (i.e.,
visited the course at least once). Of the overall 39,069 individuals who visit the course, 9,377 are from
China, 7,423 are from the United States, 2,735 are from India, and the remaining 19,534 represent 184

13
other countries. Of these, 3,803 completed the optional Coursera survey that gathered gender
information, of which 48% are female (N=1825) and 52% are male (N=1978). The course is listed across
all possible disciplinary categories within Coursera, so students of all disciplinary backgrounds are
welcome.
[Insert Figure 2]
4.1. MOOC Transcriptions
MOOC transcriptions extracted from the Coursera video lectures and exercises for 6 weeks
(from July 5th, 2014 to September 17th, 2014), with new material related to creativity, innovation, and/or
change processes and techniques related each week, are used for the case study. MOOC transcriptions
are categorized into 6 documents based on 6 weeks. Table 1 shows the weekly lesson titles, the exercise
titles, the number of transcripts (i.e., video lectures and exercises), and the number of terms in
transcripts after preprocessing.
[Insert Table 1]
4.2. Student Textual Feedback Data and Student Performance Data
MOOC discussion forum posts and comments in the Coursera MOOC platform are used for this
case study. All posts and all comments are also categorized into 6 documents (i.e., 6 weeks)
corresponding to each MOOC lecture and exercise. Table 2 illustrates student performance data. I.e.,
the average assignment scores on a five-point scale (where 5 is excellent and 1 is poor), and the number
of submitted assignments by students for each week. In addition, data pertaining to the number of

14
terms in the MOOC discussion forum posts and comments, provided by students for each week after
preprocessing, are also acquired.
[Insert Table 2]
5. EXPERIMENTS AND RESULTS
5.1. Term Frequency and Semantic Network Analysis
Figures 3 and 4 illustrate semantic networks created based on MOOC transcriptions and student
textual feedback data, respectively. In this case study, semantic networks only consider the terms that
are the top 10% (i.e., a commonly used cutoff value in network analysis) of the frequent terms in MOOC
transcriptions and student feedback data, respectively [50,51]. Each size of a vertex and each width of
an edge indicate the term frequency and the co-occurrence frequency, respectively. In both networks,
each vertex color indicates which week (i.e., document) each term is used in (red: Week 1, blue: Week 2,
green: Week 3, purple: Week 4, gray: Week 5, and orange: Week 6). A black vertex means that the term
is used in multiple weeks.
[Insert Figure 3]
[Insert Figure 4]
Based on the results of Figures 3 and 4, Table 3 provides the average degrees (i.e., <k1>, <k2>),
the average clustering coefficients (i.e., C1, C2), the average geodesic distances (i.e., L1, L2), and the
densities (i.e., 1, 2) of MOOC transcriptions and student textual feedback data, respectively. Table 3
also shows the differences between the values of the average degrees, the average clustering

15
coefficients, the average geodesic distances, and the densities of MOOC transcriptions and student
textual feedback data, respectively, which indicate the different word associations between instructors
and students. For example, Figure 3 illustrates that the number of the frequent terms in Week 1 of
MOOC transcriptions (i.e., “creativity”, “innovation”, “journal”, “learn”, “people”, “problem”, “state”,
“talk”, “value”, “welcome”) is 10 (i.e. |𝑇1|) and the summation of the number of their edges are 154
(=28+9+9+9+36+17+9+19+9+9). <k1> in Week 1 is therefore 15.400 (=154/10) by its definition (see
Section 3.3).
[Insert Table 3]
Figures 3 and 4 present (1) the terms that are frequently used only in MOOC transcriptions for
each week; (2) the terms that are frequently used only in student textual feedback data for each week;
and (3) the terms that are frequently used in MOOC transcriptions and student feedback data
simultaneously. On the one hand, the terms “creativity”, “think”, and “idea”, which are considered key
terms of the overall MOOC content, frequently co-occur in MOOC transcriptions and student textual
feedback in MOOC discussion forums, simultaneously. On the other hand, in Week 6, while the terms
“eureka”, “fish”, “money”, and “wing” (i.e., key terms on the course in Week 6) are frequently used in
MOOC transcriptions, the terms “feedback”, “time”, “assignment”, and “certificate,” (i.e., the terms
relating to the MOOC certificate or final homework assignments) are frequently used in student textual
feedback data. Based on the results of semantic network analysis, it is postulated that students might be
more interested in their final assignment, MOOC certificate, or overall course feedback, instead of
lecture content in Week 6. Table 3 shows that the semantic network of student textual feedback data,
which has higher average clustering coefficient, higher density, and lower average geodesic distance, is
denser than the semantic network of MOOC transcriptions, but further investigation is necessary. It also

16
indicates that both the average degrees of nodes (i.e., terms) in the semantic networks of MOOC
transcriptions and student textual feedback data are around 15 (i.e., 15.470 and 15.234, respectively).
5.2. Correlation Analysis
Table 4 provides the results of correlation coefficients (r) between (1) the differences between
the semantic network metrics of MOOC transcriptions and student textual feedback data (i.e., <k1> –
<k2>, C1 – C2, L1 – L2, 1 – 2) and (2) student performance (i.e., students’ average assignment scores,
the number of submitted assignments in this case study), respectively.
[Insert Table 4]
Overall, Table 4 shows that the difference between (1) the semantic network metrics of MOOC
transcriptions and student textual feedback data (i.e., the different word associations between
instructors and students) and (2) student performance have a negative correlation. In particular, it
indicates that students’ average assignment scores more strongly negatively correlate to the semantic
network metrics than the number of submitted assignments, since the average correlation coefficient of
the average assignment scores (i.e., -0.391) is less than the average correlation coefficient of the
number of submitted assignments (i.e., -0.142) (p-value ≈ 0). Table 4 also shows that the difference of
the average geodesic distances (i.e., L1 – L2) has stronger correlation with student performance (r < -0.5)
than other semantic network metrics (i.e., <k1> – <k2>, C1 – C2, 1 – 2) (r > -0.5). It is postulated that the
average geodesic distance may be useful as an indication of student engagement, but further research is
necessary.
The negative correlation between student disengagement (i.e., different word associations
between MOOC transcriptions and student textual feedback data) and students’ average assignment
17
scores emphasizes the significance of maximizing student engagement in the course content, since
students perform better when student disengagement is lower. It is also concluded that homework
assignments would be helpful for student engagement in the course content. When students are not
aligned with the course content or do not know how to complete the assignment, they may not be
motivated to submit the assignments, which may reduce the number of submitted assignments [6].
6. CONCLUSIONS
This research measures different word associations in the semantic networks of MOOC
transcriptions and student textual feedback data in MOOC discussion forums (i.e., student
disengagement in the course content). Correlation analysis is then provided to investigate correlations
between the values of the semantic network metrics and student performance in order to identify the
effects of student disengagement in the course content on student performance.
The proposed research is comprised of three main steps. First, textual data are retrieved from
MOOC transcriptions and student feedback in MOOC discussion forums. Semantic network analysis,
along with the semantic network metrics, is provided to reveal the different word associations between
students and instructors for enabling researchers to understand why student disengagement exists.
Finally, correlation analysis is implemented in order to understand how student engagement affects
learning outcomes in MOOCs.
Penn State’s MOOC data are used to validate this research. The semantic network graphs
visualize which frequently co-occurred terms cause the different word associations between MOOC
transcriptions and student textual feedback data in MOOC discussion forums. The differences of the
semantic network metrics between MOOC transcriptions and student textual feedback data negatively
correlate to students’ average assignment scores as well as the number of submitted homework
assignments. It is postulated that the average geodesic distance, which provides stronger (negative)
18
correlation with student performance than other metrics in this work, can be used as an indication of
student engagement.
The authors will identify student performance that correlates with student engagement in the
course content other than students’ average assignment scores as well as the number of submitted
assignments. The semantic network metrics, other than the average degree, the average clustering
coefficient, the average geodesic distance, and the density, will be investigated. Future work will also
provide regression analysis in order to identify which semantic network metric combinations enable to
indicate student engagement in the course content and predict student performance.
ACKNOWLEDGEMENTS
The authors of this work would like to acknowledge support from NSF IUSE grant #1449650 and
NSF I/UCRC Center for Healthcare Organization Transformation (CHOT) grant #1624727 for funding this
research. Any opinions, findings, or conclusions found in this paper are those of the authors and do not
necessarily reflect the views of the sponsors.
REFERENCES
1. A. M. Wasfy, T. M. Wasfy, H. El-Mounayri and D. Aw, Web-based multimedia lecture delivery system with text-to-speech and virtual instructors, 25th Computers and Information in Engineering (CIE) Conference, American Society of Mechanical Engineers, 2005, p.^pp.
2. M. Khosrowjerdi, G. L. Kinzel and D. W. Rosen, Computers in education: Activities, contributions, and future trends, Journal of Computing and Information Science in Engineering 5 (2005), no. 3.
3. K. A. Mohamed, Web-based and interactive e-learning framework for supporting mechanical education systems, 2006 ASME International Mechanical Engineering Congress and Exposition, IMECE2006–Mechanical Engineering Education, American Society of Mechanical Engineers, 2006, p.^pp.
4. A. C. Hyder, J. L. Thames and D. Schaefer, "Enhancing mechanical engineering distance education through it-enabled remote laboratories," Volume 8: 14th Design for Manufacturing and the Life Cycle Conference; 6th Symposium on International Design and Design Education; 21st International Conference on Design Theory and Methodology, Parts A and B, 2009, pp. 491-500.
5. F. G. Martin, Will massive open online courses change how we teach?, Communications of the ACM 55 (2012), no. 8.
6. S. Lim, C. S. Tucker, K. Jablokow and B. Pursel, Quantifying the mismatch between course content and students’ dialogue in online learning environments, ASME 2017 International Design

19
Engineering Technical Conferences and Computers and Information in Engineering Conference, American Society of Mechanical Engineers, 2017, V003T004A016-V003T004A016.
7. V. Singh, A. Dong and J. S. Gero, Social learning in design teams: The importance of direct and indirect communications, Artificial Intelligence for Engineering Design, Analysis and Manufacturing 27 (2013), no. 02, 167-182.
8. C. O. Rodriguez, Moocs and the ai-stanford like courses: Two successful and distinct course formats for massive open online courses, European Journal of Open, Distance and E-Learning 15 (2012), no. 2.
9. D. H. Welsh and M. Dragusin, The new generation of massive open online course (moocs) and entrepreneurship education, Small Business Institute Journal 9 (2013), no. 1, 51.
10. G. Siemens and S. D. Downes, "Connectivism and connective knowledge," 2008. 11. C. Yeager, B. Hurley-Dasgupta and C. A. Bliss, Cmoocs and global learning: An authentic
alternative, Journal of Asynchronous Learning Networks 17 (2013), no. 2, 133-147. 12. C. Adams, Y. Yin, L. F. Vargas Madriz and C. S. Mullen, A phenomenology of learning large: The
tutorial sphere of xmooc video lectures, Distance Education 35 (2014), no. 2, 202-216. 13. A. Klašnja-Milićević, M. Ivanović and Z. Budimac, Data science in education: Big data and learning
analytics, Computer Applications in Engineering Education 25 (2017), no. 6, 1066–1078. 14. J. Mostow, J. Beck, H. Cen, A. Cuneo, E. Gouvea and C. Heiner, An educational data mining tool to
browse tutor-student interactions: Time will tell, In Proceedings of the Workshop on Educational Data Mining, National Conference on Artificial Intelligence, AAAI Press, 2005, p.^pp. 15-22.
15. C. V. Sacin, J. B. Agapito, L. Shafti and A. Ortigosa, Recommendation in higher education using data mining techniques, Educational Data Mining (2009), 190-199.
16. S. Natek and M. Zwilling, Student data mining solution–knowledge management system related to higher education institutions, Expert Systems with Applications 41 (2014), no. 14, 6400-6407.
17. J. M. Luna, C. Castro and C. Romero, Mdm tool: A data mining framework integrated into moodle, Computer Applications in Engineering Education 25 (2017), no. 1, 90-102.
18. J. Han, J. Pei and M. Kamber, Data mining: Concepts and techniques, Elsevier, 2011. 19. D. Kelly and B. Tangney, 'First aid for you': Getting to know your learning style using machine
learning, Advanced Learning Technologies, 2005. ICALT 2005. Fifth IEEE International Conference on, IEEE, 2005, p.^pp. 1-3.
20. T.-C. Hsia, A.-J. Shie and L.-C. Chen, Course planning of extension education to meet market demand by using data mining techniques – an example of chinkuo technology university in taiwan, Expert Systems with Applications 34 (2008), no. 1, 596-602.
21. D. Perera, J. Kay, I. Koprinska, K. Yacef and O. R. Zaïane, Clustering and sequential pattern mining of online collaborative learning data, IEEE Transactions on Knowledge and Data Engineering 21 (2009), no. 6, 759-772.
22. B. Şen, E. Uçar and D. Delen, Predicting and analyzing secondary education placement-test scores: A data mining approach, Expert Systems with Applications 39 (2012), no. 10, 9468-9476.
23. Y. Pang, Y. Jin, Y. Zhang and T. Zhu, Collaborative filtering recommendation for mooc application, Computer Applications in Engineering Education 25 (2017), no. 1, 120-128.
24. L. Feng, H. Jiang, J. Wang and Y. Gong, Design, implementation and evaluation of moocs and dbl‐based cross‐registration, Computer Applications in Engineering Education (2018).
25. F. Han, K. Veeramachaneni and U.-M. O’Reilly, Analyzing millions of submissions to help mooc instructors understand problem solving, NIPS Workshop on Data Driven Education, 2013, p.^pp.
26. A. Margaryan, M. Bianco and A. Littlejohn, Instructional quality of massive open online courses (moocs), Computers & Education 80 (2015), 77-83.
20
27. J. L. F. Choy and C. L. Quek, Modelling relationships between students' academic achievement and community of inquiry in an online learning environment for a blended course, Australasian Journal of Educational Technology 32 (2016), no. 4, 106-124.
28. K. M. Alraimi, H. Zo and A. P. Ciganek, Understanding the moocs continuance: The role of openness and reputation, Computers & Education 80 (2015), 28-38.
29. Y.-H. Chen and P.-J. Chen, Mooc study group: Facilitation strategies, influential factors, and student perceived gains, Computers & Education 86 (2015), 55-70.
30. S. Grover, P. Franz, E. Schneider and R. Pea, The mooc as distributed intelligence: Dimensions of a framework & evaluation of moocs, Proceedings CSCL, 2013, p.^pp. 42-45.
31. I. F. Liu, M. C. Chen, Y. S. Sun, D. Wible and C.-H. Kuo, Extending the tam model to explore the factors that affect intention to use an online learning community, Computers & Education 54 (2010), no. 2, 600-610.
32. J. Imlawi, D. Gregg and J. Karimi, Student engagement in course-based social networks: The impact of instructor credibility and use of communication, Computers & Education 88 (2015), 84-96.
33. J. Mackness, S. Mak and R. Williams, The ideals and reality of participating in a mooc, Proceedings of the 7th International Conference on Networked Learning 2010, 2010, p.^pp.
34. L. Breslow, D. E. Pritchard, J. DeBoer, G. S. Stump, A. D. Ho and D. T. Seaton, Studying learning in the worldwide classroom: Research into edx's first mooc, Research & Practice in Assessment 8 (2013), 13-25.
35. J. Reich, D. H. Tingley, J. Leder-Luis, M. E. Roberts and B. Stewart, Computer-assisted reading and discovery for student generated text in massive open online courses, Journal of Learning Analytics 2 (2015), no. 1, 156–184.
36. S. Joksimović, V. Kovanović, J. Jovanović, A. Zouaq, D. Gašević and M. Hatala, What do cmooc participants talk about in social media?: A topic analysis of discourse in a cmooc, Proceedings of the Fifth International Conference on Learning Analytics And Knowledge, ACM, 2015, p.^pp. 156-165.
37. S. Lim, C. S. Tucker and S. Kumara, An unsupervised machine learning model for discovering latent infectious diseases using social media data, Journal of Biomedical Informatics 66 (2017), 82-94.
38. Apache Lucene, https://lucene.apache.org 39. SCOWL (Spell Checker Oriented Word Lists), http://wordlist.aspell.net 40. M. F. Porter, An algorithm for suffix stripping, Program 14 (1980), no. 3, 130-137. 41. G. Salton and C. Buckley, Term-weighting approaches in automatic text retrieval, Information
processing & management 24 (1988), no. 5, 513-523. 42. B. Choudhary and P. Bhattacharyya, Text clustering using semantics, Proceedings of the 11th
International World Wide Web Conference, IW3C2, 2002, p.^pp. 1-4. 43. S. G. Cho and S. B. Kim, Summarization of documents by finding key sentences based on social
network analysis, International Conference on Industrial, Engineering and Other Applications of Applied Intelligent Systems, Springer, Cham, 2015, p.^pp. 285-292.
44. D. Munoz and C. S. Tucker, Modeling the semantic structure of textually derived learning content and its impact on recipients' response states, Journal of Mechanical Design 138 (2016), no. 4.
45. B. Hoser, A. Hotho, R. Jäschke, C. Schmitz and G. Stumme, Semantic network analysis of ontologies, The Semantic Web: Research and Applications. ESWC 2006, 2006, p.^pp. 514-529.
46. H. B. d. B. Pereira, I. S. Fadigas, V. Senna and M. A. Moret, Semantic networks based on titles of scientific papers, Physica A: Statistical Mechanics and its Applications 390 (2011), no. 6, 1192-1197.
47. S. Lim and C. S. Tucker, Mitigating online product rating biases through the discovery of optimistic, pessimistic, and realistic reviewers, Journal of Mechanical Design 139 (2017), no. 11, 111409.

21
48. K. Jablokow, J. Matson and D. Velegol, A multidisciplinary mooc on creativity, innovation, and change: Encouraging experimentation and experiential learning on a grand scale, Proceedings of the ASEE 2014 Annual Conference & Exposition (Paper# 9669), 2014, p.^pp.
49. Creativity, innovation, and change | coursera, https://www.coursera.org. 50. D. J. Watts and P. S. Dodds, Influentials, networks, and public opinion formation, Journal of
Consumer Research 34 (2007), no. 4, 441-458. 51. F. Ding and Y. Liu, A decision theoretical approach for diffusion promotion, Physica A: Statistical
Mechanics and its Applications 388 (2009), no. 17, 3572-3580.