
A self-organizing maps classifier structure for brain ... · A self-organizing maps classifier...
9
Original Article DOI: http://dx.doi.org/10.1590/2446-4740.0753 *e-mail: [email protected] Received: 10 April 2015 / Accepted: 08 August 2015 A self-organizing maps classifier structure for brain computer interfaces Leandro Bueno*, Teodiano Freire Bastos Filho Abstract Introduction: Brain Computer Interfaces provide an alternative communication path to severe paralyzed people and uses electrical signals related to brain activity in order to identify the user’s intention. In this paper a classifier based on a Self-Organizing Map is introduced. Methods: Electroencephalography signal is used on this work as a source for the user’s intention. This signal represents the brain activity and is processed in order to extract the frequency features presented to the classifier, which uses a Self-Organizing Map and a series of probability masks in order to identify the correct class. Results: The proposed structure was evaluated using a dataset of Electroencephalography with three mental tasks. The system was able to identify the different states of the users intention with an accuracy of 71.21% for a three-class problem using only 25 neurons for one of the users. Conclusion: The classifier proposed in this paper has an accuracy that is around the value of similar works in the literature, using the same data, but using a small time window for the classification, meaning the system can have a better time response for the user. Keywords: Self-organizing map, Brain-Computer interface, BCI, SOM. Introduction Brain Computer Interface (BCI) systems can be used to provide an alternative communication path for people with severe disabilities as well as a new way to interact with devices in different circumstances, such as military or in the entertaining market (Al-Ketbi and Conrad, 2013; Brunner et al., 2015; Miranda et al., 2015; Navarro, 2004). These systems use brain’s electrical signals collected from the scalp, called Electroencephalogram (EEG), which after the application of digital signal processing techniques obtain information about the user’s intention. These different approaches for BCI’s architectures based on the physiological background of the activity used to identify the user’s intention will be shown in this work. This work aims to identify motor intention from left and right hands, in addition to a cognitive task of remembering words, on continuous data. These mental tasks can be used to control any kind of device, such as a wheelchair, or a cursor on a screen. The classification on continuous data is a new approach to the development of BCI, as many of the works found on the literature present some kind of clue to the user in order to guide the user’s response. Different approaches can be used to build a BCI. One of them is to identify physiological responses of the user to an external stimulus, such as in systems based on Steady State Visual Evoked Potential (SSVEP), on which a flashing light with a determined frequency is presented to the user and that frequency can be recognized on the EEG signal. This way, the system can identify the stimulus source and execute an action based on this choice (Cotrina et al., 2014; Gao et al., 2003). Another approach is to instruct the user to imagine a movement of a hand, either left or right, after an instruction from the system. This way, different patterns, from potentials of preparation of movement (Dornhege et al., 2004; Krepki et al., 2007) to frequency characteristics related to the movement imagination (Benevides et al., 2011; Bueno and Pons, 2007; Galán et al., 2007) can be identified. The approach used in this work is to identify motor intention based only on the EEG, without any mark or reference to the action to be executed for the classifier. For this to be accomplished, it must recognize features on the signal that characterizes the mental states without any kind of clue. This work uses the dataset V of the BCI Competition III (Millan, 2004). The result of the competition is presented on (Blankertz et al., 2006; Blankertz, 2005). For the dataset V, in a direct comparison, the algorithm used on this paper scored the 13 th position across the table. Although the algorithm does not surpasses the best algorithm of the competition, in terms of accuracy, Volume 31, Number 3, p. 232-240, 2015
Transcript of A self-organizing maps classifier structure for brain ... · A self-organizing maps classifier...
Original ArticleDOI: http://dx.doi.org/10.1590/2446-4740.0753
*e-mail: [email protected]: 10 April 2015 / Accepted: 08 August 2015
A self-organizing maps classifier structure for brain computer interfaces
Leandro Bueno*, Teodiano Freire Bastos Filho
Abstract Introduction: Brain Computer Interfaces provide an alternative communication path to severe paralyzed people and uses electrical signals related to brain activity in order to identify the user’s intention. In this paper a classifier based on a Self-Organizing Map is introduced. Methods: Electroencephalography signal is used on this work as a source for the user’s intention. This signal represents the brain activity and is processed in order to extract the frequency features presented to the classifier, which uses a Self-Organizing Map and a series of probability masks in order to identify the correct class. Results: The proposed structure was evaluated using a dataset of Electroencephalography with three mental tasks. The system was able to identify the different states of the users intention with an accuracy of 71.21% for a three-class problem using only 25 neurons for one of the users. Conclusion: The classifier proposed in this paper has an accuracy that is around the value of similar works in the literature, using the same data, but using a small time window for the classification, meaning the system can have a better time response for the user. Keywords: Self-organizing map, Brain-Computer interface, BCI, SOM.
IntroductionBrain Computer Interface (BCI) systems can be
used to provide an alternative communication path for people with severe disabilities as well as a new way to interact with devices in different circumstances, such as military or in the entertaining market (Al-Ketbi and Conrad, 2013; Brunner et al., 2015; Miranda et al., 2015; Navarro, 2004). These systems use brain’s electrical signals collected from the scalp, called Electroencephalogram (EEG), which after the application of digital signal processing techniques obtain information about the user’s intention. These different approaches for BCI’s architectures based on the physiological background of the activity used to identify the user’s intention will be shown in this work.
This work aims to identify motor intention from left and right hands, in addition to a cognitive task of remembering words, on continuous data. These mental tasks can be used to control any kind of device, such as a wheelchair, or a cursor on a screen. The classification on continuous data is a new approach to the development of BCI, as many of the works found on the literature present some kind of clue to the user in order to guide the user’s response.
Different approaches can be used to build a BCI. One of them is to identify physiological responses of the user to an external stimulus, such as in systems based on Steady State Visual Evoked Potential
(SSVEP), on which a flashing light with a determined frequency is presented to the user and that frequency can be recognized on the EEG signal. This way, the system can identify the stimulus source and execute an action based on this choice (Cotrina et al., 2014; Gao et al., 2003).
Another approach is to instruct the user to imagine a movement of a hand, either left or right, after an instruction from the system. This way, different patterns, from potentials of preparation of movement (Dornhege et al., 2004; Krepki et al., 2007) to frequency characteristics related to the movement imagination (Benevides et al., 2011; Bueno and Pons, 2007; Galán et al., 2007) can be identified.
The approach used in this work is to identify motor intention based only on the EEG, without any mark or reference to the action to be executed for the classifier. For this to be accomplished, it must recognize features on the signal that characterizes the mental states without any kind of clue.
This work uses the dataset V of the BCI Competition III (Millan, 2004). The result of the competition is presented on (Blankertz et al., 2006; Blankertz, 2005). For the dataset V, in a direct comparison, the algorithm used on this paper scored the 13th position across the table. Although the algorithm does not surpasses the best algorithm of the competition, in terms of accuracy,
Volume 31, Number 3, p. 232-240, 2015
A SOM based BCI classifier
it presents a new approach to the classifier structure, and it can be used to map the activity of the user in different states.
Methods
The EEG signal and the features selectionThe EEG signal is the electrical activity registered
on the scalp and is related to the depolarization of the neurons inside the brain tissue. The depolarization potentials sum up in the brain volume and also across the skull bone and other tissues, such as the skin. These processes can be modeled as a set of individual dipoles inside a conductive volume of different materials (Malmivuo and Plonsey, 1995).
The EEG signals have an oscillatory nature and their spectrum is typically divided in bands, named after the Greek alphabet. The alpha (α) band comprises the frequencies between 8 and 13 Hz and is prominent in the occipital area and with eyes closed. The beta (β) band comprises the frequencies between 13 and 30 Hz in the frontal and parietal lobes. The delta (δ) and theta (θ) bands are detectable in sleeping adults and comprise the frequencies between 0.5 and 4 Hz and 4 and 8 Hz, respectively. The mu (µ) band ranges from 8 to 12 Hz and is present on the sensorimotor area of the cortex. There is an overlap of the alpha, beta and mu bands, in terms of frequencies, but the mu band is most prominent on the sensorimotor area (Bashashati et al., 2007; Nicolas-Alonso and Gomez-Gil, 2012).
The data used in this work came from a public dataset for a 3-class identification problem from the BCI Competition (Millan, 2004). This dataset contains data from 3 normal subjects during 4 non-feedback
sessions. In the sessions, the subjects sat in a normal chair, relaxed arms resting on their legs. One of the tasks is the evoking of words that start with the same letter. The second task is the self-paced movement imagination of the left hand, and the third task is the self-paced movement imagination of the right hand. The last session was used for testing and the first three sessions were used for training. The datasets comprise the full sessions were the data were acquired, without any preprocessing or artifact removal. Each session was conducted in a way that the subject receives an indication of the mental task he/she has to execute and the moment this execution has to start. The user then executes the mental task for 15 seconds, when and he/she receive another task request from the operator of the experiment. The sessions are not divided in trials, as the main goal of the dataset is to identify the mental task in continuous data. Each session had duration of 4 minutes (16 task changes for session), with a 5 to 10 minutes break between them.
The dataset was provided in two forms: raw data, sampled at 512 Hz, and precomputed Power Spectral Density (PSD) components in the 8 to 13 Hz with an interval of 62.5ms between two consecutives PSDs.
The proposed tasks comprise a cognitive task and two motor tasks. It is known that the movement imagination can activate the same areas as the real movements do, and generate Event Related Desynchronization (ERD) and Event Related Synchronization (ERS) that can be used to identify the user’s intention (Wolpaw et al., 2002).
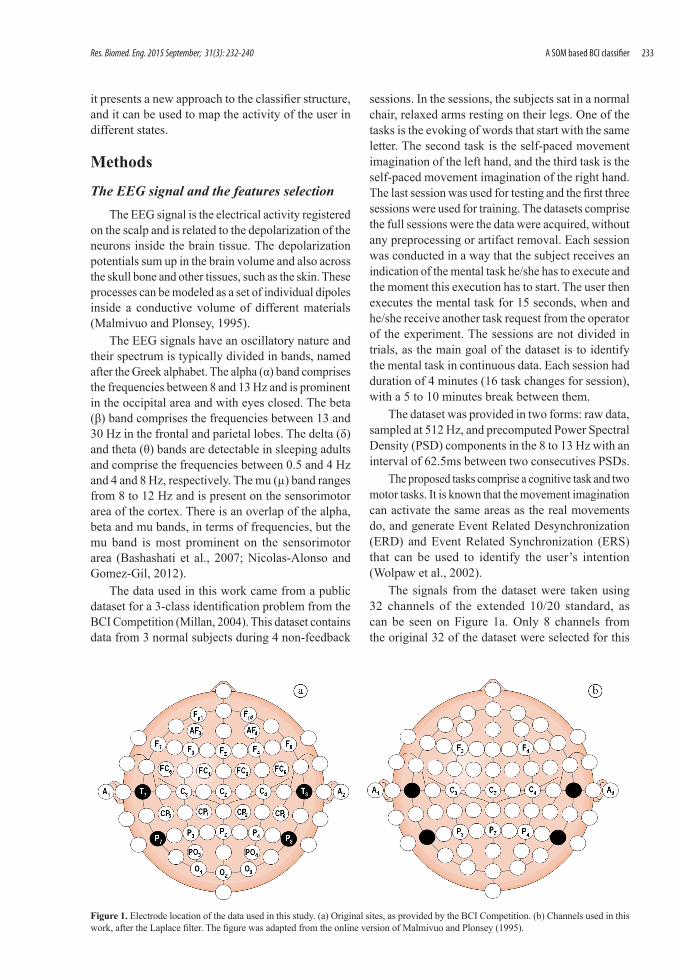
The signals from the dataset were taken using 32 channels of the extended 10/20 standard, as can be seen on Figure 1a. Only 8 channels from the original 32 of the dataset were selected for this
Figure 1. Electrode location of the data used in this study. (a) Original sites, as provided by the BCI Competition. (b) Channels used in this work, after the Laplace filter. The figure was adapted from the online version of Malmivuo and Plonsey (1995).
233Res. Biomed. Eng. 2015 September; 31(3): 232-240
Bueno L, Bastos TF Fo
work. The selected channels were F3, F4, Cz, C3, C4, P3, P4 and Pz as can be seen in Figure 1b. These channels were chosen as they cover the sensorimotor, cognitive and associative areas of the brain related to the language and motor skills (Pereira et al., 2003).
As a pre-processing stage, the data were filtered in order to attenuate DC levels on the channels. A Finite Impulse Response (FIR) filter was used to filter the data in order to have a filtered data with frequencies above 2 Hz. A low pass filter was not used. A Laplace spatial filter was applied to the data in order to eliminate noises from nearby regions (Benevides et al., 2012; Fabiani et al., 2004). The Laplace kernel used was a 3 x 3 matrix applied spatially to the data. In some of the corners of the data matrix, the kernel was not a full matrix, in order to accommodate the data voids. The channel selection occurs in the moment of the filtering; in other words, only the selected channels were filtered, and the others were discarded and its information was only used by the Laplace filter.
From the selected channels, the PSD was calculated using a window of 512 samples, in order to have 1 Hz of PSD resolution. The PSD was calculated with an overlap of 480 samples. According to Wolpaw et al. (2002), the frequency bands covering the mu (µ) and beta (ß) bands are good alternatives for features for a BCI system, as they reflect the conscious decision to execute a movement. From that knowledge, the frequency bands between 8 and 13 Hz were chosen for this work as they reflect most of the conscious hand movement and have higher power associated, increasing the signal to noise ratio. The power of these frequency components in all channels were chosen as features for this classifier, giving a feature vector of dimension 48 (six features by 8 channels).
The self organizing mapThe Self-Organizing Map (SOM) is a kind
of competitive neural network that resembles the structure of the neurons on the brain’s cortex. This is
characterized by a matrix topology and lateral connectivity; in other words, the neurons only have connection to its neighbors and the outputs are not fed into the others neurons input (Kohonen, 1990; Somervuo and Kohonen, 1999). The output of the network is structured following the same principle, one output for each neuron. These maps are usually build using a two dimensional array of neurons, in a square or hexagonal distribution. SOM can only have one active neuron output, regardless of the number of neurons in the map, and this output only can have two values, active or inactive. The active output is the one that is more related to the given input, as the neurons accommodate their internal coefficients to become similar to a related set of input values.
The training process of SOM is unsupervised: the data are presented to the map and it adjusts its parameters in order to create representations of the inputs in the network. In this process, neurons that respond to similar inputs become close to each other, and neurons that respond to different inputs are set apart from each other. This process creates clusters of neurons that represent the relationship between the different inputs and can be used to visualize the relationship between different inputs. In this work, this clustering characteristic is used to identify the different mental states. The training of the network used an incremental approach in the sense that the same network was trained with the data from the first session, then trained with the data from the second session and, finally, with the data from the third session. Each of the training sessions was conducted with the same number of epochs (n = 100).
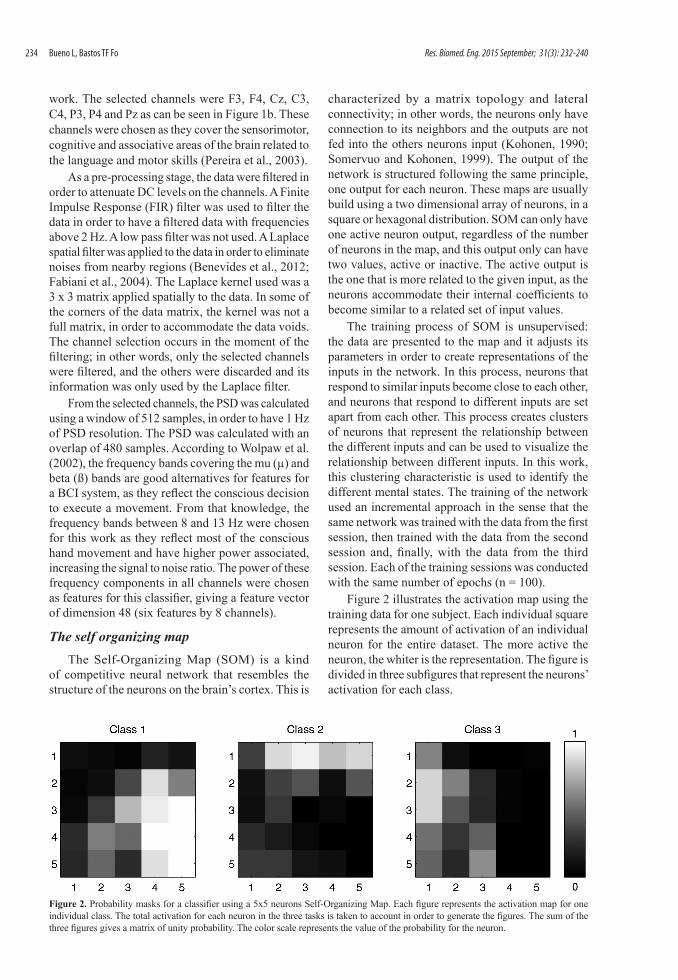
Figure 2 illustrates the activation map using the training data for one subject. Each individual square represents the amount of activation of an individual neuron for the entire dataset. The more active the neuron, the whiter is the representation. The figure is divided in three subfigures that represent the neurons’ activation for each class.
Figure 2. Probability masks for a classifier using a 5x5 neurons Self-Organizing Map. Each figure represents the activation map for one individual class. The total activation for each neuron in the three tasks is taken to account in order to generate the figures. The sum of the three figures gives a matrix of unity probability. The color scale represents the value of the probability for the neuron.
234 Res. Biomed. Eng. 2015 September; 31(3): 232-240
A SOM based BCI classifier
One can note in Figure 2 that the individual classes are not localized in a well-defined region of the map, but are dispersed over specific regions. Another characteristic is that some neurons are active in more than one class; this means that these neurons represent a mental state that appears in more than one class, such as a planning, visual, or other kind of background activity. Some of these neurons are more active in one class than the other. This amount of activation in different classes is taken into account for deciding the class in which the sequence of activation belongs.
The SOM outputs must be interpreted in some way. Different from a Multilayer Perceptron (MLP), SOM outputs do not mean that a specific input belongs to a specific class. A post classification is needed to indicate the output class based on SOM’s outputs. The outputs of the activated neurons in SOM cannot be predicted and a post classifier cannot be constructed before the network training. This interpretation will be discussed in the next section.
The classifier structureThe interpretation of the SOM’s output is made
using a classifier based on a series of masks. These masks contain weights that are used to identify the input’s class. These weights represent the probability of that neuron be active in a specific task, using the training data. Some neurons are always active in a single task and some can be active in more than one task. Combining these masks with the map output, the classifier has three probabilities, one for each class. In this situation, the task with higher probability is assigned to the input and generates an output. If an input activate a neuron that is present in more than one class with equal probability for both classes; the classifier assigns an unknown class to the input. A reclassification technique is also used in order to confirm the class and attenuate output changes, as it uses the probability of a single activation to be the output class and will be discussed later in this section.
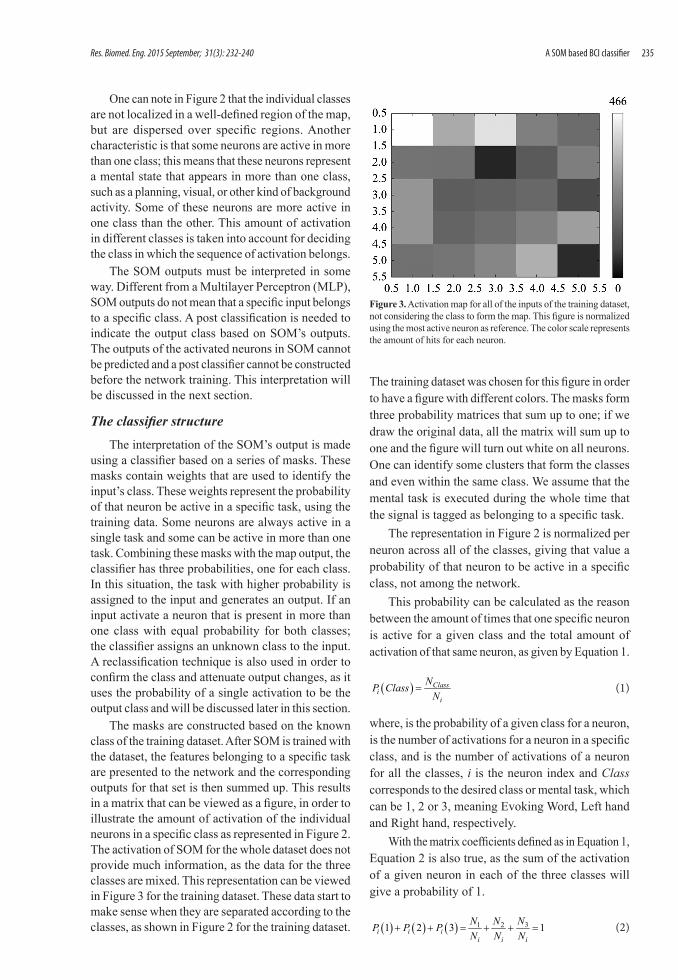
The masks are constructed based on the known class of the training dataset. After SOM is trained with the dataset, the features belonging to a specific task are presented to the network and the corresponding outputs for that set is then summed up. This results in a matrix that can be viewed as a figure, in order to illustrate the amount of activation of the individual neurons in a specific class as represented in Figure 2. The activation of SOM for the whole dataset does not provide much information, as the data for the three classes are mixed. This representation can be viewed in Figure 3 for the training dataset. These data start to make sense when they are separated according to the classes, as shown in Figure 2 for the training dataset.
The training dataset was chosen for this figure in order to have a figure with different colors. The masks form three probability matrices that sum up to one; if we draw the original data, all the matrix will sum up to one and the figure will turn out white on all neurons. One can identify some clusters that form the classes and even within the same class. We assume that the mental task is executed during the whole time that the signal is tagged as belonging to a specific task.
The representation in Figure 2 is normalized per neuron across all of the classes, giving that value a probability of that neuron to be active in a specific class, not among the network.
This probability can be calculated as the reason between the amount of times that one specific neuron is active for a given class and the total amount of activation of that same neuron, as given by Equation 1.
( ) Classi
i
NP ClassN
= (1)
where, is the probability of a given class for a neuron, is the number of activations for a neuron in a specific class, and is the number of activations of a neuron for all the classes, i is the neuron index and Class corresponds to the desired class or mental task, which can be 1, 2 or 3, meaning Evoking Word, Left hand and Right hand, respectively.
With the matrix coefficients defined as in Equation 1, Equation 2 is also true, as the sum of the activation of a given neuron in each of the three classes will give a probability of 1.
( ) ( ) ( ) 31 21 2 3 1i i ii i i
NN NP P PN N N
+ + = + + = (2)
Figure 3. Activation map for all of the inputs of the training dataset, not considering the class to form the map. This figure is normalized using the most active neuron as reference. The color scale represents the amount of hits for each neuron.
235Res. Biomed. Eng. 2015 September; 31(3): 232-240

Bueno L, Bastos TF Fo
There are some neurons that are active only on a selected class; these neurons have a probability of 1 for that class and zero for the others. On the other hand, some neurons were not active in none of the three classes; these neurons have zero probability for all classes.
Figure 4 represents the same data in Figure 5, but with the information of classes represented by shades of the primary colors, Red, Green and Blue. Observe that there are other colors different from the three basic colors on the fourth graph. These variations of colors in the neurons indicate that they are active in more than one class, as can be observed in the individual maps for each class.
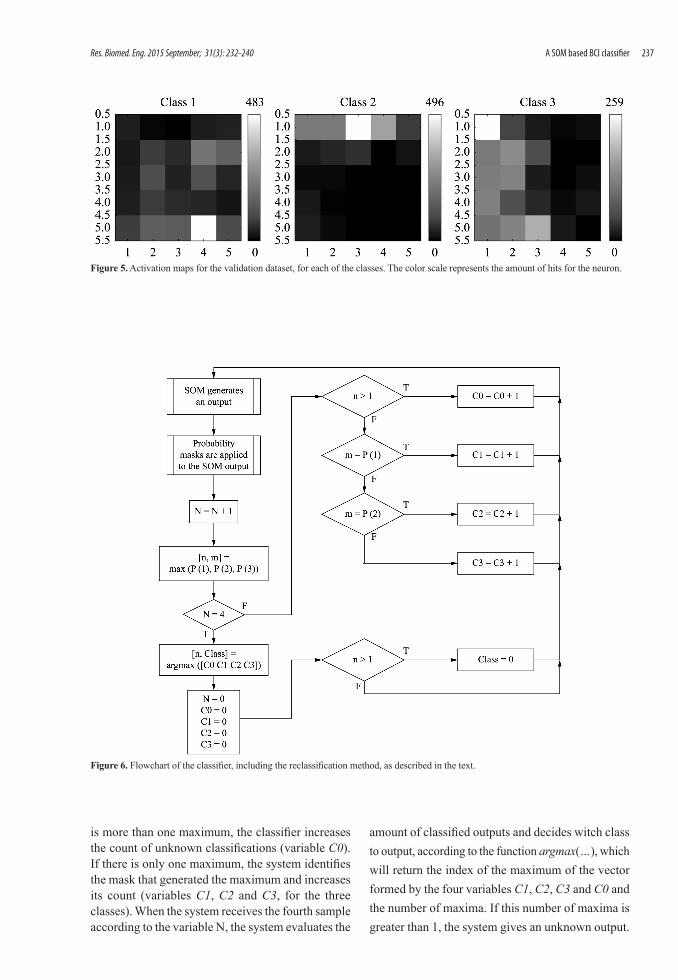
Figure 5 shows the distribution of the activations for the validation set. One can observe that the distribution of the activations of these data provides
a figure that is similar to the one in Figure 2. This fact leads us to assume that the clusters generated during the training process created a valid characterization of the mental tasks involved.
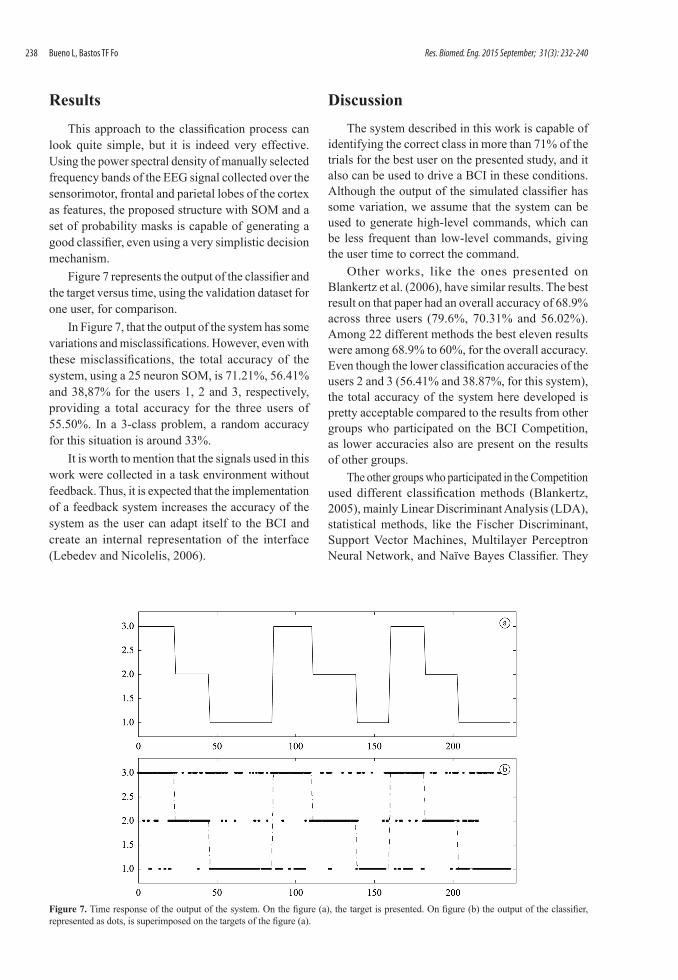
The reclassification structure takes a number of classifications and decides, based on the number of classifications for a specific class, which of the classes represents the data that was previously analyzed. The reclassification method used in this work chooses the most frequent class within a four samples window and assumes this class for the whole window, such as shown in Figure 6.
The classifier generates an output, based on the probability masks and on the SOM activation. This generates three probabilities P(1), P(2) and P(3). The function max(…) returns the number of maxima and the value of the maximum value. If there
Figure 4. Activation map with class information, using the validation dataset. The activations that belong to the class 1 (Word) are represented in shades of red, class 2 (Left Hand) in shades of green and class 3 (Right Hand) in shades of blue. The color scale represents the amount of hits for the neuron. The all classes figure combines de three classes and the different colors corresponding to the different classes using the normalized scale of each individual class.
236 Res. Biomed. Eng. 2015 September; 31(3): 232-240
A SOM based BCI classifier
is more than one maximum, the classifier increases the count of unknown classifications (variable C0). If there is only one maximum, the system identifies the mask that generated the maximum and increases its count (variables C1, C2 and C3, for the three classes). When the system receives the fourth sample according to the variable N, the system evaluates the
amount of classified outputs and decides witch class to output, according to the function argmax(…), which will return the index of the maximum of the vector formed by the four variables C1, C2, C3 and C0 and the number of maxima. If this number of maxima is greater than 1, the system gives an unknown output.
Figure 5. Activation maps for the validation dataset, for each of the classes. The color scale represents the amount of hits for the neuron.
Figure 6. Flowchart of the classifier, including the reclassification method, as described in the text.
237Res. Biomed. Eng. 2015 September; 31(3): 232-240
Bueno L, Bastos TF Fo
ResultsThis approach to the classification process can
look quite simple, but it is indeed very effective. Using the power spectral density of manually selected frequency bands of the EEG signal collected over the sensorimotor, frontal and parietal lobes of the cortex as features, the proposed structure with SOM and a set of probability masks is capable of generating a good classifier, even using a very simplistic decision mechanism.
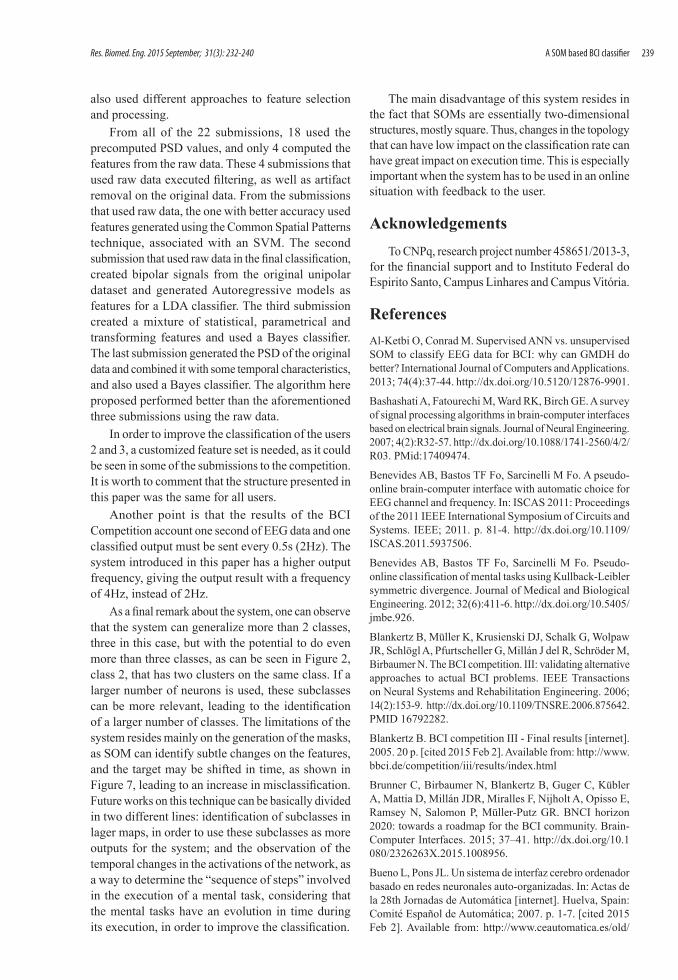
Figure 7 represents the output of the classifier and the target versus time, using the validation dataset for one user, for comparison.
In Figure 7, that the output of the system has some variations and misclassifications. However, even with these misclassifications, the total accuracy of the system, using a 25 neuron SOM, is 71.21%, 56.41% and 38,87% for the users 1, 2 and 3, respectively, providing a total accuracy for the three users of 55.50%. In a 3-class problem, a random accuracy for this situation is around 33%.
It is worth to mention that the signals used in this work were collected in a task environment without feedback. Thus, it is expected that the implementation of a feedback system increases the accuracy of the system as the user can adapt itself to the BCI and create an internal representation of the interface (Lebedev and Nicolelis, 2006).
Figure 7. Time response of the output of the system. On the figure (a), the target is presented. On figure (b) the output of the classifier, represented as dots, is superimposed on the targets of the figure (a).
DiscussionThe system described in this work is capable of
identifying the correct class in more than 71% of the trials for the best user on the presented study, and it also can be used to drive a BCI in these conditions. Although the output of the simulated classifier has some variation, we assume that the system can be used to generate high-level commands, which can be less frequent than low-level commands, giving the user time to correct the command.
Other works, like the ones presented on Blankertz et al. (2006), have similar results. The best result on that paper had an overall accuracy of 68.9% across three users (79.6%, 70.31% and 56.02%). Among 22 different methods the best eleven results were among 68.9% to 60%, for the overall accuracy. Even though the lower classification accuracies of the users 2 and 3 (56.41% and 38.87%, for this system), the total accuracy of the system here developed is pretty acceptable compared to the results from other groups who participated on the BCI Competition, as lower accuracies also are present on the results of other groups.
The other groups who participated in the Competition used different classification methods (Blankertz, 2005), mainly Linear Discriminant Analysis (LDA), statistical methods, like the Fischer Discriminant, Support Vector Machines, Multilayer Perceptron Neural Network, and Naïve Bayes Classifier. They
238 Res. Biomed. Eng. 2015 September; 31(3): 232-240
A SOM based BCI classifier
also used different approaches to feature selection and processing.
From all of the 22 submissions, 18 used the precomputed PSD values, and only 4 computed the features from the raw data. These 4 submissions that used raw data executed filtering, as well as artifact removal on the original data. From the submissions that used raw data, the one with better accuracy used features generated using the Common Spatial Patterns technique, associated with an SVM. The second submission that used raw data in the final classification, created bipolar signals from the original unipolar dataset and generated Autoregressive models as features for a LDA classifier. The third submission created a mixture of statistical, parametrical and transforming features and used a Bayes classifier. The last submission generated the PSD of the original data and combined it with some temporal characteristics, and also used a Bayes classifier. The algorithm here proposed performed better than the aforementioned three submissions using the raw data.
In order to improve the classification of the users 2 and 3, a customized feature set is needed, as it could be seen in some of the submissions to the competition. It is worth to comment that the structure presented in this paper was the same for all users.
Another point is that the results of the BCI Competition account one second of EEG data and one classified output must be sent every 0.5s (2Hz). The system introduced in this paper has a higher output frequency, giving the output result with a frequency of 4Hz, instead of 2Hz.
As a final remark about the system, one can observe that the system can generalize more than 2 classes, three in this case, but with the potential to do even more than three classes, as can be seen in Figure 2, class 2, that has two clusters on the same class. If a larger number of neurons is used, these subclasses can be more relevant, leading to the identification of a larger number of classes. The limitations of the system resides mainly on the generation of the masks, as SOM can identify subtle changes on the features, and the target may be shifted in time, as shown in Figure 7, leading to an increase in misclassification. Future works on this technique can be basically divided in two different lines: identification of subclasses in lager maps, in order to use these subclasses as more outputs for the system; and the observation of the temporal changes in the activations of the network, as a way to determine the “sequence of steps” involved in the execution of a mental task, considering that the mental tasks have an evolution in time during its execution, in order to improve the classification.
The main disadvantage of this system resides in the fact that SOMs are essentially two-dimensional structures, mostly square. Thus, changes in the topology that can have low impact on the classification rate can have great impact on execution time. This is especially important when the system has to be used in an online situation with feedback to the user.
AcknowledgementsTo CNPq, research project number 458651/2013-3,
for the financial support and to Instituto Federal do Espirito Santo, Campus Linhares and Campus Vitória.
ReferencesAl-Ketbi O, Conrad M. Supervised ANN vs. unsupervised SOM to classify EEG data for BCI: why can GMDH do better? International Journal of Computers and Applications. 2013; 74(4):37-44. http://dx.doi.org/10.5120/12876-9901.
Bashashati A, Fatourechi M, Ward RK, Birch GE. A survey of signal processing algorithms in brain-computer interfaces based on electrical brain signals. Journal of Neural Engineering. 2007; 4(2):R32-57. http://dx.doi.org/10.1088/1741-2560/4/2/R03. PMid:17409474.
Benevides AB, Bastos TF Fo, Sarcinelli M Fo. A pseudo-online brain-computer interface with automatic choice for EEG channel and frequency. In: ISCAS 2011: Proceedings of the 2011 IEEE International Symposium of Circuits and Systems. IEEE; 2011. p. 81-4. http://dx.doi.org/10.1109/ISCAS.2011.5937506.
Benevides AB, Bastos TF Fo, Sarcinelli M Fo. Pseudo-online classification of mental tasks using Kullback-Leibler symmetric divergence. Journal of Medical and Biological Engineering. 2012; 32(6):411-6. http://dx.doi.org/10.5405/jmbe.926.
Blankertz B, Müller K, Krusienski DJ, Schalk G, Wolpaw JR, Schlögl A, Pfurtscheller G, Millán J del R, Schröder M, Birbaumer N. The BCI competition. III: validating alternative approaches to actual BCI problems. IEEE Transactions on Neural Systems and Rehabilitation Engineering. 2006; 14(2):153-9. http://dx.doi.org/10.1109/TNSRE.2006.875642. PMID 16792282.
Blankertz B. BCI competition III - Final results [internet]. 2005. 20 p. [cited 2015 Feb 2]. Available from: http://www.bbci.de/competition/iii/results/index.html
Brunner C, Birbaumer N, Blankertz B, Guger C, Kübler A, Mattia D, Millán JDR, Miralles F, Nijholt A, Opisso E, Ramsey N, Salomon P, Müller-Putz GR. BNCI horizon 2020: towards a roadmap for the BCI community. Brain-Computer Interfaces. 2015; 37–41. http://dx.doi.org/10.1080/2326263X.2015.1008956.
Bueno L, Pons JL. Un sistema de interfaz cerebro ordenador basado en redes neuronales auto-organizadas. In: Actas de la 28th Jornadas de Automática [internet]. Huelva, Spain: Comité Español de Automática; 2007. p. 1-7. [cited 2015 Feb 2]. Available from: http://www.ceautomatica.es/old/
239Res. Biomed. Eng. 2015 September; 31(3): 232-240
Bueno L, Bastos TF Fo
actividades/jornadas/XXVIII/documentos/1961-JA07-Bueno.pdf
Cotrina A, Benevides A, Ferreira A, Bastos T, Castillo J, Menezes ML, Pereira C. Towards an architecture of a hybrid BCI based on SSVEP-BCI and passive-BCI. In: Proceedings of the 36th Conference of the IEEE Engineering in Medicine and Biology Society. IEEE; 2014. p. 1342-5. http://dx.doi.org/10.1109/EMBC.2014.6943847. PMID 25570215.
Dornhege G, Blankertz B, Curio G, Müller K-R. Boosting bit rates in noninvasive EEG single-trial classifications by feature combination and multiclass paradigms. IEEE Transactions on Biomedical Engineering. 2004; 51(6):993-1002. http://dx.doi.org/10.1109/TBME.2004.827088. PMid:15188870.
Fabiani GE, McFarland DJ, Wolpaw JR, Pfurtscheller G. Conversion of EEG activity into cursor movement by a brain-computer interface (BCI). IEEE Transactions on Neural Systems and Rehabilitation Engineering. 2004; 12(3):331-8. http://dx.doi.org/10.1109/TNSRE.2004.834627. PMid:15473195.
Galán F, Oliva F, Guàrdia J. Using mental tasks transitions detection to improve spontaneous mental activity classification. Medical & Biological Engineering & Computing. 2007; 45(6):603-9. http://dx.doi.org/10.1007/s11517-007-0197-7. PMid:17541665.
Gao X, Xu D, Cheng M, Gao S. A BCI-based environmental controller for the motion-disabled. IEEE Transactions on Neural Systems and Rehabilitation Engineering. 2003; 11(2):137-40. http://dx.doi.org/10.1109/TNSRE.2003.814449. PMid:12899256.
Kohonen T. The self-organizing map. Proceedings of the IEEE. 1990; 78(9):1464-80. http://dx.doi.org/10.1109/5.58325.
Krepki R, Curio G, Blankertz B, Müller K-R. Berlin Brain–Computer Interface—The HCI communication channel for discovery. International Journal of Human-Computer Studies. 2007; 65(5):460-77. http://dx.doi.org/10.1016/j.ijhcs.2006.11.010.
Lebedev MA, Nicolelis MAL. Brain-machine interfaces: past, present and future. Trends in Neurosciences. 2006;
29(9):536-46. http://dx.doi.org/10.1016/j.tins.2006.07.004. PMid:16859758.
Malmivuo J, Plonsey R. Bioelectromagnetism: principles and aplications of bioelectric and biomagnetic fields. 1st ed. New York: Oxford University Press; 1995.
Millan JR. On the need for on-line learning in brain-computer interfaces. In: IEEE 2004: Proceedings of the International Joint Conference on Neural Networks. IEEE; 2004. p. 2877-82. http://dx.doi.org/10.1109/IJCNN.2004.1381116.
Miranda RA, Casebeer WD, Hein AM, Judy JW, Krotkov EP, Laabs TL, Manzo JE, Pankratz KG, Pratt GA, Sanchez JC, Weber DJ, Wheeler TL, Ling GS. DARPA-funded efforts in the development of novel brain-computer interface technologies. Journal of Neuroscience Methods. 2015; 244:52-67. http://dx.doi.org/10.1016/j.jneumeth.2014.07.019. PMid:25107852.
Navarro KF. Wearable, wireless brain computer interfaces in augmented reality environments. In: ITCC 2004: Proceedings of the International Conference on Information Technology: Coding and Computing. IEEE; 2004. Vol. 2, p. 643-7. http://dx.doi.org/10.1109/ITCC.2004.1286726.
Nicolas-Alonso LF, Gomez-Gil J. Brain computer interfaces, a review. Sensors. 2012; 12(2):1211-79. http://dx.doi.org/10.3390/s120201211. PMid:22438708.
Pereira JR, Reis AM, Magalhães Z. Neuroanatomia funcional. Anatomia das áreas activáveis nos usuais paradigmas em ressonância magnética funcional. Acta Medica Portuguesa. 2003; 16(3):107-16. PMid:12868388.
Somervuo P, Kohonen T. Self-organizing maps and learning vector quantization for feature sequences. Neural Processing Letters. 1999; 10(2):151-9. http://dx.doi.org/10.1023/A:1018741720065.
Wolpaw JR, Birbaumer N, McFarland DJ, Pfurtscheller G, Vaughan TM. Brain-computer interfaces for communication and control. Clinical Neurophysiology. 2002; 113(6):767-91. http://dx.doi.org/10.1016/S1388-2457(02)00057-3. PMid:12048038.
Authors
Leandro Bueno1*, Teodiano Freire Bastos Filho2
1Instituto Federal do Espírito Santo – IFES, Campus Vitória, Avenida Vitória, 1729, Jucutuquara, CEP 29040-780, Vitória, ES, Brazil.
2Universidade Federal do Espírito Santo – UFES, Campus Goiabeiras, Vitória, ES, Brazil.
240 Res. Biomed. Eng. 2015 September; 31(3): 232-240