Member State Competitiveness, performance and policies: reinforcing competitiveness

McKinsey Global Institute
A sector view on competitiveness
Dr. Jan Mischke
October 23, 2013
CONFIDENTIAL AND PROPRIETARYAny use of this material without specific permission of McKinsey & Company is strictly prohibited
OECDWorkshop “Understanding productivity growth”
McKinsey & Company | 1
Contents
▪ The (non-) importance of sector mix
▪ A sector view on competitiveness
McKinsey & Company | 2
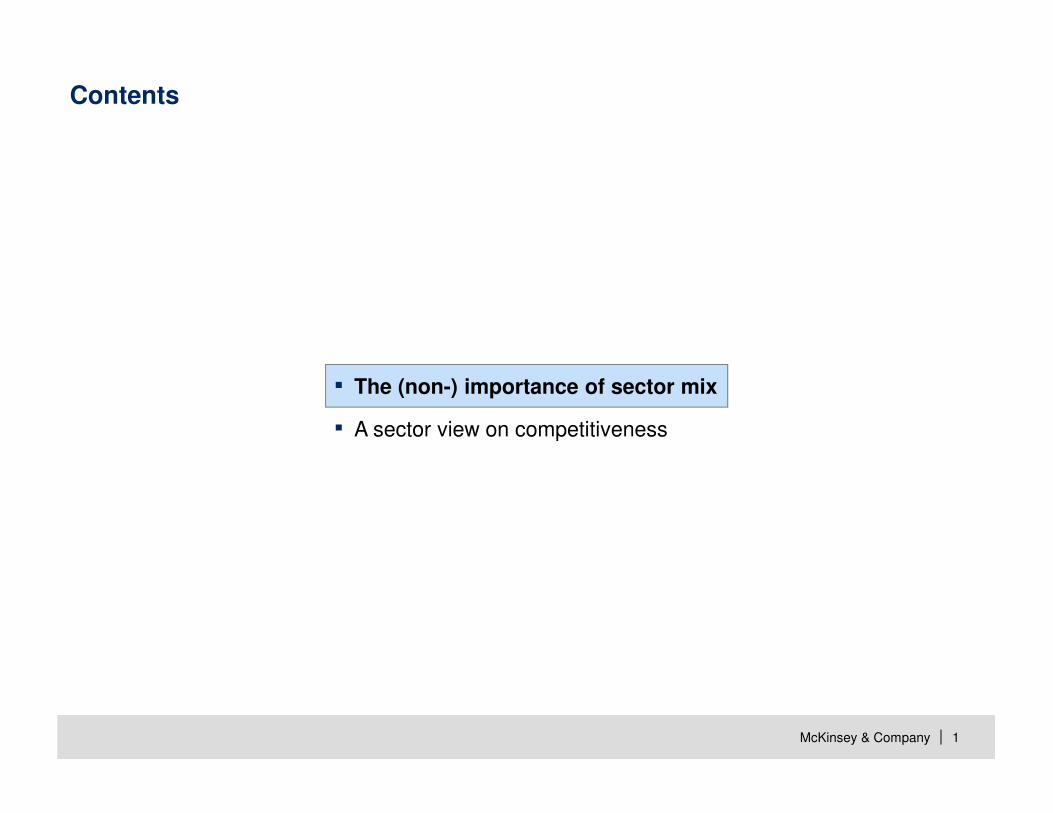
Sector performance, rather than sector mix, is the main reason for differences in productivity growth
Productivity growthLabor productivity growth% per year, 1995–2005
Productivity levelLabor productivity gap vis-à-vis the United States1
PPP 2005 $/worked hour
SOURCE: EU KLEMS; McKinsey Global Institute analysis
1.6
1.9
2.3
0.4
1.5
1.6
0.8
0.4
4.1
2.8
1.6
1.7
2.1
1.0
1.2
1 Excluding mining, real estate, education, health and other public goods.2 Calculated on the highest level of available sector granularity.
Mix effect2
Within contribution2
9
-2
13
24
1
-18
14
1
22
5
7
5
2
-5
11

McKinsey & Company | 4
Contents
▪ The (non-) importance of sector mix
▪ A sector view on competitiveness
– Manufacturing
– Tradable services
– Domestic services
– Public sector

McKinsey & Company | 5
0
5
10
15
20
25
30
35
40
Manufacturing employment% of total employment
10,000 20,0000 30,000 40,000
GDP per capita2012 PPP-adjusted EKS dollars
50,000
Manufacturing employment is not a meaningful indicator for competitiveness, as it follows an inverted-U pattern
Germany
United States
SwedenTaiwan
United KingdomMexico
India South Korea
Japan
SOURCE: Total Economy Database, The Conference Board

McKinsey & Company | 6
8
10
12
14
16
18
20
22
24
UK
Sweden
Germany
France
200720051995 2000
USA
Among advanced economies, Germany and Sweden maintained a comparatively high share of manufacturing
SOURCE: OECD; Eurostat (for Latvia and Lithuania); McKinsey Global Institute analysis
Manufacturing share of GDP%
McKinsey & Company | 7
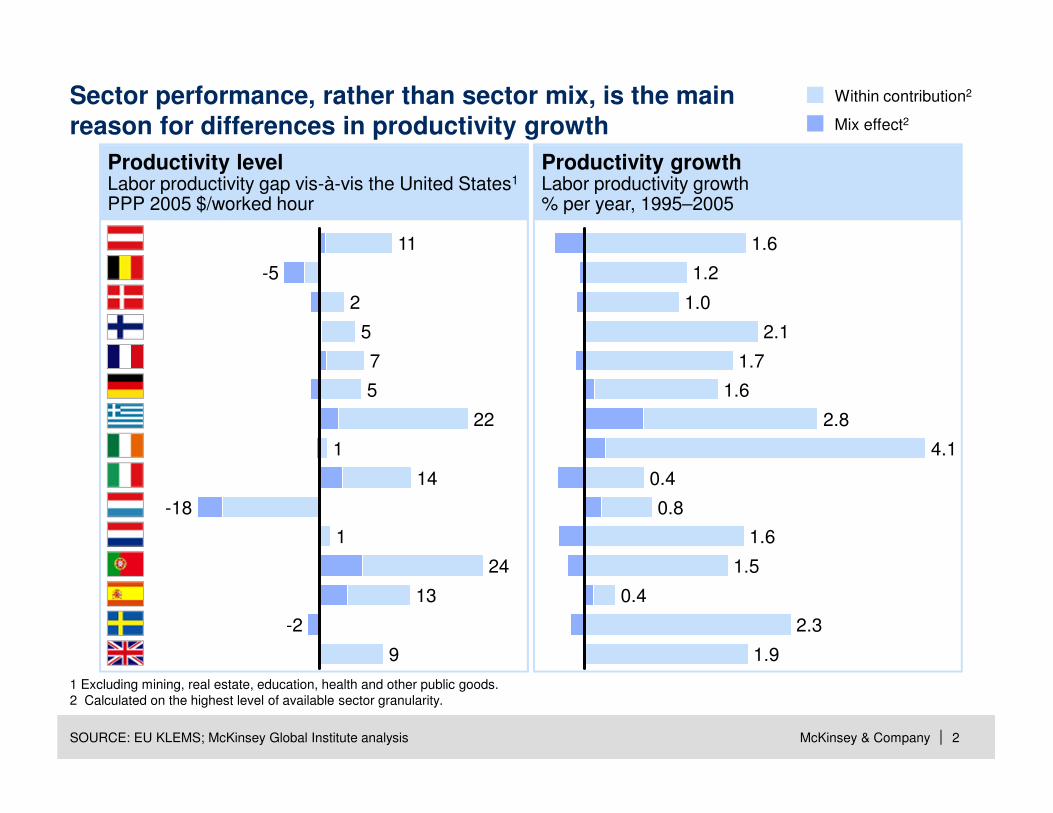
Attributes of Germany’s and Sweden’s competitiveness reflectpolicy but also company decisions
SOURCE: McKinsey Global Institute
Tailwind from weak currency; wage restraint and favorable employer-union relationship
Focus on high value activities in global supply chains
Internationalization on the back of strong MNCs
Strong vocational training and high skilled engineers
R&D, innovation, premium positioning
Exposure to high-growth segments with demand from EMs
Attribute SwedenGermany
Attribute in economy
Yes
To some extent
Strong supply chains and clusters, good infrastructure
Pro
ductivity
Costs
Glo
baliz
ation
McKinsey & Company | 8
Furniture, jewelry, toys, other
Textiles, apparel, leather
Medical, precision, and optical
Semiconductors and electronics
Computers and office machinery
Basic metals
Mineral-based products
Paper and pulp
Refined petroleum, coke, nuclear
Wood products
Printing and publishing
Food, beverage, and tobacco
Fabricated metal products
Rubber and plastics products
Machinery, equipment, appliances
Electrical machinery
Other transport equipment
Motor vehicles, trailers, parts
Chemicals
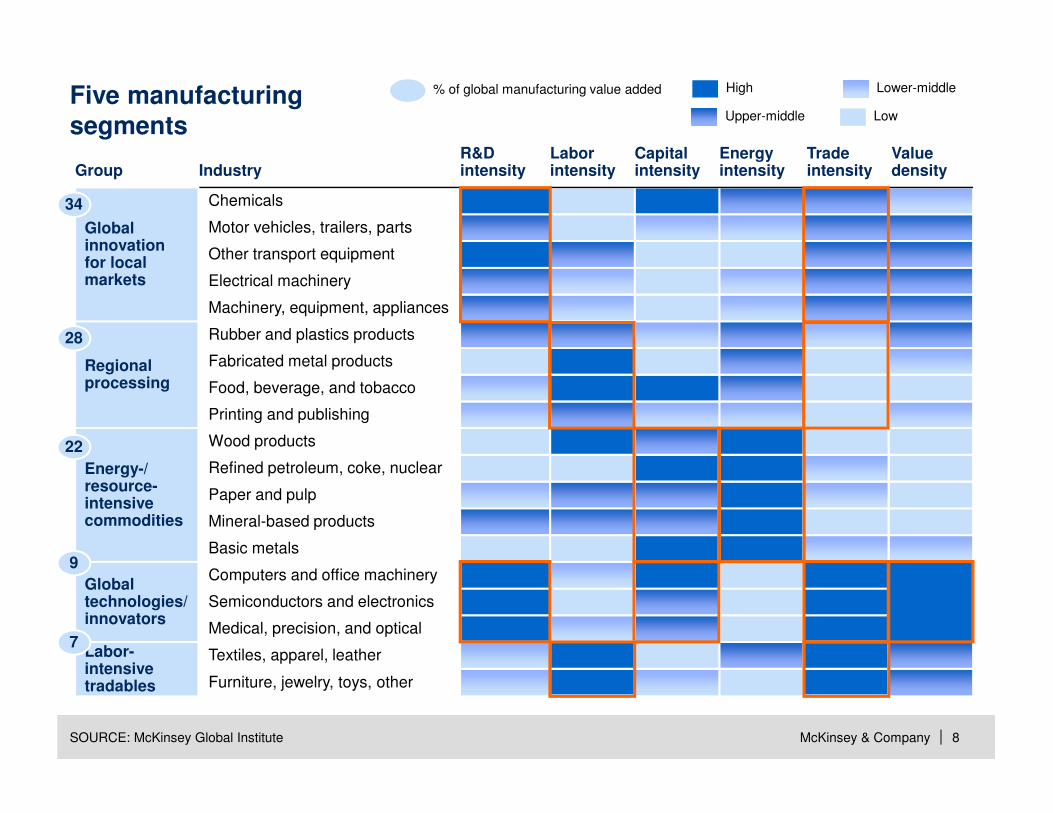
Five manufacturingsegments
High
Upper-middle
Lower-middle
Low
% of global manufacturing value added
GroupValue density
Trade intensity
Energy intensity
Capital intensity
Labor intensity
R&D intensityIndustry
Labor-intensive tradables
Global technologies/ innovators
Energy-/ resource-intensive commodities
Regional processing
Global innovation for local markets
7
9
22
28
34
SOURCE: McKinsey Global Institute

McKinsey & Company | 9
Different trade regional patterns exemplified by Southern European strength in labor-intensive tradables vs. Continental European strength in Global innovation for local markets
Global technologies/innovators
-3
Energy- and resource-intensive commodities
22
Regional processing -4
Global innovationfor local markets
15
Labor-intensivetradables
-1
Net exports, 2011EUR billion
Nordics1 Southern2 Continental3 UK & Ireland 12 NMS4
5
22
-13
-10
-9
-36
-2
28
59
280
3
-4
-5
-5
19
-24
-20
30
-8
-34
SOURCE: Eurostat
1 Sweden, Finland, Denmark; 2 Greece, Spain, Italy, Portugal, 3 Germany, Austria, Luxemburg, Belgium, France, Netherlands; 4 Poland, Czech Republic, Cyprus, Latvia, Lithuania, Slovenia, Slovakia, Estonia,
Hungary, Malta, Bulgaria, Romania

McKinsey & Company | 10
Contents
▪ The (non-) importance of sector mix
▪ A sector view on competitiveness
– Manufacturing
– Tradable services
– Domestic services
– Public sector

McKinsey & Company | 11
Mature economies run large and increasing trade surpluses in business and financial services
SOURCE: OECD; McKinsey Global Institute analysis
-0.15
-0.10
-0.05
0
0.05
0.10
0.15
0.20
0.25
0.30
0.35
0.40
Other services
Travel
Transportation
Royalties and license fees1
Business services
Financial services
2008042000971994
1 Significantly influenced by tax optimization strategies.
% of GDP; nominal
Service net exports of mature economies
McKinsey & Company | 12
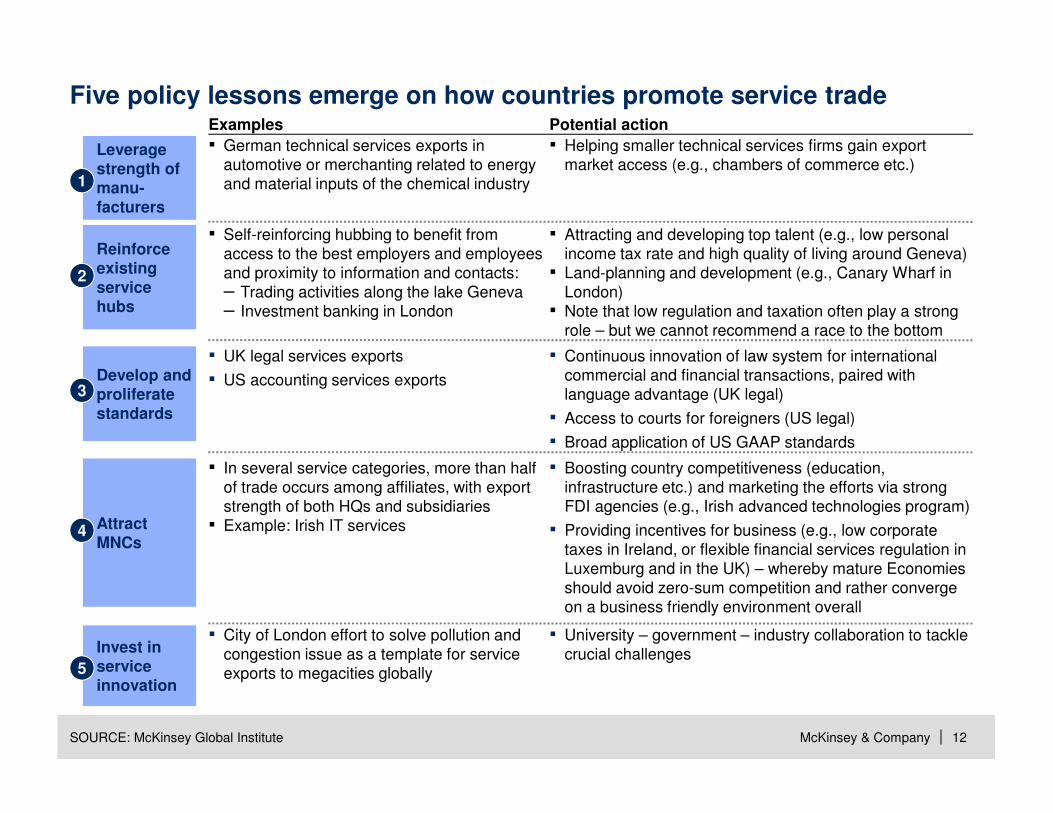
Five policy lessons emerge on how countries promote service trade
▪ German technical services exports in automotive or merchanting related to energy and material inputs of the chemical industry
▪ Self-reinforcing hubbing to benefit from access to the best employers and employees and proximity to information and contacts:– Trading activities along the lake Geneva– Investment banking in London
Leverage strength of manu-facturers
1
Reinforce existing service hubs
2
Examples
▪ City of London effort to solve pollution and congestion issue as a template for service exports to megacities globally
Invest in service innovation
5
▪ UK legal services exports
▪ US accounting services exportsDevelop and proliferate standards
3
▪ In several service categories, more than half of trade occurs among affiliates, with export strength of both HQs and subsidiaries
▪ Example: Irish IT servicesAttract MNCs
4
▪ Helping smaller technical services firms gain export market access (e.g., chambers of commerce etc.)
▪ Attracting and developing top talent (e.g., low personal income tax rate and high quality of living around Geneva)
▪ Land-planning and development (e.g., Canary Wharf in London)
▪ Note that low regulation and taxation often play a strong role – but we cannot recommend a race to the bottom
Potential action
▪ University – government – industry collaboration to tackle crucial challenges
▪ Continuous innovation of law system for international commercial and financial transactions, paired with language advantage (UK legal)
▪ Access to courts for foreigners (US legal)
▪ Broad application of US GAAP standards
▪ Boosting country competitiveness (education, infrastructure etc.) and marketing the efforts via strong FDI agencies (e.g., Irish advanced technologies program)
▪ Providing incentives for business (e.g., low corporate taxes in Ireland, or flexible financial services regulation in Luxemburg and in the UK) – whereby mature Economies should avoid zero-sum competition and rather converge on a business friendly environment overall
SOURCE: McKinsey Global Institute

McKinsey & Company | 13
Contents
▪ The (non-) importance of sector mix
▪ A sector view on competitiveness
– Manufacturing
– Tradable services
– Domestic services
– Public sector
McKinsey & Company | 14SOURCE: McKinsey Global Institute
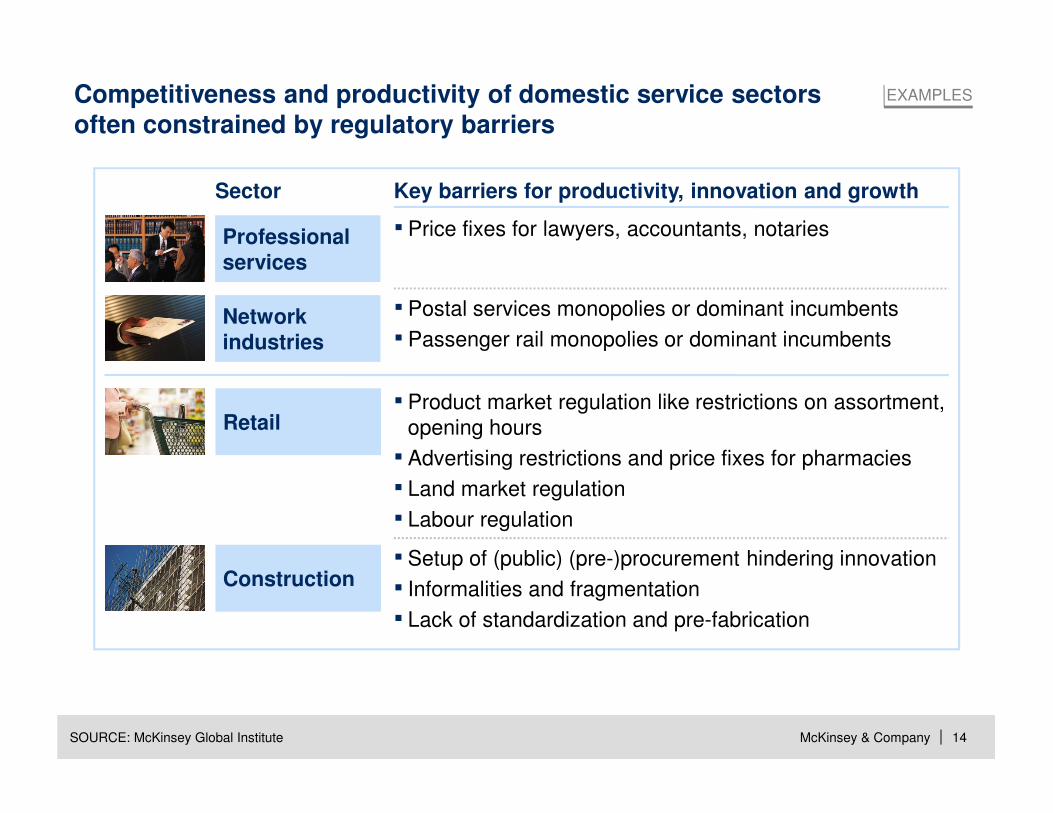
EXAMPLES
Key barriers for productivity, innovation and growthSector
▪ Product market regulation like restrictions on assortment, opening hours
▪ Advertising restrictions and price fixes for pharmacies
▪ Land market regulation
▪ Labour regulation
Retail
▪ Setup of (public) (pre-)procurement hindering innovation
▪ Informalities and fragmentation
▪ Lack of standardization and pre-fabrication
Construction
▪ Price fixes for lawyers, accountants, notariesProfessional services
▪ Postal services monopolies or dominant incumbents
▪ Passenger rail monopolies or dominant incumbentsNetwork industries
Competitiveness and productivity of domestic service sectors often constrained by regulatory barriers

McKinsey & Company | 15
Key changes Impact
Sweden achieved high productivity growth in retail after comprehensive reforms
Factors explaining productivity development
Eased zoning laws
▪ Influence of municipalities on store type decisions was reduced
Shiftingindustrystructure
▪ Growth of large-scale store formats and shopping centers, triggered by zoning changes
▪ Trend to integrated chains like IKEA or H&M, creating scale advantages in purchasing, supply chain, store management, and marketing
▪ Growth of private label products has increased margins as retailers capture larger part of the value chain
Increasedcompetition
▪ Continued growth of ‘category killers’ (specialized chains) who put scale pressures on existing stores
▪ Increased share of highly productive formats, e.g., discounters
▪ New market entrants, e.g., discounters▪ New channels like internet shopping
Advanced IT usage
▪ Use of ICT has significantly improved supply chain and allowed for improved assortment and inventory management
5
2
3
SwedenEUUS
SOURCE: EU KLEMS, McKinsey Global Institute; team analysis
Productivity levelIndex: 100 = US 2005
Productivity growthCAGR 1995-2005 (%)
RETAIL EXAMPLE
75 114100
McKinsey & Company | 16
Contents
▪ The (non-) importance of sector mix
▪ A sector view on competitiveness
– Manufacturing
– Tradable services
– Domestic services
– Public sector
McKinsey & Company | 17
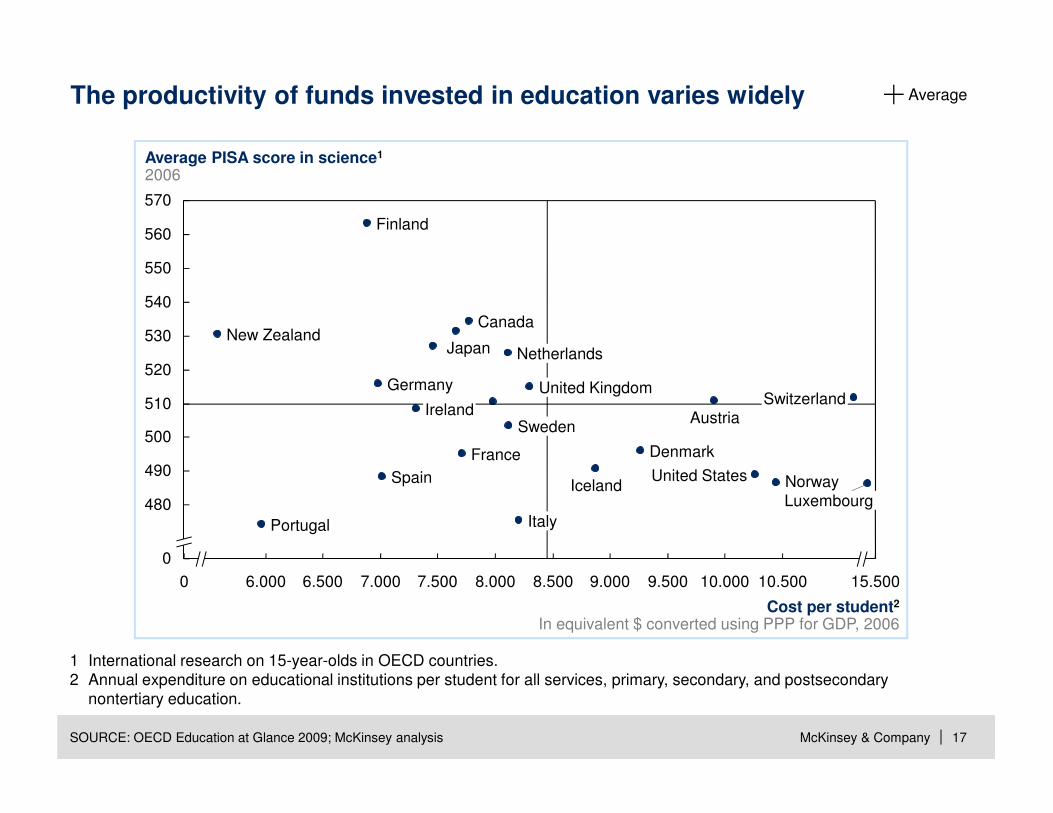
The productivity of funds invested in education varies widely
510
500
490
Average PISA score in science1
2006
0
Cost per student2
In equivalent $ converted using PPP for GDP, 2006
15.50010.50010.0009.500
570
560
550
480
540
530
9.0008.5008.0007.5007.0006.5006.0000
United States
United KingdomSwitzerland
Sweden
Spain
Portugal
Norway
New ZealandNetherlands
Luxembourg
Japan
Italy
Ireland
Iceland
Germany
France
520
Finland
Denmark
Canada
Austria
1 International research on 15-year-olds in OECD countries.2 Annual expenditure on educational institutions per student for all services, primary, secondary, and postsecondary
nontertiary education.
Average
SOURCE: OECD Education at Glance 2009; McKinsey analysis
McKinsey & Company | 18
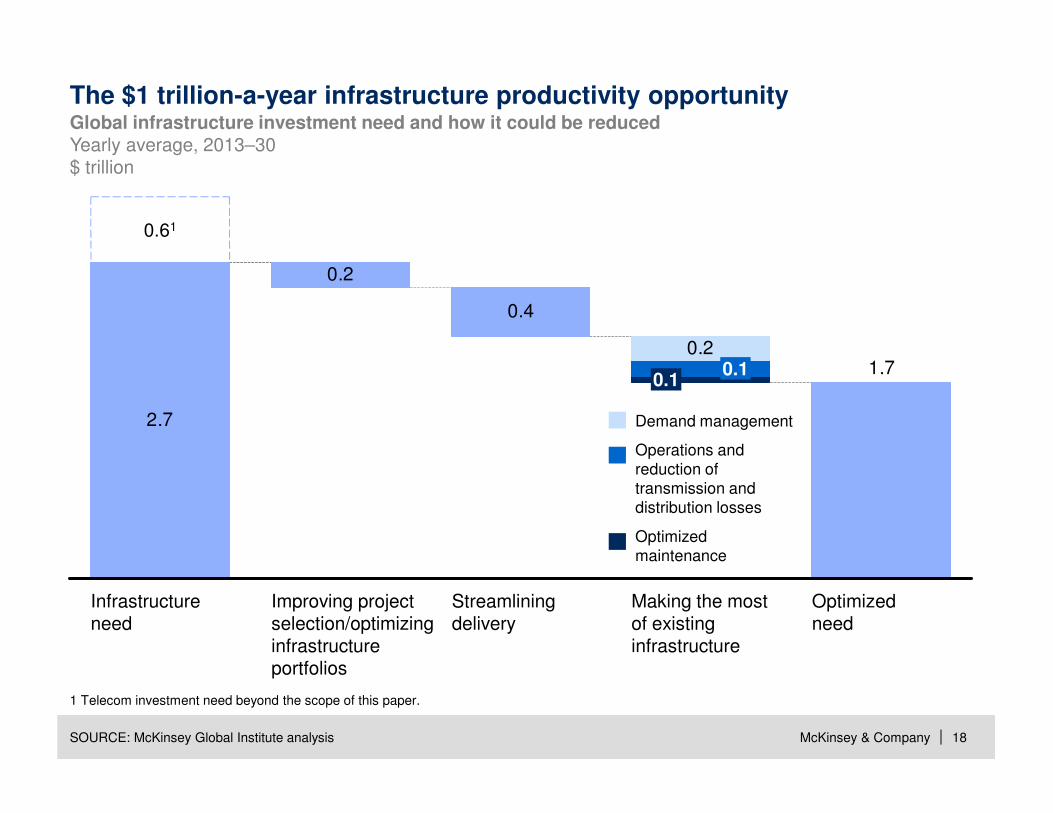
2.7
0.2
0.4
1.70.2
Optimizedneed
Making the most of existing infrastructure
0.10.1
Streamliningdelivery
Improving project selection/optimizing infrastructure portfolios
Infrastructureneed
0.61
Global infrastructure investment need and how it could be reducedYearly average, 2013–30$ trillion
The $1 trillion-a-year infrastructure productivity opportunity
SOURCE: McKinsey Global Institute analysis
1 Telecom investment need beyond the scope of this paper.
Demand management
Operations and reduction of transmission and distribution losses
Optimized maintenance