A Scenario-Based Framework for Lake Management Plans: A ... · within Jefferson and St. Lawrence...
113
A Scenario-Based Framework for Lake Management Plans: A Case Study of Grass Lake & A Management Plan for Grass Lake Owen Zaengle Occasional Paper No. 49 State University of New York College at Oneonta
Transcript of A Scenario-Based Framework for Lake Management Plans: A ... · within Jefferson and St. Lawrence...

A Scenario-Based Framework for Lake Management Plans: A Case Study of Grass Lake & A Management Plan for Grass Lake Owen Zaengle
Occasional Paper No. 49 State University of New York College at Oneonta

OCCASIONAL PAPERS PUBLISHED BY THE BIOLOGICAL FIELD STATION
No. 1. The diet and feeding habits of the terrestrial stage of the common newt, Notophthalmus viridescens (Raf.). M.C. MacNamara, April 1976
No. 2. The relationship of age, growth and food habits to the relative success of the whitefish (Coregonus clupeaformis) and the cisco (C. artedi) in Otsego Lake, New York. A.J. Newell, April 1976.
No. 3. A basic limnology of Otsego Lake (Summary of research 1968-75). W. N. Harman and L. P. Sohacki, June 1976. No. 4. An ecology of the Unionidae of Otsego Lake with special references to the immature stages. G. P. Weir, November 1977. No. 5. A history and description of the Biological Field Station (1966-1977). W. N. Harman, November 1977. No. 6. The distribution and ecology of the aquatic molluscan fauna of the Black River drainage basin in northern New York. D. E
Buckley, April 1977. No. 7. The fishes of Otsego Lake. R. C. MacWatters, May 1980. No. 8. The ecology of the aquatic macrophytes of Rat Cove, Otsego Lake, N.Y. F. A Vertucci, W. N. Harman and J. H. Peverly,
December 1981. No. 9. Pictorial keys to the aquatic mollusks of the upper Susquehanna. W. N. Harman, April 1982. No. 10. The dragonflies and damselflies (Odonata: Anisoptera and Zygoptera) of Otsego County, New York with illustrated keys
to the genera and species. L.S. House III, September 1982. No. 11. Some aspects of predator recognition and anti-predator behavior in the Black-capped chickadee (Parus atricapillus). A.
Kevin Gleason, November 1982. No. 12. Mating, aggression, and cement gland development in the crayfish, Cambarus bartoni. Richard E. Thomas, Jr., February
1983. No. 13. The systematics and ecology of Najadicola ingens (Koenike 1896) (Acarina: Hydrachnida) in Otsego Lake, New York.
Thomas Simmons, April 1983. No. 14. Hibernating bat populations in eastern New York State. Donald B. Clark, June 1983. No. 15. The fishes of Otsego Lake (2nd edition). R. C MacWatters, July 1983. No. 16. The effect of the internal seiche on zooplankton distribution in Lake Otsego. J. K. Hill, October 1983. No. 17. The potential use of wood as a supplemental energy source for Otsego County, New York: A preliminary examination.
Edward M. Mathieu, February 1984. No. 18. Ecological determinants of distribution for several small mammals: A central New York perspective. Daniel Osenni,
November 1984. No. 19. A self-guided tour of Goodyear Swamp Sanctuary. W. N. Harman and B. Higgins, February 1986. No. 20. The Chironomidae of Otsego Lake with keys to the immature stages of the subfamilies Tanypodinae and Diamesinae
(Diptera). J. P. Fagnani and W. N. Harman, August 1987. No. 21. The aquatic invertebrates of Goodyear Swamp Sanctuary, Otsego Lake, Otsego County, New York. Robert J. Montione,
April 1989. No. 22. The lake book: a guide to reducing water pollution at home. Otsego Lake Watershed Planning Report #1. W. N. Harman,
March 1990. No. 23. A model land use plan for the Otsego Lake Watershed. Phase II: The chemical limnology and water quality of Otsego
Lake, New York. Otsego Lake Watershed Planning Report Nos. 2a, 2b. T. J. Iannuzzi, January 1991. No. 24. The biology, invasion and control of the Zebra Mussel (Dreissena polymorpha) in North America. Otsego Lake Watershed
Planning Report No. 3. Leann Maxwell, February 1992. No. 25. Biological Field Station safety and health manual. W. N. Harman, May 1997. No. 26. Quantitative analysis of periphyton biomass and identification of periphyton in the tributaries of Otsego Lake, NY in
relation to selected environmental parameters. S. H. Komorosky, July 1994. No. 27. A limnological and biological survey of Weaver Lake, Herkimer County, New York. C.A. McArthur, August 1995. No. 28. Nested subsets of songbirds in Upstate New York woodlots. D. Dempsey, March 1996. No. 29. Hydrological and nutrient budgets for Otsego lake, N. Y. and relationships between land form/use and export rates of its
sub -basins. M. F. Albright, L. P. Sohacki, W. N. Harman, June 1996. No. 30. The State of Otsego Lake 1936-1996. W. N. Harman, L. P. Sohacki, M. F. Albright, January 1997. No. 31. A self-guided tour of Goodyear Swamp Sanctuary. W. N. Harman and B. Higgins (Revised by J. Lopez),1998. No. 32. Alewives in Otsego Lake N. Y.: A comparison of their direct and indirect mechanisms of impact on transparency and
Chlorophyll a. D. M. Warner, December 1999. No.33. Moe Pond limnology and fish population biology: An ecosystem approach. C. Mead McCoy, C. P. Madenjian, V. J. Adams,
W. N. Harman, D. M. Warner, M. F. Albright and L. P. Sohacki, January 2000. No. 34. Trout movements on Delaware River System tail-waters in New York State. Scott D. Stanton, September 2000. No. 35. Geochemistry of surface and subsurface water flow in the Otsego lake basin, Otsego County New York. Andrew R.
Fetterman, June 2001. No. 36 A fisheries survey of Peck Lake, Fulton County, New York. Laurie A. Trotta. June 2002. No. 37 Plans for the programmatic use and management of the State University of New York College at Oneonta Biological Field
Station upland natural resources, Willard N. Harman. May 2003. Continued inside back cover Annual Reports and Technical Reports published by the Biological Field Station are available at:
http://www.oneonta.edu/academics/biofld/publications.asp

A Scenario-Based Framework for Lake Management Plans: A Case Study of Grass Lake & A Management Plan for Grass Lake Owen Zaengle
Biological Field Station, Cooperstown, New York bfs.oneonta.edu
STATE UNIVERSITY COLLEGE
AT ONEONTA

i
The information contained herein may not be reproduced without permission of the author(s) or the SUNY Oneonta
Biological Field Station

ii
Table of Contents List of Figures ................................................................................................................................ iii Introduction ..................................................................................................................................... 1 Literature Review ............................................................................................................................ 1
Management ................................................................................................................................ 1 Uncertainty .................................................................................................................................. 2 Approaches to Management ........................................................................................................ 3 Toward post-normal science. ....................................................................................................... 4 Scenario Planning ........................................................................................................................ 5 Applying Scenario Planning to management plans: .................................................................... 5
Methods: .......................................................................................................................................... 6 Framework ................................................................................................................................... 6 Compiling pre-existing data ........................................................................................................ 8 Water quality monitoring ............................................................................................................. 8 Chlorophylla ................................................................................................................................. 8 Aquatic Plant Survey. .................................................................................................................. 9 Calcium survey ............................................................................................................................ 9 Alkalinity sampling ................................................................................................................... 10 Fisheries Survey ......................................................................................................................... 10 Stakeholder Surveys .................................................................................................................. 11 Use Mapping .............................................................................................................................. 12 Scenarios .................................................................................................................................... 12
Results: .......................................................................................................................................... 12 Management Plan ...................................................................................................................... 12
Discussion: .................................................................................................................................... 13 Starting out ................................................................................................................................. 13 Concerning Scenarios ................................................................................................................ 13 Concerning management options. ............................................................................................. 15 Concerning timelines and goals. ................................................................................................ 16 Other thoughts. .......................................................................................................................... 16 The role of the lake manager ..................................................................................................... 17
Conclusion: .................................................................................................................................... 17 References: .................................................................................................................................... 19 Appendix A: Grass Lake User Survey .......................................................................................... 22 Appendix B: Scenario Survey ....................................................................................................... 26 A Management Plan for Grass Lake……………………………………………………………..28

iii
List of Figures Figure 1. Framework for management .......................................................................................................... 7 Figure 2. Sampling locations for 2013 calcium survey ............................................................................... 10 Figure 3. Sample locations for electrofishing survey 2014 ......................................................................... 11 Figure 4. Scenario Funnel. from Tempe and Scheepers 2003. .................................................................... 14

1
Introduction Grass Lake is a small (173 hectare) public lake in northern New York, in the towns of
Theresa and Rossie in St. Lawrence and Jefferson Counties. The lake exists within a small watershed in a rural area. There are approximately 30 lakeside camps, the majority of which are only occupied during the summer month. Grass Lake has as a state boat launch on the lake which is under the purview of the New York State Department of Environmental Conservation (NYSDEC). The Grass Lake Association is a small organization with very limited resources. It is comprised of lakeside property owners, approximately 31 households, whose stated purpose is:
….to provide care, protection, maintenance, purity and conservation of the Grass Lake within Jefferson and St. Lawrence Counties and its adjacent areas, as well as plant life, wildlife and the ecological system of that area. To promote, encourage, sponsor and conduct activities that would educate and inform property owners in the area and general public and governmental agencies on topics and issues relating to the above purpose. To promote, maintain a spirit of cooperation and good fellowship among the residents of the Lake. (Constitution of Grass Lake Association, Inc. 2009)
Not all lakeside residents are members of the lake association, and within the lake
association there are varying degrees of concern for and awareness of the main issues concerning Grass Lake.
Grass Lake is a prime example of a social-ecological linked system; a system in which social systems (technology, economics, culture, world-views, etc.) and ecological systems (biologic, geologic, chemical, etc.) are inextricably connected (Berkes and Folke 1998). Like all social-ecological linked systems, Grass Lake exists within a context of high uncertainty and conflicting purposes. In 2012, the Grass Lake association in accordance with their stated purpose pursued a lake management plan from the SUNY Oneonta Lake Management Program. This document is both the story and results of that planning process.
Literature Review Management
Management can be defined as a direct action that is carried out in order to achieve a goal or objective. Natural resource management is any management that relates to an environmental resource; such as water, fish, silviculture, agriculture, etc. Some of the earliest ideas of natural resource management in the United States developed in the early 19th century. In 1847, George Perkins Marsh, a congressman from Vermont, delivered a speech calling for a “better economy in the management of our forest lands” (Dorman 1998). Marsh’s call for wiser use of forest resources was in direct response to the rapid and unchecked deforestation of New England. This ideal of conservation management continued to drive the country to develop management systems, including the creation of National Forests (Forest Reserve Act of 1891), Wildlife Refuges (Roosevelt executive order 1903), National Parks, and the Environmental Protection
2
Agency. Responsibility for the management of natural resources, such as lakes, often falls to those who live on/around or use the resource. This is especially the case on smaller lakes. This sense of responsibility and concern for the local environment causes members of the community to form grassroots organizations, such as lake associations.
Today, management plans are a common tool used in natural resource management. A management plan is a document that lays out objectives and the strategies or actions needed to meet those objectives. Though there is not set formula for management plans they often contain a statement of prioritized objectives, overview/assessment of a system, management recommendations or action plans, some way to measure progress and success, as well as monitoring and funding strategies (EPA 2005, Demers et al. 2014).
Management plans are common in large government agencies (e.g., BLM 2011) as well as small non-profit organizations. The process of drafting a management plan in a large government agency is drastically different than when it is done by a small consulting firm for a small non-profit organization. Historically, management plans used by small organizations have been resource based, separating the resource from its environment (i.e. manage the trees but not the forest, manage the fish but not the lake). As the scientific community learns that resources are intimately connected to their environment there is a need to shift toward ecosystem management (Grumbine 1994); i.e., a shift from fisheries management to lake management. These same innumerable and complex connections that characterize ecosystems also limit our understanding of these systems. Predictions of how an ecosystem will function within a given timeframe are inherently uncertain. That uncertainty is compounded when these ecological uncertainties are linked with social systems. To remain relevant to contemporary issues, systems management and management planning must find new ways to embrace and address this uncertainty.
Uncertainty It is widely accepted that high uncertainty exists within linked social-ecological systems
(Funtowiscz and Ravetz 1993, Holling 2001, and Carpenter 2002). Carpenter (2002) breaks down uncertainty into two types; reducible and irreducible. Reducible uncertainty encompasses all that is unknown about a system but is within the limits of what is able to be known. Sources of this uncertainty are low quality data or lack of data. Rist et al (2013) refers to these as ecological uncertainties, defining them as “lack of knowledge about the ecological system being managed.”
Irreducible uncertainties are outside the limits of knowing and the realm of control and
prediction. These uncertainties arise from unknown future distribution of forces that shape a system, such as human demography, climate change, and economics (Carpenter 2002). Human behavior/worldviews and conflicts between stakeholders increase these irreducible uncertainties, and incorporate certain ethical uncertainties into the mix. The traditional tools of science are not able to deal with these uncertainties.

3
Approaches to Management As natural resource/ecosystem management theory has matured there have been shifts in
the relationships between management and uncertainty. The default mode of action in resource management is command and control management. The command and control approach ignores the inherent high stakes/high uncertainty of environmental systems. The command and control approach assumes clear, simple problems that require straightforward approaches. Examples of the command and control approach to natural resource management and its shortcomings abound;
We control agricultural pests through herbicides and pesticides; we convert natural, multi-species, variable-aged forests into monoculture, single-aged plantations; we hunt and kill predators to produce a larger, more reliable supply of game species; we suppress fires and pest outbreaks in forests to ensure a steady lumber supply; we clear forests for pasture development and steady cattle production, and so forth… When unanticipated environmental problems then arise, the a priori expectation of certainty is not met and results in surprise and crisis – chemical pollution and erosion from monocultures, loss of biological diversity from tree farms, irruption of herbivore populations after predator removal, conflagrations and property loss when fires finally erupt, insect pest outbreaks when spraying stops, and pollution and erosion from grazing. (Holling and Meffe 1996). As scientists were met with the “surprises” and “crises” resulting from a command and
control approach the adaptive management approach was developed. Adaptive management (Holling 1978, Walters 1986) attempts to manage uncertainty through a cyclical learning management process. Adaptive management identifies problems and goals; implements strategies; monitors the success of the strategies; and then returns to the beginning of the cycle with the experience and knowledge of previous iterations. Adaptive management is not simply a “trial and error approach”, but deals with uncertainty through understanding actions relationships to outcomes, and a continual learning through doing (Duncan and Wintle 2008). Adaptive management has been met with widespread acceptance throughout the management community and is the most prevalent approach in professional management applications to date. The traditional format of the management plan readily lends itself to the command and control approach through laying out focused goals and actions to meet those goals. Adaptive management can be integrated into a management plan through advocating for monitoring programs and reassessment. Management plans have been called “living documents” that need to be regularly revised to maintain relevance to the system and stakeholders (EPA 2005). Within this context, there is little difference between what an adaptive management type plan look like during a single iteration and what a command and control type management plan looks like. Despite its acknowledgement of uncertainty, there are certain situations in which adaptive management struggles as a management approach (Rist et al. 2013). The adaptive management approach can only deal with those reducible, or ecological, uncertainties. When dealing with

4
social-ecological linked system in which those irreducible uncertainties are high another approach is needed.
Toward post-normal science. Funtowicz and Ravetz (1993) outline several contexts in which questions are asked, the
types of uncertainties that exist within these contexts, and what problem solving approaches are appropriate in answering these questions. (1) In the context core/applied science uncertainties are technical and are dealt with through standard methods and operating procedures. (2) In the context of professional consultancy uncertainties are methodological and are dealt with through personal judgement. Funtowicz and Ravetz (1993) state: “in professional consultancy there can be no simple, objective criteria, or process for quality assurance (beyond simple competence).” (3) They suggest a new context – post-normal science. Within the context of post-normal science uncertainties are epistemological/ethical and must be dealt with through an ‘extension of the peer community’ involved in management policy and decisions. What Carpenter (2002) refers to as irreducible uncertainty - outside the limits of knowing and the realm of control and prediction - includes what Funtowicz and Ravetz (1993) call epistemological/ethical uncertainty. Lakes are a prime example of social-ecological linked systems that inherently have a large number of irreducible uncertainties. In these systems, it is therefore the role of the lake manager to act within the context of what Funtowicz and Ravetz (1993) term “post-normal science.” In the post-normal science approach -
uncertainty is not banished but is managed, and values are not presupposed but are made explicit. The model for scientific argument is not a formalized deduction but an interactive dialogue. The paradigmatic science is no longer one in which location (in place and time) and process are irrelevant to explanations. The historical dimension, including reflection on humanity’s past and future, is becoming an integral part of a scientific characterization of Nature (Funtowicz and Ravetz 1993).
Within the conflicting purposes and irreducible uncertainties that characterize post-
normal science there is a need to extend the “peer-communities” involved in policy decisions in order to maintain quality assurance. All social-ecologically linked systems, such as lakes, should be managed within the context of post-normal science.
How managers have approached lakes has shifted. Historically, natural resources managers had approached social-ecologically linked systems within the context of applied science; this approach does not acknowledge the irreducible uncertainties, seeing uncertainty as merely technical. This approach looks much like the command-and-control approach. Today, lakes are often approached within the context of professional consultancy. This approach acknowledges the reducible uncertainties, but does little to deal with those irreducible uncertainties; this approach looks much like adaptive management. If, however, we acknowledge the irreducible uncertainties inherent in lakes and approach them within the context of post-normal science a more thoughtful, co-operative, and long-term efforts will emerge.

5
Scenario Planning Scenario planning recognizes the conflicting purposes and irreducible uncertainty
inherent in social-ecological linked systems through development of a range of plausible scenarios developed by a diverse group of stakeholders.
Scenario planning is a systematic method for thinking creatively about possible complex and uncertain futures. The central idea of scenario planning is to consider a variety of possible futures that include many of the important uncertainties in the system rather than to focus on the accurate prediction of a single outcome (Peterson et al 2003).
Scenario planning involves a ‘small group of research scientists, managers, policymakers,
and other stakeholders” that, together, (1) identify a focal issue, (2) assess the social/ecological system and the linkages between them, (3) identify alternative futures of the system, (4) build scenarios by transforming alternatives “into dynamic stories by adding a credible series of external forces and actors’ responses”, (4) testing those scenarios for “consistency” and “plausibility”, and (5) screen policies through the scenarios that have been developed ( Peterson et al. 2003). Like adaptive management, scenario planning can be an iterative process that with each iteration redefines the focal point.
Use of scenarios as a tool for management of social-ecological linked systems is becoming widespread. The Millennial Ecosystem Assessment (MA), a United Nations project with a global scope, was established “to help provide the knowledge base for improved decisions and to build capacity for analyzing and supplying this information (MA 2005).” This treatise on ecosystems and human well-being lays out four diverse but plausible global scenarios – ‘plausible pathways into the future’ – to provide insight for managers and policymakers. Scenarios have also been used to explore plausible futures at a smaller scale. A set of scenarios was developed for the Friends of Lake Wingra to explore the future of ecosystem services on Lake Wingra by a team of graduate students (Biggs et al. 2009).
Applying Scenario Planning to management plans: While scenarios are gaining momentum in the field of natural resource management,
most modern management plans still appear to be structured under the command and control approach. Is there a new/better way to write a management plan? Can these ideas of uncertainty and conflicting purposes be integrated into the format of a management plan? How can scenarios be integrated into a management plan for a small lake association? When working within the context of post-normal science, what is the role of the manager in drafting a lake management plan?

6
Methods Framework I developed a framework that incorporated scenarios, uncertainty, and some aspects of
adaptive management (Figure 1). This framework exists within spectrum of management (high-low) and utility (high-low). On the management axis exist all possible management actions and combinations of actions – including the current management actions that are being undertaken by the Grass Lake Association. With the horizontal axis representing time, moving forward through time at a constant level of management the system can change course. The system may improve, it may remain the same, and it may degrade. Within the framework, I measured change as a function of utility, though there are many other measures of change that could be used. The relationship between management level and utility at some point in the future is not linear; the uniqueness and inherent uncertainty of the system make the direction of change unpredictable. This uncertainty in the trajectory of the system is communicated through the shaded cones; these were based on Tempe and Scheepers’ (2003) ‘scenario funnel’. Within this framework, as management increases it is more likely that the system will end up shifting toward the best-case scenario. There is a boundary at the higher end of utility past which the system is no longer acting in its natural function but has become more of an engineered system. These natural system limits operate in two functions. First, they may be directly compared with the concept of reference conditions (European Union 2000). Secondly, they communicate that some management practices could increase utility (e.g. better swimming conditions) they may be outside the scope of naturally occurring conditions within the lake – shifting the lake towards a more engineered system. Vertical lines extending from the horizontal axis of this framework represent points in time; as the system shifts monitoring and re-evaluation should occur on a regular basis. Re-evaluation should be in response to learning and shifting priorities; however a long view of the system should always be kept to the forefront, along with the understanding and acceptance of the uncertainty of the system.
This framework shaped the Management Plan for Grass Lake. All of the work done was
within the context of this framework and the final copy of the Management Plan for Grass Lake was based upon this framework. The following methods were used to determine the current state of the lake and watershed, and identify characteristics of the best case and worst case scenarios.

7
Figure 1. Framework for management

8
Compiling pre-existing data Before meeting with the lake association, I began gathering all the existing data I could
find concerning Grass Lake. The Grass Lake association provided me with what data they had. This included limnological data collected through the Citizens Statewide Lake Assessment Program (CSLAP) 2007-2011, a 2005 dissolved oxygen study done by Jefferson County Soil and Water, and results from a 2006 electrofishing survey by the New York State Department of Environmental Conservation (NYSDEC). Information regarding the Grass Lake Association was also provided, such as the constitution and membership list. Further information regarding the lake was pursued on the internet. Information collected include regional geology maps (Isachsen and Fisher 1970, Caldwell et al. 1986), soils maps (NRCS 2014), Landcover Data (MRLC NLCD 2006), and real property data (Jefferson County Real Property Data 2012, St. Lawrence County Real Property Data 2012), a walleye stocking study (Brooking et al. 2001), and many historical mentions of Grass Lake from various newspapers.
Water quality monitoring In late fall 2012, I began monitoring water quality in Grass Lake. Temperature, pH,
specific conductivity and dissolved oxygen (mg/L and % saturation) were measured using a YSI multiprobe at a center lake sample point (N 44ᵒ 20.123, W 075ᵒ 42.355). Prior to sampling the YSI multiprobe was calibrated as per manufacturer’s instructions; sampling gear was also soaked in hot water (~120 ‘F) or soaked in a salt bath prior in an attempt to prevent the spread of zebra mussels. Readings were taken at 1 meter depth intervals between the surface and bottom (0-15 meters). Water samples were collected at 2 meter intervals from 0-14 meters in depth using a Kemmerer water sampler. Water samples were placed in acid-washed 125 mL bottles, kept on ice while in the field, and preserved with sulfuric acid upon returning to the lab. Transport time between field and lab was approximately 4 hours. Water samples were analyzed for total nitrogen (TN), total phosphorous (TP), and nitrate+nitrite Lachat® QuikChem FIA+ Water Analyzer. Total nitrogen and nitrate+nitrite were found via cadmium reduction method (Pritzlaff 2003) and total phosphorous using ascorbic acid followed by persulfate digestion (Liao and Martin 2001). Sampling was sporadic during fall 2012; beginning January 2013 water quality monitoring was done on a bi-weekly basis during winter and spring months (January-June) and weekly during summer months (July –September). During summer months Temperature, pH, specific conductivity and dissolved oxygen (mg/L and % saturation) were also sampled at a second sample point (N 44ᵒ 20.388, W 075ᵒ 42.573); readings were taken at 1 meter intervals between the surface and bottom (0-6 meters).
Several water samples were collected from an inlet stream on Grass Lake (N 44ᵒ 19.899’, W 075ᵒ 42.413’). This stream is intermittent, thus samples were only taken when there was water present. Otherwise, sample dates are similar to those collected at the center lake point. Samples were subjected to nutrient analysis, by the same method mentioned above.
Chlorophyll a Sporadically throughout the summer months, water samples were taken at 1 meter intervals from 0-8m in depth, and 2 meter intervals from 10-14 meters in depth using a
9
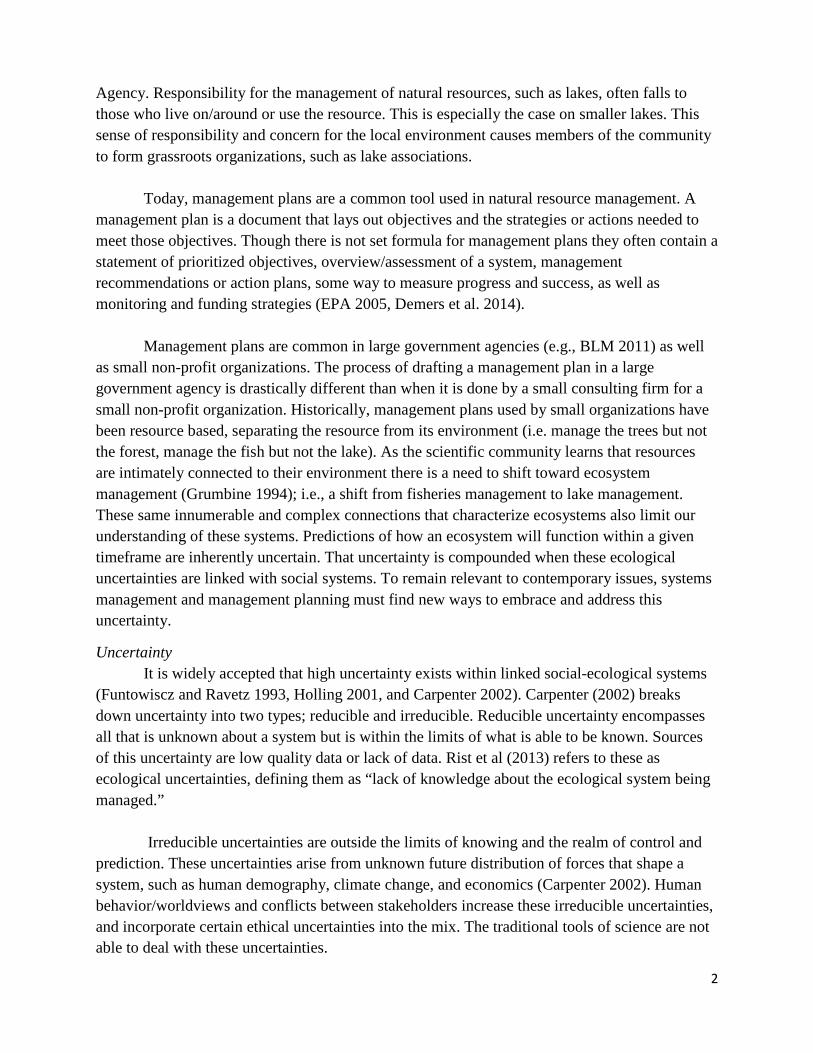
Kemmerer water sampler at the center lake sample point. Using a hand-held vacuum pump 200mL of each sample was filtered through a 47mm Whatman GF/A Glass Micro Fiber Filter. Filters were folded in half and placed into a clean 47mm Millipore petri dish which was then wrapped in aluminum foil and placed in a cooler on ice until return to the lab. Transport time between field and lab was approximately 4 hours. Upon return to the lab filters were placed in a freezer until they could be analyzed. Flourometric analysis of chlorophyll a was carried out according to Levenstein (2011).
Aquatic Plant Survey. An aquatic plant survey was carried out on June 25-26 2013 according to a modified point intercept rake toss method (Madsen 1999). Sample points (N = 73) were spaced throughout the littoral zone of Grass Lake; distance between sample site were determined to be evenly spaced by the sampler during the sampling operation (Figure 2). The south-eastern ‘finger’ of the lake was not sampled during this survey due to restricted access. At each sample point the rake apparatus, as described in Madsen 1999, was tossed twice in random directions. The rake apparatus was then pulled into the boat, plants were identified and separated by species, and the amount-category of each species was noted. After each toss plants were returned to the lake.
Calcium survey Water samples were collected for calcium analysis on August 20, 2013. Samples were
selected from 4 sites in different areas of the lake (Figure 2). Samples were collected using a Kemmerer water sampler and placed in acid-washed plastic bottles. Samples were placed on ice in a cooler and immediately transferred to a 4ᵒ C cooler upon returning to the lab. Transport time between field and lab was approximately 4 hours. Calcium concentration was determined through EDTA titrimetric method (EPA 1983).

10
Figure 2. Sampling locations for 2013 calcium survey.
Alkalinity sampling Water samples were collected for alkalinity analysis several times throughout the
summer. Samples were taken at the center lake site at 2m intervals (0-14m). Samples were collected using a Kemmerer water sampler and placed in acid-washed plastic bottles. Samples were placed on ice in a cooler and immediately transferred to a 4ᵒ C cooler upon returning to the lab. Transport time between field and lab was approximately 4 hours. Alkalinity was determined through a titrimetric method (APHA 1989).
Fisheries Survey A boat electrofishing survey was conducted on Grass Lake on June 19, 2014. Standard
boat electrofishing methods were used (Zale et al. 2012). A Smith-Root electrofishing boat

11
equipped with a 3500-watt generator and a Type VI-A variable voltage pulsator was utilized in this survey (Cornwell 2005). An experienced crew from SUNY Cobleskill manned the boat.
The survey consisted of 5 runs of all-fish collection ranging from 600-900 seconds. Survey locations were selected in order to incorporate the full range of habitat types found in Grass Lake (Figure 3). All collected fish were identified, their length measured on a measuring board, and then returned to the lake.
Figure 3. Sample locations for electrofishing survey, 2014.
Stakeholder Surveys A survey was developed and distributed to lake association members electronically via
email and physically during the spring 2013 lake association meeting (Appendix A). This survey

12
was traditional in format asking about demographics, lake side camps, lake use, and concerns of lake users.
In November 2013, I developed a second survey (scenario survey, Appendix B) and mailed it directly to Grass Lake Association members and all property owners within the watershed. This survey contained three questions/exercises. The respondent was asked to describe their vision of Grass Lake 10 years in the future; best case scenario. In answering this, they were asked to think about how they use the lake and to consider factors influence those uses and how those factors/uses could possibly change. They were asked to complete the same exercise for the worst case scenario. A blank map of Grass Lake was also provided; respondents were asked to identify the areas of the lake which they use, to number them in order of use, and identify how each area is used. They were also asked to identify areas of the lake that they did not use, and identify the reason why they did not use that area. An example was included.
Use Mapping The data gathered from the mapping exercise created use maps. Returned maps were scanned to a pdf file and georeferenced within ArcGIS 10. Polygons were drawn around the areas identified to be used/unused by the respondents. These polygons were then coded; 1 being used for a specific purpose, 0 being not used for a specific purpose. This coding was done for overall use, as well as for the specific uses defined by the respondents. These coded polygon shapefiles were then converted to raster to create a “use raster” for each respondent. The Map Algebra function was then used to ‘add’ each use raster together to create ‘use density maps’, this was done for overall use, as well as specific uses defined by respondents.
Scenarios Narrative responses from the ‘scenario surveys’ were read and major themes/characteristics were coded from these narratives. This was done for both the best-case and worst-case scenario narrative responses. With these coded responses, a best case and worst case scenarios were developed and displayed in graphical form, as sections, to the lake association.
Results Management Plan The result of my work is the Management Plan for Grass Lake. There will be some redundancy in what has been discussed within the introduction and methods section and what is contained within the management plan. The Management Plan for Grass Lake is inserted here, in its entirety, because it is as a whole document the result of all of my work.
13
Discussion Starting out
When I was tasked with writing a management plan for Grass Lake I did not know where to begin. I was excited about the opportunity to study such a unique system and to have my work be directly useful to the Grass Lake Association. Not knowing what else to do, I began acting in the role of the scientist. I started monitoring water quality. During the first year at Grass Lake I focused my time and resources on studying the ecosystem on and around Grass Lake (water quality monitoring, plant survey). I attended the bi-annual Grass Lake association meetings; at these meetings I presented the results of my monitoring, educated the association on lake ecosystems (e.g. oxygen dynamics), and answered questions the association members had. During this time, I realized the concerns of the stakeholders were important and with the help of several lake association members drafted a stakeholder survey, which was then distributed to lake association members. This survey was dispersed to lake association members. There were few responses to this survey (N=8). I continued my routine water quality monitoring as well as conducted an aquatic plant survey on Grass Lake.
This work resulted in Chapter 1. What you Have- an inventory of Grass Lake. This first chapter of the Management Plan for Grass Lake defines a point of reference; describing current conditions – ‘where we are now’. The reference point is not merely ecological in nature; it is encompasses all aspects of the social-ecological linked system. It includes geological, chemical, and biotic characteristics of the lake and watershed; it includes who lives in the watershed, how the lake is used, and what management actions are active. The inclusion of all of this information into a management plan may be unconventional; but it is essential to lay the foundation for building a local knowledge around the lake and to serve as a reference for future management planning.
Scenarios After a calendar year of water quality monitoring and information gathering I transitioned
from data collection to data analysis and then to management recommendations. It was at this point when I began to struggle with the question: how do I make this management plan something that the Grass Lake association can actually use? Given the size and limited resources of the association, how could I make the management plan relevant and practical?
It was around this time when I attended the 2013 North American Lake Management Societies 33rd international symposium in San Diego – ‘Lake Management in an Era of Uncertainty’. A plenary talk by Dr. Alex Horne introduced me to the concept of the ‘scenario funnel’ (Tempe and Scheepers 2003).

14
Figure 4. Scenario Funnel. (from Tempe and Scheepers 2003).
Perhaps due to my own personal feelings of uncertainty on how to proceed with the Management Plan for Grass Lake, I became quite interested in this topic of uncertainty as it applied to natural resources management. It was then when I started to read the literature regarding uncertainty as it related to lake management and management in general. Science for a post-normal age (Funtowicz and Ravetz 1993) argued systems with high decision stakes and high uncertainty required an ‘extension of the peer community’ in policy and management decisions. I recognized that Grass Lake was such a system. Peterson et al. (2003) laid out a method for this ‘extension of the peer community’ that Funtowicz and Ravetz argued for. I was not at a point in my studies where I could switch toward the scenario planning method altogether, due to lack of resources and an impending deadline. However, I wanted to incorporate some aspect of uncertainty and scenario planning into the Management Plan for Grass Lake. This was when the framework for management came into existence. With the image of Tempe and Scheepers’ (2003) ‘scenario funnel’ in my mind and all my experiences and knowledge regarding lake management up to that point I developed this framework. A framework that I could use to structure the Management Plan for Grass Lake. This framework is the crux of my thesis. This framework is an example how scenarios and uncertainty can be incorporated into a management plan.
With poor response to my initial survey, I realized in order to engage the stakeholders I had to expand the peer community even beyond those in the lake association to those within the watershed. I needed a way to get their input and communicate the social-ecological relationship on Grass Lake. This led me to develop the scenario survey.

15
I realized that I could take all of the data collection I had done and utilize it to identify the current state, and past states, of the system. This ‘current state’ could then be compared with the diverging future scenarios as results from the scenario survey returned.
Within this framework, the second chapter of the Management Plan for Grass Lake lays the foundation for thinking about management; asking the reader to confront the concept of uncertainty and offering best case scenarios and worst case scenarios – compared to the current state as laid out in chapter 1. It asks the reader to take the longer view; to look ahead 10 years and envision the lake and how/if it has changed. The framework offers best case and worst case scenarios as common values that most lake association members can support.
The scenario sections depicting current conditions, best-case scenario, and worst case scenario were developed to visually communicate a ‘picture’ of what the lake could look like in the future. The scenarios picked out and highlighted several characteristics of the lake that could possibly change within the next 10 years; the characteristics chosen were based upon the scenario survey responses.
Management options In Chapter 3, I presented those best case scenario characteristics and gave management
actions that could be taken in an attempt to improve those characteristics. When I began this chapter I was still stuck in the mindset of the scientist. I was trying to meet the standards of objectivity that pure/core science demand. In my struggle for objectivity I felt like I was merely transcribing information from a select few sources, and trying to state objectively whether they would be applicable to Grass Lake. However, I came to understand that applicability is subjective. I realized that this was precisely what Funtowicz and Ravetz (1993) were discussing when they stated that “in professional consultancy there can be no simple, objective criteria or process for quality assurance (beyond simple competence).” I was working on Grass Lake, a social-ecologically linked system that had different types of uncertainty associated with it than those uncertainties a scientist would have working in a laboratory. I needed to adjust my role. In this new role, some deviation from the stringent objectivity of the scientist was required. In order to make the management options relevant to Grass Lake and the Grass Lake Association a scientist’s objective approach was not working. In this context of presenting management options I had to act in the context of professional consultancy; I had to rely on my knowledge and technical expertise, my competence as Lake Manager, to present these management options to Grass Lake.
The third chapter of the Management Plan for Grass Lake works within the framework for management; utilizing those characteristics of the best case scenario the third chapter outlines a wide variety of possible steps that could be taken to improve those characteristics. By framing the discussion of management options around the best-case scenario I was able to present a broad spectrum of options that focused on broad characteristics, rather than few options for a focused problem. This allowed me to act the expert, while providing all of the information to the Grass

16
Lake Association for them to decide what they would like to pursue. In a sense, this is an ‘extension of the peer community’ that post-normal science calls for.
Concerning timelines and goals. A timeline communicates a sense of urgency that is needed to move forward with the
management process once the management plan is in place. The fourth chapter laid out a hypothetical timeline of steps that could be taken by the lake association. This involved the transition from broad characteristics to narrow, measurable goals. Goals are a vital part of management. Goals should arise from, and be supported by, the scenarios laid out in chapter 2.
Other thoughts. After sending the lake association a final copy of ‘A Management plan for Grass Lake’ I
attended the lake association meeting in May 2015. At this meeting I was not on the agenda, nor had I prepared anything to say; I was there to answer any question they had regarding the management plan. An association wide discussion on current lake issues ensued – major topics included blue-green algae blooms, the dam on the outlet, and septic tanks. One lake association member moved into the role of champion of the Management Plan for Grass Lake and began to assume the role as ‘educator’. My role shifted toward an ‘expert/mediator’ during this meeting. During the discussion I was called upon on multiple instances to answer technical questions or to voice my ‘professional opinion’ on the matter at hand.
Looking back on this final lake association meeting I feel a sense of accomplishment. When I began this process there were very few in the Grass Lake Association who understood basic limnological concepts; now several association members have a better grasp on how the ecological system functions. During this meeting they also passed a motion to develop a ‘Grass Lake Pledge”; a pledge that lake association members can voluntarily sign pledging their support for improved water quality on Grass Lake through actions such as use of phosphate free products, reduced/no lawn fertilization, and getting septic systems checked. After the lake association meeting had ended several association members signed up to have their systems dye-tested. A water quality committee was also formed at this meeting. Was the Management Plan for Grass Lake what spurred this movement to action? I’d like to think so. If nothing else, the Management Plan for Grass Lake served as a catalyst. It moved people to act; perhaps that’s all a management plan is meant to do. I think in the end the Management Plan for Grass Lake was a success. A foundation has been laid, a reference has been set, and the movement has begun.
The Management Plan for Grass Lake follows this new framework for a management plan; one that incorporates aspects of uncertainty, scenario planning, and adaptive management. The scenario based framework for management plans is a deviation from the traditional format of management plans which readily lends itself to the command and control approach. Shadows of the command and control approach can still be seen within the Management Plan for Grass Lake, as it is the traditional premise of natural resource management. This new framework is just

17
one step towards a re-invention of the conventional management plan for small lakes with small watersheds.
The role of the lake manager The role of the lake manager in drafting a lake management plan shifts throughout the
process. Each role requires a specific skill set. This requires managers to be flexible, sensitive to change, and have a diverse skill set. Each role should be visible within the lake management plan. While writing the Management Plan for Grass Lake I found myself acting in various different roles throughout the process.
Before I began interacting with the Grass Lake Association I began to act in the role of scientist. I researched Grass Lake; I began monitoring water quality and tried to find out everything I possibly could about the Grass Lake. Once I began interacting with the lake association, through bi-annual meetings, I began to act more in the role of educator. As I moved forward with the management plan my role shifted toward that of expert/technical support. In this role I would offer my professional opinion on the issues surrounding Grass Lake, and answer technical questions about management strategies. Near the end of the process I found myself acting in the roles of mediator and organizer. In this role I attempted to facilitate discussions within the Grass Lake Association and organize the Lake association into action.
Each of these roles are echoed within the Management Plan for Grass Lake. The scientist and educator are most visible in chapters 1 and 2 of the Management Plan for Grass Lake. The expert and technical support roles are most visible within chapter 3. The organizer and mediator are seen within chapter 4, however these roles were more active during the meetings of the Grass Lake Association.
Post-normal science calls for an expansion of the ‘peer-community’ involved in decision making. Within this context, a significant task of the lake manager is to get as many stakeholders involved as possible. In drafting the Management Plan for Grass Lake, I involved the Grass Lake Association as well as property owners within the watershed. I made several attempts to get feedback concerning Grass Lake directly from the NYSDEC, but these attempts did not amount to any significant involvement. If I were to do this process again I would try to bring more people/organizations into the planning process, especially into the development of the scenarios.
Conclusion In order to move away from the command-and-control approach of natural resource
management, the format of a management plan must begin to incorporate the concept of uncertainty. Integration of scenarios into a management plan allows these ideas of uncertainty and conflicting purposes to be accepted. One way of integrating scenarios into a lake management plan is through the development of best case and worst case scenarios, with involvement and input from stakeholders. These scenarios can be compared directly to the current state of the lake. Presenting the scenarios to the lake association should be done through

18
a framework that acknowledges uncertainty. Visual representation of these scenarios through ‘sections’ can help communicate these ideas. The framework laid out in this document is one example of how this can be done.
The role of the manager in drafting a lake management plan for a small lake association must be flexible. The manager must fill different roles at different times throughout the drafting process. The manager should be sensitive to the social structure of the organization they are working within and be able to adapt to different roles as needed. The lake manager may need to act in roles such as scientist, educator, expert, technical support, mediator, and organizer.

19
References APHA, AWWA, WPCF. 1989. Standard methods for the examination of water and wastewater,
17th ed. American Public Health Association. Washington, D.C.
Berkes, F. and C. Folke. 1998. Linking social and ecological system: management practices and social mechanisms. Cambridge University Press. Cabridge, U.K.
Biggs, R., M.W Diebel, D. Gilroy, A.M. Kamarainen M.S. Kornis, N.D Preston, J.E. Schmitz, C.K Uejio, M.C. Van De Bogert, B.C. Weidel, P.C. West, D.PM. Zaks, and S.R. Carpenter. 2009. Preparing for the future: teaching scenario planning at the graduate level. Front Ecol Environ.
BLM. 2011. Winters Ranch Management Plan. U.S. Dept. Int. Beruau of Land Mgmt. Carson City, Nevada. DOI-BLM-NV-C020-2009-0001-EA.
Brooking, T.E., J.R. Jackson, A.J. VanDeValk, and L.G. Rudstam. 2002. Factors Affecting Survival of Stocked walleye in New York Lakes: the final year of stocking – performance report 1991-2001. Cornell University. Ithaca, NY.
Caldwell, D.H and others. 1986. Surficial Geological Map of New York. New York State Museum – Geological Survey Map and Chart Series #40.
Carpenter, S.R. 2002. Ecological Futures: building an ecology for the long now. Ecology. 83(8): 2069-2083.
Cornwell, M.D. 2005. Re-introduction of Walleye in Otsego Lake: Re-establishing a fishery and subsequent influences of a top down predator. Occasional Paper No. 40. SUNY Oneonta Biol. Fld. Sta., SUNY Oneonta.
Demers, C., A. Long, and R. Clausen. 2014. What is in a Natural Resource Management Plan? University of Florida. IFAS Extension. SS-FOR-14.
Dorman, R.L. 1998 A word for nature: Four pioneering environmental advocates, 1945-1913. Chapel Hill, University of North Carolina Press. Pg 24.
Duncan, D., and B.A. Wintle. 2008. Towards adaptive management of native vegetation in regional landscapes. Pages 1-7 in C. Pettit, W. Cartwright, I. Bishop, K. Lowell, D. Pullar, and D. Duncan, editors. Landscape Analysis and Visualization. Spatial Models for Natural Resource Management and Planning. Springer-Verlag GmbH, Berlin. http://dx.doi.org/10.1007/978-3-540-69168-6_9.
EPA. 2005. Community-Based Watershed Management: Lessons from the National Estuary
Program. Washington D.C EPA 842-b-05-003.
EPA. 1983. Methods for the analysis of water and wastes. Environmental Monitoring and Support Lab. Office of Research and Development. Cincinnati, OH.

20
European Union (2000) Directive 2000/60/EC of the European Parliament and of the Council of 23 October 2000 establishing a framework for community action in the field of water policy. Off J Eur Commun L327:1–72.
Funtowicz, S.O., and J.R. Ravetz. 1993. Science for the post-normal age. Futures. 25(7) 739-755.
Grumbine, R.E. 1994. What is Ecosystem Management? Conservation Biology. 8(1) 27-38.
Holling, C.S. 1978. Adaptive environmental assessment and management. John Wiley & Son. Chichester.
Holling, C.S. 2001. Understanding the Complexity of Economic, Ecological, and Social Systems. Ecosystems. 4. 390-405.
Holling, C.S. and G.K. Meffe. 1996. Command and Control and the Pathology of Natural Resource Management. Conservation Biology. 10(2) 328-337.
Isachsen, Y.W and D.W. Fisher. 1970. Bedrock Geologic Map of New York. New York State Museum and Science Service Map and Chart Series #15.
Klessig, L., B. Sorge, R. Korth, M. Dresen, and J. Bode. 1994. A model lake plan for a local community. University of Wisconsin, Cooperative Extension. G3606.
Levenstein, A. 2012. Chlorophyll a concentration in Otsego Lake, summer 2011. In 44th Ann. Rept. SUNY Oneonta Biol. Fld. Sta., SUNY Oneonta.
Liao, N. and S. Marten. 2001. Determination of total phosphorous by flow injection analysis colorimetry (acid persulfate digestion method). QuikChem®Method 10-115-01-1-F. Lachat Instruments. Loveland, Colorado.
MA (Millennium Ecosystem Assessment) 2005. Ecosystems and human well-being: scenarios. Washington, DC. Island Press.
Madsen, J. 1999. Point intercept and line intercept method for aquatic plan management. USACE. Aquatic Plan Control Technical Note MI-02.
NRCS. 2015. Web Soil Survey. http://websoilsurvey.nrcs.usda.gov/ Accessed March 2015.
Peterson, G.D, G.S. Cumming, and S.R. Carpenter. 2003. Scenario Planning: a Tool for Conservation in an Uncertain World. Conservation Biology. 17:2 358-366.
Pritzlaff, D. 2003. Determination of nitrate-nitrite in surface and wastewaters by flow injection analysis. QuikChem®Method 10-115-01-1-F. Lachat Instruments. Loveland, Colorado.
Rist, L., A. Felton, L. Samuelsson, C. Sandström, and O. Rosvall. 2013. A new paradigm for adaptive management. Ecology and Society. 18(4):63 http://dx.doi.org/10.5751/ES- 06183-180463 .

21
Tempe, C. and M.J.J. Scheepers. 2003. A Look into the future: scenarios for distributed generation in Europe. Sustelnet, European Comisssion. ENK5-CT2001-00577.
Walters, C.J. 1986. Adaptive Management of Renewable Resources. Macmillan, New York.
Zale, A.V., D.L. Parrish, and T.M. Sutton. 2012. Fisheries Techniques. American Fisheries Society. Bethesda, MD.

22
Appendix A: Grass Lake User Survey Name: Age (please circle): 20-29, 30-39, 40-49, 50-59, 60-69, 70-79, 80+ Sex (please circle): M F NA Email: Q1: Do you own property on Grass Lake? YES (go to Q2) NO (go toQ3) Q2 a: How many people are part of your household _______ b: Does your property contain a septic system? YES NO c: Principal reason for purchasing property on Grass Lake? ○ water recreation ○ investment ○ natural beauty/solitude ○ place to entertain ○ full-time residence ○ Other (please specify) _____________________ Q3: If you do not own a camp on Grass Lake: a: How far do you travel to spend time on Grass Lake? ○ 0-9 miles ○ 10-49 miles ○ 50-99 miles ○ more than 100 miles Q4: How much time per year do you spend on or around Grass Lake? ○ I do not spend time on or around Grass Lake ○ 1 or 2 days ○ 2 - 7 days ○ 1 -3 weeks ○ 4-8 weeks ○ 9-14 weeks ○ 15-30 weeks ○ More than 30 weeks.
23
Q5: During what seasons do you spend time at Grass Lake? ○ Winter ○ Spring ○ Summer ○ Fall Q6: Do you own a boat? YES NO a: How many boats do you own? _________ b: What kind of boats? ○ Canoe/rowboat/kayak ○ Sailboat ○ Inboard motor ○ Outboard motor ○ Inboard/outboard motor ○ Jet-ski ○ Other _____________ c: How do you get your boat(s) onto Grass Lake? ○ Public Boat launch ○ Private property ○ I do not use my boat on Grass Lake Q7: What recreational uses do you participate in on and around Grass Lake? ○ Swimming ○ Fishing ○ Ice Fishing ○ Canoeing/Kayaking/Rowing ○ Motorboating ○ Birding ○ SCUBA diving ○ Hiking/Walking/Snowshoeing (IRLC trails, etc..) ○ Other _____________________________________________________

24
Concerns Great Concern
Moderate Concern
Little Concern
I don't know.
Poor Fishing ○ ○ ○ ○ Acid Rain ○ ○ ○ ○ Water levels ○ ○ ○ ○ Eroding shorelines ○ ○ ○ ○ Fecal pollution ○ ○ ○ ○ Decreased aesthetic appeal ○ ○ ○ ○ Crowding ○ ○ ○ ○ Aquatic plants ○ ○ ○ ○ Algae blooms ○ ○ ○ ○ Sanitary wastes from lakeside property ○ ○ ○ ○ Other wastes from lakeside property ○ ○ ○ ○ Water quality ○ ○ ○ ○ Property values ○ ○ ○ ○ Invasive species ○ ○ ○ ○ Agricultural runoff ○ ○ ○ ○
Q8: Are you, or a member of your household, aware of any organizations that are active on or about the lake? If so, please list them. Q9: Are you, or a member of your household, an active member in any of these organizations? If so, please list them Q10: Would you be interested in being part of a counsel/panel/focus group pertaining to the drafting of a management plan on Grass Lake? YES NO
Other (please list):

25
Perception Strongly Agree
Agree Neutral Disagree Strongly Disagree
NA
Public access to Grass Lake is insufficient. ○ ○ ○ ○ ○ ○ Grass Lake does not need a management plan. ○ ○ ○ ○ ○ ○ Environmental quality of Grass Lake has declined in the past 10 years. ○ ○ ○ ○ ○ ○ Recreational quality of Grass lake has declined in the past 10 years. ○ ○ ○ ○ ○ ○ Aesthetic quality of Grass Lake has declined in the past 10 years ○ ○ ○ ○ ○ ○ Fishing on Grass Lake is better than it has ever been. ○ ○ ○ ○ ○ ○ The 10hp motor limit on Grass Lake should be removed ○ ○ ○ ○ ○ ○

26
Appendix B: Scenario Survey Name: ____________________ Date: ______________________________
Please describe your vision of Grass Lake 10 years in the future; best case scenario; please be specific. Think about how you use the lake. Try to think of what factors influence those uses and how those factors/uses could possibly change.
Please describe your vision of Grass Lake 10 years in the future; worst case scenario; please be specific. Think about how you use the lake. Try to think of what factors influence those uses and how those factor could possibly change.

27
Mapping
• Please identify the areas of the lake you use the most; number them in order of use (1 being most used area). Please identify how you use each area.
• If there are areas of the lake which you do not use for a specific reason, please identify and explain.

28
A Management Plan for Grass Lake Table of Contents List of Tables ................................................................................................................................ 32
Introduction ................................................................................................................................. 33
Chapter 1: What you have—an inventory of Grass Lake ....................................................... 34
1.1 Physical Geography ........................................................................................................... 34
Bathymetry: measuring the shape of Grass Lake .................................................................. 34
Geology and Soils .................................................................................................................. 35
1.2 Chemical Limnology ......................................................................................................... 39
Temperature .......................................................................................................................... 39
Dissolved Oxygen .................................................................................................................. 42
Phosphorus ............................................................................................................................ 45
Nitrogen ................................................................................................................................. 48
pH and alkalinity ................................................................................................................... 48
Calcium ................................................................................................................................. 50
1.3 Ecology ............................................................................................................................... 51
Trophic State ......................................................................................................................... 51
Algae ...................................................................................................................................... 53
Plants ..................................................................................................................................... 54
Zooplankton ........................................................................................................................... 58
Fish ........................................................................................................................................ 58
Other Fauna .......................................................................................................................... 68
1.4 Social Geography ............................................................................................................... 71
Watershed development ......................................................................................................... 71
Lake Classification ..................................................................................................................... 72
Lake Accessibility .................................................................................................................. 72
Use ......................................................................................................................................... 73
Chapter 2: What you want—scenarios and limitations ........................................................... 75
Chapter 3: How to get there—management options ................................................................ 82
3.1 BCS Characteristic: Improved Fishery ........................................................................... 82
3.2 BCS Characteristic: High Water Quality ....................................................................... 82

29
Option 1: Best Management Practices (BMPs): Agriculture, Forestry, and Construction .. 84
Option 2: Constructed Ponds/Wetlands ................................................................................ 85
Option 3: Lakescaping .......................................................................................................... 85
Option 4: Improving/Maintaining Septic Systems ................................................................. 86
Option 5: Aeration/oxygenation ............................................................................................ 87
Option 7: Nutrient Inactivation ............................................................................................. 88
Option 8: Dilution ................................................................................................................. 89
3.3 BCS Characteristic: Fewer Weeds ................................................................................... 89
Option 9: Sediment Covers .................................................................................................... 90
Option 10: Hand pulling ....................................................................................................... 90
Option 14: Water Level Control ............................................................................................ 95
Option 15: Dyes and Surface Covers .................................................................................... 95
Option 16: Mechanical Removal ........................................................................................... 96
Option 17: Aquatic invasive species education ..................................................................... 97
Option 18: Aquatic invasive species disposal bins ................................................................ 98
Option 19: Boat wash ............................................................................................................ 98
3.4 BCS Characteristic: Improved Swimming...................................................................... 98
3.5 BCS Characteristic: Less Development ........................................................................... 99
Option 20: Landuse/Zoning Regulations ............................................................................... 99
Option 21: Conservation easements .................................................................................... 100
3.6 BCS Characteristic: Reduced algae blooms .................................................................. 100
Option 22: Selective Nutrient Addition ............................................................................... 101
Option 23: Algaecide; Early Detection and Rapid Response ............................................. 101
4.1 Action Process .................................................................................................................. 102
4.2 Hypothetical Timeline ..................................................................................................... 103
Work Cited: ................................................................................................................................. 105

30
List of Figures
Figure 1. Bathymetry of Grass Lake. NYSDEC Lake Map Series 2014 .........................................34
Figure 2. Bedrock geology of the area surrounding Grass Lake ......................................................36
Figure 3. Surficial geology of the area surrounding Grass Lake .......................................................37
Figure 4. Soils data and septic tank absorption field limitation map in the Grass Lake ...........38
Figure 5. Temperature Isopleth showing turn-over periods for Grass Lake 2012-2013..............40
Figure 6. Temperature Isopleth showing stratification for Grass Lake 2012-2013 ......................41
Figure 7. Dissolved oxygen isopleth above deepest point in Grass Lake 2012-2013 ...................42
Figure 8. Simplified oxygen sources and consumption during day and night time ...................44
Figure 9. Total Phosphorus from surface samples in Grass Lake ....................................................45
Figure 10. Total Phosphorus concentrations of inlet to Grass Lake; 2012-2013 ...........................46
Figure 11. Depth profile of total phosphorus concentrations within Grass Lake ........................47
Figure 12. Depth profile of pH within Grass Lake in August 2013 ..................................................49
Figure 13. Calcium sampling points within Grass Lake, 2013 ...........................................................51
Figure 14. The trophic state index calculated for Grass Lake ...........................................................52
Figure 15. Depth-abundance profiles of Chlorophyll a. .......................................................................54
Figure 16. Aquatic plant abundance in Grass Lake ..............................................................................57
Figure 17. Sample location for June 2014 electrofishing survey .........................................................59
Figure 18. Relative Abundance of Fish Found in Grass Lake, 2014 .................................................61
Figure 19. Predator:Prey PSD Tic-Tac-Toe ............................................................................................62
Figure 20. Size and Abundance of Bluegill in Grass Lake, 2014 .......................................................63
Figure 21. Size and Abundance of Pumpkinseed in Grass Lake, 2014 ............................................63
Figure 22. Size and Abundance of Black Crappie in Grass Lake, 2014 ...........................................64
Figure 23. Size and Abundance of Smallmouth Bass in Grass Lake, 2014 ....................................65
Figure 24. Size and Abundance of Largemouth Bass in Grass Lake, 2014 ....................................65
Figure 25. Size and Abundance of Northern Pike in Grass Lake, 2014 ..........................................66
Figure 26. Size and Abundance of Walleye in Grass Lake, 2014 .......................................................66
Figure 27. Size and Abundance of Yellow Perch in Grass Lake, 2014 .............................................67
Figure 28. Size and Abundance of Black Bullhead in Grass Lake, 2014 .........................................68
Figure 29. Landcover in the Grass Lake Watershed .............................................................................70
Figure 30. Lake use within Grass Lake according to 2013 survey ....................................................73
Figure 31. Most mentioned characteristics of the Best Case Scenario for Grass Lake. .............75
Figure 32. Cut lines indicating what views of Grass Lake sections AB, CD, and EF depict ...76

31
Figure 33. A visualization of the current conditions on Grass Lake ................................................77
Figure 34. A visualization of worst case scenario for the future of Grass Lake ............................78
Figure 35. A visualization of best case scenario for the future of Grass Lake ..............................79
Figure 36. Theoretical framework for lake management ....................................................................81

32
List of Tables
Table 1. Dissolved Oxygen criteria for aquatic life ...............................................................................43
Table 2. Aquatic Plants of Grass Lake ......................................................................................................56
Table 3. Results from 2014 electrofishing survey ...................................................................................60
Table 4. Landcover in the Grass Lake Watershed .................................................................................69
Table 5. Property Classifications of tax parcels within Grass Lake watershed ............................72
Table 6. Standards, Guidelines, and Current Condidtions of water quality parameters ...........82
Table 7. Overview of common herbicides used in aquatic plant management ...........................92
Table 8. Overview of species used in bio-manipulation strategies ..................................................93

33
Introduction
The purpose of this document is to provide the Grass Lake Association and the Indian River Land Conservancy with a tool for the future management of Grass Lake. As a management plan, this serves many roles. It is a foundation upon which local knowledge and data can continue to collect and build. It is a guide. It provides a snapshot of Grass Lake as it exists today, ideas for how it could function in the future and management steps that can be taken to achieve the goals of the Grass Lake Association and community. And, it is a reminder. A reminder that maintaining the beauty and utility of Grass Lake demands action.
This management plan was developed over a period of three years in cooperation with the Masters of Science Lake Management degree program at the State University of New York College at Oneonta.
Funding was provided by the Grass Lake Association, Indian River Land Conservancy, New York State Federation of Lake Associations, and the Scriven Foundation.
Special thanks to: Gerald & Kathleen Cole (Grass Lake Association) Jim Ninos (Grass Lake Association) Elliot Hillbeck (Indian River Land Conservancy) Dr. Willard Harman (SUNY Oneonta Biological Field Station) Dr. Kiyoko Yokota (SUNY Oneonta Biological Field Station) Holly Waterfield (SUNY Oneonta Biological Field Station) Matthew Albright (SUNY Oneonta Biological Field Station) Emily Zaengle

34
Chapter 1: What you have—an inventory of Grass Lake
The first step in managing a natural resource is understanding what you have. This requires inventory; thorough research on the current state of the system including its geographical, social, ecological landscape. This knowledge is essential to making management decisions as it serves as a reference point, marking where you are versus where you have been and where you want to go.
1.1 Physical Geography
Grass Lake is located in New York State on the border of Jefferson and St. Lawrence Counties in the towns of Theresa and Rossie.
Bathymetry: measuring the shape of Grass Lake
Grass Lake has a surface area of approximately 340 acres (~138 hectares). There are two distinct regions within the lake—the main basin and what is commonly referred to as “the fingers.” At its deepest point, Grass Lake is approximately 52 feet (~16 meters) deep. It has an average depth of approximately 12 feet (3.7 meters).
Figure 1. Bathymetry of Grass Lake. NYSDEC Lake Map Series 2014.
fingers
main basin
deepest point

35
Geology and Soils
The landscape surrounding Grass Lake is a product of the last glacial period, approximately 10,000 years ago. The bedrock geology of the Grass Lake watershed is comprised of Potsdam sandstone, biotite and/or horneblende granticic gneiss, calcitic and dolomitic marble, and other undivided metasedimentary rocks (Figure 2; Isachsen and Fisher, 1970). The surficial geology, or soils, within the watershed are mainly proglacial lake deposits, generally silty or clayey soils; and swamp deposits, comprised of peat muck, and organic silt and sand (Caldwell et al., 1986). The soils within the Grass Lake watershed (Figure 3) are limited in terms of their suitability for development (Figure 4). According to soil surveys completed by the Natural Resources Conservation Service (Soil Survey Staff , NRCS 2014), soils within the watershed are rated as very limited for dwellings with basements and very limited to somewhat limited in suitability for septic tank absorption fields and dwellings without basements. These suitability ratings were developed by the NRCS. The septic tank absorption field ratings are based upon the soil percolation rate, depth to water table, flooding, slope, stoniness, and depth to impervious layer; the most common factors affecting septic tank absorption field ratings in the Grass Lake watershed were slope, depth to impervious layer, and depth to water table. The ratings for dwellings without basements are based upon depth to water table, flooding, slope, and soil shrink-swell; in the Grass Lake watershed slope and depth to water table were the most common factors contributing to the limited nature of this use within the watershed. This suggests that the watershed is not amenable to residential development.

36
Figure 2. Bedrock geology of the area surrounding Grass Lake. (Isachsen and Fisher, 1970).

37
Figure 3. Surficial geology of the area surrounding Grass Lake (Caldwell et al., 1986).

38
Figure 4. Soils data and septic tank absorption field limitation map in the Grass Lake Watershed (Soil Survey Staff NRCS, 2014).

39
1.2 Chemical Limnology
Chemical characteristics, including temperature, dissolved oxygen, phosphorus, nitrogen, pH, alkalinity, and calcium all influence the utility and natural beauty of Grass Lake. Thus, it is important to understand how these variables function within the natural system in order to identify problems or potential threats.
Temperature
Grass Lake, like many lakes in temperate regions, is dimictic. This means that the lake stratifies twice per year; this stratification typically occurs during the winter and summer months (Figure 5). During these periods of stratification, the water within the lake forms distinct layers each layer differing from the others by temperature (Figure 6).
During the summer months, a layer of warmer water (the epilimnion) sits atop a layer of cooler water (the hypolimnion). In Grass Lake, the boundary between these two layers of water (the thermocline) is usually around 15 feet (4.5 meters) below the surface. The depth of the thermocline is dependent on water clarity and several other variables. These temperature induced density differences between these two layers of water prevent these two layers from mixing. The resistance to mixing is strongest when temperature differences between the two layers are the greatest; this occurs in mid-summer. In the fall, the surface waters begin to cool, the thermocline deepens, and stratification breaks down. At some point during this process, the lake is the same temperature from top to bottom allowing the two layers, the entire water column, to mix (in Grass Lake this occurs around November). This mixing is what is known as turn-over, a period of time at which the bottom water of the lake mixes with the top.
As fall transitions to winter and air temperatures drop, the water cools and ice begins to form, once again inducing a period of stratification. This winter temperature differentiation is referred to as inverse stratification, colder water sits atop a layer of slightly warmer water. This occurs because water is most dense at 39.2ᵒ F. (4ᵒ C.). The resistance to mixing during winter months is less than that during summer due to smaller differences in temperature. Ice cover, however, reduces the possibility of wind-induced mixing. If winter stratification persists for too long oxygen in the water can be depleted to the extent that fish are no longer able to survive, leading to a fish kill. The cycle completes itself as the ice melts, surface waters warm often resulting in turn-over (in Grass Lake this occurs around late April) and summer stratification begins to set up (in Grass Lake this occurs around May).
Temperature affects water quality; one example of this is its impact on dissolved oxygen. As temperature increases the amount of oxygen that water can hold decreases, and the colder the water the more oxygen it can hold.

40
Figure 5. Temperature Isopleth showing turn-over periods for Grass Lake 2012-2013.
To read this graph:
Each dot on the horizontal axis represents a sample date. The vertical axis represents the depth at which temperature was sampled. For example on this date in August, at around 3 meters (~10 ft) below the surface the water temperature was about 23°C (~73ᵒF), at a depth of 7 meters (~23 ft) it was around 11°C (~52ᵒF).
Fall turnover temperature is 7°C (~44ᵒF) at every depth
Spring turnover temperature is 5°C (~41ᵒF) at every depth

41
Figure 6. Temperature Isopleth showing stratification for Grass Lake 2012-2013.
winter stratification temperature is 1°C (~33ᵒF) at the top
and 3°C (~37 ᵒF) at the bottom
summer stratification temperature reaches 29°C (~84 ᵒF) at the top
and 7°C (44 ᵒF) at the bottom

42
Dissolved Oxygen
Dissolved oxygen (DO) is essential for fish and other aquatic fauna. New York State has identified standards used to protect water quality. The NYS water quality standard for dissolved oxygen in non-trout waters, such as Grass Lake, is “the minimum daily average shall not be less than 5.0 mg/L, and at no time shall the DO concentration be less than 4.0 mg/L” (NYCRR §703.3). Meeting this standard ensures that invertebrates and early life stages of fish have available habitat, and that production of other life stages of fish are not more than moderately impaired (Table 1; EPA 1986). During 2012-2013 sampling found that Grass Lake failed to meet this water quality standard on multiple occasions (Figure 7). Average water column oxygen concentrations were less than 5 mg/L during five sampling events, with all of these instances were during the months of July, August, and September.
Figure 7. Dissolved oxygen isopleth above deepest point in Grass Lake 2012-2013.

43
Table 1. Dissolved Oxygen criteria for aquatic life. Values given in mg L-1. Adapted from EPA Quality Criteria for Water 1986.
Fish Invertebrates Early Life
Stages Other Life
Stages
No Production Impairment 6.5 6 8 Slight Production Impairment 5.5 5 - Moderate Production Impairment 5 4 5 Severe Production Impairment 4.5 3.5 - Limit to Avoid Acute Mortality 4 3 4
There are two main sources of dissolved oxygen within Grass Lake: (1) interactions with the atmosphere, such as diffusion and surface turbulence, and (2) as a byproduct of photosynthesis carried out by algae and higher plants. Dissolved oxygen is consumed through decomposition of organic matter and respiration by plants and animals (Figure 8). The oxygen dynamics within Grass Lake are influenced by the extent and duration of stratification. During periods of stratification there is a spatial separation between the input and consumption of oxygen. The sources of oxygen are limited to the epilimnion and the region around the thermocline, while the hypolimnion is dominated by consumption of oxygen.

44
Figure 8. Simplified oxygen sources and consumption during day and night time.
Since mixing between the epilimnion and hypolimnion is restricted, this results in the depletion of oxygen within the hypolimnion. Oxygen begins to deplete at the sediment/water interface where decomposition processes are concentrated. The zone of low oxygen will then expand into the water column. If the rate of oxygen depletion is high and stratification persists throughout the summer the entire hypolimnion can become completely devoid of oxygen. As shown in Figure 7, the hypolimnion of Grass Lake is almost entirely unsuitable for aquatic life in late summer. It is during this period that the lake fails to meet the NYS water quality standard. During turn-over events oxygen concentrations are high and well distributed throughout the lake. A similar situation can occur during the winter, when ice covers the lake the sources of oxygen to the water – atmospheric interaction and photosynthesis – are limited, while consumption processes continue. If the rate of oxygen depletion is high and ice cover persists the entire lake can become unsuitable for aquatic life, this can result in a winter fish kill. Though a zone of

45
low oxygen exists in the deep waters during winter in Grass Lake, it is not yet widespread enough to cause a fish kill.
The rate of oxygen depletion within the hypolimnion is related to nutrient concentrations, the rate of primary production, and the rate of organic matter accumulation.
Phosphorus
Phosphorous is a major nutrient that is essential for plant and algal growth. In Grass Lake, the amount of phosphorous available in the water column drives the amount of algal production. The New York State water quality standard for phosphorus is in narrative form, and states that there shall be “none in amounts that will result in growths of algae, weeds and slimes that will impair the waters for their best usages” (NYCRR §703.2). A commonly suggested numerical guideline for phosphorus concentration in surface waters is 20 μg L-1 (NYSDEC 2011). During 2012-2013 water quality monitoring it was found that Grass Lake failed to meet the NYS water quality standard for phosphorus; this was evidenced by blue-green algal blooms in Sept-Oct 2013. The high algal production driven by high phosphorus concentrations, followed by accumulation of dead algal biomass on the lake bottom, likely increased the rate of hypolimnetic oxygen depletion – resulting in a reduction of the volume of fishery habitat. The 20 μg L-1 guideline was also violated at several other times throughout the year (Figure 9).
The landscape position, basin shape, and other characteristics of the outlet on Grass Lake restricts high volume of outflow. This means that once phosphorus enters the system it has a high residence time. Once available, phosphorus is utilized by plants and algae and
0
5
10
15
20
25
30
35
D J F M A M J J A S O N
Tota
l Pho
spho
rus (
μg L
-1)
Figure 9. Total Phosphorus from surface samples in Grass Lake at center lake sample point 2012-2013. The dashed line represents the New York State guideline for phosphorus concentrations in surface waters, 20 μg L-1.

46
is incorporated into their bodies it has two possible fates. The plants/algae could die, in which case the phosphorus may become sequestered in the sediments or released into the water column during the decomposition process. The plants/algae could be consumed by grazers such as zooplankton, crayfish and other aquatic macroinvertebrates, and some species of fish. In this case the phosphorus enters the food chain where it is biologically sequestered until the death of the top/terminal consumer.
Sources of phosphorus to Grass Lake can be broken down into two major categories: external and internal sources. External phosphorus loading can originate from a variety of sources and activities within the watershed. Phosphorus is often adsorbed to soil particles, so soil erosion can be a major source of phosphorus to lakes. Many activities within the watershed can cause increased soil erosion such as agriculture, forestry, and construction. Human, animal, and household waste also contain high concentrations of phosphorus, so many aspects of human activities within the watershed can increase phosphorus loading into the lake. Preliminary monitoring of one inlet to Grass Lake showed that external loading of phosphorus is occurring within Grass Lake(Figure 10).
Figure 10. Total Phosphorus concentrations of inlet to Grass Lake; 2012-2013. The dashed line represents the New York State guideline for phosphorus concentrations in surface waters, 20 μg L-1.
0
20
40
60
80
100
120
140
J F M A M J J A
Tota
l Pho
spho
rus (
μg L
-1)

47
Internal phosphorus loading is a recycling of the phosphorus that is already within the lake. Not all lakes exhibit internal loading, but there is evidence that internal loading may be occurring within Grass Lake. Phosphorus is often sequestered in the sediments at the bottom of the lake in forms not readily available to organisms. In late summer, when the lake is stratified and there is little oxygen at the bottom of the lake phosphorus is released from the sediments into the water column. Once the release of phosphorus from the sediments into the water column begins it can reinforce itself; increased phosphorus can lead to increased algal growth, increase algal growth can lead to increased organic matter for decomposition at the bottom of the lake, increasing the rate of oxygen depletion at the lake bottom and providing the environment for phosphorus release. High concentrations of total phosphorus were found at the bottom of Grass Lake on several occasions (Figure 11), indicating that internal phosphorus loading is occurring. The extent to which this increased hypolimnetic phosphorus concentration impacts primary production and algal dynamics within Grass Lake is unknown.
Figure 11. Depth profile of total phosphorus concentrations within Grass Lake. August 2013. High phosphorus concentrations at depth indicate phosphorus release from sediments (i.e. internal loading of phosphorus). The red line represents the New York State guideline for phosphorus concentrations in surface waters, 20 μg L-1.

48
Nitrogen
Nitrogen is another important nutrient required for aquatic life (in addition to P). The NYS water quality standard for nitrogen is the same as the phosphorus standard. It states that there should be “none in amounts that will result in growths of algae, weeds and slimes that will impair the waters for their best usages” (NYCRR §703.2).” There are several forms of nitrogen that have their own standards.
Ammonia (NH3) is a form of nitrogen that can be toxic to aquatic life. It is a waste product of animals and is released as part of the decomposition of organic matter. The NYS water quality standard for ammonia is dependent upon pH and water temperature. During 2012-2013 water quality monitoring it was found that Grass Lake failed to meet the standard for ammonia concentration in discrete samples on several occasions.
There are several forms of dissolved nitrogen that occur within lakes naturally. Nitrate (NO3), nitrite (NO2), and ammonium (NH4) are all common forms of nitrogen that can be utilized by plants and algae. Nitrogen can enter Grass Lake through a variety of external sources. Nitrogen within the atmosphere can enter the lake food web through the biological process of nitrogen fixation. This process is carried out by some types of algae and bacteria. Nitrogen can be stored in and recycled through the aquatic food web. Nitrogen can exit the lake system much more easily than phosphorus. This is because nitrogen has a gaseous phase, so through a process called denitrification nitrogen gas can leave the lake and enter the atmosphere. Nitrogen is much more soluble than phosphorus, as phosphorus strongly binds with iron and other minerals in the sediments, and is thus more likely to be flushed out of the system through the outlet.
pH and alkalinity
pH is a measure of acidity. The NYS water quality standard for pH states that it “shall not be less than 6.5 nor more than 8.5” (NYCRR §703.3). This range is where pH is most suitable to aquatic life. During 2012-2013 water quality monitoring there were several occasions on which there were spatially localized pH values that were in violation of the NYS water quality standard, on both the high end and low end (Figure 12), though at no time was the water column average in violation of the NYS water quality standard.

49
Figure 12. Depth profile of pH within Grass Lake in August 2013. Red areas indicate a localized violation of NYS water quality standards. The dashed line represents the limits of the New York State standard for pH in surface waters, shaded areas are outside the acceptable range of 6.5-8.5.
Alkalinity is a measure of how resistant a system is to a change in pH. There is no NYS state water quality standard regarding alkalinity. Hardwater lakes, those with high alkalinity, are much less susceptible to pH changes than those softwater lakes with low alkalinity. Grass Lake is on the lower end of the alkalinity spectrum and would be considered a softwater lake. The alkalinity of Grass Lake was around 34 mg L-1 CaCO3 during 2012-2013 water quality monitoring. Even though Grass Lake is considered a softwater lake the alkalinity is high enough that it is relatively protected against whole lake acidification (Jenkins et al 2007).
Shifts in pH can be caused by internal or external factors. Acid rain, caused by burning fossil fuels and aerial application of fertilizers, has acidified many Adirondack lakes. The impacts of acid rain on Grass Lake are unknown. Internally, photosynthesis and respiration within the water column can lead to localized high and low pH. High pH within the epilimnion can be a result of high rates of photosynthesis; and low pH within the hypolimnion can be a result of high rates of decomposition. This is what is most likely occurring within Grass Lake.
0
2
4
6
8
10
12
14
16
5 6 7 8 9D
epth
(m)
pH

50
Calcium
There is no NYS water quality standard for calcium concentrations in surface waters. The amount of calcium in the lake influences alkalinity and pH. Calcium concentrations can be used as a measure of how suitable a system is for zebra mussel colonization. Zebra mussels are a non-native nuisance species that can impair lake use. A lake is considered suitable for zebra mussel colonization if calcium concentrations are greater than 20 mg L-
1 Ca, with the borderline suitability range is between 15-20 mg L-1 Ca. Calcium concentrations below 15 mg L-1 Ca are said to be unsuitable (Cohen 1998). Calcium concentrations were sampled August 20, 2013 at four sites around Grass Lake (Figure 13). The calcium concentration of these four samples ranged from 8-14 mg L-1 Ca and averaged 11.6 mg L-1 Ca. These results suggest that zebra mussel colonization within Grass Lake is a minimal risk, though a more intensive study and continual monitoring may find localized calcium concentrations that may allow zebra mussel colonization.

51
Figure 13. Calcium sampling points within Grass Lake, August 20, 2013.
1.3 Ecology
Trophic State
Biological productivity refers to the rate at which biomass is generated. Biomass refers to any biological material and can include algal cells, plant tissues, zooplankton, and fish. Lakes with low productivity are called oligotrophic. Lakes with medium productivity are called mesotrophic. Lakes with high productivity are called eutrophic. Lakes move toward a more productive state through time, the rate of eutrophication being dependent on many variables including watershed characteristics, climate, and human impacts. It is important to note that a lake naturally changes through time. The aquatic succession model states that as an aquatic system, such as a lake, moves through time it slowly fills

52
with sediment and organic matter. This process is directly related to eutrophication. Increased productivity will increase the rate at which a system fills with organic matter. Thus the system moves from an open water system, to a wetland, to a terrestrial system. The lifespan of each state of the system varies but can be on the scale of thousands of years. Cultural eutrophication refers to an increased rate of eutrophication caused by human development.
The trophic state index was developed to classify lakes in terms of productivity. Based upon 2007-2011 CSLAP data, Grass Lake is classified as mesotrophic, which is similar to many other lakes within the region (Figure 14).
Figure 14. The trophic state index calculated for Grass Lake and several nearby lakes. Calculations were made using CSLAP data from 2007-2011. SD refers to Secchi depth, TP refers to total phosphorus, CHL refers to chlorophylla.
Primary productivity refers to any biomass generated through energy derived from sunlight, such as algal production and plant production. This is the main pathway of
53
biological materials into the lake. Algae and plants serve as the base of the food web within Grass Lake; sustaining zooplankton, macroinvertebrate and fish populations.
Algae
Algae are a diverse group of organisms, with some species being microscopic free-floating organisms, while others are similar in form to plants. All algae are photosynthetic primary producers and contain the photosynthetic pigment chlorophyll a. Algae utilize nutrients, such as phosphorus and nitrogen, and sunlight and carbon dioxide to grow. Water temperature, availability of sunlight and nutrients drives algal abundance and species composition. Algae can influence water quality, fish abundance, and possibly impede lake use. High algal abundance can increase the amount of organic matter available for decomposition which can potentially lead to hypolimnetic oxygen depletion, localized shifts in pH, and increased ammonia concentrations. Some species of algae are undesirable as food for zooplankton. This can reduce fish production if the algal community is dominated by these undesirable species. Some algae, mainly blue-green algae (cyanobacteria), often form blooms in late summer. An algal bloom is characterized by a rapid increase in algal abundance which is often dominated by a single species or type of algae. Blue-green algae blooms may contain toxins which impede lake use and can impact fish production (Malbrouck and Kestemount 2006).
Since chlorophylla is a photosynthetic pigment present in all algae it is measured as a proxy for algal abundance. Chl.a was measured periodically within the main basin of Grass Lake. Results showed that algae were widely distributed throughout the water column (Figure 15).

54
Figure 15. Depth-abundance profiles of Chlorophylla concentrations at center lake site in Grass Lake during 2013.
Grass Lake has experienced several algae blooms in recent years. A prolonged bloom which lasted from late August to early October 2013 was dominated by the blue-green algae Anabaena spp. and Gleotrichia echinulata. Many blue-green algae species have the ability to produce toxins. Grass Lake was screened for algal toxins during this bloom and results were positive for the presence of the algal toxin microcystin (MC-LR) (NYSDEC 2014). Exposure to microcystins, a liver toxin, can cause skin irritation and gastrointestinal distress in humans and has been attributed to several canine deaths throughout New York State. Anatoxin-a, a neurotoxin, can be produced by many blue-green algae species, including those found in Grass Lake. Anatoxin-a was not found in Grass Lake during the 2013 bloom. Recent research suggests that exposure to algal toxins may be related to some chronic illnesses in humans (Li et al., 2012, Caller et al, 2009).
Plants
Though aquatic plants are often viewed as a nuisance as they can impede lake use, they are a natural and essential part of the lake ecosystem. They provide habitat for aquatic organisms, seasonally sequester nutrients, stabilize lake sediments, and are an important source of food for wildlife. Grass Lake has a diverse plant community comprised of many native, and a few nonnative, species.

55
There are several invasive aquatic plants that have been identified within Grass Lake. Table 2 and Figure 16 shows abundance of plants at sampling locations throughout Grass Lake differentiating between native and invasive plants. Invasive plants are non-native species that exhibit aggressive growth and displacement of native species when they are introduced into a system. Invasive species often interfere with lake use. Eurasian watermilfoil (Myriophyllum spicatum) is an invasive aquatic plant that can impede many lake uses by forming dense beds that extend to the surface of the lake. There are several such beds of Eurasian watermilfoil within Grass Lake. European frogbit (Hydrocharis morsus-ranae) is a small floating leafed plant that has caused problems in other lakes. It is abundant and widely distributed along the periphery of the fingers and within the wetlands associated with Grass Lake. Currently, it does not seem to have an impact on lake use. Variable-leaved milfoil (Myriophyllum heterophyllum) has been found in several locations throughout Grass Lake. Currently the variable-leaved milfoil population within Grass Lake is small and it seems to be interspersed within the native vegetation. It does not currently pose a threat to lake use. While a single specimen of curly-leafed pondweed was found floating within Grass Lake in June 2013, there has been no observation of any established populations of curly-leafed pondweed within Grass Lake.

56
Table 2. Aquatic Plants of Grass Lake in order of estimated abundance according to 2013 survey.
*macroalga, ⱡ invasive
Common Name Scientific Name
Richardson's pondweed Potamageton richardsonii
Eurasian Water-milfoil ⱡ Myriophyllum spicatum
Largeleaf pondweed Potamageton ampifolius
Coonstail Ceratophyllum demersum
Common waterweed Elodea canadensis
White water lily Nymphaea odorata
Yellow pond-lily Nuphar advena
European Frogbit ⱡ Hydrocharis morsus-ranae
Common bladderwort Utrichularia macrorhiza
Stonewort * Chara spp.
Water shield Brasenia schreberi
Water Bulrush Schoenoplectus subterminalis
Sago Pondweed Stuckenia spp.
Variable leaved milfoil ⱡ Myriophyllum heterophyllum
Flatleaf pondweed Potamageton zosteriformus
Flatleaf bladderwort Utrichularia intermedia
Wild celery, eelgrass Valisneria americana
Ribbonleaf pondweed Potamageton epihydrus
Variableleaf pondweed Potamageton gramineus
Waterthread pondweed Potamageton diversifolius
Curly-leafed pondweed ⱡ Potamageton crispus
Common
Rare

57
Figure 16. Aquatic plant abundance in Grass Lake, summer 2013 differentiating between native and invasive. Shaded area not sampled due to inaccessibility at the time of sampling.

58
There are several different species of floating leafed plants common around the periphery of Grass Lake. They include the white water lily (Nymphaea odorata), yellow pond lily (Nuphar advena), watershield (Brasenia schreberi), and European frogbit (Hydrocharis morsus-ranae). Within the fingers there are mats, or floating islands, present in early summer. These mats vary in size and shape, and they cut off access to the east finger during the summer months. The mats are comprised of organic sediments that rest upon a tangled mass of the underwater stems of the yellow water lily (Nuphar advena). The mechanism that causes the seasonality of the appearance of these floating mats is unknown. Zooplankton
Zooplankton are microscopic animals that are important in the aquatic food chain. They can have a significant impact on algal abundance as well as species composition. There has been no in-depth study on the zooplankton of Grass Lake to date. Presence of cladocerans, copepods, and several species of rotifers have been observed. This is an area that requires further study.
Fish
Fish play significant role in the ecological function of Grass Lake and they are important to the recreational use. When the fishery of Grass Lake was surveyed by NYSDEC personnel in June of 2006 they found the black bass population was satisfactory and there was no need for additional management of that fishery (NYSDEC 2007). A boat electrofishing survey was conducted in June 2014 by SUNY Oneonta in cooperation with SUNY Cobleskill.
Boat electrofishing is a common method used by professionals to survey fish populations. An electric current is generated in the water immediately surrounding the boat. The electric current stuns the fish for 20-30 seconds so they float to the surface where they are netted and placed into a live-well on the boat. The survey is conducted in several segments or “runs”. Each run typically lasts between 10-15 minutes. After each run, the captured fish are identified, counted, measured, and returned to the lake.
Figure 17 shows the areas that were sampled during the 2014 survey. Only shallow or near shore areas are able to be effectively sampled with boat electrofishing surveys. Sample areas were selected in an attempt to encompass all the different littoral habitat types within the lake.

59
Figure 17. Sample location for June 2014 electrofishing survey.
Twelve different species of fish were collected. Table 3 gives an overview of the data collected in the survey. Figure 18 shows the relative number of each fish species collected within the survey. Bluegill were the most abundant fish comprising, over 70% of the fish collected.

60
Table 3. Results from 2014 electrofishing survey. Proportional Stock Density (PSD) calculations in red note small sample size that may not accurately describe the population. 95% confidence intervals are included for PSD calculations (Gustafason 1988).
Species Count Relative
Abundance (% by #)
CPUE (#/hr)
Averge Size (in)
Size Range (in) PSD
Banded Killifish 7 0.48% 6.7 2.5 1.6-3.1 -- Black Bullhead 33 2.26% 31.5 9.1 6.1-11.8 48.5 (+/- 21) Black Crappie 4 0.27% 3.8 7.6 6.1-8.9 -- Bluegill 1024 70.14% 977.8 4.1 0.4-8.0 10.6 (+/- 2) Golden Shiner 17 1.16% 16.2 4.0 2.6-5.1 -- Largemouth Bass 80 5.48% 76.4 8.3 1.2-20.0 51.3 (+/- 19) Northern Pike 10 0.68% 9.5 18.6 15.1-23.4 20 Pumpkinseed 206 14.11% 196.7 4.5 1.4-8.74 12.8 (+/- 5) Smallmouth Bass 2 0.14% 1.9 10.1 5.3-14.9 -- Spottail Shiner 2 0.14% 1.9 2.4 2.2-2.7 -- Walleye 3 0.21% 2.9 9.3 8.7-10.3 -- Yellow Perch 72 4.93% 68.8 5.1 3.1-10.0 12.5 TOTAL 1460 100.00% 1394.2

61
Figure 18. Relative Abundance of Fish Found in Grass Lake, 2014.
Proportional Stock Density (PSD) is an index of population size structure. It can be used to judge whether a population is balanced, or meets management objectives, in terms of predator:prey population size structure. Figure 19 is a tic-tac-toe grid of predator-prey PSD where different ratios of predator- prey PSD relate to specified scenarios. Those scenarios are: (A) Mutual balance for satisfactory fishing, (B) community comprised of large, old specimens, (C) stunted prey population interfering with predator production, (D) overfishing of predators and stunting of prey, (E) high population of small predators excessively cropping young prey (Ney 1999)

62
A
C
B
D
E
0
20
40
60
80
100
0 20 40 60 80 100
Prey
PSD
Predator PSD
Figure 19. Predator:Prey PSD Tic-Tac-Toe adapted from Ney 1999. Current state of Predator:Prey PSD in Grass Lake plotted with 95% confidence intervals.
Grass Lake falls somewhere between scenario D and scenario C. The predator PSD calculation only included largemouth bass due to the low sample size of both northern pike, smallmouth bass, and walleye. If we were to include the PSD for northern pike, Grass Lake would fall within scenario D. This suggests that the fishery is not in balance; there are many small prey fish and fewer large predators. Management decisions should not be made based solely on the predator:prey PSD relationship due to high variability within the fish population. However, it can be useful in tracking the effectiveness of management activities (Ney 1999).
The bluegill population in Grass Lake is stunted, with a large proportion of the bluegill within Grass Lake being below the quality length and PSD is 10.6 (+/- 2). Stunting occurs through overpopulation. When a species is overpopulated, resources can grow scarce, slowing the growth rate of that population and leaving it stunted. Catch per unit effort (CPUE) is a metric that can be used to estimate abundance of fish within a population. It can be compared between surveys assuming that the methods used

63
to collect the data were the same. The CPUE for bluegill in Grass Lake was 977.8 (number per hour).
Figure 20. Size and abundance of bluegill in Grass Lake, 2014.
The pumpkinseed population, like the bluegill population, is stunted (PSD = 12.8), although they are not as abundant as bluegill. The CPUE for pumpkinseed in Grass Lake was 196.7 (number per hour).
Figure 21. Size and abundance of pumpkinseed in Grass Lake, 2014.
0
20
40
60
80
100
120
140
0 1 2 3 4 5 6 7 8 9 10
Freq
uenc
y
Length (inches)
Stoc
k Si
ze
Qua
lity
Size
Pref
erre
d Si
ze
Mem
orab
le S
ize
0
5
10
15
20
25
30
0 1 2 3 4 5 6 7 8 9 10
Freq
uenc
y
Length (inches)
Stoc
k Si
ze
Qua
lity
Size
Pref
erre
d Si
ze
Mem
orab
le S
ize

64
There were few black crappie caught in the survey. The CPUE for black crappie was 3.8 (number per hour).
Figure 22. Size and abundance of black crappie in Grass Lake, 2014.
There were very few smallmouth bass caught in the survey. This could suggest a decline in the smallmouth fishery within Grass Lake. The CPUE for smallmouth bass was 1.9 (number per hour).
0
1
2
3
4
5
0 2 4 6 8 10 12 14 16 18 20
Freq
uenc
y
Length (inches)
Stoc
k Si
ze
Qua
lity
Size
Pref
erre
d Si
ze
Mem
orab
le S
ize
Trop
hy S
ize

65
Figure 23. Size and abundance of smallmouth bass in Grass Lake, 2014.
With a PSD of 51.3 (+/- 19), the largemouth bass population seems to be balanced within Grass Lake. This is similar to the NYSDEC survey done in 2006. The CPUE for largemouth bass in Grass Lake was 76.4 (number per hour).
Figure 24. Size and abundance of largemouth bass in Grass Lake, 2014.
0
1
2
3
4
5
0 2 4 6 8 10 12 14 16 18 20 22 24
Freq
uenc
y
Length (inches) St
ock
Size
Qua
lity
Size
Pref
erre
d Si
ze
Mem
orab
le
Size
Trop
hy
Size
0
2
4
6
8
10
0 2 4 6 8 10 12 14 16 18 20 22 24 26 28 30
Freq
uenc
y
Length (inches)

66
There were too few northern pike caught in the survey to make any confident statement about the northern pike population in Grass Lake. The CPUE for northern pike in Grass Lake was 9.5 (number per hour).
Figure 25. Size and abundance of northern pike in Grass Lake, 2014.
There were very few walleye (3) caught during the survey. These fish are likely from the 2011 walleye stocking done by the Grass Lake Association.
Figure 26. Size and abundance of walleye in Grass Lake, 2014.
0
1
2
3
4
5
0 2 4 6 8 10 12 14 16 18 20 22 24 26 28 30 32 34 36 38 40
Freq
uenc
y
Length (inches)
Stoc
k Si
ze
Qua
lity
Size
Pref
erre
d Si
ze
Mem
orab
le S
ize
0
1
2
3
4
5
0 2 4 6 8 10 12 14 16 18 20 22 24 26 28 30
Freq
uenc
y
Length (inches)
.
Stoc
k Si
ze
Qua
lity
Size
Pref
erre
d Si
ze
Mem
orab
le S
ize
Trop
hy S
ize

67
Though there were too few yellow perch collected to make any confident statement about their population in Grass Lake. The population seems to be on the stunted side of the spectrum. The CPUE for yellow perch was 68.8 (number per hour).
Figure 27. Size and abundance of yellow perch in Grass Lake, 2014.
The black bullhead population in Grass Lake seems to be satisfactory with a PSD of 48.5 (+/- 21). In the 2006 survey by the NYSDEC there were several brown bullhead collected. During our survey, we collected several black bullhead. It is likely that the species of bullhead may have been misidentified in one of the surveys rather that one species replaced the other within the lake.
02468
101214161820
0 2 4 6 8 10 12 14 16 18 20
Freq
uenc
y
Length (inches)
Stoc
k Si
ze
Qua
lity
Size
Pref
erre
d Si
ze
Mem
orab
le
Size
Trop
hy
Size

68
Figure 28. Size and abundance of black bullhead in Grass Lake, 2014.
There were several other species of fish caught in Grass Lake. These smaller fish are often referred to as forage fish, as they are often the food of the larger sportfish such as largemouth bass, smallmouth bass, walleye, and northern pike. They are an important part of the system. The species caught include the banded killifish, golden shiner, and spot-rail shiner
Other Fauna
Two pairs of common loon (Gavia immer) were actively nesting on Grass Lake. The common loon is listed as a species of special concern in New York State (6 NYSCRR §182.5), so the habitat requirements of the common loon should be taken into account before pursuing a management activity.
The beaver (Castor Canadensis) population on Grass Lake has been a topic of discussion at several lake association meetings. A beaver population can have a large impact on an aquatic ecosystem. Beavers can impact the hydrology, geomorphology, water chemistry and ecology of lake systems. Not all of these impacts are negative. For example, presence of beavers can increase the abundance and diversity of forage fish and aquatic invertebrates in near shore areas of the lake (Rosell et al. 2005). While the perceived nuisance of beavers on Grass Lake is high, the extent of the negative impacts attributable to beavers is difficult to evaluate given that the current state of the beaver population surrounding Grass Lake is unknown. Further monitoring of the beaver population is required to discern if the population is having a negative impact on Grass Lake.
0
1
2
3
4
5
6
7
0 2 4 6 8 10 12 14 16 18 20
Freq
uenc
y
Length (inches)
Qua
lity
Size
Pref
erre
d Si
ze
Mem
orab
le
Size
Trop
hy
Size
Stoc
k Si
ze

69
Watershed Landuse and Landcover
Landcover is an ecological characteristic of the watershed that is directly related to how society interacts with the landscape. About 62% of the areal land coverage within the Grass Lake watershed is forested, and approximately 31% is wetlands (Table 4, Figure 29). Landcover regimes within a watershed can be directly impacted by human development. Planted/cultivated and developed spaces make up a very small percentage of the areal land coverage within the watershed.
Table 4. Landcover in the Grass Lake Watershed. Data from National Landcover Dataset 2006.
Landcover Type Acres Percent Covered
Forest 819 61.8%
Wetland 409 30.9%
Water 26 2.0%
Shrubland 36 2.7%
Herbaceous 27 2.0%
Planted/Cultivated 4 0.3%
Developed 4 0.3%
Total 1325

70
Figure 29. Landcover in the Grass Lake Watershed. Data from National Landcover Dataset 2006.

71
1.4 Social Geography
Watershed development
According to 2013 tax records there are 110 parcels within the Grass Lake watershed (Table 5, NYSORPTS 2013). There are only four one family year round residences within the watershed, with the majority of residential parcels within the watershed being seasonal residences, many of which are lakeside camps. About ten percent of the areal coverage of the watershed are parcels classified as agriculture, including dairy and other livestock. Half of the parcels within the watershed (55) are classified as vacant, which comprises the largest areal coverage within the watershed compared to other major property classifications. This suggests the vast potential for further development within the Grass Lake watershed. Currently, these vacant lots are forested or shrub/scrub. There are also several parcels within the watershed classified as community services or wild, forested, conservation lands and public parks, but these only amount to 3.4% of the areal watershed coverage.

72
Table 5. Property Classifications of tax parcels within Grass Lake watershed according to 2013 Real Property Data (NYSORPTS 2013).
Property Classification Number
of Parcels
Percentage of watershed
area
Agriculture
Agricultural Vacant Land (Productive) 2 1.7% Dairy Products: milk, butter, and cheese 4 7.4% Other Livestock: donkeys, goats 1 1.0% Total Agriculture: 7 10.1%
Residential
One Family Year-Round Residence 4 1.8% Rural Residence with Acreage 2 2.6% Seasonal Residences 36 13.7% Mobile Home 2 0.2% Total Residential 44 18.3%
Vacant
Residential Vacant Land 18 29.0% Residential Land including a Small Improvement 9 4.2%
Rural Vacant Lots of 10 acres or less 11 2.9% Abandoned Agricultural Land 4 7.4% Residential Vacant Land over 10 acres 12 15.8% Vacant Land located in commercial areas 1 8.8% Total Vacant 55 68.1%
Community Services Recreational Facilities 1 0.1%
Wild, Forested,
Conservation Lands &
Public Parks
Private Wild and Forest Lands 2 2.7% State Owned Public Parks, Recreation Areas, and Other Multiple Uses. 1 0.6%
Total Wild, Forested, Conservation Lands & Public Parks 3 3.3%
Total Parcels 110
Lake Classification
Grass Lake is classified by the NYSDEC as a class “C” lake, which means the best intended use for Grass Lake is non-contact recreation such as boating or fishing. This classification does not imply that one should not swim in Grass Lake, only that it is best suited for other non-contact activities.
Lake Accessibility
There is a state-owned boat launch on Grass Lake. The launch is a beach launch that is suitable for small or trailered light boats that can be pushed off a trailer into the water. There is a 10-horsepower motor limit on all boats launched at the state boat launch. The

73
boat launch area has parking for approximately five vehicles. This site allows public access to the lake, though it is difficult to locate.
Use
A survey sent out to all watershed property owners asked lake users to identify how they used Grass Lake. Fishing, boating, swimming and aesthetic uses were the most cited uses. Figure 30 (a-d) identifies the spatial density of uses around Grass Lake.
Figure 30. Lake use within Grass Lake according to 2013 survey.

74
Legacy of Management
Some of the earliest records regarding Grass Lake date back to the late 19th century. In 1876 citizens from Alexandria and Theresa petitioned for increased fishing regulations on Grass Lake (Watertown Re-union, Nov. 23, 1876). Fish were being stocked in Grass Lake as early as 1881 (Watertown Re-union, Feb. 03, 1881). In 1889, H.H Thompson, a man from Brooklyn, wrote an article in The American Angler detailing a trip he made to Grass Lake. He calls the lake “one of the best lakes for black bass and pickerel in this state” (The Daily Journal Oct. 05, 1889). There are countless other mentions of plentiful and large fish in Grass Lake during this period. In 1914 a local resident John C. Fulmer and other concerned citizens petitioned the New York State Conservation Commission to grant additional protections to the fish of Grass Lake. The cited reason for increased regulations was “risk of extinction”; these increased regulations were granted (The Hammond Advertiser, Nov. 26, 1914). Similar petitions were submitted to the State in 1916, 1921, and 1930. In each case additional regulations were granted.
The formation Grass Lake Association in 2003 continued the legacy of concern for the lake while marking a new era of organized democratic management on Grass Lake. The stated purpose of the Grass Lake Association is:
….to provide care, protection, maintenance, purity and conservation of the Grass Lake within Jefferson and St. Lawrence Counties and its adjacent areas, as well as plant life, wildlife and the ecological system of that area. To promote, encourage, sponsor and conduct activities that would educate and inform property owners in the area and general public and governmental agencies on topics and issues relating to the above purpose. To promote, maintain a spirit of cooperation and good fellowship among the residents of the Lake. (Constitution of Grass Lake Association, Inc. 2009)
In order to realize this purpose, it is important to first understand what “care, protection, maintenance, purity and conservation” mean to the members of the Grass Lake Association and what they hope to see in the future.

75
Chapter 2: What you want—scenarios and limitations
To better understand the vision of the stakeholders, a survey asked all property owners within the Grass Lake watershed what they saw as the best case scenario and worst case scenario for Grass Lake ten years in the future. The most mentioned characteristics of the best case scenario for Grass Lake were improved fishing, high water quality, fewer weeds, improved swimming, and less development (Figure 31). Characteristics mentioned in the worst case scenario were the inverse of those mentioned in the best case scenario. Sections portraying the current state, best case scenario, and worst case scenario were developed to communicate the idea that Grass Lake is a dynamic system that has the potential to look and function significantly differently in the future. Figure 32 shows the location of section cut lines used in developing the scenario sections.
Figure 31. Most mentioned characteristics of the Best Case Scenario for Grass Lake.

76
Figure 32. Cut lines indicating what views of Grass Lake sections AB, CD, and EF depict.

77
Figure 33. A visualization of the current conditions on Grass Lake.

78
Figure 34. A visualization of conditions mentioned in the survey as the worst case scenario for the future of Grass Lake.

79
Figure 35. A visualization of conditions mentioned in the survey as the best case scenario for the future of Grass Lake.
80
It is important to understand that natural resources, like Grass Lake, are complex, variable, and unique systems and that our understanding of them is limited at best. Thus, when making management decisions it is important to have a vision of where you’d like to end up and to take steps toward achieving that vision, but it is equally as important to understand that the outcome of these activities is often variable and uncertain.
Uncertainty comes in two forms – reducible and irreducible (Carpenter 2002). Reducible uncertainties can be dealt with; these uncertainties arise from a lack of, or low quality, data. This uncertainty can be reduced through implementing monitoring programs that contain quality assurance and quality control measures and targeted research projects. Irreducible uncertainty lies outside the realm of ecological prediction due to the unknown distribution of factors, some of which are outside human control that drive reality (Carpenter 2002). Both of these types of uncertainties should be recognized when managing a natural resource.
Figure 36 represents a theoretical framework for managing natural resources that incorporates scenarios, uncertainty, and aspects of adaptive management. Actions taken at the lower end of the management spectrum (e.g. doing nothing) are more likely to result in the system remaining at its current state or shifting towards the worst case scenario. Actions toward the higher end of the management spectrum (e.g. improving septic systems around the lake) are more likely to result in the system remaining at its current state or shifting towards the best case scenario. However, due to system uncertainty, the extent and possibly direction of these shifts in the state of the lake is unknown. Though it can be seen that doing something is better than doing nothing, this does not mean that you should do everything since every action taken can have a significant and lasting impact on the lake. As action increases toward the higher end of the management spectrum, the system reaches its natural limits. The natural limits of the system are defined as the condition of the lake pre-human impact. If management actions are taken past this point, the system shifts from a natural – though managed - system to a more engineered system. The horizontal axis of this framework represents time, with time moving forward going from left to right. As actions are taken and the system begins to shift, monitoring and evaluation of the impacts of actions taken should be done at regular intervals. If the system is not responding well, or at all, a re-evaluation of the actions should occur. Thought and care should be taken when selecting management strategies. Again, it is important to understand that actions taken can have significant and lasting impacts and the result of these actions is not entirely predictable. It is also important to make sure that adequate plans for monitoring and evaluation are in place.

81
Figure 36. Theoretical framework for lake management.

82
Chapter 3: How to get there—management options
This chapter outlines stakeholder actions that can be taken in an attempt to shift the lake towards the best case scenario (BCS) described in the stakeholder surveys.
3.1 BCS Characteristic: Improved Fishery
Management of the fishery on Grass Lake is, for the most part, carried out by New York State. Grass Lake is a public lake, having a state boat launch that is open to the public, so New York State, through the NYSDEC, has a stake in the lake and performs fishery monitoring and management activities such as surveys and stocking programs.
The lake association can impact fishery management activities through additional stocking programs. The lake associations resources may be better spent dealing with other issues, such as water quality (which directly impacts the fishery), rather than attempting to directly manage the fishery, as the NYSDEC has the expertise and already established programs to directly manage the fishery on Grass Lake. The lake association can be involved in this management by bringing concerns to the NYSDEC as documented by ongoing monitoring or recognizing the need for changing fishing regulations.
3.2 BCS Characteristic: High Water Quality
Water quality can be improved through a variety of management activities both within the lake and within the watershed. Table 6 provides an outline of the current state of several important water quality parameters and how they relate to water quality criteria and guidelines. Grass Lake fails water quality criteria for several water quality parameters. There are many methods for improving water quality to meet these standards. Methods for improving water quality can be separated into watershed management and in-lake management. Many of the current water quality problems within Grass Lake can be attributed to eutrophication – or an over-abundance of nutrients. Phosphorus is the nutrient of main concern within Grass Lake. Phosphorus reduction would likely lead to improvement in other water quality parameters.

83
Table 6. Standards, guidelines, and current condidtions of water quality parameters within Grass Lake.
Parameter Standard/Guideline Current Condition in Grass Lake
Phosphorus
Standard: None in amounts that will result in growths of algae, weeds and
slimes that will impair the waters for their best usages. Guideline: 20 ug/L.
At several times during 2012-2013 sampling Grass Lake failed to meet both the narrative standard and numerical guideline for phosphorus concentrations.
pH Standard: Shall not be less than 6.0 nor more than 9.5 (NYS ECL Sec. 703.3)
The pH standard was exceeded at both the high and low end of the standard range in individual samples. At no time was the entire water column average in violation of the standard.
Dissolved Oxygen
Standard: The minimum daily average shall not be less than 5.0 mg/L, and at no time shall the DO concentration be less than 4.0 mg/L (NYS ECL Sec. 703.3)
The dissolved oxygen standard was violated in the hypolimnion of Grass Lake for an extended period of time in late summer 2013.
Nitrogen
Standard: None in amounts that will result in growths of algae, weeds and
slimes that will impair the waters for their best usages.
This standard may have been violated due to presence of algae blooms in late summer 2013- though phosphorus limits growth of algae in Grass Lake
Watershed Management
Watershed management practices for improved water quality typically focus on reducing nutrient inputs into waterbodies. These activities are long-term management strategies that attempt to solve the root of the problem. Since ecological responses to these management activities is often gradual and not immediately detectible, sustained management effort is essential. Watershed management can include alteration of behaviors to prevent degradation as well as improving or adding infrastructure that can improve water quality.

84
Option 1: Best Management Practices (BMPs): Agriculture, Forestry, and Construction
What are they?
Best Management Practices attempt to increase or maintain water quality through implementation of specific practices that reduce runoff and other pollution. There are BMPs for each major activity/land-use that occur within a watershed – namely in the agricultural, forestry, and construction fields. The focus of many of these practices is to reduce the movement of soils and sediments (and thus nutrients and other pollutants) into a waterbody. The agricultural BMPs include nutrient, herbicide, and pesticide management strategies. These strategies could reduce water column phosphorous and nitrogen concentrations which in turn could improve oxygen and pH values within the lake.
Vegetated buffers are a common BMP used in agricultural and forestry operations. The concept is to plant or conserve a vegetated area between streams or other waterbodies and areas of high erosion/ nutrient loading risk such as crop fields, pasture, logging roads and landings. A vegetated buffer can intercept sediment and nutrients before it enters the stream/waterbody and thus serves to help maintain water quality.
Silt fences are often used in logging and construction operations to reduce sediment transport into a waterbody. This is done by the forester or contractor by identifying areas that are at risk for erosion and installing a silt fence to prevent the movement of sediment into the waterbody.
Some other examples of agricultural best management practices include crop rotation, conservation tilling, fertilizer management, manure management and pesticide management. Forestry best management practices can include proper siting and construction of logging roads and landings and winter harvesting. Construction best management practices can include mulching, straw bale barriers, and waste management. These are just a few examples of how steps can be taken to maintain water quality during these ongoing operations.
Is this applicable to Grass Lake?
Yes. BMPs can be implemented to any activities that take place within the watershed. Forestry and construction BMPs may be of greater relevance due to the small proportion of agriculture within the watershed. The Grass Lake Association can raise awareness amongst members and the general public about BMPs and ask that association members use contractors that adhere to these practices. Many BMPs can be written into local laws and codes which can be advocated for by members of the lake association. The Jefferson County and St.

85
Lawrence County soil and water conservation districts offer information, technical assistance, and funding for some BMP programs.
Option 2: Constructed Ponds/Wetlands
What are they?
Detention basins are engineered management strategies that attempt to reduce sediment and nutrients from entering the lake. Detention basins are often connected to streams or roadside ditches. The water from the stream/ditch enters the basin, where the sediment can drop out of suspension before entering the lake. Water could also be treated with chemicals, such as alum, while in a detention basin to remove phosphorus. This strategy could reduce water column phosphorous and nitrogen concentrations which in turn could improve oxygen and pH within the lake.
Are these activities applicable to Grass Lake and the Grass Lake Association?
Not easily. The landscape restricts sites where construction of detention basins might be effective on streams. Generally speaking, the low/seasonal flow of the streams in the Grass Lake watershed make these strategies ineffective. This strategy could be more easily be implemented on roadside ditches within the watershed. Roadside detention basins would need to be coordinated with local highway departments.
Cost?
Variable. It is difficult to estimate cost for constructed pond/wetlands since they are very site specific.
Option 3: Lakescaping
What is it?
Lakescaping can be defined as landscaping/aquascaping of water front properties with the purpose of improving water quality. A major component of lakescaping is to have a vegetative buffer on the lake shore; lakescaping can also include allowing some growth of aquatic vegetation around your dock. Maintaining natural cover and reducing the amount of impervious surfaces within the watershed could also fall under the lakescaping category. Lakescaping attempts to reduce nutrient loads to the lake through the settling of sediments, and biological uptake of nutrients. This strategy could reduce water column phosphorous and nitrogen concentrations which in turn could improve oxygen and pH values within the lake.

86
Is this applicable to Grass Lake?
Yes. There are many opportunities for lakeside residents to apply lakescaping practices to their properties. Some areas are more suited to lakescaping than others.
Cost?
Variable. The cost of lakescaping is dependent on the property and on the approach. Some aspects of lakescaping, like not mowing to the water’s edge, can be done at no monetary cost to the property owner
Option 4: Improving/Maintaining Septic Systems
What is it?
Septic systems can be a major source of nutrients to a lake. Installation of advanced treatment systems, such as those that remove phosphorous from the effluent, can greatly reduce the phosphorous load to a system. Proper maintenance of existing septic systems can also reduce nutrient loads to the lake. This strategy could reduce water column phosphorous and nitrogen concentrations which in turn could improve oxygen and pH values within the lake.
Is this applicable to Grass Lake?
Yes. The soils within the Grass Lake watershed are unsuitable for septic tank absorption fields, so in order to improve water quality existing septic systems must at least be properly maintained if not replaced with above ground advanced treatment systems.
A septic system inspection program may be organized by the Grass Lake Association to assess the current state of septic systems within the watershed. Most companies that service septic systems can be contracted to inspect septic systems. A dye test can be used by property owners to assess septic system failure. Property owners must enter into inspection programs voluntarily.
Cost?
The cost of properly maintaining a septic system is typically between $100-$300 per household per year; while the cost of replacing a failing or installing an advanced treatment septic system can range from $3,000 - $10,000 per household. If camps are close together some lakeside residents may consider sharing a clustered system with other property owners around them; this can reduce costs to individual households.

87
Financial assistance is available for those with failing septic systems who wish to replace their septic systems in the form of low/no interest loans from the Clean Water State Revolving Fund. (EPA 2015).
In-Lake
The majority of in-lake management activities are short term in nature – dealing with symptoms of water quality degradation rather than the cause. These activities can allow a lake to meet water quality criteria on a shorter time scale, but they come at a cost and are typically not long term solutions. However, if external factors negatively impacting lake use have already been addressed, in-lake management strategies can be useful in achieving long-term water quality. The following options could be pursued in an attempt to improve water quality through management actions that take place within the lake itself.
Option 5: Aeration/oxygenation
What is it?
Aeration/oxygenation involves the direct addition of air or pure oxygen to the lake in an attempt to increase oxygen concentrations. This strategy may also improve several other water quality parameters; it may reduce internal phosphorous loading by preventing anoxia at the lake bottom and the extent of local pH fluctuations.
Is this applicable to Grass Lake?
Somewhat. Aeration and Oxygenation would likely be successful in increasing oxygen concentrations within Grass Lake. This strategy requires significant upfront costs for the oxygenation/aeration system, as well as long term costs for operation and maintenance of the system. This management strategy works only as long as the system is in operation; when the system goes out of operation the oxygen problem will return, perhaps worse than before. There are also aesthetic costs associated with this strategy. Though this management strategy may improve oxygen concentrations in the short-term it may not currently be feasible for the Grass Lake Association. A permit from the NYSDEC is required to conduct this management strategy.
Cost?
The typical cost for an oxidation/aeration system for $500-$3000 per acre of treated area (Holdren et al. 2001). The treated area on Grass Lake would be the area covered by the hypolimnion (~85 acres), so treating Grass Lake could cost $42,500-$255,000. Much of this cost is for the installation of these systems, though once installed there are operating costs.

88
Option 6: Artificial Circulation
What is it?
Artificial circulation attempts to increase water column oxygen concentrations through breaking thermodynamic stratification through physical movement of water.
Is this applicable to Grass Lake?
No. This approach has challenges that are similar to that of aeration/oxygenation. Though oxygen concentrations could be improved it would only be while the destratification system is in operation. The system comes at a lesser cost than aeration/oxygenation systems, but results are more varied. The cool-water fishery in Grass Lake may be jeopardized if the thermodynamics of the lake were significantly altered. Lakes with high nutrient loads may not respond to this approach, so this could be a concern with Grass Lake. There are also aesthetic costs to this approach, as it may detract from the natural aesthetic surrounding grass lake. A permit from the NYSDEC is required to conduct this management strategy.
Cost?
The typical cost for an artificial circulation system is for $300-$7000 per acre of treated area (Holdren et al. 2001). The treated area on Grass Lake would be the area covered by the hypolimnion (~85 acres); the cost for treating Grass Lake could cost $25,000-$595,000. Much of this cost is for the installation of these systems, though once installed there are operating costs.
Option 7: Nutrient Inactivation
What is it?
Nutrient inactivation attempts to reduce the amount of phosphorous in the water column and reduce its rate of internal loading. It is typically accomplished by addition of an aluminum salt which precipitates phosphorus from the water column and collects it into a chemically stable floc that settles on the bottom of the lake. The treated area should correspond to the area of lake bottom that experiences prolonged anoxia, which in the case of Grass Lake is the area underlying the hypolimnion.
Is this applicable to Grass Lake?
No. If internal loading were shown to be a major source of water column phosphorus, this strategy would be effective at reducing the rate of loading. However, this method is ineffective if external phosphorus loading has not been

89
dealt with. The cost of nutrient inactivation may be a significant barrier to implementing this strategy. Results for this management strategy last between 4-21 years (Cooke et al. 2005) and alum would need to be reapplied for continued results. A permit from the NYSDEC is required to conduct this management strategy.
Cost?
The cost for a typical nutrient inactivation treatment costs $800-$1300 per acre of treated area. If the area underlying the hypolimnion were treated on Grass Lake (~85 acres) one treatment could cost $68,000-$110,000 (Holdren et al. 2001).
Option 8: Dilution
What is it?
Dilution attempts to reduce phosphorous in the water column through addition of low nutrient water.
Is this applicable to Grass Lake?
No. Water of low nutrient content is not readily available. Import of such water to Grass Lake may bring with it invasive species, unless it is pre-treated. Heat or filtration treatments add an additional cost to this management strategy. The outlet of Grass Lake is not equipped to handle increased discharge, without the possibility of flood damage downstream. Little is known about the movement of water within Grass Lake so detailed lake hydrology needs to be determined before this method is applied. This management strategy must be often repeated to maintain results.
Cost?
The cost for a typical dilution treatment is dependent on the availability and locality of water low in nutrients but can cost $500-$25,000 per acre (Holdren et al. 2001).
3.3 BCS Characteristic: Fewer Weeds
Though often referred to as weeds, aquatic plants are a natural and essential part of the lake ecosystem. They provide habitat for aquatic organisms, seasonally sequester nutrients, and stabilize the substrate. However, they are often viewed as nuisances because they can impede lake uses such as boating and swimming. Actions taken to reduce aquatic plants, if taken too far, may be at odds with actions taken to improve the fishery. Therefore localized management of use impairing aquatic plant assemblages is recommended in order to balance fish habitat with boating and swimming uses.

90
It should also be noted that decreasing the amount of aquatic vegetation can impact algal populations within Grass Lake. It is often found that a large decrease in aquatic vegetation (macrophytes) can lead to an increase in planktonic algae within the lake. This is primarily due to the increased availability of nutrients that would have been used by the aquatic vegetation. In some cases a lake can shift from a macrophyte dominated system to a system dominated by planktonic algae. The reversal of this shift can be difficult (Scheffer and Jeppesen 1998).
Option 9: Sediment Covers
What is it?
Sediment covers, also called benthic barriers, are typically a fabric or similar material that is laid atop the lake bottom to locally deter plant growth. While sediment covers can locally reduce plant growth they may also locally limit benthic invertebrates, decrease oxygen concentration at sediment water interface, and limit fish spawning.
Is this applicable to Grass Lake?
Yes. Sediment covers offer an effective way to control use impairing plant assemblages in targeted areas while maintaining habitat for fish and other wildlife in other parts of the lake. NYSDEC should be consulted before installing sediment covers.
Cost?
Sediment Covers can be constructed by the homeowner at a cost of about $0.41 per square foot or purchased commercially for around $1.00-$1.25 per square foot (or $30,000-$40,000 per acre). Commercially available sediment covers are usually around 150-250 square feet in size.
Option 10: Hand pulling
What is it?
Hand pulling is a method of plant management that involves removal of aquatic vegetation by hand. Hand pulling can be selective meaning only certain species are pulled, or that only a certain area is pulled. Hand pulling is only effective in the short term and regular maintenance of hand pulled areas is required for sustained efficiency. To increase the effectiveness and reduce the possibility of spread of nuisance plants, all plant fragments should be removed from the waterbody and disposed of in an appropriate location.
Is this applicable to Grass Lake?

91
Yes. Though hand pulling is inefficient on a large scale it can be effective at locally reducing use impairing plant assemblages. A permit from the NYSDEC is not required to perform this management strategy.
Cost?
There is no monetary cost to hand pulling, though it can be very time consuming.
Option 11: Herbicides
What are they?
Herbicides attempt to reduce aquatic vegetation through the application of specifically formulated chemicals. There are many different types and formulations of herbicides; Table 7 addresses the similarities and differences of several herbicides. Though herbicide applications can be effective in dealing with use-impairing plant assemblages, they can impact other systems and uses. Some herbicides can be harmful to non-target organisms, temporarily restrict lake use, and may cause a release of nutrients allowing for new growth. Herbicide applications typically need to be done periodically, every 1-5 years, to maintain results.

92
Table 7. Overview of common herbicides used in aquatic plant management (Holdren et al. 2001).
HerbicideSystemic/
ContactEffective on… Selective?
Spot treatment?
Response Time (days)
Exposure Time (days)
Temporary Use Restrictions?
Toxicity to Aquatic Life
2,4-D Systemic floating,
submersed, emergent
Yes Yes 5-7 1.5-3 Yes Variable
Fluridone Systemic floating, submersed Yes 30-90 30-60 Low
Triclopyr Systemic floating ,submersed Yes Yes 5-7 0.5-3.5 Yes Low
Endothall Contactfloating, submersed,
emergent Yes 7-14 0.5-1.5 Yes Moderate
Glyphosate ContactFloating ,emergent
only Yes 7-10 NA Low

93
Is this applicable to Grass Lake?
Somewhat. Localized herbicide treatments can be used to selectively target a species of concern in a designated area. An herbicide treatment requires a permit from the NYSDEC and may require a survey of the existing aquatic plant community.
Cost?
Depending on the herbicide selected a typical application can cost $200-$1500 per acre of treated area (Holdren et al. 2001)..
Option 12: Biomanipulation
What is it?
Biomanipulation attempts to reduce nuisance aquatic vegetation through manipulating the biological community within the lake, typically through introduction of a species that will eat the nuisance vegetation. Some of these introduced species will target only specific plants, while others are generalists. Table 8 details several species that can be used to control aquatic plants.
Table 8. Overview of species used in bio-manipulation strategies for aquatic plant management.
Species Target species Cost Effective density
Milfoil Weevil (Eurchyopsis
lecontei)
Very selective toward Eurasian water-milfoil
~$1200 per 1000 adult weevils
200-300 per square
meter
Triploid Grass Carp (Ctenopharyngodon
idella)
Generalists, have distinct feeding
preferences but do not favor
Eurasian Water-milfoil.
$13-15 per fish
10-15 fish per acre
for medium-high plant
density Watermilfoil Moth
(Acentria ephemerella)
High preference for milfoil, but will eat
other plants.
Not commercially
available ---

94
Is this applicable to Grass Lake?
No. Biomanipulation has not been proven to be effective in removing nuisance submerged aquatic plant assemblages. Since many biomanipulation strategies involve the stocking of invertebrates, these types of additions would be ineffective in Grass Lake due to the high abundance of pan fish. Stocking of triploid grass carp may be effective in reducing the overall plant population in Grass Lake but it would most likely result in a major decline in native species and an increase in dominance of Eurasian water-milfoil. The required infrastructure, such as a dam with a weir, is currently not in place for a triploid grass carp stocking program. A permit from the NYSDEC would be needed to implement any biomanipulation strategy.
Cost?
See Table 8 for costs associated with several different species used in biomanipulation strategies.
Option 13: Dredging
What is it?
Dredging involves the removal of soft sediments and associated rootstock and seedbank from the bottom of the lake. This method is intensive though it has the potential to reduce aquatic plants and improve some water quality parameters. Dredging can be done in a wet or dry environment; to achieve dry dredging conditions the lake must be drained. Wet dredging can be done with water still in the lake, but it can cause extreme turbidity. Dredging does not need to be done lake wide and can be done in localized areas. There is an extensive permitting process associated with dredging; this can be a major obstacle to implementing this strategy.
Is this applicable to Grass Lake?
No. Dry dredging would be impractical, although there is no physical reason why this wet dredging would be ineffective in reducing aquatic vegetation in the shallower areas of the lake. Wet dredging is harder and more costly than dry dredging. However, regrowth of plants would likely occur soon after the dredging operation is completed – and it would likely be dominated by aggressive nuisance aquatic plants such as Eurasian water-milfoil. The permitting process and the high cost of this management strategy make this prohibitive for the Grass Lake Association to pursue.
Cost?
The cost for a dredging operation is approximately $15,000-$80,000 per acre depending on depth of the dredging and distance to disposal site (Holdren et al. 2001).

95
Option 14: Water Level Control
What is it?
Water level control involves intentional manipulations to the water level in attempts to reduce aquatic plant growth. Increasing lake levels in the spring may inhibit growth of some aquatic plants, and increased flow may remove seeds or plant fragments from the lake. Lowering the lake level over winter can expose plants to freezing, drying, or physical damage to some plants.
Is this applicable to Grass Lake?
No. There is not adequate physical infrastructure, such as an easily accessible dam with water level control capabilities, to properly control water level on Grass Lake. Raising the lake level would likely cause flooding to several lakeside properties, and sufficient water may not be available to raise the lake level enough to make this strategy effective. Lowering the lake level may cause problems late on because there may not be sufficient water to refill the basin in the spring. For these reasons, and the current perceptions regarding lake levels on Grass Lake, make water level control an unrealistic strategy to implement on Grass Lake at this time.
Cost?
If the infrastructure is readily available this management strategy can be implemented with little cost. If infrastructure is not available this strategy can have an initial cost upwards of $25,000 (Holdren et al. 2001).
Option 15: Dyes and Surface Covers
What are they?
Addition of a dye or installation of a physical surface covers attempt to reduce the amount of aquatic vegetation through reduction of light availability for plant photosynthesis. These methods are not selective and reduce all plant growth in treated areas. Dyes are typically a lake wide application while surface covers can be installed locally. There are aesthetic costs to these strategies as they detract from the “naturalness” of the lakes view shed. These strategies are not effective at controlling emergent plants, though they may prevent rooted emergent plants from establishing themselves. Surface covers can be effective at locally reducing nuisance plant assemblages, though they restrict use of the treated area. Surface covers can also impact thermal dynamics and minimize atmospheric gas exchange in treated areas.
Is this applicable to Grass Lake?
Somewhat. These strategies have been proven effective in reducing nuisance plant assemblages in much smaller systems, such as ponds on golf courses or within housing developments. Dyes are typically used in systems which do not have an outlet; the presence

96
of an outlet on Grass Lake makes it an unsuitable system for a dye treatment. Surface covers could be installed locally around docks and swimming areas during early spring and removed prior to the beginning of the summer season to locally reduce plant growth. However, the treated areas would not be available for recreational use while the surface covers are installed.
Cost?
A dye treatment costs $100-$500 per acre of treated area. There are few commercially available surface covers specifically designed for use in lakes. Black polyethylene sheeting has been used in the past and can be readily purchased for around $0.50 per square foot ($22,000 per acre) (Holdren et al. 2001).
Option 16: Mechanical Removal
What is it?
Use impairing plant assemblages can be managed through direct mechanical removal of the plants. There are many methods for the mechanical removal of plants they include harvesting, rototilling, hydroraking, and suction dredging. Harvesting aquatic plants involves a mechanical harvester which cuts plants at a pre-determined depth, collects them, and deposits the cut fragments on shore. Rototilling and Hydroraking involve a piece of equipment which uses blades/rakes to disturb the plants, roots, and sediments in the treated areas. Plant fragments and other debris can be collected and removed from the system. Each of these approaches can be applied locally to use impairing assemblages, though they are not selective within the treated area. All of these methods have the potential to negatively impact aquatic fauna and spread nuisance vegetation through uncollected fragments. Rototilling and Hydroraking may stir up the sediments and create high turbidity, as well as resuspend phosphorous into the water column. Suction dredging involves a large scale submersible vacuum which can remove large amounts of plant materials; turbidity can be a concern with this method. A location for the deposition of plant fragments and other debris is a concern related to these strategies, and regulations may prevent plants classified as invasive species from being transported outside the watershed.
Is this applicable to Grass Lake?
Yes. To balance habitat with other lake uses these strategies could be implemented to manage use impairing plant assemblages. However, careful collection of milfoil fragments would be essential to prevent the spread of this nuisance species. A permit from the NYSDEC may be required to carry out any of these mechanical removal strategies in Grass Lake.
Cost?
The cost of leasing a harvester is approximately $150-300 per hour; and a harvester can harvest an acre of plants in 4-8 hours for a total cost of approximately $900-$2700 per acre

97
(Holdren et al. 2001). A partnership with other lake associations in the region could reduce costs for mechanical removal of aquatic plants.
Invasive Species Management
Management of aquatic invasive species is relevant to maintaining acceptable amounts of aquatic vegetation within the lake. The following are several management activities that can be used in an attempt to prevent the spread of aquatic invasive species
Option 17: Aquatic invasive species education
What is it?
Increasing the knowledge and awareness pertaining to the identification of and threats associated with aquatic invasive species to those who live around and use Grass Lake may help prevent the spread of new invasive species to Grass Lake. Aquatic species education could take the form of putting on AIS identification workshops, distributing pamphlets, or increased signage.
Is this applicable to Grass Lake?
Yes.
Cost?
Cost of implementing educational programs is variable.

98
Option 18: Aquatic invasive species disposal bins
What are they?
In an addition to increased invasive species signage at the boat launch, a bin/container is constructed/installed to remind lake users to check their boats and trailers for invasive species and give them a space to dispose of them before entering the lake.
Is this applicable to Grass Lake?
Yes. This strategy may be used in addition to the invasive species signage. The effectiveness of this strategy is dependent on lake users.
Cost?
The cost of installing a disposal bin for invasive species at the Grass Lake boat launch would be minimal. The NYSDEC should be contacted before implementing this strategy – as the boat launch is owned and operated by the state of New York.
Option 19: Boat wash
What is it?
Boat washes are used to physically remove AIS from boats and trailers in an attempt to prevent the spread of AIS. High pressure and high temperature washers or thorough drying are required to prevent the spread of AIS.
Is this applicable to Grass Lake?
Somewhat. This approach has been implemented on many larger lakes throughout New York State. It may be cost prohibitive to install, operate, and maintain a boat wash on Grass Lake, though a shared boat launch that was centrally located to many of the lakes in the Indian Lake Region could provide a shared opportunity for AIS management.
Cost?
The cost of installation, operation, and maintenance of a boat launch is variable and dependent on size and availability of infrastructure. A portable boat wash unit costs approximately $20,000 (LGPC 2014). This does not include the cost of operation.
3.4 BCS Characteristic: Improved Swimming
Improved swimming can be achieved through many of the same management activities as those for obtaining high water quality and reducing nuisance aquatic vegetation.

99
3.5 BCS Characteristic: Less Development
Though development is difficult to control, there are several tools available which can help manage development within the Grass Lake watershed.
Option 20: Landuse/Zoning Regulations
What is it?
Landuse/Zoning regulations attempt to reduce the negative impacts associated with development, and in some instances can reduce development or restrict the types of development that can occur in an area.
Is this applicable to Grass Lake?
Yes. Additional land-use regulations can be advocated for at the town and county levels. There are differences in the landuse regulations between Jefferson and St. Lawrence counties. For example, the town of Theresa, in Jefferson County, has a ‘water frontage funneling’ regulation (article 6, section 670) that requires a minimum amount of water frontage in order to allow access to any waterbody. This regulation does not exist in the Town of Rossie, St. Lawrence County. The following landuse regulations that could be advocated for in Jefferson/St. Lawrence county are just a few examples, out of many, which could reduce the negative impacts associated with un-managed development.
Implementation of the site plan review process applied to all development within the Grass Lake watershed or within a specified distance from any waterbody.
Guidelines regarding type, location, and maintenance of residential on-site waste disposal systems.
Requirement for minimum widths of vegetative buffer strips along lakeshores. Restrictions on minimum lot size, maximum house size, percentage of land cleared,
and impervious surface coverage Implementation of a ‘water frontage funneling’ regulation in the town of Rossie.

100
Cost?
There is no monetary cost for an individual or the Grass Lake Association to advocate for increased land use/zoning regulations. However, there are costs at the county/town level associated with reviewing plans and enforcing guidelines.
Option 21: Conservation easements
What are they?
Conservation easements can be placed on parcels to inhibit certain types of development.
Is this applicable to Grass Lake?
Yes. Conservation easements differ but many prohibit further development while allowing property owners to use land for recreational purposes. The Indian River Lakes Conservancy (IRLC) already owns several large tracts of land within the Grass Lake watershed and is active in the conservation and protection of area lakes. Opportunities exist, in cooperation with the IRLC, to conserve land and lessen the extent of development within the watershed.
Cost?
There is no cost for placing a conservation easement on your property. In fact, property owners may benefit from tax savings resulting from conservation easement on their land.
3.6 BCS Characteristic: Reduced algae blooms
Although algal blooms were not considered a high priority among stakeholders concern, blue-green algal blooms recorded within Grass Lake in recent years. Many of the methods used to improve water quality, especially those aimed at reducing water column phosphorus concentrations, are also expected to (proactively) control algal blooms in Grass Lake. Once a bloom presents itself it is unwise to attempt any management activities. This is especially true in Grass Lake as blooms in 2013 and 2014 were found to contain the algal toxin microcystin. Any management activity that attempts to kill a toxin containing algae bloom while it is ongoing can increase the concentration of the toxin within the water column. This is because the toxins are contained within the algal cells, and if these cells are ruptured by an algaecide these toxins are then released directly into the water column. This increases the risk of contact with these toxins. However, there are several pre-emptive management techniques that can be used in an attempt to reduce harmful algae blooms that have not been previously mentioned.

101
Option 22: Selective Nutrient Addition
What is it?
Manipulation of nutrient ratios may shift algal populations away from toxic bloom forming species to non-toxic species. For example, addition of silica and nitrogen may favor an algae community dominated by non-toxic diatoms, rather than having a community dominated by toxin forming blue-green algae.
Is this applicable to Grass Lake?
Somewhat. Theoretically, this method can reduce the occurrence of harmful algae blooms. Use as a management practice has been limited and examples of success are limited to non-existent. This strategy assumes a seed population of more favorable algal species. This method only shifts the species composition of the algal community, and it often increases algal biomass, adding additional oxidative stress to the hypolimnion.
Cost?
Since examples of lakes implementing this management practice are limited, there are no cost data available associated with this management practice. This method would need to be applied annually, and thus there would be a recurring costs to maintaining results.
Option 23: Algaecide; Early Detection and Rapid Response
What is it?
Early spring monitoring for blue-green algae cells and, if and when found, if treated with an algaecide can reduce the possibility of toxic algae blooms in late summer.
Is this applicable to Grass Lake?
Somewhat. A monitoring program is needed to detect presence of blue-green algae in early spring. Treatment using algaecides is effective in reducing algal biomass. Copper is the most common algaecide, however it is often ineffective in dealing with many blue-green algae species (Holdren et al. 2001), including Anabaena spp. and Gleotrichia spp. which form blooms in Grass Lake. While several algaecides more effective against blue-green algae are available, water use is often restricted for a period after application. Algaecide treatment may also increase oxygen stress within the hypolimnion, increase internal nutrient loading, and can negatively affect some aquatic life (Holdren et al 2001). This approach must be performed annually in order to maintain results. A permit is required from the NYSDEC before applying any algaecide.
Cost?
An algaecide treatment can cost between $70-$400 per acre depending on the formulation used (Holdren et al 2001). If the entirety of Grass Lake were treated this would be an annual cost of approximately $28,000 -$175,000.

102
Chapter 4: From scenarios to goals—a plan for action The next step for the Grass Lake Association is to review the characteristics of the best case scenarios and choose which characteristics to adopt as the Association’s goals. In order for goals to be effective they must be specific, measurable, attainable, realistic, and time bound (Doran 1981). The resources of the Grass Lake Association such as budget, manpower, and time are factors that should be taken into consideration when determining which characteristics to pursue as goals. It should be noted that some goals can be at odds with one another. In such cases one should prioritize goals or reassess the goals in order to maintain the desired characteristics of the lake. Monitoring the effectiveness of management activities and adjusting strategies based on the results of these monitoring efforts are essential for achieving goals.
4.1 Action Process
The following lays out specific steps that can be taken.
1. Identify specific goals to pursue. 2. Adopt a monitoring program to monitor success of these goals. 3. Select management options to pursue as an organization. 4. Identify and pursue possible funding sources for management activities. 5. Develop a plan for implementing the management activity. 6. Implement management activity. 7. Assess success of management activity. 8. Repeat process

103
4.2 Hypothetical Timeline
The following is a hypothetical timeline meant to illustrate how the process mentioned could be implemented.
MAY 2015
1. Grass Lake Association identifies specific goals to pursue. Improve Fishery
Increase the abundance of walleye. Improve Water Quality
Reduce extent of hypolimnetic oxygen depletion. Reduce water column phosphorus concentrations to 20 μg L-1
Fewer Weeds Prevent introduction of new invasive species to Grass Lake Reduce dock-side vegetation through hand-pulling
2. Grass Lake Association adopts a monitoring program to track the state of the lake Re-enrolling in CSLAP Starting a monitoring program that utilizes the Lake Association’s oxygen meter
3. Grass Lake Association discusses possible management options.
AUGUST 2015 1. Grass Lake Association identifies management options to pursue.
Improve septic systems around lake Utilize contractors/forestry managers that follow Best Management Practices Lakescaping Walleye stocking program Boat washing station Aquatic Invasive Species education Hand-pulling Benthic Barriers
2. Grass Lake Association forms project oriented committees. For example, a committee to research, find funding for, and implement a program
to improve septic systems around the lake. 3. Members of Grass Lake association take initiative and use lakescaping practices on their
property, implement dockside removal of use-impairing vegetation. 4. Grass Lake Association reaches out to other local organizations such as NYSDEC, soil
and water conservation districts, and municipal highway departments to discuss water quality issues concerning Grass Lake.
MAY 2016
1. Project oriented committees present the outcome of their work.

104
2. Grass Lake Association reassesses goals and discusses results of prior years’ monitoring.

105
Work Cited:
Caller, T.A., J.W. Doolin, J.F Haney, A.J. Murby, K.G. West, H.E. Farrar, A. Ball, B.T. Harris, and E.W. Stommel. 2009. A cluster of amyotrophic lateral sclerosis in New Hampshire: a possible role for toxic cyanobacteria blooms. Amyotrophic Lateral Sclerosis 10(2):101-08.
Caldwell, D.H., and others. 1986. Surficial Geologic Map of New York. New York State Museum – Geological Survey Map and Chart Series #40.
Carpenter, S.R. 2002. Ecological futures: Building an ecology of the long now. Ecology. 83(8):2069-2083.
Cohen, A.N. 1998. A review of zebra mussels’ environmental requirements. California Dept. of Water Resources. San Francisco Estuary Institute. Oakland, CA.
Cooke, D.G., E.B Welch, S.A. Peterson, and S.A Nichols. 2005. Restoration and management of lakes and reservoirs. Boca Raton, FL. Taylor and Francis.
Doran, G. T. 1981. There's a S.M.A.R.T. way to write management's goals and objectives. Management Review, Volume 70, Issue 11(AMA FORUM), pp. 35-36.
EPA. 1986. Quality Criteria for Water. Washington D.C. United State Environmental Protection Agency.
EPA. 2015. Clean Water State Revolving Fund. http://water.epa.gov Accessed March 2015.
Isachsen, Y.W. and D.W. Fisher. 1970. Bedrock Geologic Map of New York. New York State Museum and Science Service Map and Chart Series #15.
Jenkins, J., K. Roy, C. Driscoll, and C. Buerkett. 2007. Acid Rain in the Adirondacks: an environmental history. Comstock Publishing Associates. Ithaca, NY.
Lake George Park Commission. 2014. End of season report: 2013 LGPC Boat Decontamination program. State of New York Lake George Commission. Lake George, NY. http://www.lgpc.state.ny.us/.
Li, G., F. Cai, W. Yan, C. Li, and J. Wang. A Proteomic Analysis of MCLR-Induced Neurotoxicity: Implications for Alzheimer’s disease. Toxilogical Sciences. 127(2): 485-95.
Malbrouck, C., and P. Kestemount. 2006. Effects of microcystins on fish. Environmental Toxicology and Chemistry. 25(1):72-86.
Holdren, C., W. Jones, and J. Taggart. 2001. Managing Lakes and Reservoirs. N Am. Lake Manage. Soc. and Terrene Inst. in coop. with Off. Water Assess. Watershed Prot. Div. U.S. Environ. Prot. Agency, Madison, WI.
Ney, J.J. 1999. Practical Use of Biological Statistics. In Inland Fisheries Management in North America 2nd edition. Eds. Kohler and Hubert. American Fisheries Society. Bethesda, MD.

106
NYSDEC. 2007. Annual Report: Highlights and Accomplishments 2006/2007. New York Department of Environmental Conservation, Div. of Fish, Wildlife and Marine Resources, Bureau of Fisheries. Albany, NY.
NYSDEC. 2011. New York State Nutrient Standards Plan. New York State Department of Environmental Conservation. Albany, New York.
NYSDEC. 2014. CSLAP 2013 Lake Water Quality Report Summary: Grass Lake. New York State Department of Environmental Conservation. Citizens Statewide Lake Assessment Program. Albany, New York.
NYSORPTS. 2013. Real Property Data for Jefferson and St. Lawrence County 2013. New York State Office of Real Property Tax Services. Albany, NY.
Rosell, F., O. Bozser, P. Collen, and H. Parker. 2005. Ecological impacts of beavers (Castor fiber and Castor Canadensis) and their ability to modify ecosystems. Mammal Review. 35(3,4): 248-276
Scheffer, M., and E. Jeppesen. 1998. Alternative Stable States. In Ecological Studies; the structuring role of submerged macrophytes in lakes.131: 397-406.
Soil Survey Staff, Natural Resources Conservation Service. 2014. United States Department of Agriculture. Web Soil Survey. Accessed March 2015. Available online at http://websoilsurvey.nrcs.usda.gov/.
The Daily Journal. Ogdensburg, NY. October 5, 1889. A Brooklyn man who has been to black lake tells where to find good fishing.

107
OCCASIONAL PAPERS PUBLISHED BY THE BIOLOGICAL FIELD STATION (cont.) No. 38. Biocontrol of Eurasian water-milfoil in central New York State: Myriophyllum spicatum L., its insect herbivores and
associated fish. Paul H. Lord. August 2004. No. 39. The benthic macroinvertebrates of Butternut Creek, Otsego County, New York. Michael F. Stensland. June 2005. No. 40. Re-introduction of walleye to Otsego Lake: re-establishing a fishery and subsequent influences of a top Predator. Mark
D. Cornwell. September 2005. No. 41. 1. The role of small lake-outlet streams in the dispersal of zebra mussel (Dreissena polymorpha) veligers in the upper
Susquehanna River basin in New York. 2. Eaton Brook Reservoir boaters: Habits, zebra mussel awareness, and adult zebra mussel dispersal via boater. Michael S. Gray. 2005.
No. 42. The behavior of lake trout, Salvelinus namaycush (Walbaum, 1972) in Otsego Lake: A documentation of the strains, movements and the natural reproduction of lake trout under present conditions. Wesley T. Tibbitts. 2008.
No. 43. The Upper Susquehanna watershed project: A fusion of science and pedagogy. Todd Paternoster. 2008. No. 44. Water chestnut (Trapa natans L.) infestation in the Susquehanna River watershed: Population assessment, control, and
effects. Willow Eyres. 2009. No. 45. The use of radium isotopes and water chemistry to determine patterns of groundwater recharge to Otsego Lake, Otsego
County, New York. Elias J. Maskal. 2009. No. 46. The state of Panther Lake, 2014 and the management of Panther Lake and its watershed. Derek K. Johnson. 2015. No. 47. The state of Hatch Lake and Bradley Brook Reservoir, 2015 & a plan for the management of Hatch Lake and Bradley
Brook Reservoir. Jason E. Luce. 2015. No. 48. Monitoring of seasonal algal succession and characterization of the phytoplankton community: Canadarago Lake,
Otsego County, NY & Canadarago Lake watershed protection plan. Carter Lee Bailey. 2015.
Annual Reports and Technical Reports published by the Biological Field Station are available at:
http://www.oneonta.edu/academics/biofld/publications.asp