A SCALABLE, MODULAR, MULTISTAGE, PERISTALTIC ...
185
A SCALABLE, MODULAR, MULTISTAGE, PERISTALTIC, ELECTROSTATIC GAS MICROPUMP by Ali Besharatian A dissertation submitted in partial fulfillment of the requirements for the degree of Doctor of Philosophy in (Electrical Engineering) in the University of Michigan 2013 Doctoral Committee: Professor Khalil Najafi, Chair Associate Professor Luis P. Bernal Professor Yogesh B. Gianchandani Assistant Research Scientist Dr. Rebecca L. Peterson Emeritus Professor Kensall D. Wise Professor Edward T. Zellers
-
Upload
vuongthien -
Category
Documents
-
view
219 -
download
0
Transcript of A SCALABLE, MODULAR, MULTISTAGE, PERISTALTIC ...

A SCALABLE, MODULAR, MULTISTAGE, PERISTALTIC,
ELECTROSTATIC GAS MICROPUMP
by
Ali Besharatian
A dissertation submitted in partial fulfillment
of the requirements for the degree of Doctor of Philosophy in (Electrical Engineering)
in the University of Michigan 2013
Doctoral Committee:
Professor Khalil Najafi, Chair Associate Professor Luis P. Bernal Professor Yogesh B. Gianchandani Assistant Research Scientist Dr. Rebecca L. Peterson Emeritus Professor Kensall D. Wise Professor Edward T. Zellers

© Ali BesharatianAll Rights Reserved
2013

FRONTISPIECE
Finer than a strand of hair, are a thousand subtle points here:
Not everyone who tonsured head, the way of the friars knoweth!1
Hāfez Fourteenth-Century Persian Poet
1 Translated from Persian by the author.

ii
DEDICATION
To my parents:
Those to whom I owe whatever I have learned and whatever I have achieved,
and
To my sister:
For her all-time support and understanding.

iii
ACKNOWLEDGMENTS
First, I would like to express my most sincere appreciation to my thesis advisor,
Professor Khalil Najafi for his all-time support, encouragement and advice. If it was not
for his deep understanding and patience, as well as respectful and humane attitude
towards his students, going through hardships of the research would totally be impossible
for me. My sincere acknowledgement goes to Dr. Rebecca Peterson, my supervisor and
mentor, for all her unbelievably responsible, respectful and kind support of my research
over the past years. I would also like to thank my other thesis committee members,
Professor Luis Bernal, Professor Kensall Wise, Professor Edward Zellers and Professor
Yogesh Gianchandani for their guidance and support.
I would like to acknowledge my former and present group-mates and colleagues from
Najafi Research Group and from Wireless Integrated MicroSensing and Systems (WIMS)
Center, for their help, friendship and useful discussions. My special thanks goes to my
colleague Karthik Kumar from Aerospace Engineering for his help and assistance in
device testing and modeling. I would like to thank the staff and students of the Solid-
State Electronics Laboratory (SSEL) and Luire Nanofabrication Facility (LNF) at the
University of Michigan for all their help, in particular, sharing their expertise with me. I
would also like to thank Professor Karl Grosh research group at Mechanical Engineering
and the staff of Polytec facility at Dexter, MI, for their help with laser vibration analysis.
My Ann Arbor experience remains a great chapter in my life thanks to all wonderful
friends I made, or I enjoyed the company of, here. I would like to recognize and thank
them all. In particular, I would like to thank Ms. Mahta Mousavi for all her support, love
and encouragement over the past several months.
This dissertation has been dedicated to my parents and my sister, who disserve the
biggest appreciation of all. If it was not for their all-time love, sacrifice, support and
encouragement, I would not be where I am now.

iv
TABLE OF CONTENTS
DEDICATION ii
ACKNOWLEDGMENTS iii
LIST OF FIGURES vii
LIST OF TABLES xvii
NOMENCLATURE xix
ABSTRACT xxii
CHAPTER 1. Introduction……………………………………………………….. 1
1.1. The Michigan Pump………………………………………………………. 2 1.2. Thesis Contributions………………………………………………………. 3 1.3. Thesis Organization……………………………………………………….. 5 1.4. References………………………………………………………….……… 7
2. Mechanical Compression Gas Micropumps…………………….. 8 2.1. Operation Principles of Gas Micropumps………………………………… 9
2.1.1. Non-Compression Pumps………………………………………….. 9 2.1.2. Mechanical Compression Pumps…………………………………... 10
2.2. Terminology and Specifications……………………………………….….. 13 2.3. Review of Previous Work ………………………………………………… 15
2.3.1. Diffuser Pumps…………………………………………………..… 16 2.3.2. Passive Pumps…………………………………………………...…. 18 2.3.3. Active Pumps…………………………………………………..…... 20 2.3.4. Summary and Conclusion………………………………………..… 23
2.4. Peristaltic Gas Micropump for the WIMS uGC…………………………... 26 2.5. The Scalable Multistage Peristaltic Gas Micropump……………………... 28 2.6. References……………………………………………………………….… 30
3. Design of a Scalable Vacuum Micropump and Technology Requirements……………................................... 35 3.1. Micropump Operation and Design……………………………………...… 36
3.1.1. Basic Thermodynamics……………………………………………. 37 3.1.2. Primary Design Parameters………………………………………… 39 3.1.3. Building up the Peristaltic Pump……………………….................. 43

v
3.1.4. Bucket-Brigade Operation……………………………………........ 44 3.1.5. Idealized Reduced-Order Model…………………………………... 45 3.1.6. Secondary Design Parameters…………………………………….. 47 3.1.7. Summary of Micropump Modeling Results………………………. 49
3.2. Fluidic Paths and Honeycomb Pump (HCP) Architecture………………. 50 3.3. Electrostatic Actuation and Active Microvalves…………………………. 53
3.3.1. Resonance Frequency Estimation…………………………………. 53 3.3.2. Pump Membrane Damping Estimation…………………………..... 54 3.3.3. Electrostatic Force Estimation…………………………………….. 56 3.3.4. Single-Sided Actuation Considerations…………………………… 57
3.4. Scaling the Pump for High Pressure Generation…………………..…….. 60 3.4.1. Variable Volume Ratio (VVR) Design……………………………. 61 3.4.2. Modular Pressure Scheme (MPS)…………………………………. 63 3.4.3. Implementing the Scalable Multistage Pump…………………….. 64
3.5. Technology Requirements…………………………………………….….. 66 3.6. References………………………………………………………….……... 68
4. Modular Honeycomb Pump Technologies Development and Microfabrication……………………………... 69 4.1. Identifying Challenges Impacting the Previous Work……………………. 70
4.1.1. Overview of the Microfabrication Technology……………………. 70 4.1.2. Fundamental Shortcomings……………………………………...… 71 4.1.3. Practical Challenges……………………………………………….. 72
4.2. All-Silicon Modular Microfabrication Technology………………………. 74 4.2.1. Defining Micropump Fabrication Modules………………………... 75 4.2.2. Mechanical Resonator (Module A) Microfabrication……………... 77 4.2.3. Acoustic Resonator (Module B) Microfabrication………………… 84 4.2.4. Micropump Assembly and Packaging……………………………... 85 4.2.5. Technology Summary and Comparison…………………………… 87
4.3. Technologies Developed for Final Device Fabrication………………….... 89 4.3.1. Stiffening of Highly Stressed Large Area Thin Structures………... 89 4.3.2. Large Membrane Release Technique by Poly-Si Trapping……...… 96 4.3.3. Stress Control of Highly Stressed Stacked Thin Films……………. 98 4.3.4. Spin-on Packaging Technology by Polymer Reflow……………… 100
4.4. Summary of Microfabrication Results……………………………………. 102 4.4.1. Final Device Layout and Dimensions……………………………… 102 4.4.2. Final Device Microfabrication Statistics…………………………... 104 4.4.3. Summarized HCP Technology Evolution (2009-13)………………. 104
4.5. Manufacturability and Broader Impacts…………………………………... 107 4.5.1. Process Modularity………………………………………………… 107 4.5.2. Stress Control…………………………………………………….… 108 4.5.3. Single-Electrode Actuation……………………………………….... 109 4.5.4. Poly-Silicon Trapping…………………………………………........ 110 4.5.5. Vertical Striffeners……………………………………………….… 111 4.5.6. All-Silicon Technology…………………………………………….. 111 4.5.7. Spin-on Packaging Technology………………………………….… 112

vi
4.6. References…………………………………………………………………. 114 5. Micropump Testing and Experimental Results………………… 115
5.1. Overview of Devices under Testing………………………………………. 115 5.1.1. HCP Gen. 3.1……………………………………………………..... 117 5.1.2. HCP Gen. 3.2……………………………………………………… 117 5.1.3. HCP Gen. 3.4………………………………………………………. 118
5.2. Testing Methodology……………………………………………………… 118 5.2.1. Device Preparation and Interfacing………………………….…….. 119 5.2.2. Double Doppler Laser Vibrometer………………………………… 121 5.2.3. Valve Sealing Test Setup …………………………………………. 124 5.2.4. The Main Test Setup………………………………………………. 126 5.2.5. The Automated Test Interfaces……………………………………. 130
5.3. Structural Property Characterization of Membranes……………………… 131 5.3.1. Single Point Resonant Frequency Measurements…………………. 131 5.3.2. Scanning Resonant Frequency Measurements……………………. 132
5.4. Fluidic Characterization of the Micropump……………………………… 133 5.4.1. Fluidic Resistance Measurements…………………………………. 133 5.4.2. Flow rate Frequency Response…………………………………….. 135 5.4.3. Microvalve Timing (Pumping Modes)…………………………….. 136 5.4.4. Maximum Pressure Accumulation………………………………… 137 5.4.5. Summary of Flow and Pressure Measurements…………………… 138
5.5. Discussing the Experimental Results……………………………………… 139 5.5.1. Non-Idealities………………………………………………………. 139 5.5.2. Secondary Pumping Effects………………………………………... 140
5.6. References…………………………………………………………………. 141
6. Utilizing Non-Idealities and Secondary Pumping Effects……… 142 6.1. Curved Electrode Phenomenon…………………………………………… 142 6.2. Reverse/Negative Pumping……………………………………………….. 146 6.3. Valve-Only Pumps………………………………………………………… 147 6.4. Movable Valve Electrodes………………………………………………… 152 6.5. References………………………………………………………………… 153
7. Conclusions and Future Directions……………………………… 154
7.1. Summary of the Research………………………………………………… 155 7.2. Future Work……………………………………………………………..… 158 7.3. Final Remark………..…………………………………………………..… 159

vii
LIST OF FIGURES
Figure Page
2.1. ………………………………………………………………………………… 10 Principle construction of a mechanical compression gas micropump
2.2. ………………………………………………………………………………… 11 Maximizing flow rate in compression pumping, utilizing fluidic resonance
2.3. ………………………………………………………………………………… 13 Informal classification of gas micropumps
2.4. ………………………………………………………………………………… 14 A basic pump performance curve, obtained by connecting several operating points, resulted from different loads applied to the pump.
2.5. ………………………………………………………………………………… 16 Stemme’s valve-less diffuser pump prototype (left), and operation principle (right)
2.6. ………………………………………………………………………………… 17 Cross sectional view of the diffuser pump developed by Gerlach et al.
2.7. ………………………………………………………………………………… 17 Double chamber valve-less diffuser pump, developed by Olsson et al (from left to right): operation, SEM view of a diffuser, top and bottom views of the device
2.8. ………………………………………………………………………………… 18 Thermo-pneumatically actuated passive pump, developed at KfK, Germany (1994).
2.9. ………………………………………………………………………………… 19 Self-priming passive pump, developed by Kämper, et al. (Germany), 1998.
2.10. ……………………………………………………………………………..… 21 The bi-directional asymmetric micropump with self-blocking, buffering and coupled resonance effect, VAMP, developed by Stehr, et al (Germany) 1996.
2.11. ……………………………………………………………………………..… 21 Cross-sectional view and the operation cycle of the DDM developed by Cabuz et al, at Honeywell Inc. Labs.
2.12. ……………………………………………………………………………..… 23 The high-compression vacuum pump, developed at MIT: Cross section of the chamber with very low dead-volume (left), and the photographed pump (right). Actuators not included.

viii
2.13. ……………………………………………………………………………..… 24 Gas pumping performance, vs. the membrane size
2.14. ……………………………………………………………………………..… 26 Conceptual illustration of pressure accumulating multi-stage micropump (left), and the smallest pumping unit (2-stage) of the gas micropump, reported by Kim et al (right).
2.15. ……………………………………………………………………………..… 27 The checkerboard microvalve configuration: top view (left) and side view (right)
2.16. ……………………………………………………………………………..… 29 The single pumping cell (2-stage) of the Scalable Michigan gas micropump (left), and photograph of the fabricated 24-stage micropump, using the new modular fabrication technology.
3.1. ………………………………………………………………………………… 36 Conceptual diagram of an individual stage of the Michigan Pump
3.2. ………………………………………………………………………………… 37 Hexagonal single-electrode checkerboard microvalve “electrode-membrane” pair (Left), and cross-section of the single electrode checkerboard microvalve (Right)
3.3. ………………………………………………………………………………… 41 Stage input pressure normalized by the ambient pressure, as a function of stage number for zero net flow, and different pump volume ratios.
3.4. ………………………………………………………………………………… 43 Two possible peristaltic pump configurations: straight (top) and twisted (bottom) chain.
3.5. ………………………………………………………………………………… 44 The smallest pumping unit, consisted of two pumping stages.
3.6. ………………………………………………………………………………… 44 One pumping cycle for a 4-stage Michigan Pump, and corresponding actuation signals: (a) Compression of bottom cavities, (b) Gas transfer from bottom to top cavities, (c) Compression of top cavities, (d) Gas transfer from top to bottom cavities.
3.7. ………………………………………………………………………………… 47 Numerically solving the system of equations resulted from the reduced-order model.
3.8. ………………………………………………………………………………… 48 Important microvalve dimensions (impacting LV and LE) to be used in CFD simulations
ix
3.9. ………………………………………………………………………………… 49 Shift from the thermodynamic model at high frequencies, for: (Left) different LV’s, and (Right) different LE’s.
3.10. ……………………………………………………………………………..… 50 simplified 3D view of a single pumping cell (left), and, two possible fluidic configurations of a cell (right)
3.11. ……………………………………………………………………………..… 50 an 18-stage pump layout, resulted from blocks of Fig.13, introduced by Kim et al
3.12. ……………………………………………………………………………..… 51 Hexagonal counterparts of Fig. 3.13 and 3.14
3.13. ……………………………………………………………………………..… 52 one-, two-, three- and four-tier symmetries, corresponding to single valve, 4-stage, 12-stage and 24-stage pump configurations, respectively.
3.14. ……………………………………………………………………………..… 56 12-stage and 24-stage Honeycomb Pump (HCP) configurations
3.15. ……………………………………………………………………………..… 56 Maximum pump electrode air damping for different gap heights and hole sizes at f = 35kHz.
3.16. ……………………………………………………………………………..… 58 Membrane deflection simulation, using COMSOL Multiphysics
3.17. ……………………………………………………………………………..… 59 A pump configuration with “normally-released” pump membranes, formed by choosing a bottom-to-top (BT) input.
3.18. ……………………………………………………………………………..… 60 Differential pressure per stage of a 50-stage micropump with Vr = 98%
3.19. ……………………………………………………………………………..… 62 VVR designs targeting 0.7atm and 0.2atm, resulting in constant pressure distributions (1260Pa and 3260Pa per stage), and linear pressure rise.
3.20. ……………………………………………………………………………..… 63 Modular Pressure Scheme (MPS), resulting in a linear pressure distribution, very close to Fig. 3.19 results.
3.21. ……………………………………………………………………………..… 64 Design strategy for a scalable multistage micropump

x
3.22. ……………………………………………………………………………..… 64 (Left) stacking several CVR micropumps to form an MPS with Vr0 < Vr1…< Vr4, versus (Right) a monolithically fabricated 24-stage VVR micropump (bottom cavities shown).
4.1. ………………………………………………………………………………… 71 Summary of Kim’s fabrication process: 1-a) recess DRIE, B-doping (conductivity/etch-stop) and oxidation (insulation) to define the electrodes, 1-b) etch hole DRIE to define the cavity height, 1-c) curved-electrode release and cavity formation by TMAH etch, 2-a) Parylene deposition and patterning on sacrificial PR, 2-b) PR removal and Parylene release, 3-a) Parylene bonding and film transfer, 3-b) top wafer bonding to encapsulate the pump, 3-c) inlet/outlet DRIE, dicing, and fluidic ports assembly.
4.2. ………………………………………………………………………………… 76 Bonded-Aligned approach (top), versus the Modular Membrane-Cavity approach (bottom)
4.3. ………………………………………………………………………………… 79 Summary of (not to scale) Module A Fabrication Process for a membrane-electrode pair of a microvalve: a) thermal oxidation to form the doping mask, followed by DRIE of trenches, b) boron doping and oxide stripping, c) poly silicon deposition and patterning, d) O-N-O membrane and N-O stress compensating layer deposition and patterning, and e) metal deposition and patterning, followed by DWP in EDP.
4.4. ………………………………………………………………………………… 81 SEM Imaging of Module A: side-view of all layers, before release (top left), side-view of refilled doped trenches, before release (top right), backside view upon EDP release (middle), backside view of the trench grid and (111) crystal planes (middle – in the frame), released membranes/electrodes – some membranes partially-removed on purpose to show the electrodes (bottom left), and close-up of the a sliced valve electrode (bottom right).
4.5. ………………………………………………………………………………… 82 Module A under Optical Microscope: front view of a valve and pump – the valve membrane intentionally removed for better visualization of the electrode (top left), close-up of a pump membrane edge showing all layers in detail (top right), close-up of a valve electrode holes (middle left), backside view of 12-stage pump (middle right), close-up of vertical stiffeners from backside (bottom left), and front view of valve electrodes from backside (bottom right).
4.6. ………………………………………………………………………………… 83 Fabricated Module A: full-wafer release of 4-, 12- and 24-stage mechanical resonators, ready for assembly and packaging (top), front-view of released wafer, after removal of a number of devices, using a razor-blade (bottom left), and backside view of a separated 4-stage device (bottom right).

xi
4.7. ………………………………………………………………………………… 84 Fabricated Module B: Dual layer multiple height SU-8 processing for PDMS molding (top left), molded thin (500um) PDMS, detached from the SU-8 mold (top right), isotropically-etched glass, using HF and Cr-Au mask (bottom left), microscope image of etched glass wafers, showing an undercut of 1.5X (middle), and hexagonally-diced glass pieces, used for packaging (bottom right).
4.8. ………………………………………………………………………………… 85 Micropump Final Packaging and Assembly: Modules A (Mechanical Resonator) is sandwiched between two pieces of Module B (Acoustic Resonator) to complete the micropump. (Fluidic interconnects and channels are not shown).
4.9. ………………………………………………………………………………… 86 Completed (Assembled) Micropump: packaged 4-stage micropump w/ CVR (top left), packaged 12-stage micropump with two pressure modules and extended electrical pads for stacking capability to form an MPS (top right), packaged 24-stage micropump w/ VVR (middle), front view of a packaged microvalve (bottom left), and backside view of a packaged microvalve (bottom right).
4.10. ……………………………………………………………………………..… 89 Early membrane-electrode release attempts (HCP Gen 1.1 – Jun 09) – all devices curled upon release, due to high tension and lack of support structures.
4.11. ……………………………………………………………………………..… 90 Backside view of a 4-stage pump (exaggerated) with vertical support structures added (left), and trench layout (with proper fluidic paths) to realize such structures (right).
4.12. ……………………………………………………………………………..… 91 a) Trench opening not pinched, due to insufficient thickness of the refill material, and b) void at the trench bottom, due to lowered deposition rate of the refill material inside the trench.
4.13. ……………………………………………………………………………..… 91 Conceptual diagram, showing PPTV, PPTL and PPTD, for a given PPTC, oxide mask, and trench depth/opening (not to scale – in particular, the decay of PPTV(y) inside the trench is exaggerated).
4.14. ……………………………………………………………………………..… 93 Shallow boron doping (45min at 1175C): vertical stiffeners partially dissolved in EDP, due to insufficient boron concentration at the bottom of trenches (top), and deep boron doping (6hrs at 1175C): vertical stiffeners survive the EDP etch (bottom.)
4.15. ……………………………………………………………………………..… 94 Results of the developed a “neck-free” etch recipe on STS Pegasus DRIE tools, which gives a 15% width reduction for AR = 15 (left), and the resulted refilled trench bottom (right).

xii
4.16. ……………………………………………………………………………..… 95 Snapshot of the honeycomb trench layout with different number of lines.
4.17. ……………………………………………………………………………..… 95 a) Top view of a trench grid aligned with <110> line, (b) cross-section along of the same grid along A-A, upon doping, refilling and release – the bulk silicon “trapped” by (111) planes.
4.18. ……………………………………………………………………………..… 95 Refilled doped trench grid with 5um opening, 25um spacing and 85um depth; 45deg view (left), and side view (right).
4.19. ……………………………………………………………………………..… 96 Island Poly-Si (left), Doped Poly-Si support rims (middle), and Poly-Si Trapping (right)
4.20. ……………………………………………………………………………..… 97 Etched shallow ring resulted from the developed DRIE recipe.
4.21. ……………………………………………………………………………..… 98 Cross-sectional view of deposited thin films at membrane edge, with stress values shown
4.22. ……………………………………………………………………………..… 99 Poly-Si film stress at different points of the process; at 2400A thickness, at 19200A thickness, upon 45min of N2 annealing at 950oC, and upon natural annealing during O-N-O deposition: a) Separate annealing step prior O-N-O, b) Separate annealing step after O-N-O, c) No separate annealing step practiced. (Three monitor wafers used in each case)
4.25. ……………………………………………………………………………..… 100 backside view of a 24-stage micropump (Gen. 1.8) placed on a glass slide with spun-on PDMS and cured (left), and close-up of the sealed cavity walls from backside (right).
4.26. ……………………………………………………………………………..… 101 Backside of devices with trench grid, packaged using PDMS (left), and SU-8 (right).
4.27. ……………………………………………………………………………..…101 Oblique view of sealed cavities using SU-8, where the polymer reflow lines and glass cavity lines can be seen (left), close-up of the same device to show the polymer (right).
4.28. ……………………………………………………………………………..… 102 Fabricated single valve structure: front side (left), and backside (right) views.

xiii
4.29. ……………………………………………………………………………..… 103 Layout snapshots of a microvalve die: B-Dope (top left), Trench Grid (top right), Poly-Si (middle left), Field Oxide (middle right), Membrane (bottom left), and Metal (bottom right).
4.30. ……………………………………………………………………………..… 106 Full wafer view (left) and layout snapshots (right) of major device generations for Module A: Gens 1.x (top), 2.x (middle), and 3.x (bottom).
5.1. ………………………………………………………………………………… 120 4-, 12- and 24-stage micropumps, mounted and wire-bonded on costume PCBs, ready for electrical interfacing and testing (left), and clos up of wire-bonded pads (right).
5.2. ………………………………………………………………………………… 120 Fluidic connection of the pump, using a fluidic port, made of a piece of Tygon tubing, and a capillary tubing, assembled using low temperature wax (left), and fully interfaced micropump (electrical and fluidic) ready for testing.
5.3. ………………………………………………………………………………… 121 Sealed nitrogen-purged box for particle free pump testing. The box accommodates two mass flowmeters and a pressure sensor.
5.4. ………………………………………………………………………………… 122 Block diagram of the single point LDV setup
5.5. ………………………………………………………………………………… 122 Photo of the single point LDV setup at the Vibration Laboratory of the University of Michigan. Reflected pattern believed to be caused by membrane hole patterns (same topography as the electrode, transferred to membrane through sacrificial layer), and was used to focus the beam.
5.6. ………………………………………………………………………………… 123 linear chirp function, producing a waveform w/ continuously increasing frequency (top), and transient membrane displacement calculated by integration of the recorded velocity of the LDV system, using MATLAB – frequency doubling is due to the use of bipolar signal (bottom).
5.7. ………………………………………………………………………………… 124 Block diagram of the “valve sealing and pull-in voltage measurement” setup.
5.8. ………………………………………………………………………………… 125 Valve sealing and pull-in voltage measurement, by fluidic resistance measurement, for different applied pressures. Top trace shows the applied voltage, bottom shows the flow rate change.

xiv
5.9. ………………………………………………………………………………… 126 Experimental setup used to control the micropump.
5.10. ……………………………………………………………………………..… 127 Bipolar signals used to actuate the micropump. Each plot shows two cycles of pumping. Dashed traces show: pump membrane motion (top), pump membrane signal (middle and bottom).
5.11. ……………………………………………………………………………..… 127 Conceptual timeline of actuation and rest-time for frequency sweep
5.12. ……………………………………………………………………………..… 128 Charge accumulation and dielectric breakdown, due to operation of the pump using a unipolar trapezoidal waveform (i.e. positive net surface under the waveform).
5.13.a. …………………………………………………………………………..… 128 valve timings (case 1) for inlet/outlet valves (top) and transfer valves (bottom), showing: top (inlet/outlet) top = 0, tcl = 0.2 and rise time = 0.1 and, bottom (transfer) top = 0, tcl = 0.25 and rise time = 0.1
5.13.b. …………………………………………………………………………..… 129 valve timings (case 2) for inlet/outlet valves (top) and transfer valves (bottom), showing: top (inlet/outlet) top = 0.1, tcl = 0.15 and rise time = 0.1 and, bottom (transfer) top = 0.05, tcl = 0.27 and rise time = 0.1
5.14. ……………………………………………………………………………..… 130 Micropump controller developed in MATLAB to generate corresponding signals and interpret flow and pressure data.
5.15. ……………………………………………………………………………..… 131 Spectral analysis of a pumping membrane in air: actuation and membrane velocity measurements (top), and data analyzed by MATLAB to obtain the resonant frequency (bottom).
5.16. ……………………………………………………………………………..… 132 Resonance frequency measurement for all pumping membranes of a 24-stage pump, using a scanning LDV system: velocity (top) and displacement (bottom).
5.17. ……………………………………………………………………………..… 133 Static (DC) fluidic resistance measurements for microvalves
5.18. ……………………………………………………………………………..… 134 Dynamic fluidic resistance measurement, when the valves are operated using a sinusoidal waveform (left), and close-up of the same measurement data (right).
5.19. ……………………………………………………………………………..… 135 Flow rate versus actuation frequency, for a 24-stage pump of Gen 3.4

xv
5.20. ……………………………………………………………………………..… 136 Valve Timing optimization for a 12-stage micropump
5.21. ……………………………………………………………………………..… 136 Flow rate measurements for a 24-stage micropump. A sine wave and trapezoidal waveform with amplitudes 59 Vrms and 150 V respectively are used to operate the pump.
5.22. ……………………………………………………………………………..… 137 Droplet moved by a 24-stage micropump when operated at 7.5 kHz.
5.23. ……………………………………………………………………………..… 137 Pump-down, by a 12-stage device of Gen.3.4: flow rate – only one of the two flowmeters of the setup is shown (top), and differential pressure of 4.4kPa (bottom).
6.1. ………………………………………………………………………………… 143 Out of plane “zipper” electrode for low voltage electrostatic actuation
6.2. ………………………………………………………………………………… 143 Valve electrode buckling for a 24-stage device and single valve structures (left), and SEM image showing a valve electrode buckling.
6.3. ………………………………………………………………………………… 144 Measured curvature for valve and pump electrodes of Gen. 3.1, using a Dektak 6M profilometer. While pumps show completely flat electrodes, valves exhibit up to 15um of curvature.
6.4. ………………………………………………………………………………… 144 Valve electrode pattern for: Gen. 3.1 (left), and Gen. 3.2 (right).
6.5. ………………………………………………………………………………… 145 Two methods used to study the correlation between electrode pattern and its curvature: cantilever beams w/ varying hole gradients (top), and square electrodes w/ varying hole size/spacing.
6.6. ………………………………………………………………………………… 146 Flow rate versus frequency for a 4-stage device from Gen. 3.2 – both positive and negative flow can be observed.
6.7. ………………………………………………………………………………… 147 Fluid dynamics modeling of valve pumping, using the 4-stage reduced order model of [5], when pumping membranes and their corresponding cavities are eliminated: normalized pressure variation in two adjacent stages when only inlet/outlet and transfer valves are actuated (left), and the resulted flow rate vs. frequency, generated by valve-only pumping

xvi
6.8. ………………………………………………………………………………… 148 the 12-stage pump with all pumping membranes removed (crossed-out in the photo), under test.
6.9. ………………………………………………………………………………… 148 The measured flow generated by valve-only pumping for the 12-stage pump of Fig. 6.8
6.10. ……………………………………………………………………………..… 149 The measured pressure accumulation generated by valve-only pumping for a 4-stage pump, when pumping down from atmosphere. The evacuated chamber size is around ~5cm3.
6.11. ……………………………………………………………………………..… 149 The microvalve mass transfer: starting from the released state (top), the valve membrane is drawn towards the closed side, pushing out a fluid plug and creating a microjet (middle), and (bottom) the valve membrane restored to the open side, without pushing a fluid plug.
6.12. ……………………………………………………………………………..… 150 Timing of valve-only pumping (not to be confused with actuation signals), for (a) inlet/outlet membrane pull-in, (b) transfer membrane release, (c) transfer action: transfer valve open, (d) transfer membrane pull-in, (e) inlet/outlet membrane release, and (e) catch action: inlet/outlet valve open.
6.13. ……………………………………………………………………………..… 151 The proposed 20-stage compact valve-only pump architecture, with 1-D fluidic paths, for high flow applications.
6.14. ……………………………………………………………………………..… 152 (a) Trapped bulk silicon using (111) planes, resulting in “hinged” electrodes, when the poly-Si ring is over-etched, and (b) the proposed “crab-leg” electrode design to realize moving valve electrodes

xvii
LIST OF TABLES
Table Page
2.1. ………………………………………………………………………………… 15 Typical performance requirements of mechanical gas micropumps.
2.2. ………………………………………………………………………………… 25 Summary of the mechanical compression micropumps, reported so far.
3.1. ………………………………………………………………………………… 42 Primary/Critical Design Parameters – to be controlled accurately
3.2. ………………………………………………………………………………… 48 Secondary Design Parameters – should be controlled accurately
3.3. ………………………………………………………………………………… 49 Summary of preliminary design parameters
3.4. ………………………………………………………………………………… 53 Summary of HCP configurations, compared in (fluidic/geometrical) symmetry and size.
3.5. ………………………………………………………………………………… 54 Membrane material properties and thicknesses, used in fabrication of the pump (Chapter 4)
3.6. ………………………………………………………………………………… 57 Generated valve and pump membrane pressures for different applied voltages
3.7. ………………………………………………………………………………… 67 Summary of important design parameters, their significance and technology requirements
3.8. ………………………………………………………………………………… 67 Primary and secondary design features of the Scalable Michigan Gas Micropump
4.1. ………………………………………………………………………………… 73 Practical challenges of Kim’s fabrication technology and their effect on different parameters
4.2. ………………………………………………………………………………… 80 Detailed fabrication process flow and list of lithography steps for HCP Module A.

xviii
4.3. ………………………………………………………………………………… 88 Comparing the New Modular Fabrication Technology with that of the Old Michigan Pump
4.4. ………………………………………………………………………………… 92 Effect of trench depth on PPTV and mask opening on PPTL, for different doping times, when EDP used as the etchant (PPTC = 5e19cm-3).
4.5. ………………………………………………………………………………… 102 Final device layout characteristics
4.6. ………………………………………………………………………………… 104 Final Fabrication Statistics for Different Device Generations of Module A
4.7. ………………………………………………………………………………… 105 Summary of microfabrication technology evolution (Apr’09 to Apr’13).
5.1. ………………………………………………………………………………… 116 Summary of main devices tested (with major improvements and achievements listed)
5.2. ………………………………………………………………………………… 119 Summary of testing methodologies used for micropump performance analysis
5.3. ………………………………………………………………………………… 134 Fluidic resistance measurement data for different generations of fabricated devices
5.4. ………………………………………………………………………………… 138 Summary of micropump flow and pressure results analysis
6.1. …………………………………………………………………………………145 Valve electrode curvature and pull-in voltage prior and upon modifying its hole pattern

xix
NOMENCLATURE
Speed of Sound
Adiabatic Index
Efficiency
Density
Stress
A Membrane Area
AR Aspect Ratio
BMM Bulk Micromachining
Cr Compression Ratio
CCR Constant Compression Ratio
CFD Computational Fluid Dynamics
CPD Critical Point Drier
CVD Chemical Vapor Deposition
CVR Constant Volume Ratio
DAQ Data Acquisition
DRIE Deep Reactive Ion Etching
DWP Dissolved Wafer Process
EDP Ethylenediamene Pyrocatechol
ERC Engineering Research Center
ES Electrostatic
f Frequency
F Force
HCP Honeycomb Pump
hg Membrane Gap Height
hc Cavity Height
Kn Knudsen Number
LE Inertial Length

xx
Ls Sealing Length
LV Viscous Length
LHE Pump Electrode Hole Length
LHV Valve Electrode Hole Length
LNF Luire Nanofabrication Facility
LPCVD Low Pressure Chemical Vapor Deposition
MEMS Microelectromechanical Systems
MPS Modular Pressure Scheme
M Number of Pump Stages
n Polytropic Constant
NEP Number of Pump electrode Holes
NEV Number of Valve Electrode Holes
NM Number of Valve Membrane Holes
PDMS Polydimethylsiloxane
Poly-Si Polycrystalline Silicon
PZT Lead Zirconate Titanate
PPTC p++/p+ threshold concentration
PPTD p++/p+ threshold depth
PPTL lateral p++/p+ threshold
PPTV vertical p++/p+ threshold
P Pressure
P Differential Pressure
Pj Stage Pressure
Pin Inlet Pressure
Pout Outlet Pressure
Pdmp Squeeze Air Damping Pressure
P-hg Collapse Pressure
Prestore Restore Pressure
Q Mass Flow rate
R Pump Load
rc Hole Size
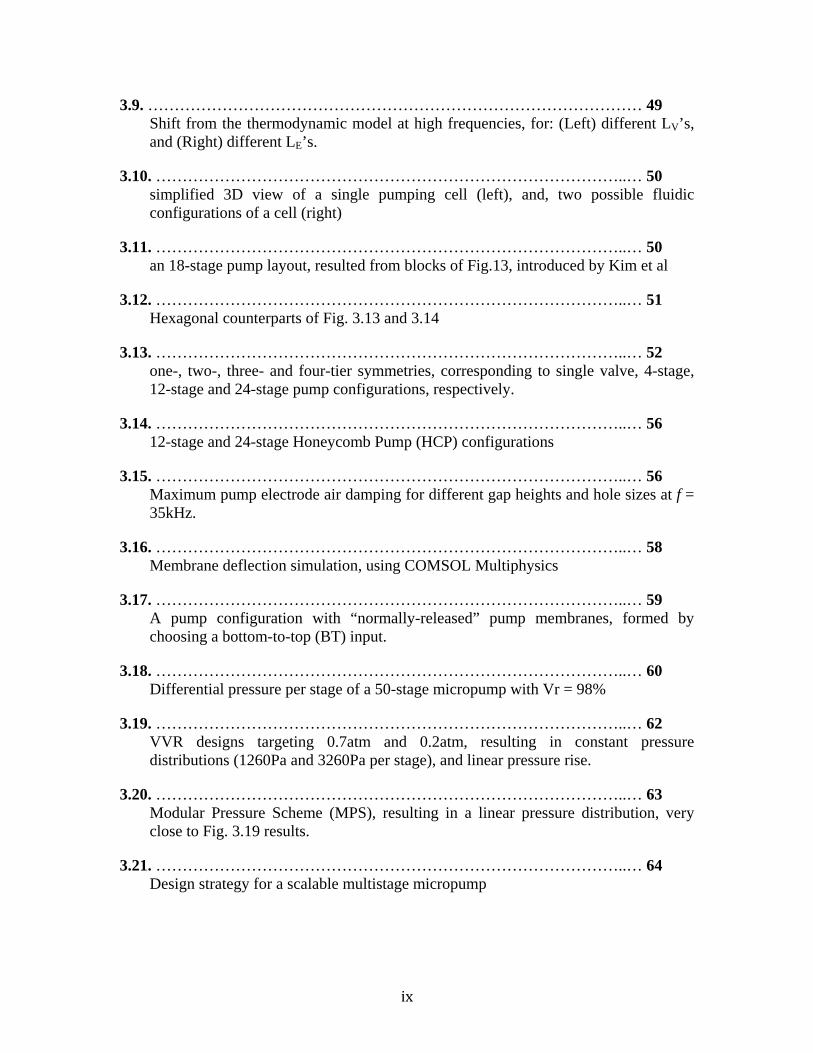
xxi
ro Perforation Period
SiO2 Silicon Dioxide
Si3N4 Silicon Nitride
SF Sealing Factor
Sd Pump Die Size
Sp Pump Package Size
Str Trench Spacing
tE Electrode Thickness
tM Membrane Thickness
tcl Valve Close Time
top Valve Open Time
TMAH Tetramethylammonium Hydroxide
GC Micro Gas Chromatograph
VAMP Valve and Micropump
VCR Variable Compression Ratio
VVR Variable Volume Ratio
Vc Cavity Volume
Vmax Maximum Cavity Volume
Vmin Minimum Cavity Volume
Vr Volume Ratio
Vpull-in DC Pull-in Voltage
V Stroke
WIMS Wireless Integrated MicroSystems

xxii
ABSTRACT
A SCALABLE MODULAR MULTISTAGE PERISTALTIC
ELECTROSTATIC GAS MICROPUMP
by
Ali Besharatian
Chair: Khalil Najafi
Miniaturized gas pumps are needed in many emerging environmental, health
monitoring and homeland security applications. Pressure and flow are important
requirements, which in turn demand high-force, large-stroke, high frequency and low-
power actuators, providing of which remains a big challenge in miniaturization and
integration of gas micropumps. Distributing the pumping action onto several small low-
force and low-power pumping stages is a potential method to address this issue, which
can be done using cascaded (high pressure) and parallel (high flow) multistage
configurations; however, previous works have only been successful in utilizing the latter.
This is mostly because cascaded stages experience different operating conditions,
resulting in non-uniform pressure distribution, and hence, limited scaling capabilities.
This work addresses the scalability issues of the previous works, by introducing a
novel multistage design, named Variable Volume Ratio (VVR), which results in uniform
pressure distribution, regardless of the number of cascaded stages used. While this
enables high-pressure differentials, high flow rates also become possible by utilizing
fluidic resonance. Moreover, a novel modular fabrication technology is introduced, to
implement the resonance-based uniform pressure distribution scheme, as well as
addressing feasibility issues, caused by complex microfabrication.
xxiii
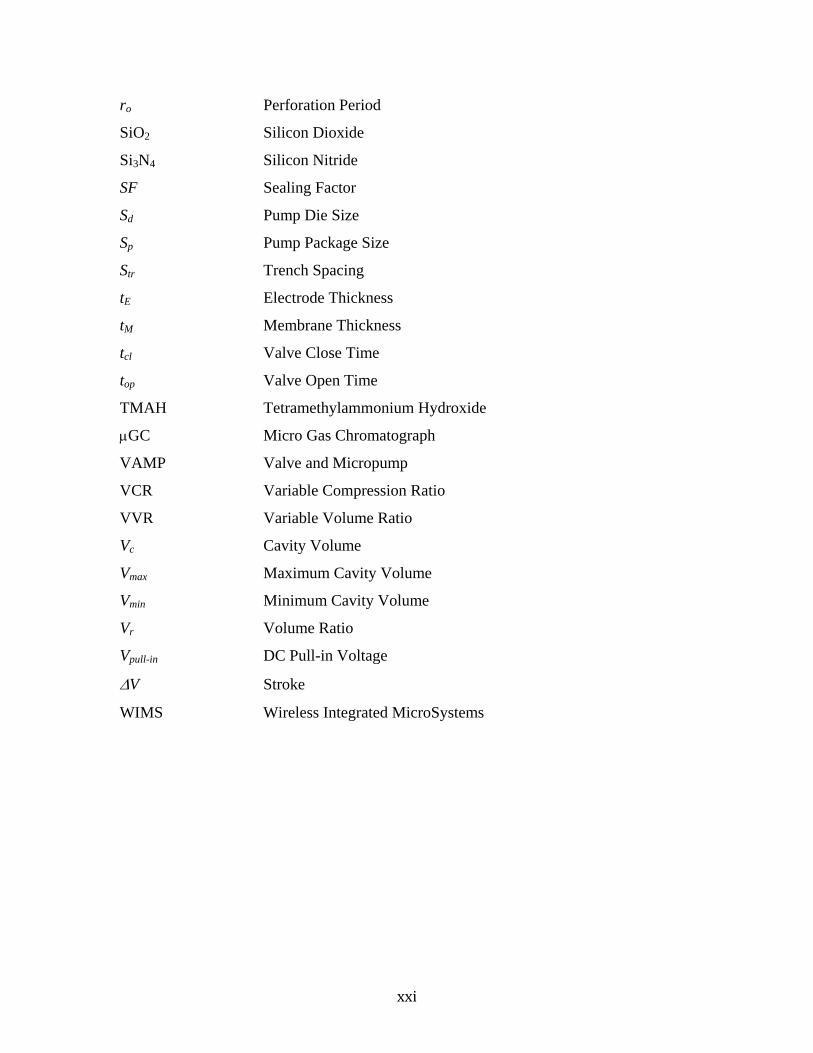
By dividing the device fabrication into a sensitive membrane-electrode module and an
insensitive cavity module, the modular fabrication technology enables implementation of
the variable volume ratio scheme, and also significantly simplifies the device fabrication,
testing and characterization. The mechanical resonator (the sensitive fabrication module)
consists of pumping membranes (stacked silicon dioxide and silicon nitride films) and
electrodes (doped single crystal silicon), as well as support structures (doped trenches
refilled with poly-silicon). The acoustic resonator (the insensitive fabrication module)
consists of large, easy-to-align glass pieces that provide pumping cavities, as well as the
device package. Several supporting technologies have been developed in order to
implement the modular fabrication technology. In particular, a novel, all-silicon, single
wafer, high aspect-ratio, wet-release bulk and surface poly-silicon MEMS technology has
been developed for release of large-area, thin membranes with accurately controlled
parameters. Moreover, an area-efficient scalable multistage architecture (Honeycomb
Pump) is introduced, providing 100% area utilization. The all silicon fabrication
technology provides >90% membrane release yield with <5% error on primary and
secondary design parameters, and full control over stage volume ratio and resonance.
Several device generations have been fabricated and tested with a 24-stage pump,
consisting of 12 pumping membranes and 25 valve membranes each measuring 4 mm2,
having the largest number of stages ever monolithically integrated on a single chip.
Experiments have successfully demonstrated cavity-membrane resonant frequencies
ranging from 10 to 40 kHz, a flow rate of 0.36 sccm, accumulation of 4.4 kPa of
differential pressure over twelve pumping stages, and power consumption as low as
10 mW. A number of secondary and sometimes unwanted pumping effects (in particular,
the “valve-only pumping”) as well as process non-idealities (in particular “curved
electrode” phenomenon) have also been observed and characterized. Methods to
minimize, or utilize, these effects for improving pump performance are reported, resulting
in the introduction of new classes of gas micropumps and new techniques in realizing
easy-to-fabricate MEMS actuators.

1
CHAPTER 1
INTRODUCTION
Miniaturized gas pumps are needed in many emerging environmental, health
monitoring and homeland security applications [1]. In particular, recent advances in
handheld chemical analysis and monitoring instruments, such as portable gas
chromatographs and mass spectrometers, have increased the demand for high
performance micro gas pumps, to be utilized as high flow pumps, roughing pumps or
high vacuum pumps [2]. Although conventional meso-scale pumps satisfy flow rate and
pressure requirements of some of these systems, they are power and size inefficient, and
hence, they limit the miniaturization and portability of any system that utilizes them.
By the use of Micro Electro Mechanical Systems (MEMS) technology, realization of
high performance and power/size efficient micro-scale pumps, known as micropumps
that can be produced on large-scale, low cost, and with high reliability, has become
potentially possible. However, most previous efforts have been focused on developing
liquid micropumps, while only a few gas micropumps have been reported [1]. Reported
gas micropumps, despite advances in some performance parameters, have not yet been
able to replace meso-scale pumps, due to the need for large area or high force actuators
[3], lack of integrated actuation, high cost, and most importantly, slow pumping speed
and power and size inefficiencies [4]. Most of these shortcomings arise from the fact that
the available micropumps have failed to improve their performance in the micro domain
against scalability. The scalability issues result from small or limited forces available in
the micro domain, while unwanted effects such as friction and damping increase
exponentially. As a result, most of the reported gas micropumps have improved only one
performance parameter at the cost of other parameters (e.g. achieve high pressure at the

2
cost of flow rate, or power), and in some cases, they even hinder the main purpose of
miniaturization, by exhibiting very poor power efficiency, extremely slow operation, or
even using huge external actuation setups, e.g. pneumatic actuators.
1.1. THE MICHIGAN PUMP
Two performance parameters are usually considered the most useful in developing
gas micropumps: maximum pressure differential and maximum mass flow rate, which in
turn require large-stroke, high-frequency and low-power actuators. As the forces are
limited at the micro-scale, realizing such actuators remains the main challenge in scaling
gas pumps down in order to realize gas micropumps. One of the most common
approaches in addressing this issue is distributing the pumping action across several
“small and low force” actuators, which results in cascaded multistage and parallel
configurations, for high pressure and high flow rate applications, respectively.
Using many small micropumps (cells) in a parallel configuration to achieve high flow
rates is often possible (and practiced, as long as size limitations allow), since all the cells
face the same operating conditions [5]. Creating a cascaded multistage micropump,
however, remains a big challenge to date, as different stages experience different
operating conditions (e.g. different absolute pressures), as pumping proceeds. Michigan
introduced an effective method for creating a multistage pump for high pressure
applications, resulting in the first fully integrated and power and size efficient gas
micropump [6, 7]. The pump (a multistage peristaltic gas micropump or simply the
Michigan Pump) achieved the highest flow rate and pressure at the lowest power and size
ever reported by utilizing fluidic resonance, active microvalves and a multistage
configuration. It was the first fully integrated functional gas micropump, and the first gas
micropump that could effectively utilize multi-staging. As a result, the Michigan Pump
opened a new window in gas micro pumping technology, and introduced a new class of
micropumps (to be called multistage peristaltic resonant gas micropumps). However, it
suffered from a number of issues, most importantly, scalability and reliability that was
caused by both fundamental shortcomings and practical challenges.

3
Next generation high performance multistage peristaltic gas micropumps will require
microfabrication technologies that can address the scalability issues of the previous pump
caused by non-uniform pressure distribution throughout the multistage structure (primary
challenges), as well as feasibility issues caused by the complex design and micro-
fabrication process (secondary challenges). The non-uniform pressure distribution
impacts the cascading and stacking capabilities, and hence, limits the overall pressure
accumulation that the pump can achieve. On the other hand, the complex and hard-to-
control design and microfabrication technology limit the achievable frequency range and
control over stage-to-stage resonant frequencies, as well as control over stage-to-stage
compression ratios and dead volumes. It also impacts the process yield and repeatability,
which should be improved from the research and development point of view.
A modular pressure distribution scheme and a modular microfabrication approach
(both reported in this work for the first time) address the primary challenges in realizing a
truly scalable gas micropump. A highly accurate all-silicon membrane release technology
addresses both primary scalability requirements and secondary challenges by improving
the control over stage-to-stage membrane gap and stroke and membrane resonant
frequencies, as well as robustness and long-term stability. It also improves testing and
characterization capabilities at different points during device fabrication, which is of
paramount importance both from research and pump commercialization standpoints.
1.2. THESIS CONTRIBUTIONS
In this dissertation, the design, fabrication and testing of a micromachined, scalable,
modular, resonant, multistage, peristaltic, electrostatic gas micropump (to be called the
Scalable Michigan Pump) is presented. An analysis has been performed to identify the
scaling limits of the previous Michigan Pump, and variable volume ratio (VVR) design is
presented as a solution to scalability. Technological requirements to realize the scalable
design and for improving the robustness and characterization of the device are identified.
A novel, all-silicon, single wafer, high aspect-ratio, wet-release bulk and surface poly-
silicon MEMS technology has been developed for release of large-area, thin membranes
with accurately controlled parameters. An area-efficient scalable multistage architecture

4
(Honeycomb Pump) is introduced and a modular approach to realize the scalable design,
as well as to feasibly and accurately assemble and package the sensitive all-silicon
membrane module with the insensitive cavity module is presented. The HCP architecture
provides 100% area utilization and the modular fabrication technology reaches >90%
membrane release yield with <5% error on primary and secondary design parameters, and
full control over stage volume ratio and resonance. Different design variations of the
modular and scalable Michigan Pump are fabricated and measurement results are
obtained by mechanical, fluidic and electrical characterization of the pump. Variations
from the theory as well as non-idealities are studied and further utilized for future
improvements of the device and to introduce new classes of micropumps.
The results of this research can be applied to several different areas in microfluidic,
biological and pharmaceutical research and in environmental, health monitoring and
homeland security applications. Specific applications in those areas include gas
chromatographers, mass spectrometers, atomic clocks, resonant/IR sensors, power
generators, electronic cooling, micro compressors for combustion devices, micro acoustic
ejectors for propulsion and artificial smell analysis (artificial nose).
In additions to the areas listed above, the all-silicon fabrication technology, reported
in the work, can be applied to realization of a wide range of acoustic and fluidic
transducers, such as micro-jets, micro-coolers, micro-speakers, active micro-valves, etc.
To summarize, the contributions of this dissertation are:
- Identification of the challenges impacting the scalability, performance, efficiency and
repeatability of previous works, in particular, the previous Michigan Pump.
- Development of a scalable, modular, multistage peristaltic electrostatic vacuum
micropump, (to be called the Scalable Michigan Pump and used for roughing
purposes), as well as appropriate MEMS technologies to realize it.
- Validation of the micropump theory and design, and provision of statistical data for
further pump modeling and optimization through measurements.
- Identifying secondary or unwanted pumping effects and proposing ways to improve the
efficiency, and introduce a new class of pumps to be called valve only gas micropumps.
5
1.3. THESIS ORGANICATION
This rest of this dissertation is organized in six chapters:
Chapter 2 discusses the principle of different classes of micromachined gas
micropumps and reviews the terminology and output characteristics of each class. A
comprehensive review of mechanical compression gas micropumps, as well as a
comparison with the performance summary of other classes of micropumps is given and
then, the scalable modular multistage peristaltic gas micropump is introduced.
Chapter 3 presents a detailed operation analysis of the multistage peristaltic gas
micropump and identifies its scaling limits in cascading to achieve higher-pressure levels.
A new micropump architecture, called the Honeycomb Pump Architecture and a new
design architecture called variable volume ratio (VVR) are introduced, in order to
develop a scalable multistage pump that can be used as a roughing pump for high-
pressure generation. Analytical equations that can be used as design guidelines for a
resonance-based multistage design are derived and technological requirements for
improving the performance of the micropump are determined. Several numerical and
finite element analysis results are also reported to support the design and technology
requirements.
Chapter 4 introduces the modular microfabrication approach to realize the scalable
design and provide excellent characterization capability. The technologies used to realize
the previous Michigan Pump (2001-06) are reviewed first, and the main challenges
(fundamental and practical) are identified, in order to be used in developing new
microfabrication technologies to realize the Scalable Michigan Pump. To microfabricate
each device module, the following technologies are developed and presented: 1) novel
single-wafer, all-silicon, high aspect ratio technologies realized by surface
micromachining and dissolved wafer process that provide all the features required for
achieving the desired high performance mechanical module, and 2) novel chip-level,
spin-on, and polymer reflow packaging and device assembly technologies that provide
the acoustic module and sealing. The detailed layout and microfabrication process of the

6
final device, followed by a summary of technology evolution, concludes the chapter.
Chapter 5 discusses different device characterization and testing methodologies,
followed by the measurement results obtained using mechanical, fluidic and electrical
device characterizations. Several different design variations are tested and results are
compared, and an improved model to interpret the results is presented. Failure analysis is
presented and non-idealities impacting the device performance are summarized.
Chapter 6 covers unwanted and secondary pumping effects, as well as the non-
idealities listed in Chapter 4. It further suggests methods to utilize all these effects to
improve the overall pumping performance, and introduce new classes of gas
micropumps. In particular, a “valve-only pumping” phenomenon is presented, and
utilized to realize novel pumps in which both pumping and flow control is carried out
using microvalves.
Chapter 7 briefly summarizes this research and gives recommendations for future
work and improvement in device performance.

7
1.4. References
[1] D.J. Laser and J.G. Santiago, “A review of micropumps”, J. Micromech. Microeng., 14, R35-R64, 2004.
[2] H. Kim, W. H. Steinecker, S. Reidy, G. R. Lambertus, A.A. Astle, K. Najafi, E.T. Zellers, L.P. Bernal, P.D. Washabaugh and K.D. Wise, “A Micropump-Driven High-Speed MEMS Gas Chromatography System,” in Proc. Transducers’07, Lyon, France, 2007.
[3] H. Zhou, H.Q. Li, V. Sharma, and M. Schmidt, “A Single-Stage Micromachined Vacuum Pump Achieving 164 Torr Absolute Pressure,” in Proc. MEMS 2011, Mexico, Jan. 2011, pp. 1095-1098.
[4] N.K. Gupta, S. Ahn, Y.B. Gianchandani, “A Si-micromachined 48-stage Knudsen pump for on-chip vacuum”, 2012 J. Micromech. Microeng. 22 105026.
[5] C. Cabuz, W. Herb, E. Cabuz and T. Son, “The dual diaphragm pump,” in MEMS'01, Interlaken, Switzerland, 2001.
[6] H. Kim, A. Astle, K. Najafi, L. Bernal, and P. Washabaugh, “A fully integrated high-efficiency peristaltic 18-stage gas micropump with active microvalves,” in Proc. MEMS 2007, pp. 131-134.
[7] A. Astle, H. Kim, L. Bernal and K. Najafi, “Theoretical and experimental performance of a high frequency gas micropump,” Sensors & Actuators A, vol. 134, no. 1, pp. 245-256, 2007.
8
CHAPTER 2
MECHANICAL COMPRESSION GAS MICROPUMPS
A micropump is a miniaturized device used for transporting fluids that is fabricated
completely, or in parts, into a planar chip, using one or more microfabrication
technique(s). The fluid to be pumped is called the “pumping medium,” and may be liquid
or gas. Since the introduction of the first micropump in the early 1980s, several micro-
pumping principles, designs and technologies have been reported – inspired by a wide
range of applications that continue to increase in number [1]. Applications range from
biological [2-3], chemical [4] and pharmaceutical research [5] to space exploration [6]
and electronic cooling [7-8]. In general, any microfluidic transport that cannot rely on
passive mechanisms (e.g. surface tension [9, 10, 11]), or macroscale drivers (mainly
macro-pumps and gas cylinders [12, 13, 14, 15]), needs a miniaturized active liquid or
gas pump the package size of which must be comparable to the volume of the pumping
medium.
Most reported work on micropumps target liquids as the pumping medium. The
development of gas micropumps has lagged behind liquid micropumps [16-17], primarily
due to gas compressibility [18], sealing challenges and small actuation forces/amplitudes
that are achievable in the micro domain. Despite all the challenges involved, gas
micropumps have attracted a lot of attention in recent years, primarily due to their
applications in emerging portable chemical analysis and monitoring instruments, such as
gas chromatograph and mass spectrometers [19-20]. Conventional analyzers are too
expensive and large, and require complicated setups, e.g. bulky gas pumps/cylinders, to
operate. While recent advances in MEMS technology has dramatically reduced both cost
and size of many components of such systems [21, 22, 23], true miniaturization still

9
heavily depends on miniaturization of gas handlers (pumps/cylinders), which are by far
the bulkiest part of the analyzer setup. Meso-scale pumps (e.g. KNF NMP05S, the
smallest pump reported [24]) might satisfy flow or pressure requirements, but they are
power and size inefficient, and their miniaturization capability is limited, since unlike
micropumps, cannot be fabricated into a planar chip, or integrated monolithically with
other system components.
2.1. OPERATION PRINCIPLES OF GAS MICROPUMPS
Gas/vacuum micropumps have been developed in two main performance directions:
1) mechanical compression pumps for high-flow rate (>0.1sccm) and reasonable pressure
difference (<90kPa), and 2) non-compression thermal/rotary/ion pumps for high vacuum
(<10Torr). The first has applications where a high flow volume is required, such as in
micro gas chromatograph, while the latter is directly for vacuum systems, such as mass
spectrometers. Developing mechanical compression micro-pumps can benefit both high-
flow applications and high vacuum systems, since non-compression pumps rely on
roughing pumps to operate. Moreover, as discussed in Chapter 1, the main objective of
this work is to develop a high-flow and high-pressure micropump, applicable as a
roughing pump, which falls in the first group, and is described after a brief overview of
the second group.
2.1.1. Non-Compression Pumps
Non-compression micropumps are typically targeted for high vacuum creation and
include mechanical rotary micropumps [25], Knudsen micropumps [26, 27, 28], and the
sputter ion pump [29]. Other microscale high vacuum technologies, e.g. microscale
orbitron pump ([30-31]), have also been proposed, but not realized. Due to extremely low
mass transport capability, non-compression pumps are only operational in high mean-
free-paths (typically for P < 50 Torr), and hence, require roughing pumps to operate.
The Knudsen pump operates based on thermal transpiration in the free molecular flow
regime (Kn > 0.1) and was first proposed in 1910, by Martin Knudsen [32]. In recent
years, a number of meso-scale Knudsen Pumps have been reported, the best of which

10
achieved only 1.5 kPa with Helium. The first micromachined Knudsen pump [ 33 ]
achieved 55 kPa of differential pressure at 80 mW of power, but the flow rate was only
<1e-6sccm, and hence the pumped cavity was extremely small, the size of which was
only 8e-5 mm3. Higher pressures have also been reported, e.g. 90 kPa of differential
pressure when pumping down from atmosphere; however, at very high power
consumptions (>1000 mW), and very low flow rates (<1e-7 sccm) [34-35]. Such a pump
would require several days to evacuate the dead-volumes that are typical (~1cm3) in
handheld gas and material analyzers, and would consume a large amount of energy. In
summary, due to extremely slow operation, Knudsen pumps would only be functional if
supplied with the proper roughing pump technology, or at no power constraints.
Mechanical rotary pumps and ion pumps have been reported for vacuum ranges
higher than the range achieved by Knudsen pumps. The first have mostly been of interest
in industry. Career Inc. and Honeywell have separately developed rotary pumps for high
vacuum generation, achieving pressures in Torr ranges [36-37], but neither could
operate from atmospheric pressure (foreline pressure in both cases <10 Torr). The only
work reported for atmospheric pressure operation was a micro-fan pump, which did not
achieve considerable flow or pressure [38]. Ion pumps have also been reported, although
not integrated. They are limited to extremely low mass-transfer applications [39].
2.1.2 Mechanical Compression Pumps
Mechanical compression pumps are mostly used as gas flow pumps, utilizing a
moving membrane and a flow control mechanism (Fig. 2.1) to create volume change or
pressure in a chamber, and consequently, gas flow. They are also called “reciprocating
Figure 2.1: Principle construction of a mechanical compression gas micropump

11
pumps” in the literature; however, to distinguish them with liquid reciprocating
micropumps, and emphasize on their gas compression capability, the name “mechanical
compression” is used in this thesis, instead.
Gas compression is achieved by periodically compressing gases in a pumping
chamber. Compression pumps are useful for applications that require moderate vacuum
levels (pressure differentials of <90 kPa and flow rate >0.1 sccm). This is because the
pressure gradient, caused by the mechanical movement of a membrane, is efficient in the
viscous flow regime (Kn < 0.1) where gas flow is dominantly caused by the pressure
gradient rather than by molecular interactions. Gas flow pumps are actuated either
directly by utilizing electrostatic, piezoelectric, electromagnetic, and (thermo)-pneumatic
mechanisms, or indirectly by electro-osmotic mechanisms [40].
Compression pumping can maximize its flow transfer efficiency by utilizing fluidic
resonance, which is observed as a sudden peak in flow rate at a certain gas compression
frequency [41], as depicted in Fig. 2.2. Although resonance pumping can be combined
with any membrane compression mechanism, a high-speed actuation mechanism is
desired to operate the pump in the high-frequency resonance regime (>10 kHz) that is
typically available in the micro-domain. Many compression gas flow pumps operate
without resonance [42].
Figure 2.2: Maximizing flow rate in compression pumping utilizing fluidic resonance [41].

12
Gas flow pumps can also be categorized into three groups as passive, diffuser, and
active pumps, based on the type of flow-control mechanism used. The complexity of a
micropump is often determined by the complexity of the flow control technique used
[43]. Passive pumps use uni-directional normally closed inlet and outlet “check-valves.”
They provide low reverse flow and leakage thanks to the normally-closed valves,
resulting in stable gas flow control, which makes them attractive for commercial products
(e.g. Nitto Kohki [44], Bartels [45], and ThinXXS [46] Inc.). However, they suffer from
limited speed operation due to the microvalve’s slow mechanical response time, making
them unsuitable for high-speed (>10 kHz) or controllable gas pumping. Diffuser pumps
use tapered inlet and outlet passages, instead of moving membrane valves, to direct gas
flow in the forward and reverse directions. They can operate at high frequency due to the
absence of moving parts, have a simple and robust structure, and be easily fabricated.
Although diffuser pumps operate at high frequency, they are susceptible to reverse flow
and leakage due to the always-open flow paths. The lack of a physical valve to close the
flow path can limit the maximum achievable pressure to less than 10 kPa. Active pumps
use actuatable microvalves and combine the advantages of passive and diffuser pumps:
minimal reverse flow and leakage as well as high frequency and high flow, and hence
they are desired for high flow and high pressure applications, where high frequency
actuation and low leakage valves are needed at the same time.
By cascading individual pumping units with active microvalves to form a multistage
micropump configuration, compression pumping can accumulate the pressure generated
in individual pumping units, based on a peristalsis action [47]. Unlike macroscale pumps,
where peristalsis is realized by occluding a flexible tube (resulting in the flow of a
contained fluid), microscale peristalsis (liquid or gas pumps) is realized by using multiple
membranes, properly timed, to push a fluid through pump micro-channels. Peristaltic
liquid micropumps (e.g. [48]) only transfer the liquid while generating some level of
backpressure, but do not generate compression. Peristaltic gas micropumps, on the other
hand, perform compression, and hence generate pressure accumulation. Due to the use of
a multistage configuration, active microvalves, and advanced membrane timing schemes,
peristaltic gas micropumps are the most advanced compression micropump
configurations reported, capable of multiple modes of operation and adaptive pumping.

13
2.2. TERMINOLOGY AND SPECIFICATIONS
The primary factors that determine the performance of a micropump are backpressure
or maximum differential (gauge) pressure (P), minimum absolute inlet pressure (Pin)
and maximum absolute outlet pressure (Pout), maximum mass flow rate (Qmax), die size
(Sd) and power (p) are. A figure of merit ([49-50]) can be defined in the following way:
FOM (P)(Q)
(Power)(Size)
In the case of mechanical compression pumps, the inlet pressure value suffices to
describe the pump’s pressure characteristics, since these pumps operate in the viscous
fellow regime, and hence, they can operate with outlet pressures kept in near-atmosphere.
In addition to the main factors listed above for micropumps, secondary factors that are
specifically applied to evaluating performance characteristics of mechanical compression
Figure 2.3: Informal classification of gas micropumps
(2.1)

14
micropumps can be listed as: membrane size, actuation voltage levels, operation
frequency, number of pumping stages, number of operation modes, the minimum cavity
volume (Vmin), and volume ratio, Vr = Vmin/Vmax. The compression ratio is defined as Cr =
1 - Vmin/Vmax), and the dead volume is just equal to Vmin.
As shown in Fig. 2.4, by finding pressure and flow rate points for several different
loads applied to the pump and connecting the resulted points, one may obtain the Pump
Performance Line. The performance line is usually a function of input frequency,
voltage, valve timing, etc., in the case of mechanical compression pumps.
As discussed in the beginning of this chapter, mechanical compression gas
micropumps can be utilized either as high-flow pumps or roughing pumps. Both cases
have applications in the area of gas/material analyzers, two classic examples of which are
mass spectrometers (which require vacuum to operate) and gas chromatograph (which
require high flow compressors to operate). Table 2.1 summarizes the criteria for roughing
pumps required by two recent federally funded progrwams, one requested by DARPA
[51] and the other by DTRA [52].
Figure 2.4: A basic pump performance curve, obtained by connecting several operating points, resulting from different loads applied to the pump.

15
Table 2.1: Typical performance requirements of mechanical gas micropumps.
2.3. REVIEW OF PREVIOUS WORK IN MECHANICAL COMPRESSION
GAS MICROPUMPS
The first reported micropump that was targeted for gas pumping was the surface
micromachined pump, developed by Judy in 1991, at the University of Minnesota [53].
The pump consisted of electrostatically actuated small (400 um 400 um) pumping
membranes and active microvalves, realized on a single silicon wafer, using surface
micromachining. No bulk wafer processing or bonding was used (resulting in limited
mass transfer capability), yet the entire device was fully integrated using standard IC
processing and silicon micromachining. Despite the sophisticated fabrication technology,
and successful release and actuation of membranes for several design variations, no flow
or pressure data was reported in the paper. Moreover, no data on the electrostatic actuator
design and mechanism was reported, although the measured pull-in voltage for different
designs was presented. Many groups worked on developing gas micropumps reported
ever since, however over the next decade and a half, Judy’s work would remain the only
effort towards developing a fully integrated gas micropump until Michigan reported the
first functional integrated gas micropump in 2006 [54]).
DARPA HiVac DTRA MGA
Flow Rate Not Specified 3 sccm
Absolute Target Pressure 250 Torr 50 Torr
Power <400 mW <2 W
Package Size <1.2 cm3 <5 cm3

16
The rest of this section reviews previous mechanical compression pumps, classified
based on the flow-control technology used. This classification arises from the fact that
flow-control technology is the main factor that determines a micropump’s complexity,
whether structurally, or in terms of fabrication and operation principle [55]. To avoid
confusion, no data on liquid pumping are presented here. In addition, thermal, rotary or
ion pumps are not reviewed, but are briefly summarized in Table 2.X. In summary, the
following subsections discuss all major works using gas as the pumping medium that are
reasonably capable of pumping down/up from atmospheric pressures.
2.3.1. Diffuser Pumps
Stemme, et al. (at Chalmers, Sweden) reported the first experimental measurement of
a gas micropump in 1993, using diffuser pumps [56]. Originally targeted for liquids, the
pump was based on tapered passages as inlet and outlet nozzles, machined 1 mm thick
brass, as well as a thick piezoelectric disc membrane for actuation, which was manually
assembled on the 0.2 mm brass membrane (Fig. 2.5). The research inspired many future
works to develop resonance valve-less diffuser pumps, all with tapered nozzles and
manually assembled thick PZT discs. Gerlach, et al. (at Ilmenau, Germany) introduced a
better theoretical foundation (covered in Chapter 3), optimized the shape of the diffusers
and was able to achieve a high flow rate of 7.5sccm and a pressure of 2.8 kPa at 12 kHz
resonance, using smaller, 11 11 mm2 membranes [57]. In a more recent work (2002),
Schabmueller, et al. reported a similar work, but with lower performance [58].
Figure 2.5: Stemme’s valve-less diffuser pump prototype (left), and operation principle (right) [56].

17
From 1995 to 1998, Olsson and colleagues at KTH, Sweden, reported several
machined brass or micromachined silicon pumps targeted for liquids or gases [59-60-61],
all based on the valve-less diffuser design (Fig. 2.5). Notably, he optimized the original
diffuser pump, by introducing an anti-phase two-chamber structure to reduce the net flow
oscillation, by developing a microfabrication technique based on KOH etch, DRIE and
anodic bonding, and more importantly, by operating the pump at fluidic resonance for the
first time. The improved two-chamber design (Fig. 2.7), generated a high flow rate of
8 sccm and a pressure of 5 kPa, at 3~4 kHz resonant frequency. Later in 2001, Wijngaart
tested the same pump for higher frequencies (up to 40 kHz), and reported both positive
and negative pressure values (-4 kPa when used as a vacuum pump, 5 kPa when used as a
compressor). Although higher frequencies were used, the new work only generated
0.6 sccm, since the fundamental resonance mode was not used this time [62-63].
Despite the attractive valve-less and simple design, diffuser pumps suffer from low-
pressure accumulation levels, due to always-open fluidic paths that limit the gas
compression. To reach higher-pressure accumulation levels, valve leakage issues need to
be alleviated, and hence, check-valves or active valves, should be used.
Figure 2.6: Cross sectional view of the diffuser pump developed by Gerlach, et al. [57].
Figure 2.7: Double chamber valve-less diffuser pump, developed by Olsson, et al. (from left to right): operation, SEM view of a diffuser, top and bottom views of the device [59, 60, 61].

18
2.3.2. Passive Valve Pumps
By introducing check-valves in gas pumping, Büstgens, et al. (Kf-Karlsruhe,
Germany) developed the first micropump specifically targeted for gases, in 1994 [64].
Most likely inspired by liquid pumps (and unlike all diffuser pumps that would be
reported later), the pump used thermo-pneumatic actuation. A thin polyimide film was
used as the pumping and check-valve membrane, and thermo-pneumatic actuation was
realized by heating a chamber using titanium wire heaters, integrated in the pump
membrane. Due to the slow pneumatic actuation, the pump did not operate at resonance,
but at low frequencies (~5 Hz), so the flow rate was low (44 L/m). Nevertheless, it
reached 3.8 kPa of pressure accumulation, thanks to good compression and use of check-
valves. The power consumption was relatively high (450 mW) due to the heaters used,
but the operation voltage was only 15 V, and the Ø 4mm membrane was the smallest
reported at that time.
In search of liquid pumps capable of self-priming (i.e. sucking liquids from an initial
“dry-state”), researchers at the Mainz Institute for Microtechnology (Germany),
developed a check-valve gas and liquid micopump in 1998 [65], with minimized dead-
volume, and hence, very high compression ratios (Fig. 2.9). It used bulk piezoelectric
discs for actuation and was realized by microinjection molding of polycarbonates to form
the chambers, followed by hand assembly and drilling of parts and welding or gluing
them together. The pump reached moderate flow rates, as high as 3.5 sccm, but very high
Figure 2.8: Thermo-pneumatically actuated passive pump, developed at KfK, Germany (1994) [64].

19
pressure-accumulations, both as a vacuum pump (-35 kPa) and a compressor (+50 kPa),
thanks to the high compression ratio used. Unfortunately, no data on the compression
values, gas pumping frequency and chamber sizes was presented. A very similar work
with the same motivation (self-priming of liquids) was reported from Franhaufer IAF
(Germany) in the same year [66]. This work, however, used anisotropically-etched silicon
as the membrane (still hand-assembled parts and piezoelectric disc), and did not report
any pressure data for gas pumping, although it produced nearly the same flow rate.
In a quite recent work, a fully integrated “pulsed-micropump” was reported by Han,
et al. (University of Illinois) using check-valves and an electrostatically-actuated
polyimide membrane [ 67 ]. The pump used a relatively complex microfabrication
technique to realize an out of plane zipper actuator, as well as full integration of the
polymer membrane, seemingly inspired by two active pumps previously developed by
Honeywell and University of Michigan (reviewed in the next section). Despite the
sophisticated technology, the UIUC pump only reached 106 L/min flow rate, mostly due
to the low frequencies used and pulsed-actuation, but at very low power consumption
(<1 mW) and with very good flow control. No pressure data was reported.
Figure 2.9: Self-priming passive valve pump, developed by Kämper, et al. (Germany), 1998 [65].

20
2.3.3. Active Valve Pumps
Stehr, et al. (at HSG-IMIT Germany) utilized active valves in gas micropumps for the
first time ([68]), by introducing new resonance pumping mechanisms: 1) Elastic Buffer
Mechanism, where a passive membrane (buffer) is coupled with an actuated drive
membrane through coupled gas resonance; and, 2) Variable Gap Mechanism, where
asymmetric pumping action results in directional flow. By 1996, the efforts led to a
device, called “valve and micropump” or VAMP, in which the actuated membrane acted
both as an active valve and the pumping membrane, and a passive membrane acted as the
buffer. The buffer would couple with the actuator at the system’s resonance frequency,
but would lag behind the pumping membrane at frequencies slightly higher than
resonance. This would shift the compression and decompression cycles, resulting in
reverse flow. By utilizing this technique they demonstrated pumping over a wide range of
frequencies. The VAMP was manufactured by manually gluing a thick and large
(5.3 mm × 5.3 mm × 18 um) “bossed” silicon diaphragm (buffer) and a piezoelectric
bimorph (pumping membrane) on a perspex glass base, in which the flow channels were
drilled. Only the silicon buffer was micromachined (by deep boron doping and
anisotropic silicon etch to form the boss), so like all previous gas micropumps, the device
was not monolithically integrated. The VAMP generated 8 sccm of flow in either
directions, and differential pressure of 2 kPa. The frequency range for pumping was
1~2 kHz, with the flow direction switching at 1.5 kHz. It was the first work with active
valves, and the first work that utilized both compression and fluidic resonance, although
the pump operation and cycles were very complex. Like passive pumps that would be
introduced later (covered in the previous section), the VAMP was also motivated by self-
priming of liquid pumps; but in comparison, it generated higher flow rates, bi-directional
flow, exhibited more flexibility in control, and achieved less pressure accumulation, all
due to active valves. Stehr also tried to cascade multiple pumps for higher-pressure
generation, but failed to achieve considerable pressure accumulation [69]. The multistage
pump is covered in detail in Section 3.1.

21
In 2001, Cabuz, et al. at Honeywell introduced a dual-membrane structure to
minimize gas leakage and reported a high flow rate and high efficiency gas pump with
zero dead-volume, called the Dual Diaphragm Micropump (DDM) [70]. It consists of two
deep (100 m) zipper electrostatic actuators facing each other, as well as two “holed”
polymer membranes (actuated by the electrodes – one for stroke and one for flow
control), lying on top of each other, with their holes mismatching. By properly timing the
membranes (Fig. 2.12), the DDM could transfer the pumped gas from the inlet (located in
one of the electrodes) towards the outlet (located in the other electrode).
Figure 2.10: The bi-directional asymmetric micropump with self-blocking, buffering and coupled resonance effect, VAMP, developed by Stehr, et al. (Germany) 1996 [68].
Figure 2.12: Cross-sectional view and the operation cycle of the DDM developed by Cabuz, et al., at Honeywell Labs [70].

22
Like Stehr’s work, the DDM was capable of pumping in both directions, but unlike
the VAMP, it used a symmetric pumping principle for bi-directional flow, rather than a
complex asymmetric structure. While Stehr developed reverse flow by utilizing
‘membrane lag’ and hence required high frequency actuation for flow alternation,
Cabuz’s device only used valve timing to realize reverse flow, and hence, could alter the
flow direction at any frequency (although it could not operate at frequencies higher than
100 Hz, due to air damping). It was fabricated by plastic hot-embossing (to form the
electrodes and flow channels) and manual assembly of parts and a metalized Kapton
membrane. The DDM achieved the highest flow rate ever reported (30 sccm) at only
8 mW, despite the slow operation (~100 Hz). However, the pressure accumulation was
only 2 kPa, due to the low (almost zero) compression ratio, although the dead volume
was zero: The pump operated based on catching and transferring gases (the same as a
paddling action) rather than compressing them.
As part of a handheld gas chromatograph program, the Engineering Research Center
for Wireless Integrated Microsystems (ERC WIMS, now Center for Wireless
MicroSensing and Systems, WIMS2) at the University of Michigan has also conducted
several works towards realization of a gas micropump, since 2001: Muller provided
useful insights into the resonance behavior of compressible gas in a Helmholtz resonator
[71] and Chou demonstrated the controllable production of gas flows in the micro domain
[72-73]. Astle then examined the potential strategies of using active microvalves and
pumping gas through multistage chambers [74]. These efforts led to Kim’s multistage gas
micropump that, for the first time, utilized both resonance-based and peristaltic
compression pumping, with active microvalves. Moreover, Michigan’s work was the first
fully-integrated gas micropump that was functional too, and the first multistage
micropump. It reached a pressure of 17.5 kPa and a flow rate of 4.0 sccm, at a power of
only 57 mW [75]. The pump operation is covered in detail in Section 2.4.
Also reported in literature are some peristaltic gas micropumps (e.g. [76]) inspired by
liquid peristaltic micropumps that should not be confused with high-frequency peristaltic

23
gas micropumps (see Section 2.1.2). The highest flow reported is 86 L/min, due to the
use of slow external pneumatic actuation (not to be confused with thermo-pneumatic
actuation). They lack portability, due to the external actuation technique used.
A recent work by Zhou, et al. from MIT reported pressure differences up to 75 kPa
using a very high compression-ratio “single-stage” mechanical gas micropump [77]. The
pump, as shown in Fig. 2.13, consisted of a stack of multiple silicon wafers, bonded
together, using high temperature silicon fusion bonding. The key to generating
considerable pressure differences was decreasing the chamber’s dead-volume as much as
possible, resulting in very high compression ratios, and hence, very high-force actuation
is needed. The pump lacked any kind of on-chip (integrated or assembled) actuation, due
to the required large forces, so it used external macro-scale pneumatic actuation realized
by compressors and gas cylinders, instead. Due to the slow and large actuation technique,
the pump reached only 1.6 L/min of flow rate, and lacked portability, although the
chamber (without actuator) was fully-micromachined.
2.3.4. Summary and Conclusion
For more than a decade, until the report of the Honeywell DDM pump, piezoelectric
pumps ruled the development of gas micropumps. All of these works (except the work of
Büstgens) were originally intended for liquid pumping, used thick bulk piezo-discs
(usually PZT) and the devices were all realized by hand-assembly of micromachined or
Figure 2.13: The high-compression single-stage vacuum pump, developed at MIT: Cross section of the chamber with very low dead-volume (left), and the photographed pump (right). External pneumatic actuators are not shown [77].

24
machined pieces. Despite advances in flow rate and pressure generation, no work
reported a fully-micromachined micropump, primarily due to challenges involved in
miniaturization of the actuator, and hence, most of the works were hardly scalable, for
further miniaturization. All of the works (except the VAMP developed by Stehr) used
either diffuser or passive flow control technologies, lacking advanced adaptive pumping
capability, and thus most could not achieve high flow and pressure generation at the same
time. The DDM was the first functional electrostatic gas micropump, but the pump was
realized using injection molding and machining of pieces, making further miniaturization
of the pump challenging. Moreover, the DDM did not exhibit any gas compression, so it
is not suitable for high-pressure or vacuum applications. Also, recent advances in
extremely low-dead volume pumping by MIT did not address the miniaturization of gas
pumps, as it required very high force and high power external actuation, and hence could
not be used in any portable system (same issue exists for all the thermal and rotary
pumps, reviewed in Section 2.1.1). In summary, none of the works (except the Michigan
Pump) have been successful in creating a micropump that can be scaled down for further
miniaturization, mostly due to the need for high force, high power and bulky actuators.
Table 2.2 shows the challenge of integration and achieving high performance pumping at
the same time: Judy’s work, the UIUC pump and the Michigan Pump, have been the only
integrated gas micropumps, however, only the latter showed high performance.
Figure 2.14: Gas pumping performance, vs. the membrane size

25
Table 2.2: Summary of the mechanical compression micropumps reported before this doctoral work.
Until introduction of this doctoral work, the peristaltic electrostatic gas micropump,
developed by Kim and Astle at the University of Michigan, remains the only work that
has been successful in addressing pump miniaturization issues, and hence, has been the
only fully-integrated pump reported. Due to its salient features, it is chosen as a basis for
this doctoral research, which aims in developing a truly scalable multistage pump that can
be extended to any number of stages without significant loss in performance. The
following two sections review the Michigan Pump; its past and future.
Reported by Author, Latest Work Institution, Country
Integrated?
Size (mm
3)
Membrane (actuator excluded)
Com
pression?
Resonance?
Flow
Control
Input Characteristics Output Characteristics
Reference(s)
Material and Size
(mm)
Th. (m)
Drive Type
and Th. (m)
Freq. (kHz)
Max. P-to-P
Voltage (V)
Max. Flow (sccm)
Max. Diff. Press. (kPa)
Power (mW)
Judy, 1991 U. Minnesota, USA Y -
Nitride 0.4 0.4
0.2 N N A ES <0.5
- 75 - - - [53]
Stemme, 1993 Chalmers, Sweden N 283
Brass Ø 16 200 N N D Piezo
100 6 - - - - [56]
Büstgens, 1994 KfK, Germany
N - Polyimide Ø 4 2.5 Y N C Th Pn
2.0 0.005 15 0.044 3.8 450 [64]
Stehr, 1996 HSG-IMIT, Germany N -
Silicon 5.3 5.3
18 Y Y A Piezo - 1~2 100 8.0 2.0 - [18,
68]
Gerlach, 1997 U. Ilmenau, Germany N -
Silicon 11 11
33 Y Y D Piezo 100 12.1 - 7.5 2.8 - [57]
Olsson, 1998 KTH, Sweden N 255
Silicon Ø 6 200 Y Y D Piezo
150 3~4 30 8.0 5.0 - [59-61]
Kämper, 1998 Mainz IM, Germany N 504
Brass Ø 10 100 Y Y C Piezo
- - - 3.5 -35 +50 - [65]
Linnemann, 1998 IFT, Germany N 168
Silicon 5.7 5.7
40 N Y C Pizeo - .2~1.2 120 3.0 - - [66]
Wijngaart, 2000 KTH, Sweden N 255
Silicon Ø 6 100 Y Y D Piezo
100 33 60 0.6 -4.0 +5.0
- [62-63]
Cabuz, 2001 Honeywell Inc., USA N 450
? Kapton Ø 13 - N N A ES
- <0.1 200 30 2.0 8 [50]
Schabmueller, 2002 U Southampton, UK N 122
Silicon 7 7
70 Y Y D PZT 250 2.5 190 0.690 - - [58]
Kim/Astle, 2006 U. Michigan, USA Y 330
Parylene 2 2
2.0 Y Y A ES 0.6 1~20 250 4.0 -17.5 57 [74-
75]
Jeong, 2006 Ritsumeikan, Japan N - PDMS
Ø 1 98 Y N A N.A. 0.003 N.A. 0.086 - N.A. [76]
Zhou, 2011 MIT, USA N 300
Silicon Ø 3 10 Y N A N.A. 0.005 N.A. 0.001 -75 N.A. [77]
Han, 2012 UIUC, USA Y 288
Polyimide Ø 8 2 N N C ES
<0.5 0.010 80 0.106 - 16e-6 [67]

26
2.4. PERISTALTIC GAS MICROPUMP FOR WIMS MICRO-GC
Based on the discussion in Section 2.1.2, Michigan’s Peristaltic Pump, introduced by
Kim, et al., can be classified as a resonance-based multistage peristaltic mechanical
compression pump, with electrostatic actuation and active microvalves for flow control.
The pump was proposed to drive a handheld micro gas chromatography (GC) system
developed by WIMS, and needed to satisfy flow, pressure, power and size requirements
of the GC, and be able to operate in two modes (high flow and high pressure) [78].
The pump consisted of serial connections of 2-stage pump units in a small volume
(<0.5 cm3). Fig. 2.15 shows the operation principle of a single pumping cell, consisting of
two stages. A pump membrane is actuated in between two chambers that are connected
using active microvalves. As the membrane is actuated in coordination with microvalves,
one chamber volume is expanded and the other is compressed. When actuated with
proper timing [79], gas is pushed from one chamber to the other. This cycle is repeated
across many chambers in a bucket-brigade fashion, the basis for peristalsis action (see
Section 2.1.2). High flow rate is achieved by actuating each stage at fluidic resonance,
which is designed to occur at tens of kilohertz, and high pressure is achieved by adding
stages in series to form a peristaltic pump. In particular, fluidic resonance compensates
the reduction in flow rate caused by small volume displacement of each stage, which is
needed for system linearity (and hence scalability) and lower actuation voltages [80].
Figure 2.15: Conceptual illustration of pressure accumulating multistage micropump (left), and the smallest pumping unit (2-stage) of the gas micropump, reported by Kim, et al. (right) [74].

27
Electrostatic actuation, with double (pull-pull) drive electrodes, is used for ease of
fabrication, integration capability, low power consumption and high speed. Drive
electrodes are perforated to minimize air damping, which can be curved (out-of-plane) to
form zipper actuators [81-82], hence reducing the required actuation voltages. Valves are
realized by electrostatically actuated perforated membranes, collapsing on perforated
electrodes with hole-mismatch, in a checkerboard pattern (Fig. 2.16).
The key feature of the pump that makes it superior to previous works is the
distribution of pumping action over a chain of serially connected micropumps, each of
which provides a very small stroke (volume displacement). As a result, each stage
exhibits huge dead-volume; however, the small volume displacement provides two
advantages: 1) uniform distribution of pressure differentials over the multistage
configuration, and 2) maintenance of the actuation voltage level within practical ranges
available in micro domain. Due to these two advantages, the pump could be realized
using MEMS and microfabrication technologies. It was indeed the first fully integrated
gas micropump that was also functional. The small compression per stage is compensated
with serial connection of several stages (for high pressure generation) and use of fluidic
resonance (for high flow rate), as described in detail in Section 3.1.
Figure 2.16: The checkerboard microvalve configuration: top view (left) and side view (right) [74].
28
2.5. THE SCALABLE MULTISTAGE PERSITALTIC GAS MICROPUMP
The Michigan Pump developed by Kim, et al., reached the highest pumping
performance ever reported, due to its design and technological novelties. Most notably, it
demonstrated successful multi-staging of gas micropumps to improve the overall pressure
accumulation, by uniform distribution of compression pumping over several cascaded
stages, each using an integratable small-force actuator. The pump, however, suffered
from a number of issues, most importantly, challenging scalability and poor reliability,
caused by both fundamental and practical shortcomings. Practical shortcomings were
poor sealing, difficulty in controlling the pump’s critical parameters (resonance
frequencies and stage volume ratios), challenges in device testing and characterization,
and low yield, due to the complex polymer-based three-wafer microfabrication technique
and three bonding steps used. Fundamental shortcomings resulted from the fact that the
microfabrication technology did not provide any possibility of controlling the membrane
stroke and cavity volume separately, which is vital in extending the micropump with
uniform pressure distribution. As a result, the pump could not be scaled-up (in order to
accommodate larger pressure accumulations), without degrading its performance.
This doctoral thesis describes the design and development of a multistage peristaltic
gas micropump that can address both the reliability and scalability issues of the previous
work. The pump reported here utilizes the same operation principle (multistage,
resonance-based, low-compression per stage, and bucket-brigade operation), however it
also introduces a new pressure distribution scheme, to be called variable volume ratio
(VVR), to address scalability issues. Moreover, a totally new pump architecture and a
totally new microfabrication technology is developed and tested, to insure a fully scalable
and integrated gas micropump, while it also addresses the reliability issues [83].
We have developed a modular microfabrication technology that separates the
microfabrication of the sensitive membrane-electrode part of the device (mechanical
resonator), from the insensitive package (acoustic resonator). In this new process, the
membrane and electrode and support structures are all created simultaneously by a
dissolved wafer process and surface micromachining of well-aligned deposited films, on

29
a single silicon wafer, fabricated using silicon-based thin film deposition. No bonding,
double sided processing, film transfer or complex fabrication technique is used. Support
structures are realized by refilling deep dry-etched trenches with conformally deposited
poly-silicon. The technology provides full control over alignment of sensitive
checkerboard microvalve structures, as well as full control (<1% error) of the membrane
stroke volume. To seal the pumping cavities as well as package the device, we have also
developed a simple, single-mask, spin-on, polymer-based packaging technique, with
excellent control over the cavity volume. These features play an instrumental role in
developing a fully scalable gas micropump with fully controlled pumping parameters,
covered in detail in Chapters 3 and 4. The smallest pumping unit (single pumping cell) of
the Scalable Michigan pump is illustrated in Fig. 2.16.
Throughout the rest of the thesis, the previous work (developed by Kim and Astle) is
referred to as the previous Michigan Pump, and the present doctoral work is called the
Scalable Michigan Pump.
Figure 2.16: The single pumping cell (2-stage) of the Scalable Michigan gas micropump (left), and
photograph of the fabricated 24-stage micropump, using the new modular fabrication technology [83].

30
2.6. References
[1] Laser, D. J. and Santiago, J. G. 2004 A review of micropumps J. Micromech. Microeng., 14, R35-R64
[2] Manz A et al 1992 Planar chips technology for miniaturizationand integration of separation techniques into monitoring systems: capillary electrophoresis on a chip J. Chromatogr.A 593 253–8
[3] Woolley A T et al 1996 Functional integration of PCR amplification and capillary electrophoresis in a microfabricated DNA analysis device Anal. Chem. 68 4081–6
[4] Khandurina J et al 2000 Integrated system for rapid PCR-based DNA analysis in microfluidic devices, Anal. Chem. 72 2995–3000
[5] Taylor M T, Nguyen P, Ching J and Petersen K E 2003 Simulation of microfluidic pumping in a genomic DNA blood-processing cassette J. Micromech. Microeng. 13 201–8
[6] Micci M M and Ketsdever A D 2000 Micropropulsion for Small Spacecraft (Reston, VA: American Institute of Aeronautics and Astronautics)
[7] Tuckerman D B and Pease R F W 1981 High-performance heat sinking for VLSI IEEE Electron Device Lett. 2 126–9
[8] Jiang L et al 2002 Closed-loop electroosmotic microchannel cooling system for VLSI circuits IEEE Trans. Compon. Packag. Technol. 25 347–55
[9] Liamos C T, Vivolo J A and Colman F C 1999 Small volume in vitro analyte sensor and methods US Patent no. 6,616,819
[10] Fan S-K, de Guzman P-P and Kim C J 2002 EWOD driving of droplet on N × M grid using single-layer electrode patterns Proc. 2002 Solid-State Sensor, Actuator, and Microsystems Workshop (Hilton Head Island, SC)
[11] Hobbs E D and Pisano A P 2003 Micro capillary-force driven fluidic accumulator/pressure source Proc. Transducers’03 (Boston, MA)
[12] Burns M A et al 1998 An integrated nanoliter DNA analysis device Science 282 484–7
[13] Selam J L, Micossi P, Dunn F L and Nathan D M 1992 Clinical trial of programmable implantable insulin pump for type I diabetes Diabetes Care 15 877–85
[14] Blom M T et al 2002 A micro viscosity detector for use in miniaturized chemical separation systems Proc. Micro Total Analysis Systems 2002 (Nara, Japan)
[15] Kanai M et al 2003 Integrated micro chamber for living cell analysis with negligible dead volume sample injector Proc. Transducers ’03 (Boston, MA)
[16] H. Kim, K. Najafi, and L. Bernal, “Gas Micropumps” in Comprehensive Microsystems, Elsevier Publishers, 2008, pp 273-299.
[17] W.K. Schomburg, Introduction to Microsystem Design, RWTHedition, DOI 10.1007/978-3-642-19489-4_17, # Springer-Verlag Berlin Heidelberg 2011.

31
[18] Stehr, M., Gruhler, H., Straatmann, H., Messner, S., Sandmaier, H. and Zengerle, R. 1997 The selfpriming VAMP Proc. International Conference on Solid-State Sensors and Actuators (Transducers '97). Chicago, IL, pp. 351-352
[19] C.-J. Lu, W. H. Steinecker, W.-C. Tian, M. C. Oborny, J. M. Nichols, M. Agah, J. A. Potkay, H. Chan, J. Driscoll, R. D. Sacks, K. D.Wise, S.W. Pang, and E. T. Zellers, “First-generation hybrid MEMS gas chromatograph,” Lab on a Chip, vol. 5, pp. 1123–1131, 2005.
[20] S. L. Gac, A. Berg “Miniaturization and Mass Spectrometry”, Royal Society of Chemistr, 1999
[21] C. Y. Lee, R. Sharma, A. D. Radadia, R. I. Masel, M. S. Strano, “On-Chip Micro Gas Chromatograph Enabled by a Noncovalently Functionalized Single-Walled Carbon Nanotube Sensor Array” Angew. Chem. Int. Ed. 2008, 47, 5018.
[ 22 ] M. Agah and K. D. Wise, “Low-mass PECVD oxynitride gas chromatographic columns,” J. Microelectromech. Syst., vol. 16, no. 4, pp. 853–860, Aug. 2007.
[23] M. Agah, J. A. Potkay, G. Lambertus, R. Sacks, and K. D. Wise, “Highperformance temperature-programmed microfabricated gas chromatography columns,” J. Microelectromech. Syst., vol. 14, no. 5, pp. 1039–1050, Oct. 2005.
[24] KNF website: http://www.knf.com/pdfs/nmp05_09_015.pdf
[25] Y. W. and G. A., "Radial Turbomolecular Pump with Electromechanically Levitated Rotor," USP 8221098, 2012.
[26] McNamara S and Gianchandani Y B 2005 On-chip vacuum generated by a micromachined Knudsen pump J. Microelectromech. Syst. 14 741–6
[27] Gupta N K and Gianchandani Y B 2008 Thermal transpiration in zeolites: a mechanism for motionless gas pumps Appl. Phys. Lett. 93 193511 (3pp)
[28] Young R M 1999 Analysis of a micromachine based vacuum pump on a chip actuated by the thermal transpiration effect J. Vac. Sci. Technol. B 17 280–7
[29] Wright, S. A. and Gianchandani, Y. 2006 A micromachined titanium sputter ion pump for cavity pressure control Proc. 19th Int. Conf. on Micro Electro Mechanical Systems (MEMS '06). Turkey, pp. 754-757.
[30] H. W.P. Koops, “Proposal of a miniature orbitron pump for MEMS applications,” Proceedings of the SPIE - The International Society for Optical Engineering, Sevilla, Spain, May 2005, pp. 38-42.
[31] J.Z. Wilcox, T. George, and J. Feldman, “Miniature ring-orbitron getter ion vacuum pumps,” NASA Tech Briefs, 23(9), Sep. 1999.
[ 32 ] M. Knudsen, "Eine Revision der Gleichgewichtsbedingung der Gase. Thermische Molecular str'omung," Annals of Physics, Leipzig, v. 31, pp. 205-229, 1910. (in German)
[33] McNamara S and Gianchandani Y B 2005 On-chip vacuum generated by a micromachined Knudsen pump J. Microelectromech. Syst. 14 741–6
[34] Gupta N K and Gianchandani Y B 2011 Thermal transpiration in mixed cellulose ester membranes: enabling miniature, motionless gas pumps Microporous Mesoporous Mater. 142 pp 535–41

32
[35] Gupta N K, Ahn S, Gianchandani Y B, “A Si-micromachined 48-stage Knudsen pump for on-chip vacuum”, 2012 J. Micromech. Microeng. 22 105026
[36] Y. W. and G. A., "Radial Turbomolecular Pump with Electromechanically Levitated Rotor," USP 8221098, 2012.
[37] Creare, Inc. Website: http://www.creare.com/products/minivac.html.
[38] R. J. Linderman, O. Nilsen, and V. M. Bright, “Electromechanical and fluidic evaluation of the resonant microfan gas pump and aerosol collector”, Sens. Actuators A, Phys. 118, 162 (2005).
[39] S.A. Wright and Y.B. Gianchandani, “Controlling pressure in microsystem packages by on-chip microdischarges between thin-film titanium electrodes,” Journal of Vacuum Science and Technology B, 25(5), pp. 1711-1720, Sep. 2007.
[40 ] Kim, D., Buie, C., and Santiago, J.G. 2006 Toward electroosmotic flow-driven air pumps for miniaturized PEM fuel cells Proc. Electro Chemical Society
[41] M. O. Muller, et al, "Thrust performance of micromachined synthetic jets", Presented at AIAA Fluids 2000 conference, Denver, Colorado, June 2000
[42] H. Kim, K. Najafi, and L. Bernal, “Gas Micropumps” in Comprehensive Microsystems, Elsevier Publishers, 2008, pp 273-299.
[43] W.K. Schomburg, Introduction to Microsystem Design, RWTHedition, DOI 10.1007/978-3-642-19489-4_17, # Springer-Verlag Berlin Heidelberg 2011.
[44] Nitto Kohki website: http://medousa.com/products/linear-piston-vacuum-pumps/
[45] Bartels website: http://www.bartels-mikrotechnik.de/index.php/mp5.html
[46] ThinXXS website: http://www.thinxxs.com/
[ 47 ] A. Astle, H. Kim, L. Bernal, K. Najafi, and P. Washabaugh, “Theoretical and experimental performance of a high frequency gas micropump”, Sensors and Actuators A: Physical, Volume 134, Issue 1, Pages 245-256, Feb. 2007
[48] J. A. Folta, N. F. Raley, and E. W. Hee, “Design, fabrication and testing of a miniature peristaltic membrane pump,” MEMS '92, pp. pp. 186-189, 1992.
[49] Laser, D. J. and Santiago, J. G. 2004 A review of micropumps J. Micromech. Microeng., 14, R35-R64
[50] Cabuz-C, Herb-WR, Cabuz-EI and Son-Thai-Lu 2001 The dual diaphragm pump Proc. 14th
IEEE International Conference on Micro Electro Mechanical Systems (MEMS 2001). Interlaken, Switzerland, pp. 519-522
[51] DARPA website: http://www.darpa.mil/Our_Work/MTO/Programs/ChipScale_Vacuum_Micro_Pumps_%28CSVMP%29.aspx
[52] DTRA website: https://www.fbo.gov/index?s=opportunity&mode=form&id=d29f1652fad259d95b6b3bf2292bcf89&tab=core&_cview=1

33
[53] Judy, J. W., Tamagawa, T. and Polla, D. L. 1991 Surface-machined micromechanical membrane pump Proc. 4th IEEE International Conference on Micro Electro Mechanical Systems (MEMS '91). Nara, Japan, pp. 182-186
[ 54 ] H. Kim and K. Najafi, "Characterization of a low-temperature wafer bonding using thin film Parylene," IEEE Journal of Microelectromechanical Systems, vol. 14, no. 6, pp. 1347- 1355, 2005.
[55] W.K. Schomburg, Introduction to Microsystem Design, RWTHedition, DOI 10.1007/978-3-642-19489-4_17, # Springer-Verlag Berlin Heidelberg 2011.
[ 56 ] Stemme, E. and Stemme, G. 1993 Valveless Diffuser/Nozzle-Based Fluid Pump Sensors and Actuators A, A39, no 2, pp. 159-167
[57] T. Gerlach, "Pumping gases by a silicon micropump with dynamic passive valves," 1997 International Conference on Solid-State Sensors and Actuators (Transducers '03), Chicago, pp. pp. 35 7-360, 1997.
[58] Schabmuller C.G.J., Koch M., Mokhtari M.E., Evans A.G.R., Brunnschweiler A., Sehr H., “Self-Aligning Gas/Liquid Micropump,” Journal of Micromechanics and Microengineering, vol. 12(4), 2002, pp. 420-424.
[59] A. Olsson, G. Stemme, and E. Stemme, “A valve-less planar fluid pump with two pump chambers,” Sens. Actuators, vol. A46–47, pp. 549–556,1995.
[60] A. Olsson, P. Enoksson, G. Sternme, and E. Stemme, "An improved valve-less pump fabricated using deep reactive ion etching," MEMS '96, pp. 479-484, 1996.
[61] A Olsson, G Stemme, E Stemme,”Numerical and experimental studies of flat-walled diffuser elements for valveless micropumps”, Sens. Actuators A: Phys., 84 (2000), pp. 165–175
[62] Wijngaart, W. v. d., Andersson, H. and Enoksson, P. 2000 The first self-priming and bidirectional valve-less diffuser micropump for both liquid and gas Proc. 13th International Conference on Micro Electro Mechanical Systems (MEMS '00). Kyoto, Japan, pp. 674-679
[63] Wijngaart, W. v. d., Ask, H., Enoksson, P. and Stemme, G. 2002 A high-stroke, high-pressure electrostatic actuator for valve applications Sensors and Actuators A, 100, 264-271
[64] Bustgens B., Bacher W., MentzW., and Shomberg W. K., “Micropump manufactured by thermoplastic molding,” in IEEE Microelectromechanical Systems Conf., 1994, pp. 18–21.
[ 65 ] K.-P. Kamper, J. Dopper, W. Ehrfeld, and S. oberbeck, "A self-filling low-cost membrane micropump," MEMS '98, pp. pp. 432-437, 1998.
[66] R. Linnemann, P. Woias, C. D. Senfft, and J. A. Ditterich, "A self-priming and bubble-tolerant piezoelectric silicon micropump for liquids and gases," MEMS'98, pp. pp. 532-537, 1998.
[67] J. Han et al, Characteristics of electrostatic gas micro-pump with integrated polyimide passive valves, J. Micromechanics and Microengineering., 2012, 22 095007
[68] Stehr, M., Messner, S., Sandmaier, H. and Zengerle, R. 1996 The VAMP- a new device for handling liquid or gases Sensors and Actuators A, 57, 153-157
[69] Stehr, M., Gruhler, H., Straatmann, H., Messner, S., Sandmaier, H. and Zengerle, R. 1997 The selfpriming VAMP Proc. International Conference on Solid-State Sensors and Actuators (Transducers '97). Chicago, IL, pp. 351-352
34
[70] Cabuz-C, Herb-WR, Cabuz-EI and Son-Thai-Lu 2001 The dual diaphragm pump Proc. 14th
[71] Muller, M., Bernal, L. P., Washabaugh, P. D., Kim, H. and Najafi, K. 2002 Resonance effects of electrostatically actuated acoustic jets AIAA, 1272-1281
[72] Chou, T.-K. A., Najafi, K., Muller, M. O., Bernal, L. P., Washabaugh, P. D. and Parviz, B. A. 2002 Micromachined e-jet for IC chip cooling Proc. IEEE Internaional Solid-State Circuits Conference (ISSCC 02). San Francisco, CA, pp. 356-357
[73] Chou, T.-K. A., Najafi, K., Muller, M. O., Bernal, L. P. and Washabaugh, P. D. 2001 High- density micromachined acoustic ejector array for micro propulsion Proc. Proceedings of 11th International Conference on Solid State Sensors and Actuators Transducers '01/Eurosensors XV, 10-14 June 2001. Munich, Germany, pp. 890-3
[74] A.A. Astle, L.P. Bernal, P.D. Washabaugh, H. Kim, K. Najafi, “Dynamic modeling and design of a high frequency micro vacuum pump,” Proceedings of 2003 ASME International Mechanical Engineering Congress & Exposition, Washington, DC (November 15–21, 2003) IMECE2003-41493
[75] H. Kim, A. Astle, K. Najafi, L. Bernal, and P. Washabaugh, “A fully integrated high-efficiency peristaltic 18-stage gas micropump with active microvalves,” in Proc. MEMS 2007, pp. 131-134.
[76] Jeong, O., Morimoto, T., Watanabe, Y. and Konish, S. 2006 Peristaltic PDMS pump with perfect dynamic valves for both gas and liquid Proc. 19th IEEE International Conference on Micro Electro Mechanical Systems (MEMS '06). Istanbul, Turkey, pp. 782-785
[77] H. Zhou, H. Q. Li, V. Sharma, and M. Schmidt, “A Single-Stage Micromachined Vacuum Pump Achieving 164 Torr Absolute Pressure,” in Proc. MEMS 2011, Mexico, Jan. 2011, pp. 1095-1098.
[78] H. Kim, W. H. Steinecker, G. R. Lambertus, A. A. Astle, K. Najafi, E. T. Zellers, P. D. Washabaugh, L. P. Bernal, and K. D. Wise, “Micropump-driven high-speed MEMS gas chromatography system,” Proc. Transducers ’07, Lyon, FR, June 10-14, 2007, pp. 1505-1508.
[79] S. Lee, S. Y. Yee, A. Besharatian, H. Kim, L. Bernal, and K. Najafi, “Adaptive Gas Pumping by Controlled Timing of Active Microvalves in Peristaltic Micropumps,” in Proc. Transducers 2009, pp. 2294–2297.
[80] A.A. Astle, A. Paige, L.P. Bernal, P.D. Washabaugh, J. Munfakh, H. Kim, K. Najaf “Analysis and design of multistage electrostatically-actuated micro-vacuum pumps,” Proceedings of 2002 ASME International Mechanical Engineering Congress, New Orleans, LA (Nov’02) IMECE2002-39308
[81] Chou, T.-K. A., Najafi, K., Muller, M. O., Bernal, L. P., Washabaugh, P. D. and Parviz, B. A. 2002 Micromachined e-jet for IC chip cooling Proc. IEEE Internaional Solid-State Circuits Conference (ISSCC 02). San Francisco, CA, pp. 356-357
[ 82 ] H. S. Kim, K. Najafi, P. D. Washabaugh, and L. P. Bernal, "Large- deflection out-of-plane electrostatic buckled-electrode actuator," The 12th International Conference on Solid State Sensors, Actuators, and Microsystems (Transducers '03), Boston, MA, USA, pp. 794-797, 2003.
[83] A. Besharatian, K. Kumar, Rebecca L. Peterson, K. Najafi and L. Bernal, “A Scalable, Modular, Multi-Stage, Peristaltic, Electrostatic Gas Micro-Pump” in Proc. MEMS’12, Paris, France, Feb’11.

35
CHAPTER 3
DESIGN OF A SCALABLE VACUUM MICROPUMP AND
TECHNOLOGY REQUIREMENTS
In this chapter, detailed operational analysis of the multistage peristaltic gas
micropump is provided. To analyze the pump operation, basic thermodynamic modeling,
developed by Astle, et al. [1] is used, and primary design parameters are identified. A
more advanced modeling framework (an idealized reduced order model – also developed
by Astle et al. [2] using momentum and continuity equations) is presented, with the help
of which other design parameters are determined. These models and micropump
parameters (primary and secondary) will form the basis for pump design and technology
development through the rest of the thesis.
To achieve a truly scalable multistage vacuum micropump (as discussed in Section
2.5), pressure distribution through the multistage pump structure is derived using the
thermodynamic model. A new Variable Volume Ratio (VVR) design, and a Modular
Pressure Scheme (MPS) are proposed next, to address the uneven pressure distribution
issue, from which the previous multistage peristaltic pump (by Kim and Astle [3])
suffered the most. As we will see in Sections 3.1 and 3.4, the uneven pressure distribution
significantly limits the cascading capability of the multistage micopump, in a sense that
only the first few stages would provide the pumping, and hence, making higher pressure
accumulation levels unachievable and the pump un-scalable. As a result, developing
designs and identifying technology requirements to realize the VVR and MPS will
greatly improve the micropump’s scalability to achieve higher pressure accumulation
levels, as proposed in Section 2.5.

36
The rest of the chapter deals with determining technology requirements to realize the
scalable VVR design. To fulfill this goal, a truly scalable pump architecture (called the
Honeycomb Pump (HCP) Architecture) with 100% area utilization is developed first,
single electrode actuation considerations, including electrostatic actuator requirements, as
well as membrane material and structural property requirements, are determined next,
and design guidelines, affecting the technology, are listed in the end.
It should be noted that throughout the chapter, the pump developed by Kim and Astle
is referred to as the previous Michigan Pump, while the current work is called the
Scalable Michigan Pump. As stated earlier, the former lacks scaling capability due to
uneven pressure distribution for extended number of stages, while the latter can be scaled
to any number of stages without performance degradation. Moreover, in order to utilize
the thermodynamic model for developing the VVR and MPS, a simple MATLAB code is
used, which solves the thermodynamic model for a given pressure target.
3.1. MICROPUMP OPERATION AND MODELING
Fig. 3.1 shows a conceptual drawing of an individual pumping stage of the Scalable
Michigan Pump. It consists of one pumping membrane and two valve membranes. As
covered in Section 2.4, the pump and valve membranes are realized using the same
microfabrication technology, and actuated using the same actuation technology.
(In the conceptual drawing of Fig. 3.1, the pump and valve membranes are depicted
as different sizes to distinguish “pumping” form “flow control,” but as discussed later in
Section 3.2, they could also be made the same size). This conceptual drawing is used as
the basis for pump modeling and analysis in the following sections.
Figure 3.1: Conceptual diagram of an individual stage of the Michigan Pump

37
Both valves and pumps are hexagonal (see Section 3.2) and a valve is realized using a
perforated membrane-electrode pair, with holes mismatching in a “checkerboard” pattern
(Fig. 3.2). Despite being relatively low force and high-voltage, electrostatic actuation is
used both for pump and valve membranes, because it is fast, low power and easy to
integrate using microfabrication. It should also be added that electrostatic actuation can
operate in the touch-mode regime, which is desired for the microvalve sealing. Only one
actuating electrode is used, for simplicity of fabrication and control. This will also
provide optical characterization capability, as the membrane can be seen from the top.
3.1.1. Basic Thermodynamics
To predict the performance of a diffuser-based gas micropump (presented in Section
2.3.1), Gerlach assumed gas pumping to be an adiabatic process, and developed a highly
simplified thermodynamic model, relating maximum flow rate and pressure to stroke
volume and frequency [4]. The analysis predicts that the maximum flow rate is obtained
at zero pressure rise and maximum pressure is obtained at zero flow rate, given by:
Qmax f V
P1
P2
1
V
where f and are the frequency and the efficiency, respectively, and V is the volume
ratio (Vmax/Vmin) and is the adiabatic index, i.e. usually 1.4 for air and diatomic gases.
Eqn. 3.2 is derived from a transient pressure and volume-ratio relation, given by:
[4] (3.1)
[4] (3.2)
Figure 3.2: Hexagonal single-electrode checkerboard microvalve “electrode-membrane” pair (Left), and cross-section of the single electrode checkerboard microvalve (Right)

38
P(t) 1
VM (t)Vi
1
1
PM
where PM and Vi are the mean cavity pressure and volume, respectively, and VM(t) is the
oscillating chamber volume.
To study the performance of a multistage pump, Astle (2002) further developed
Gerlach’s model, for a dual-chamber multistage micropump (covered in detail in Section
3.1.3), using polytropic gas law instead of adiabatic. This resulted in a closed-form
equation [1] for maximum pressure rise and flow rate across each stage, as given by:
Q
fV
1
1Vr
Pin j
Ps
1/n
1Vr
Pout j
(Pin ) j
1/n
; ( j 1,...M )
where j indicates the stage number, with M being the total number of stages, and Ps is the
steady-state ambient pressure, or the output pressure of the multistage pump (i.e. Ps =
(Pout)M). In developing Eqn. 3.4, it was assumed that the flow rate is the same for all the
pumping cavities (as they are connected in series), and the output pressure of one stage is
the input pressure of the next, i.e. (Pout)k = (Pin)k+1, for k = 1,…M-1. It is also assumed the
expansion and compression processes in the cavities follow a polytropic gas law with
polytropic constant n.
By treating Eqn. 3.4 as a system of 2M equations and unknowns, and iteratively
solving it, the input and output pressures of all the stages can be predicted as a function of
operating frequency, ambient pressure and flow rate. As the minimum (final) input
pressure occurs at zero flow rate (Q = 0), pressure in the j-th stage becomes:
Pout j
Pin j
1
V
n
for all j, and therefore:
[4] (3.3)
[1] (3.4)
[1] (3.5)

39
Pvac
Pamb
min
Pin
j
Pout jj1
M
V n.M
where Pvac = (Pin)1 is the multistage pump input pressure. On the other hand, the
maximum mass flow rate is obtained for zero pressure rise, or when the input pressure
equals the output pressure for all the stages, i.e. (Pin)j = (Pout)j for all j, which gives:
Qmax fV
Although started from different assumptions (adiabatic vs. polytropic), Eqns. 3.5 and
3.7 have the same general form as 3.1 and 3.2. This indicates a similar performance is
predicted for an individual pump stage, whether used singularly or in a multistage
configuration, since the model is overly simplified and idealized. In particular, the
thermodynamic model does not include the following effects:
- Resonance, which causes the flow rate to dramatically peak [5-6].
- Damping, which limits the maximum functional frequency of the pump. In fact
(unlike predicted by Eqns. 3.2 and 3.7), the flow rate cannot be increased
indefinitely, since for higher frequencies, mechanical components start ‘falling
behind’ the actuation, due to damping.
- Microvalve leakage, which causes reverse flow, and hence reduced performance.
- Actuation technique, which affects the membrane motion.
The first two (resonance and damping), which are mostly caused by the checkerboard
valve geometry, will be included in the micropump design using a reduced-order model
in the following sections, while other effects are covered in Chapter 6.
3.1.2. Primary Design Parameters
Despite all its simplicity and shortcomings, the thermodynamics model still provides
a clear and basic understanding of the pump’s performance, which can be used in
determining the main design parameters. Most notably, it predicts (1) a higher actuation
frequency, (2) more stages, and (3) a larger stroke, will improve the performance of the
[1] (3.6)
[1] (3.7)

40
pump. The first increases the flow rate, the second increases the pressure accumulation,
and the third one increases both flow rate and pressure.
Practically, larger strokes require either larger membrane area, or larger actuation
forces. Both are limited in MEMS: the first increases the membrane size (and hence
degrades its yield and lifetime, as well as miniaturization), while the latter means higher
actuation voltages and currents (hence higher powers) or bulkier actuators (hence bigger
size). This explains why the MIT pump ([7]) could not realize any on-chip actuation, but
relied on huge gas cylinders to provide the pneumatic actuation (see Section 2.3.1). To
ensure that on-chip actuation is possible, a practical limit for the stroke can be determined
by power and size constraints, as covered in detail in Section 3.2. Such a limit in
maximum compression (stroke), however, would decrease both the flow rate and
pressure, which should be compensated by increasing M (more stages) and f (higher
frequencies), according to Eqns. 3.6 and 3.7.
The following sections cover both multi-staging and high frequency actuation for
high pressure and high flow rate creation, as well as design considerations that each
technique requires. However, in order to determine the primary design parameters, we
briefly review each technique here.
Multi-staging: Fig. 3.3 shows the pressure distribution over a multistage (18-stage)
pump, for different volume ratios, ranging from 0.93 to 0.98. The result is obtained from
Eqns. 3.4 for Q = 0. As seen in the plots, the pressure rises linearly only for very high
volume ratios (>95%), i.e. for a large dead volume. This means that if a multistage pump
consists of stages with high compression (i.e. low Vr) values, only the first few stages
would do most of the pumping, and larger forces would be required for these stages. This
explains why Stehr [8] failed to achieve higher pressures by cascading several pumps.
Therefore, in order to effectively utilize multi-staging, i.e. to evenly distribute the
pumping job over the entire pump structure (via several small force actuators), higher
values of Vr are preferred.
The plot also shows how sensitive the pump performance is to the Vr value as a slight
change from 0.95 to 0.98 considerably changes the pressure (and hence force)

41
distribution. This highlights the importance of Vr, as a design parameter, and how
accurately it should be controlled during fabrication.
High Frequency: Although the thermodynamic model only predicts a linear rise in
flow rate as the frequency of actuation increases, resonance effects cannot be neglected if
high frequencies are targeted. As previously reported and predicted by several works (see
Sections 2.2 and 2.3), Helmholtz resonance occurs in gas micropumps and other acoustic
transducers, resulting in a sudden rise in gas flow at resonance, given by:
fH 2
A
VcL ; (
Pc
A
)
where A and L are the area and length of the resonator’s neck (determined by the opening
of the checkerboard valve), and Vc is the static volume of the cavity. Also is the speed
of sound, determined by the static cavity pressure Pc, and gas properties (density A, and
adiabatic index ). On the other hand, the pumping membrane itself exhibits mechanical
resonance, the first mode of which (for a circular membrane) can be estimated as:
fd fcirc11 0.766
D
d
d
Figure 3.3: Stage input pressure normalized by the ambient pressure, as a function of stage number for zero net flow, and different pump volume ratios.
(3.8)
(3.9)

42
where D is the membrane diameter (assumed to be much larger than its thickness D>>t),
and d and d are its stress and density, respectively. In case of a stand-alone single-
electrode actuator is used for electrostatic actuation, the bi-directional membrane
movement (needed for successful multi-staging – see the next section) only occurs at the
membrane resonance frequency, fd.
For a real pump, the system shows a coupled resonance behavior (occurring at a
frequency between fH and fd) while it also exhibits some minor resonance effects at fH and
fd. Tuning these two numbers such that they match, by careful design of the membrane
and cavity dimensions, can therefore, greatly simplify the system. Furthermore, it
maximizes the bi-directional membrane movement, for a single-electrode actuator, as
mentioned above.
To conclude the section, we can summarize the important design parameters to be Vr,
which should be high and accurately chosen, as well as fH and fd which should be high
and preferably match, in order to achieve high flow and high pressure accumulation, as
well as uniform pressure distribution, across the multistage pump. These parameters
depend on (1) cavity and membrane dimensions, (2) membrane material properties, and
(3) gas properties. Photolithography ensures good control over the membrane and cavity
footprints (within a few microns), meaning that volumes can be accurately controlled as
long as the heights are well controlled. As a result, number 1 and 2 can accurately be
controlled, as long as the cavity height hc and membrane gap hg (as shown in Fig. 3.1)
can accurately be controlled and the membrane material properties are known well.
Controlling number 3 is, however, covered in Section 3.3.
Table 3.1: Primary/Critical Design Parameters – to be controlled accurately
Parameter Indicates Range Affects Effects on Design (and Performance)
hg Membrane Gap 0-10 m Vr Multi-staging (P)
hc Cavity Height 50-150 m Vr and fH Multi-staging (P) and Resonance (Q)
d Membrane Stress 20-80 MPa fd Resonance (Q)

43
3.1.3. Building-up the Peristaltic Pump
As covered in Section 2.1.2, peristalsis action in mechanical compression gas
micropumps is realized by a bucket-brigade operation of serially connected individual
pumping “units,” to form a multistage configuration and accumulate the pressure
differential each pumping “unit” creates. To form the proper pumping unit, it should be
noted that the cascaded multistage pump can be formed of a “straight” simple chain with
no membrane shared (Fig. 3.3.a), or a “twisted” chain (Fig. 3.3.b) with pumping
membranes shared in between every two adjacent chambers (and hence, saving area, at
the cost of a more complex structure).
The “straight” configuration is, however, not scalable, as it is only functional for few
number of stages and cannot be extended: as pumping proceeds, cavity pressures drop
below the ambient pressure, while one side of all pumping membranes is at the ambient
pressure, creating a high pressure difference on pumping membranes, especially the ones
closer to the inlet side of the chain. The twisted chain configuration addresses this issue
by minimizing the pressure difference each pumping membrane faces, while it is also
more area-efficient, due to two membranes being shared in between every two adjacent
chambers. As a result, to realize a peristaltic configuration, a pumping “cell” is formed of
two individual pumping stages, stacked on top of each other (Fig. 3.4), with the pumping
membrane and one of the valves (called transfer) shared in between them. A multistage
micropump is formed by serially connecting any number of these “cells” as the building
blocks, and hence, the smallest pumping unit for a “scalable” peristaltic pump is the dual
chamber cell of Fig. 3.4. This cell will further be used in dynamic modeling of the pump.
Figure 3.4: Two possible peristaltic pump configurations: straight (top) and twisted (bottom) chain.

44
3.1.4. Bucket-Brigade Operation
Fig. 3.6 shows the pump timing and different phases in a single pumping cycle and
signals used to actuate each pumping/valve membrane, for a single pump cell. Each
pumping cycle is divided into two phases, namely “gas compression” and “gas transfer”
phases. During the gas compression phase (Fig. 3.6.a and Fig. 3.6.c), valves are closed
and the motion of the membrane compresses gas in one cavity while expands it in the
other cavity. During the gas transfer phase (Fig 3.6.b and Fig. 3.6.d), some valves are
opened and gas is transferred from one cavity to the next. These cycles continue
periodically, resulting in a bucket-brigade operation: gas is pressurized by being
“transferred” through the pump (as predicted by the thermodynamic model of Section
3.1.1), while actuation signals are the same for all similar valves, making them move
synchronously, no matter how long the chain is – hence the name bucket-brigade.
Figure 3.6: One pumping cycle for a 4-stage Michigan Pump, and corresponding actuation signals: (a) Compression of bottom cavities, (b) Gas transfer from bottom to top cavities, (c) Compression of top cavities, (d) Gas transfer from top to bottom cavities [1].
Figure 3.5: The smallest pumping unit, consisting of two pumping stages.
Transfer Valve
Inlet Valve Outlet Valve

45
3.1.5. Idealized Reduced-Order Model
The simplified thermodynamic model (Section 3.1.1) resulted in determining the
primary design parameters (Section 3.1.2), based on which initial design guesses can be
made. The model predicted a linear increase in flow rate as frequency is increased, and
hence, predicted high operation frequencies needed for improved pump performance;
however, it did not include resonance, damping, leakage, or actuation effects.
Stehr reported improved performance of VAMP at resonance and reduced and even
reverse flows for frequencies higher than resonance [9]. On the other hand, Muller had
reported improved performance of a microjet at resonance. All these results suggested
dramatic changes and complex behavior in pump performance at high frequencies, while
the thermodynamic model simply suggested a linear relation between frequency and flow
rate. To further study these effects, Astle developed a dynamic “reduced-order” model for
the smallest pumping unit (Fig. 3.4) that would include resonance and damping effects
[10]. Valve geometry is considered to account for both resonance and damping effects,
since it behaves the same as a Helmholtz resonator’s neck, and also causes pressure loss
(and hence, damping), due to the checkerboard design [3]. Damping and resonance
effects are lumped into the model using the valve’s viscous length (LV) and inertial length
(LE), respectively. The model is idealized, as it assumes the valves exhibit no leakage
when closed, and also assumes LV and LE can perfectly model valve behavior when
opened. The model is derived from the momentum and continuity equations, which can
relate gas properties between the two stages of Fig. 3.5. The integral form of the
momentum equation relates the valve average velocity to the pressure in the next stage:
d
dtu ds
u 2
2
P
ds (
) ds
where ue is the valve average velocity (assumed to be positive in the outward direction
from the valve plane), while and are dynamic viscosity and gas density, respectively.
By integrating along a streamline through a microvalve (Fig. 3.4), properties of two
adjacent cavities are related as:
[2] (3.10)
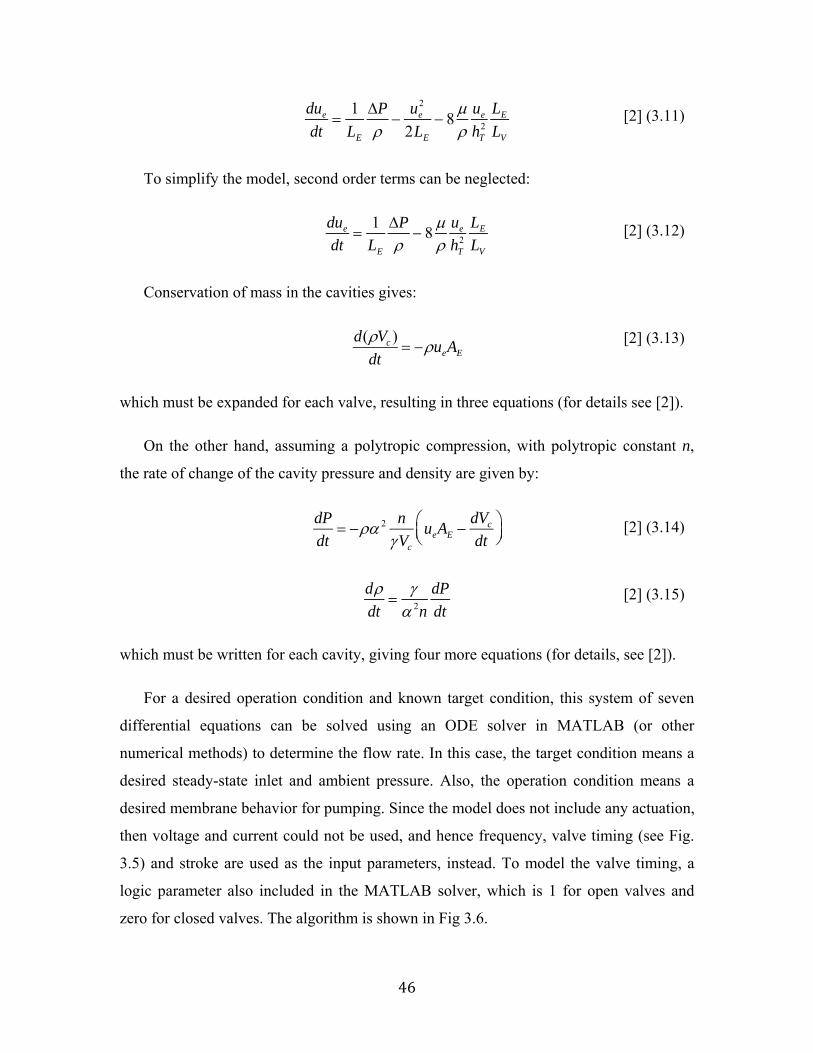
46
due
dt
1
LE
P
ue2
2LE
8
ue
hT2
LE
LV
To simplify the model, second order terms can be neglected:
due
dt
1
LE
P
8
ue
hT2
LE
LV
Conservation of mass in the cavities gives:
d(Vc )
dt ueAE
which must be expanded for each valve, resulting in three equations (for details see [2]).
On the other hand, assuming a polytropic compression, with polytropic constant n,
the rate of change of the cavity pressure and density are given by:
dP
dt 2 n
Vc
ueAE dVc
dt
ddt
2n
dP
dt
which must be written for each cavity, giving four more equations (for details, see [2]).
For a desired operation condition and known target condition, this system of seven
differential equations can be solved using an ODE solver in MATLAB (or other
numerical methods) to determine the flow rate. In this case, the target condition means a
desired steady-state inlet and ambient pressure. Also, the operation condition means a
desired membrane behavior for pumping. Since the model does not include any actuation,
then voltage and current could not be used, and hence frequency, valve timing (see Fig.
3.5) and stroke are used as the input parameters, instead. To model the valve timing, a
logic parameter also included in the MATLAB solver, which is 1 for open valves and
zero for closed valves. The algorithm is shown in Fig 3.6.
[2] (3.12)
[2] (3.11)
[2] (3.14)
[2] (3.15)
[2] (3.13)

47
3.1.6. Secondary Design Parameters
As discussed in the previous section, resonance and damping effects (mostly caused
by the valves) are lumped into the reduced order model, using viscous and inertial
lengths. In order to predict the pump performance using the reduced-order model, LV and
LE need to be determined. To do this, Astle used correlations derived from the pressure
loss relations of the valve entrance [10], which accounts for the damping and resonance
effects discussed in Section 3.1.1. These models (reported by Bernardi in [11]) allow
predictions of valve pressure loss in the open state, for a given geometry and flow rate.
LV can be found, by solving Eqn. 3.12 for P, in steady state (i.e. when du/dt =0)
P 8LVue
hT2
By taking the derivative to solve for LV, the viscous length is determined from the slope
of valve’s “pressure-loss vs. flow” curve:
LV hT
2
8dP
due
Since fluidic resistance (or a fluidic load) is defined as R = dP/dQ, then Eqn. 3.17
means valve damping virtually “applies” a load on the pump, as intuitively expected.
[2] (3.16)
[2] (3.17)
Figure 3.7: Numerically solving the system of equations resulted from the reduced-order model of [2] (diagram be the author).

48
LE can be thought of as the equivalent velocity weighted distance the fluid must
traverse through the valve, on a flow streamline. Hence, it can be found by integration of
the velocity along a streamline:
LE
1
ue
u .ds
which can be solved using CFD simulations of flow through microvalves (Fig. 3.7).
As can be seen, both LV and LE are functions of valve geometry (Fig. 3.8). Since the
Stoke’s number is small for the small (<10 m) valve gap of the pump design [10], the
low frequency value of both viscous and inertial lengths can be used as an estimate for all
frequencies. Table 3.2 summarizes design parameters that affect the damping and
resonance. Since most of them can accurately be controlled in the layout, they are not
sensitive to the microfabrication technology. Hence, we call them “secondary design
parameters,” when discussing technology requirements.
Table 3.2: Secondary Design Parameters – should be controlled accurately
Layout Dependent Only Layout and Process Dependent
Parameter Indicates Affect Parameter Indicates Affects
NEP # of Pump Holes Damping LV Viscous Length Damping
NEV # of Valve Holes LV and LE LE Inertial Length Resonance
NM # of Membrane Holes LV and LE tM Membrane Thickness LV and LE
LS Sealing Distance LV tE Electrode Thickness LV
LHE Hole Size (electrode) LV LS Sealing Distance Leakage
LHM Hole Size (membrane) LV and LE
[2] (3.18)
Figure 3.8: Important microvalve dimensions (impacting LV and LE) to be used in CFD simulations

49
3.1.7. Summary of Micropump Modeling Results
As expected, valve viscous and inertial lengths determine the maximum operational
frequency of the micropump (Fig. 3.9) [10]. As expected in any resonating system,
increasing the LV (and hence damping) lowers the resonance peak. On the other hand,
increasing LE (and hence resonance) sharpens the peak. The model also predicts a very
sudden increase in LV for small (<4 m) electrode gaps; while for large (>4 m) gaps,
damping only depends on the size and number of valve and membrane holes [10].
To avoid an unstable system with a really sharp resonance peak, and at the same
time, avoid an over-damped system, moderate values of LV = 30 m and LE = 200 m are
chosen, which result in an optimum operation frequency of 35 kHz. Based on these
values, the following design parameters (Table 3.3) are obtained.
Table 3.3: Summary of preliminary design parameters
Vertical (m) Layout Model Design Parameters hg 4.0 NEP 3200 LV 30 m
hc See Section 3.4 NEV 1600 LE 200 m
NM 220 f 30 kHz
tE See Chapter 4 LS 15 m
tM See Chapter 4 LHE & LHV
20 m
Amembrane 4 mm2
Figure 3.9: Shift from the thermodynamic model at high frequencies, for: (Left) different LV’s, and (Right) different LE’s [2].
LV = 30um LE = 50um (- -) LE = 200um (–) LE = 1mm (-.-) LE = 5mm (..)
LE = 200um LV = 10um (- -) LV = 30um (–) LV = 50um (-.-)

50
3.2. FLUIDIC PATHS AND HONEYCOMB PUMP (HCP) ARCHITECTURE
Fig. 3.10 shows a simplified 3-D view of the pumping cell that was depicted in Fig.
3.5, if square membranes used. To efficiently use the device area, and simplify the
pumping cycles, gas goes to every pumping chamber twice, once through the bottom
wafer cavity and once through the top wafer cavity. The introduced pumping structure
requires three valves to be placed around the pumping cavity, resulting in two possible
configurations for a square membrane design (Fig. 3.10.b).
The 18-stage Michigan Pump, formed by putting pumping configurations of Fig. 3.10
together, is shown in Fig. 3.11. The resulted pump layout is not area efficient, since a
great portion of the device area is not utilized.
Figure 3.10: simplified 3D view of a single pumping cell (left), and, two possible fluidic configurations of a cell (right)
Figure 3.11: an 18-stage pump layout resulted from blocks of Fig. 3.10, introduced by Kim, et al. [3]

51
Although square membranes should potentially be able to “tile” an arbitrary
rectangular surface, the valve constraints and fluidic paths, shown in Fig. 3.10, make
them incapable of 100% area utilization. Alternately, it can be shown that the honeycomb
pump (HCP) design provides the possibility of 100% area utilization, and at the same
time, has the advantage of providing a more uniform force distribution (as it is closer to a
circular membrane) with the same membrane area, which is preferred in many ways.
Keeping the membrane area constant, the 2 x 2 mm2 square membrane of the previous
Michigan Pump can be replaced by a ~1.25 mm hexagonal membrane. The entire device
area can be utilized by converting the square flow paths of Fig. 3.10 to their hexagonal
counterparts, as shown in Fig. 3.12.a, b, c. This method results in dramatically more
packed geometries for both 4- and 18- stage pumps, shown in Fig. 3.12.d, e.
In Fig. 3.12.b the proposed 4-stage design is more area and process efficient than the
18-stage, thanks to (1) geometrical and (2) fluidic, symmetries. The area efficiency of the
4-stage design results from the geometrical symmetry, since the most surface efficient
device shape (for a full pump die) is a regular hexagon. The process efficiency of the 4-
stage design results from the fluidic symmetry, since for any proposed two-wafer process
(e.g. wafer bonding), mirroring gas flow paths in the top cavities obtains gas flow path in
the bottom cavities, which saves half of the photo masks.
Figure 3.12: Hexagonal counterparts of (a, b, c) Fig. 3.10.b and (c, d) Fig. 3.11.

52
The geometrical and fluidic symmetries of the 4-stage design inspired new symmetric
designs for larger pumps. The results are shown in Fig. 3.13: Starting from a single
hexagon (single valve) as single-tier geometry, and creating a shape with 7 hexagons (4-
stage pump) as 2-tier geometry, 3- and 4-tier geometries are also possible with 19 and 37
hexagons respectively. Since an N-stage peristaltic pump has N/2 pumping membranes,
N/2 transfer membranes and (N/2)+1 inlet/outlet membranes, the 3-tier design (with 19
hexagons) of the Fig. 3.13 offers a 12-stage pump while the 4-tier geometry (with 37
hexagons) offers a 24-stage pump. Once geometrically symmetric designs are found, both
12-stage and 24-stage shapes of Fig. 3.13 are examined for a possible fluidic path
(preferably a symmetric path to save half of the photo-masks). Since the number of
pumping stages is even in both cases of 12-stage and 24-stage designs (6 and 12
respectively), unlike the 18-stage case, a fluidic symmetry is possible and found in both
cases. The results are shown in Fig. 3.14 and Table 3.4 summarizes all designs.
Figure 3.13: One-, two-, three- and four-tier symmetries, corresponding to single valve, 4-stage, 12-stage and 24-stage pump configurations, respectively.
Figure 3.14: 12-stage and 24-stage Honeycomb Pump (HCP) configurations

53
Table 3.4: Summary of HCP configurations for different number of stages.
3.3. ELECTROSTATIC ACTUATION AND ACTIVE MICROVALVES
Since neither the thermodynamic nor the reduced order model (provided by Astle)
included any actuation or membrane material effect, we need to provide some estimation
for membrane properties, most notably, resonance frequency, air damping, force relations
and pull-in voltage, in order to insure that the designed membrane properties are in the
desired range. This is especially important since the current design, as stated in Section
3.1, uses only one actuation electrode. Single electrode actuation relies on the mechanical
restoring force for release (and upward movement), and hence 1) heavily relies on
resonance for bi-directional movement, and 2) needs design caution to avoid gas pressure
buildup due to damping and stage differential pressure on the membrane.
3.3.1. Resonance Frequency Estimation
The fundamental resonance of a circular membrane is given by Eqn. 3.9, which can
be used to roughly estimate the resonance frequency of a hexagonal membrane too. An
upper limit, using the resonance frequency of a square membrane with the same area, can
also be obtained, and the average value can provide an estimate for the hexagonal case.
The m-n mode resonance frequency of a rectangular membrane is given by:
fsqmn
1
2
D
n
Lx
2
m
Ly
2
Design Name Number of Stages
Symmetry Footprint Size (mm)
Structural Fluidic AB-HCP-4 4 Yes Yes Hexagonal r = 4.5
AB-HCP-12 12 Yes Yes Hexagonal r = 7.0
AB-HCP-16-1 16 Yes Yes Diamond a = 12.5
AB-HCP-16-2 16 No Yes Irregular (hexagonal package) r = 8.5
AB-HCP-18-1 18 Yes No Irregular (rectangular package)
17.5 x 15.0
AB-HCP-18-2 18 Yes No 17.5 x 12.5
AB-HCP-24 24 Yes Yes Hexagonal r = 10
(3.19)

54
where and are the residual stress and density of the membrane, and Lx and Ly are its
dimension. In case of the fundamental frequency of a square membrane, Lx = Ly = L and
and m = n = 1, which results in:
fsq11
2D AD
Eqns. 3.9 and 3.20 will used to obtain a lower and upper limit for the resonance
frequency of the fabricated membrane. As an example, using process parameters of HCP
Gen. 3.0 (see Section 4.2.2), the membrane parameters are summarized in Table 3.5.
Table 3.5: Membrane material properties and thicknesses, used in fabrication of the pump (Chapter 4)
Note that the total stress and density are calculated simply by averaging. Using Eqns.
3.9 and 3.20, fcirc and fsqq can be calculated as 36 kHz and 42 kHz; so, a good estimate for
the membrane resonance frequency would be 36 kHz < fhex < 42 kHz. This value is
chosen to be very close to the maximum performance point predicted by the reduced-
order model (Fig. 3.9). It will be shown in Chapter 5, the freestanding membrane
characterizations will validate these results, although the coupled resonance of the cavity
and membrane happens far below this value.
3.3.2. Pump Membrane Damping Estimation
The reduced order model only considers damping effects due to the valve electrode,
which impacts the pump performance. But the pumping electrode also causes damping,
due to its (1) gap height, and (2) hole configuration:
PEdmp PEgap PEhole
D (Kg/m3) D(MPa) Thickness (Å)
SiO2 2600 -150 2 x 5000 Si3N4 3400 +1100 2500 Au 19400 -100 2250 Cr 7200 +375 250
Total 5320 +70 15000
(3.20)
(3.21)

55
While each of the terms in Eqn. 3.21 can separately be calculated, researchers have
reported combined formulations as well. According to a work by Bao on squeeze film air
damping, the damping pressure for a thin membrane working against a perforated
electrode, the hole size and thickness of which are comparable, is given by [12]:
p(x) 12h3
latn2 1 cosh(x / l
atn)
cosh(a / latn )
h
t
where is the air viscosity, h is the electrode-membrane gap, a is the membrane size, x is
the distance from membrane edges, and latn is defined as the attenuation length (similar to
viscous length), given by:
latn
2h3 t 3 r
o
8
13r
o4
16th342 4 4ln() 3
32ro
2 ; (=
ro
rc
)
where t is the electrode thickness and ro and rc are the hole size and perforation period
length, respectively. For our application, a >> latn, and hence, the hyperbolic term is 1,
except at the membrane edges. Considering ro = LEH and rc = LS + LEH for the pump
electrode, Eqn. 3.22 becomes:
Pdmp
8
LH
22
t
E
3 LH
8
1
3LH4
16tEh
g3
42 4 4ln() 3
h
t
When the membrane is not in the pull-in range (i.e. h < 2hg/3), Eqn. 3.24 reaches a
maximum for atmospheric pressure and at the membrane’s equilibrium position, where
the membrane velocity is maximized (2fh). The Pmax value obtained this way can hence
be used as the upper limit estimate for air damping. It should be noted that this is a very
conservative estimate, as the electrode thickness in our system is smaller than its hole
size, while Eqn. 3.22 is derived for thick electrodes. In fact, most of the damping in Eqn.
3.21 is contributed by the gap, not the holes, in our case. Moreover, the gas viscosity in
Eqn. 3.22 is often lower than air viscosity at atmospheric pressure.
[12] (3.22)
[12] (3.23)
[12] (3.24)

56
Fig. 3.15 plots the damping pressure for different electrode properties. For our design
parameters, LEH = 20 m, tE = 8 m, and hg = 4 m (see Chapter 4 for detailed t and h
values), the damping pressure can be estimated as ~1200 Pa.
3.3.3. Electrostatic Force Estimation
The force provided by the electrostatic actuation can be estimated as:
2
22
AVF
h
where A is the effective (overlap) surface of the parallel plates, h is the gap, V is the
voltage, and e is the permittivity. The pressure generated by this force can be written as:
P F
Ammbn
V 2
2hg
2
Aoverlap
Ammbn
Figure 3.15: Maximum pump electrode air damping for different gap heights and hole sizes at f = 35 kHz
(3.25)
(3.26)
3500
2500
1500
500
0 16 20 25 3 4 5
5000
4000
3000
2000
1000
0

57
in which Aoverlap should be calculated based on the perforted electrode area; therefore:
Aoverlap pump Ammbn NEPLHE
2 and Aoverlap valve Ammbn NEV LHE
2 NM LHM2
for pump and valve actuators respectively. For NEP = 3200, NEV = 1600, NEV = 220 and
LHM = LHE = 20 m, Aoverlap becomes (0.68)Ammbn and (0.82)Ammbn, for pump and valve
actuators, respectively, resulting in the following actuation pressures:
Table 3.6: Generated valve and pump membrane pressures for different applied voltages
Voltage (V) Pressure (kPa)
Valve Membrane
50 3.2 75 7.2
Pump Membrane
50 2.5 75 5.6
3.3.4. Single-Sided Actuation Considerations
When two electrodes (each on one side of the membrane) are used for electrostatic
actuation, the membrane motion takes place in a symmetric “pull-pull” fashion. Such a
membrane would exhibit bi-directional motion, even when off-resonance (although at a
reduced efficiency). Moreover, the membrane behavior could easily be modeled, due to
symmetry. The downside is, however, the complexity of fabrication, characterization and
testing (see Section 4.1), so the present design only utilizes one electrode under each
pumping/valve membrane, for electrostatic actuation. A number of challenges arise, most
importantly, the restoration force, which must be provided by the membrane tension,
which must overcome gas damping and the stage differential pressure buildup. In
addition, the functionality of the system will highly rely on resonance.
In order to ensure that the designed membrane of Table 3.5 can provide the required
restoration force, the membrane deflection for a given pressure load should be estimated.
Since finding an analytical solution for this problem is quite challenging, a parametric
study using COMSOL Multiphysics (with the help of an on-campus graduate student
colleague, Karthik Kumar, from Aerospace Engineering [13]) is carried out, instead.

58
First, the membrane is modeled in COMSOL, as shown in Fig. 3.16. Different pressure
loads are applied, and corresponding deflections at the center of the membrane are
recorded. By analyzing the obtained data in MATLAB, the following mathematical
relation, consisting of a linear and a cubic term, results:
PD (5.33e17)hd3 (4.34e8)hd
which predicts ~1750 Pa of restoration pressure at full-collapse.
The membrane behavior can be studied in the following cases: 1) at equilibrium,
where the actuation force is investigated to see if it can collapse the membrane, and 2)
when collapsed, where the restoration force is investigated to see if it can restore the
membrane. Both cases are only considered for the pump membrane, as the valve has a
larger actuation and restoration force due to less number of electrode holes (see Table
3.6), and more number of membrane holes (see Fig. 3.15).
At equilibrium, the electrostatic pressure Po needed to collapse the membrane is:
Po Phg Pdmp Pj
where P-hg is the pressure needed to collapse the membrane (Eqn. 3.28), Pdmp is the
maximum damping pressure (Eqn. 3.24), and Pj is the differential pressure buildup of
the j-th stage. Using Table 3.6, we obtain Pj < 2.5 kPa, for 75 V actuation.
On the other hand, to release a collapsed membrane the restoration force becomes:
Figure 3.16: Membrane deflection simulation, using COMSOL Multiphysics [13].
(3.29)
[13] (3.28)

59
Prestore Pdmp Pj
which results in Pj < 500 Pa, meaning that the stage pressure difference cannot exceed
0.5 kPa, or the membrane (for all cases of Fig. 3.3) will always be stuck to the electrode!
Although this might be overwhelming in the first glance, the issue can easily be
addressed by a smart choice of the electrode direction (see Fig. 3.17), such that the stage
pressure buildup always works in favor of restoring all pump membranes, which results
in “normally-open” membranes. Of course in this case, the stage pressure must be
overcome when collapsing the membrane (Eqn. 3.29), as it would work against the
actuation, which can simply be done by increasing the actuation voltage (Table 3.6).
It should be noted that, unlike pump membranes, valve membranes cannot be
designed in a way that all of them behave as “normally-open.” This is because the
transfer valves are in the same direction as the pump membranes, while inlet/outlet valves
are in the opposite direction, and thus, would be “normally-close” when pump and
transfer membranes are “normally-open.” In essence, single-electrode actuation results in
“incomplete opening of inlet/outlet valves.” Using proper valve timing (Chapter 5) can
improve the situation, while a revised fabrication process enabling “valve-flipping” can
completely address the issue by making all membranes “normally-open”. In addition to
these solutions, a larger valve-gap (happened during fabrication of some early device
generations due to valve electrode curvature) can also solve the issue (see Chapter 6).
As a last remark, it should be noted that all the analysis in this section overestimates
the pressure buildup, and hence, overestimates the required collapse and restoration
forces. In reality, smaller forces might suffice, as test results indicate in Chapter 5.
Figure 3.17: A pump configuration with “normally-released” pump membranes, formed by choosing a bottom-to-top (BT) input.
(3.30)

60
3.4. SCALING THE PUMP FOR HIGH PRESSURE GENERATION
As discussed in Section 3.1.2, cascading several mechanical compression
micropumps in series can result in an uneven pressure distribution, with the last (near-
atmosphere) stages facing a much larger differential pressure than the first (near-vacuum)
stages (Fig. 3.3.a). Such an uneven pressure distribution limits the scalability of the
multistage micropump, as a number of stages would need larger-force actuators, and
hence, the multistage chain cannot be extended (scaled) to more number of stages.
A quick solution to this uneven pressure distribution would be choosing very high Vr
values (>95%), as proposed by Kim and Astle [1] and shown in Fig. 3.2. Although this
approach addresses the pressure distribution issue for moderate target pressures, it may
not be considered an ultimate cure for the scalability issue, due to the following reasons:
- It only gives a “nearly linearized” estimation in the exponential pressure distribution
relation (Eqn. 3.6), while the pressure distribution is still nonlinear (Fig. 3.2.b).
- It lowers achievable target pressure accumulations (e.g. using 24-stages, Vr = 98%
only achieves 0.7 atm, while Vr = 90% reaches as low as 0.25 atm, although with an
uneven distribution), unless more stages are used.
Figure 3.18: Differential pressure per stage of a 50-stage micropump with Vr = 98%

61
It should be noted that if Vr = 98% is used to realize a vacuum of 0.25 atm, then 50
stages would be needed, which is not practical, whether considering reliability issues or
total die size constraints. More importantly, as shown in Fig. 3.18, such a high-volume-
ratio 50-stage pump still exhibits non-uniform pressure distribution (P = 700~2200 Pa).
This indicates that only increasing Vr would not satisfy the needs for scalability.
As a result, in order to effectively utilize multi-staging and realize a truly scalable
peristaltic pump (that can be extended to any number of stages), a method for truly
uniform force distribution should be sought. This is especially important for the current
design, as it uses single electrode actuation, and hence, relies on membrane’s restoring
force (instead of pull-pull actuation) for bi-directional movement (see Section 3.3).
3.4.1. Variable Volume Ratio (VVR) Design
In order to gain a better understanding of non-linear pressure distribution of a
multistage pump (as depicted in Fig. 3.3), a molecular explanation can be used: in the
beginning, the input and output (and all stages in between) are at atmospheric pressure;
but as the pumping proceeds, input pressure drops to below-atmospheric values, resulting
in different absolute pressure values throughout the multistage pump. This results in
inefficient pumping of input-side stages, which experience higher mean free path values,
due to lower gas densities. In other words, input-side stages move fewer gas molecules
per stroke, and hence, do less pumping. Since the inefficient pumping is caused by
reduced gas densities at input-side stages, it can be addressed if a larger stroke is
provided by input-side stages. This results in a variable volume ratio (VVR) design, in
which stages with lower final absolute pressure should be designed to have smaller
volume ratios (and hence higher compression). Using the VVR design, each stage
exhibits strokes inversely proportional to that stage’s final gas density.
To describe this quantitatively, we just need to solve Eqn. 3.6 for volume ratio, when
a fixed pressure differential per stage is targeted, for a known final input pressure. Fig.
3.19 shows the pressure distributions with the same targets as Fig. 3.3, but with fixed
pressure per stage, resulting in VVR. As seen in the figure, using this method, all stages
need to provide the same amount of force, and hence all membranes are made similarly.

62
Figure 3.19: VVR designs (targeting 0.7 atm and 0.2 atm final absolute pressures), resulting in constant pressure distributions (top: 1260 Pa and 3165 Pa per stage), and linear pressure rise (bottom).

63
3.4.2. Modular Pressure Scheme (MPS)
The main objective of the VVR design (in contrast to CVR) is to ensure that the
pressure differential that each membrane works against during pumping can always be
overcome using microscale actuators, so that the pump can be scaled. Another method to
realize this would be targeting an acceptable range for stage pressures that can be
overcome by single sided electrostatic actuators, as listed in Table 3.6. This scheme
results in a number of different stage pressure differences (all within an accepted range),
as well as a number of different volume ratios, as shown in Fig. 3.20. We refer to a group
of stages that have the same Vr number as a pressure module and call this design method
a modular pressure scheme (MPS), in which each module is designed to reach a specific
pressure range, while all stage pressures fall within a preset accepted pressure range.
It should be noted that the VVR method is preferred when changing the stage volume
ratio is monolithically possible on the same die; while the MPS is preferred when
separately fabricated devices, each with a different constant Vr value, are used in a
stacked micropump assembly. Both approaches are shown in Fig. 3.21.
Figure 3.20: MPS (targeting 0.7 atm and 0.2 atm final absolute pressures), resulting in a range of accepted stage pressure differentials, and linear absolute pressure rise (percentile values indicate the used Vr per each pressure module).

64
3.4.3. Implementing the Scalable Multistage Pump
Fig. 3.22 shows the strategy that can be taken in design of a VVR or MPS pump:
Depending on the stage differential pressure constraints (imposed by the type of actuator
used), a CVR, MPS or VVR design might result. Indeed, the number of modules is
increased until the pressure difference of all stages fall within the desired range. Only in
the case that the algorithm fails to satisfy the pressure constraints, then it would add more
stages; therefore it gives the optimum multistage pump for given pressure constraints.
It should be noted that this strategy extends the pump, until the target pressure is
reached (and pressure or actuator constraints are satisfied), using an always-uniform
pressure distribution. This indicates the scalability of the VVR and MPS approaches.
Figure 3.21: (Left) stacking several CVR micropumps to form an MPS with Vr1 < Vr2 …< Vr4, versus (Right) a monolithically fabricated 24-stage VVR micropump (bottom cavities shown).
Figure 3.22: Design strategy for a scalable multistage micropump.

65
Once the right number of modules and all volume ratios are found (using the
algorithm of Fig. 3.21), the VVR or MPS pump should be implemented, by varying Vr
values from stage to stage (VVR), or for every group (module) of multiple stages (MPS).
This can be done in two ways: (1) varying the stroke (Vmax -Vmin), or (2) varying the
cavity volume (Vc). In reality, however, only the second method can be practiced, since
varying the stroke, would either mean changing the membrane size (which changes the
membrane properties, most notably, the resonance frequency), or mean changing the gap
(which changes the actuator’s force, and also complicates the fabrication.)
Varying the cavity size, on the other hand, is quite feasible and can be realized by
varying the cavity footprint on the device’s layout (note that changing the cavity height
would require a complicated 3-D microfabrication technology, and hence, we do not
pursue that). Also, it can be done on the same device (monolithically) or by stacking
separate devices with different constant volume ratios. Note that VVR is more preferred
in the first case, while MPS works better for the second, as illustrated in Fig. 3.21.

66
3.5. TECHNOLOGY REQUIREMENTS
To conclude this chapter, we summarize technology requirements for realizing a
scalable Michigan Pump, based on the modeling and analysis provided so far. We pay
special attention to primary and secondary design parameters (Tables 3.1 and 3.2), as
they impact the pump’s performance.
In order to realize a functional and reliable multistage micropump (and hence,
scalability), a microfabrication technology must be capable of (listed based on priorities):
- Varying the cavity area, independently from the membrane size: this is a
fundamental requirement, and unless satisfied, VVR pumps cannot be made.
- Accurate control over hg and hc: since the pump performance is extremely sensitive
to Vr (see Fig. 3.3), which is proportional to hg/hc, these two parameters must be
controlled with error < 1%.
- Tight control over membrane’s residual stress: as it directly affects the resonance
frequency, which is very important in single electrode actuation.
- A high yield microfabrication process to realize the membrane: since all the
membranes are connected in series in a multistage pump, and one broken membrane
could ruin the entire pump.
Table 3.7 summarizes the criteria, based on the required process flexibility (indicated
by range), and process control (indicated by tolerance), and Table 3.8 summarizes the
design features of the Scalable Michigan Pump.

67
Table 3.7: Summary of important design parameters, their significance and technology requirements
Table 3.8: Primary and secondary design features of the Scalable Michigan Gas Micropump
Primary Design Feature Secondary Design Feature
Feature Effect Feature Effect
Fluidic Resonance
High Flow Rate (compensates flow reduction caused by large volume ratio)
Shared Membrane Design
Saves Device Area Few Actuation Signals Needed
Multi-Stage Design
Large Total Pressure Accumulation Scalable
Electrostatic Actuation
Easy to Fabricate and Integrate Fast and Low Power
Large “Stage Volume Ratio”
Maintaining Linearity → Scalable Low Actuation Voltage
Single Electrode Actuation
No DC Bias → No Charging Ease of Fabrication and Testing
Bucket-Brigade Configuration
Repeating Cycles → Scalable Few Actuation Signals Needed
Checkerboard Microvalve
Low Damping → Fast Response Large Force → Good Sealing
Variable Volume Ratio
Uniform Pressure Distribution Scalability
Honeycomb Pump Architecture
100% Area Utilization Scalable and Symmetric
Parameter Impact on Performance Technology Requirement
Symbol Indicates Affects Significance Required
Range Accepted Tolerance
hg Membrane Gap Height
- Volume Ratio - Stroke - Damping - Actuation Voltage - Fluidic Resistance
Vr 2-8 m 1%
hc Cavity Gap Height - Cavity Resonance - Volume Ratio - Dead Volume
Vr 40-120 m 5%
Membrane Stress - Membrane Resonance - Actuation Voltage f 20-100 MPa 10%
Vmin Min Cavity Volume - Volume Ratio - Dead Volume Vr 5%
Vmax Max Cavity Volume - Volume Ratio - Stroke Vr 5%
Ls Sealing Distance - Valve Sealing - Damping - Fluidic Resistance
Sealing 5-15 m 5%
tM Membrane Thickness
- Valve Sealing - Damping - Actuation Voltage - Resonance Frequency
Sealing 0.5-4 m 1%
tE Electrode Thickness - Damping - Cavity Resonance Resonance 4-20 m 5%
Amembrane Membrane Area - Volume Ratio - VVR VVR 2-6 mm2 10%
Acavity Cavity Aria - Volume Ratio - VVR VVR 2-6 mm2 10%
68
3.6. References
[1] A.A. Astle, A. Paige, L.P. Bernal, P.D. Washabaugh, J. Munfakh, H. Kim, K. Najaf “Analysis and design of multistage electrostatically-actuated micro-vacuum pumps,” Proceedings of 2002 ASME IMEC, New Orleans, LA (Nov’02) IMECE2002-39308.
[2] A.A. Astle, L.P. Bernal, P.D. Washabaugh, H. Kim, K. Najafi, “Dynamic modeling and design of a high frequency micro vacuum pump,” Proceedings of 2003 ASME IMEC, Washington, DC (November 15–21, 2003) IMECE2003-41493
[3] H. Kim, A. Astle, K. Najafi, L. Bernal, and P. Washabaugh, “A fully integrated high-efficiency peristaltic 18-stage gas micropump with active microvalves,” in Proc. MEMS 2007.
[4] T. Gerlach, "Pumping gases by a silicon micropump with dynamic passive valves," 1997 International Conference on Solid-State Sensors and Actuators (Transducers '03), Chicago, pp. pp. 35 7-360, 1997.
[5] Muller, M., Bernal, L. P., Washabaugh, P. D., Kim, H. and Najafi, K. 2002 Resonance effects of electrostatically actuated acoustic jets AIAA, 1272-1281
[6] Chou, T.-K. A., Najafi, K., Muller, M. O., Bernal, L. P., Washabaugh, P. D. and Parviz, B. A. 2002 Micromachined e-jet for IC chip cooling Proc. IEEE Internaional Solid-State Circuits Conference (ISSCC 02). San Francisco, CA, pp. 356-357
[7] H. Zhou, H. Q. Li, V. Sharma, and M. Schmidt, “A Single-Stage Micromachined Vacuum Pump Achieving 164 Torr Absolute Pressure,” in Proc. MEMS 2011, Mexico, Jan. 2011.
[8] Stehr, M., Messner, S., Sandmaier, H. and Zengerle, R. 1996 The VAMP- a new device for handling liquid or gases Sensors and Actuators A, 57, 153-157
[9] Stehr, M., Gruhler, H., Straatmann, H., Messner, S., Sandmaier, H. and Zengerle, R. 1997 The selfpriming VAMP Proc. International Conference on Solid-State Sensors and Actuators (Transducers '97). Chicago, IL, pp. 351-352
[10] A.A Astle, H.S Kim, L.P Bernal, K. Najafi, and P.D. Washabaugh, “Theoretical and experimental performance of a high frequency gas micropump”, Sensors and Actuators A: Physical, Volume 134, Issue 1, Pages 245-256, Feb. 2007
[ 11 ] Bernardi, R.T., Linehan, J.H. & Hamilton, L.H., 1976 Low Reynolds Number Loss Coefficient for Fine-Mesh Screens, Journal of Fluids Engineering, Transactions of the ASME, pp762-764.
[12] M. Bao and H. Yang, “Squeeze film air damping in MEMS,” Sens.Actuators A, vol. 136, no. 1, pp. 3–27, 2007.
[ 13 ] K. Kumar, “Theoretical and Experimental Analysis of an Electrostatically Actuated Multistage Micropump with Active Valves,” Ph.D. thesis, University of Michigan, Ann Arbor, MI, 2013.

69
CHAPTER 4
MODULAR HONEYCOMB PUMP TECHNOLOGIES
DEVELOPMENT AND MICROFABRICATION
In previous chapters, operation, design and modeling of the Michigan Pump were
presented in great detail, and main pump features for miniaturization (dividing the
pumping job into several small pumps, using multi-staging and fluidic resonance) was
highlighted. Methods (notably, the VVR and MPS) to realize a scalable pump for further
miniaturization were developed, and technology requirements (notably, separate control
over stroke and cavity volumes) to implement these methods were identified.
Throughout this chapter, microfabrication of the Scalable Michigan Pump is
presented, based on the technology requirements summarized in the previous chapter. To
develop necessary tools for fabrication, we first review the technology used by Kim,
identify its shortcomings – fundamentally and practically – in realizing a scalable
multistage gas micropump, and suggest solutions to address the issues involved.
Implementing the proposed solutions, the capabilities in realizing the Scalable Michigan
Pump are developed. Most notably, the capability of forming several pressure modules is
realized using a novel process, named modular microfabrication technology, in which
stroke and cavity volumes are separately controlled. In addition, the modular
microfabrication technology separates fabrication of the sensitive and insensitive parts of
the micropump as fabrication modules, resulting in improved process control over main
design parameters and improved testing and characterization capability. Several
technologies, including surface micromachining of large thin membranes by poly-silicon
trapping, bulk micromachining of highly stressed thin devices using vertical stiffening,

70
and spin-on packaging technology for device assembly, are reported in developing the
modular microfabrication technology. It should be noted that: 1) The finalized technology
is a result of several device generations, but only the successful fabrication runs are
reported, while the others are only summarized in Table 4.7 briefly. 2) The term
“modular” indicates two different concepts in the realization of the modular micropump:
when referring to the MPS, modular indicates different pressure modules that form a
uniform pressure distribution over the multistage pump; while referring to the process,
modular indicates separating the device fabrication into two fabrication modules: the
sensitive membrane-electrode (or mechanical resonator) module, and the insensitive
cavity (or acoustic resonator) module.
4.1. IDENTIFYING CHALLENGES IMPACTING THE PREVIOUS WORK
Here, we investigate the technologies used for microfabrication of the previous
Michigan Pump, to see if they can satisfy the needs for a scalable multistage pump, or
not. Both fundamental shortcomings and practical challenges are summarized next.
4.1.1. Overview of the Microfabrication Technology
Fig. 4.1 shows the microfabrication process developed by Kim to realize the previous
Michigan Pump [1]. It resulted in a “Parylene-membrane” micropump, using three-wafer
bonding and alignment of fine-feature structures, which can be summarized as follows:
First, pumping chambers and fixed electrodes are formed using bulk micromachining
technique on one wafer: electrodes are defined by deep boron doping and insulated using
LPCVD oxide deposition, while depth of the cavities are defined by a timed DRIE step,
prior to timed TMAH release of the cavities. To form curved fixed electrodes, buckling
of stressed thin films into a desired shape and direction was practiced [2]. On a separate
carrier wafer, a thin layer of Parylene (~1.5 m thick) is deposited on top of a PR
sacrificial layer, patterned using O2 plasma etching, and then released in acetone to
provide the freestanding thin polymer membrane. The Parylene membrane is transferred
from the carrier wafer onto the device wafer using Parylene bonding, to form pump and
valve membranes and to enclose the pumping chambers and fluidic channels. The thin

71
membrane is suspended over perforated electrodes (~2 mm on a side) by a small gap
(~5 μm) [3]. Finally, a second device wafer is bonded on top of the first device wafer,
using the same technique, sandwiching the pump and microvalve membranes between
two electrodes and closing off the pumping chambers. To avoid damaging polymer
structures during the wafer bonding, a new low temperature (~230°C) wafer bonding
technique using thin film Parylene was developed by Kim, et al. [4]. Finally, inlet and
outlet are formed using DRIE, followed by through-wafer DRIE to separate the devices
(dicing saws cannot be used, due to fragile membranes and electrodes).
4.1.2. Fundamental Shortcomings
In the process developed by Kim, the cavity volume can either be controlled by depth
of etch-holes (controlling the cavity depth), or by the area in which etch-holes are created
(controlling the cavity area). While the first solution would result in cavities with
constant depths all over the wafer (unless several steps of DRIE and masking are used),
the latter would change the recess area as well, and hence, change the membrane size. As
discussed in the previous chapter, implementing a VVR design can most feasibly be
persued by varying the cavity volume while insuring that membranes are all the same
size. It should be noted that if the membrane sizes were not fixed, they would exhibit
different properties, such as different resonance frequencies and pull-in voltages. As a
Figure 4.1: Summary of Kim’s fabrication process: 1-a) recess DRIE, B-doping (conductivity/etch-stop) and oxidation (insulation) to define the electrodes, 1-b) etch hole DRIE to define the cavity height, 1-c) curved-electrode release and cavity formation by TMAH etch, 2-a) Parylene deposition and patterning on sacrificial PR, 2-b) PR removal and Parylene release, 3-a) Parylene bonding and film transfer, 3-b) top wafer bonding to encapsulate the pump, 3-c) inlet/outlet DRIE, dicing, and fluidic ports assembly [1].

72
result, using Kim’s process, the only way to implement the VVR would be varying depth
of the etch-holes from stage to stage, which would require a new masking and DRIE step
for every new Vr needed. This fundamentally limits the “Parylene-based” technology in
realizing a VVR or MPS.
On a separate note, the “Parylene-based” technology provides membranes with a
limited tension (<5 MPa), which in turn limits the highest achievable resonance
frequency to only ~10 kHz (see Section 3.3). This means that the only way to actuate the
membrane at higher frequencies (and yet get a bi-directional membrane motion) would be
using double-electrode actuation in a “pull-pull” fashion, which in turn increases the
device complexity, both from fabrication and control/testing standpoints. The fabrication
complexity is caused by an increased number of lithography steps and the need for high-
accuracy alignment between top and bottom electrodes. The testing/control complexity is
caused by the need for more actuation signals, DC bias (causing charge accumulation),
higher actuation voltage level (since bi-directional motion is only provided by “pulling
action” not membrane’s structural properties), and lack of any visual inspection
capability (since the membrane is sandwiched in between two opaque electrodes).
In summary, the process developed by Kim is fundamentally incapable of addressing
VVR requirements (unless several masking and DRIE steps are added) or high frequency
actuation requirements (unless very high-voltage dual-electrode actuation used).
4.1.3. Practical Challenges
Since all the pumping and valve membranes are connected in series in the Michigan
Pump, scalability of the pump is greatly affected by yield, reliability and repeatability of
the fabrication, which in turn are affected by the ability to control critical micropump
parameters (listed in Table 3.1) during fabrication. Although yield, reliability and
repeatability are usually associated with commercial devices, improved control over
critical design parameters is also important from research point of view, when it comes to
designing a complex and sensitive MEMS device, such as the Michigan Pump. This
means that, as listed in Section 3.5, parameters such as the membrane’s resonant
frequency and stroke must be consistent, the valve sealing must be guaranteed, and stage

73
volume ratio must be well controlled across the device, which in turn require good
control over the membrane film stress, the membrane gap height and the cavity height.
Despite its novelty, the micropump fabrication process developed by Kim was
complex, due to using multiple wafers, double sided processing, membrane stretching,
thin-film transfer, complex alignment, and multiple bonding steps. Moreover, it provided
limited testing and characterization capability, especially once the device was packaged.
The control over critical pump parameters must be improved for a better scalability,
yield, repeatability and reliability. In particular, major challenges can be listed as:
a) Many serial processing (single wafer) and many hand-manipulation steps
b) Many photolithography steps (up to 15 photolithography masks)
c) Lithography over uneven surfaces (steps >10m)
d) Three-wafer processing
e) Double sided wafer alignment and processing
f) Bonding/alignment of small features (down to 10m) between wafers
g) Polymer film stretching
h) Timed (no etch stop) etching of pumping cavities and membrane gaps
i) Defining the cavities by “through micro-hole” wet etching
j) Lack of device testing/characterization capability during the process
Table 4.1: Practical challenges of Kim’s fabrication technology and their effect on different parameters
List of issues → a b c d e f g h i j
Negative Impacts on ↓
Critical Design Parameters
fmembrane x x
fcavity x x x
Vr x x x
Valve Sealing x x x x x
Process Yield x x x x x x x
(Throughput) / (Cost * Time) x x x x
Repeatability x x x x x x x x x

74
4.2. ALL SILICON MODULAR MICROFABRICATION TECHNOLOGY
To address all the issues listed in the previous section, the search for a new
fabrication process began with the goal of satisfying the following criteria:
i. Ultimate pump scalability for high pressure generation:
a. Process compatibility with the VVR design → the cavity area must be
adjustable independent from the membrane size.
b. The process should allow cascading of as many stages as needed → high
membrane survival rate and also architectural flexibility.
ii. Very high control over the stage volume ratio (Vr value) → very high control over
the cavity and gap heights, preferably using etch-stops not timed etches.
iii. Acceptable control over the membrane resonance frequency → use thin-films
with controlled stress values, preferably not polymers.
iv. Acceptable control over the cavity resonant frequency → good control over the
cavity height, preferably using etch-stops not timed etches.
v. Minimized microvalve leakage → high accuracy membrane/electrode alignment.
vi. Providing testing and more characterization capability → more access to the
internal pump structures, and a process that is divisible into separate parts.
vii. Addressing cost, reliability, repeatability, and yield issues → simplify the process
as much as possible.
The corresponding solutions for the above requirements can be proposed as follows:
I. For (a), the technology process should separate fabrication of the cavities from
fabrication of membranes and their corresponding recesses. For (b), all complex
steps, including bonding, wafer-to-wafer alignment, through micro-hole etching,
and use of unconventional materials should be avoided.
II. Surface micromachining can be used to form the membrane gap accurately, and
the cavity should either be formed using a process with good etch stop (no timed-
etch) or be made and tested separately to assure proper height control.
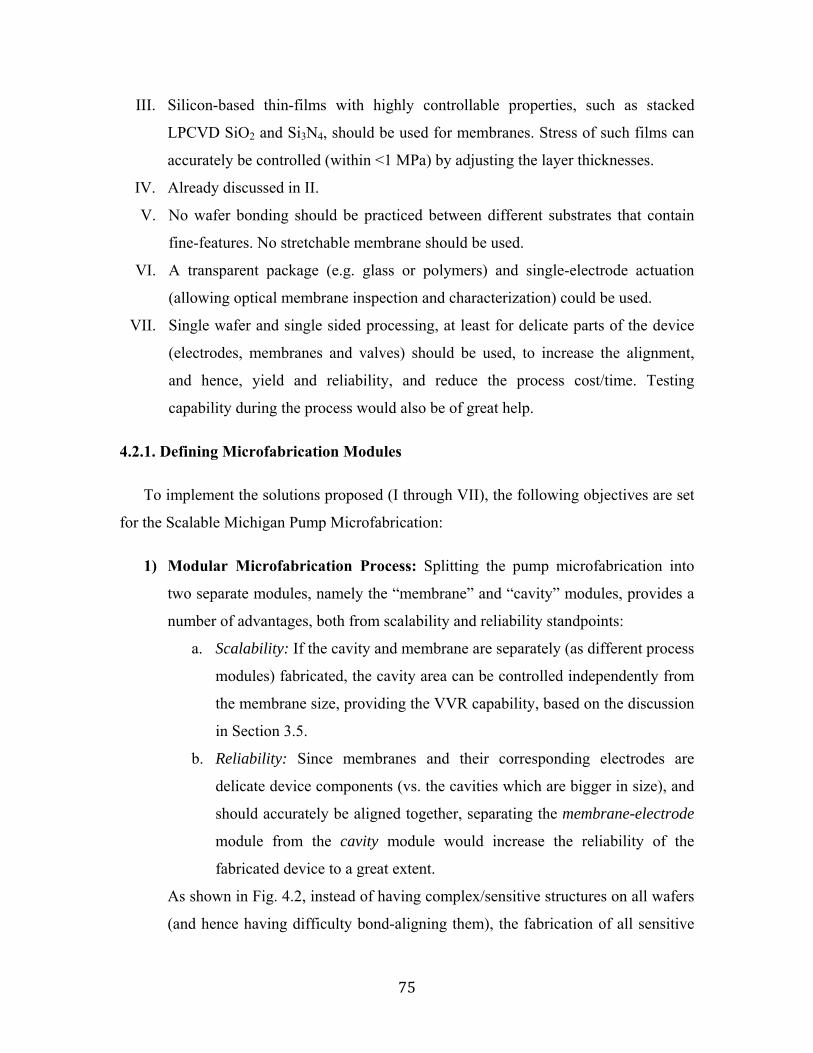
75
III. Silicon-based thin-films with highly controllable properties, such as stacked
LPCVD SiO2 and Si3N4, should be used for membranes. Stress of such films can
accurately be controlled (within <1 MPa) by adjusting the layer thicknesses.
IV. Already discussed in II.
V. No wafer bonding should be practiced between different substrates that contain
fine-features. No stretchable membrane should be used.
VI. A transparent package (e.g. glass or polymers) and single-electrode actuation
(allowing optical membrane inspection and characterization) could be used.
VII. Single wafer and single sided processing, at least for delicate parts of the device
(electrodes, membranes and valves) should be used, to increase the alignment,
and hence, yield and reliability, and reduce the process cost/time. Testing
capability during the process would also be of great help.
4.2.1. Defining Microfabrication Modules
To implement the solutions proposed (I through VII), the following objectives are set
for the Scalable Michigan Pump Microfabrication:
1) Modular Microfabrication Process: Splitting the pump microfabrication into
two separate modules, namely the “membrane” and “cavity” modules, provides a
number of advantages, both from scalability and reliability standpoints:
a. Scalability: If the cavity and membrane are separately (as different process
modules) fabricated, the cavity area can be controlled independently from
the membrane size, providing the VVR capability, based on the discussion
in Section 3.5.
b. Reliability: Since membranes and their corresponding electrodes are
delicate device components (vs. the cavities which are bigger in size), and
should accurately be aligned together, separating the membrane-electrode
module from the cavity module would increase the reliability of the
fabricated device to a great extent.
As shown in Fig. 4.2, instead of having complex/sensitive structures on all wafers
(and hence having difficulty bond-aligning them), the fabrication of all sensitive

76
parts (the first module) can be grouped together and done at once (i.e. on one
single sided silicon wafer) with the rest of the fabrication only including
insensitive, large, easy-to-align parts (the second module). This would provide the
VVR capability (and hence enables scalability), as well as addressing testability
and reliability issues (also improving scalability). Using this method, the main
fabrication steps will be:
A) Mechanical Resonator – sensitive: all membranes and electrodes,
B) Acoustic Resonator – insensitive: all cavities, and the device package,
C) Packaging – insensitive: assembling Modules A and B, which can simply
be done without any sophisticated bond-alignment, due to the large
membrane/cavity sizes and tolerance.
Figure 4.2: Bonded-Aligned approach (top), versus the Modular Membrane-Cavity approach (bottom)

77
2) All Silicon Technology for Membrane Microfabrication: The standard MEMS
dissolved wafer process (DWP) and surface micromachining (SMM) can be used
to make the freestanding membranes, and their corresponding electrodes. Such
processes increase the reliability, provide a very good control over critical design
parameters (membrane gap height, thickness and tension) and ideal alignment for
checkerboard microvalves. The all-silicon, as well as the assembly and packaging
technologies are utilized to realize the modular microfabrication technology.
The following sections first cover the microfabrication of modules A and B
(mechanical and acoustic resonators, which can alternately be referred to as the
membrane-electrode or cavity-package modules) in great detail (Sections 4.2.2 to 4.2.5),
followed by a number of technologies developed to realize each module (Section 4.3). It
should be noted that a complex layout is preferred as long as it helps simplify the
technology. This is mainly because most of MEMS process challenges arise from
technology not layout, as MEMS dimensions are well beyond that of CMOS.
4.2.2. Mechanical Resonator (Module A) Microfabrication
Fig. 4.3 shows the six-mask microfabrication process of the mechanical resonator (or
the membrane-electrode) module for a valve membrane-electrode pair as reported in [5]:
First, (100) silicon wafers are thermally oxidized to form the mask for boron doping.
Next, deep trenches are etched using high aspect ratio DRIE, to define pumping
cavities/channels and form vertical stiffeners later. Wafers are then boron doped to
>5e19 cm-3 level to improve the conductivity of the electrode areas and also provide a
p++ etch stop for later wet etching. Next, a thick LPCVD poly-silicon sacrificial and
refill layer is deposited and patterned by DRIE, using a very narrow ring-shaped mask
that defines the membrane edges. Membranes are formed by deposition and patterning of
a thin LPCVD oxide-nitride-oxide (O-N-O) stack, a thick field-oxide with a thin nitride
etch-stop (N-O) for stress compensation, and a thin sputtered Cr-Au layer for electrostatic
actuation. Finally, resonators are released through a DWP and surface micromachining
process, using HF Nitric Acetic (HNA) mixture for wafer thinning and Ethylenediamine-
Pyrocatechol (EDP) solution for the high-selectivity and anisotropic silicon etch. This

78
will release the boron-doped electrodes, vertical stiffeners and freestanding thin O-N-O-
Cr-Au membranes.
It should be noted that:
1) The poly-silicon sacrificial and refill layer defines the membrane gap height with
<1% error, as well as refilling the boron-doped trenches for stiffening.
2) Stress of the membrane is controlled with <5% error, by controlling thicknesses
of the LPCVD O-N-O, as well as thicknesses of the sputtered Cr-Au layers.
3) Poly-silicon refilled p++ vertical stiffeners are patterned in a grid shape that helps
keep a great portion of bulk silicon intact, since EDP stops at (111) crystal plane,
as shown in Fig. 4.3-e, and discussed in Section 4.3.
4) The vertical stiffening structures define bottom cavities and their interconnecting
channels, although some height compensation might be needed to equalize the top
and bottom cavity heights.
5) The thick field-oxide is the only compressive dielectric layer (the rest are tensile),
and hence, is used for stress compensation. Since it is deposited in the end, its
required thickness (~2m) can be calculated based on stress of previous layers.
The layer also allows the tensile stress of membranes to be increased without any
limit (as the filed-oxide compensates the stress later), and also the thickness of
membranes to be decreased without any limit (since the field-oxide compensates
the ring-refill gap). The field-oxide also improves the insulation between the
doped silicon and metal lines, and provides a protection “rim” for membranes
when the front-side of the wafer is touching other surfaces (e.g. wafer carriers).
6) This method only provides one drive electrode, for improved fabrication
reliability and improved testability (visual inspection and optical methods are
possible), although it sacrifices “pull-pull” dual-electrode electrostatic actuation.
7) Both vertical stiffeners and electrodes can be created in the front-side too, by
either valve flipping or electroplating, although it would complicate the process
by adding a bonding step (in case of valve-flipping) or an electroplating step.

79
Figure 4.3: Summary of (not to scale) Module A Fabrication Process for a membrane-electrode pair of a microvalve: a) thermal oxidation to form the doping mask, followed by DRIE of trenches, b) boron doping and oxide stripping, c) poly silicon deposition and patterning, d) O-N-O membrane and N-O stress compensating layer deposition and patterning, and e) metal deposition and patterning, followed by DWP in EDP.

80
Table 4.2: Detailed microfabrication process flow and list of lithography steps for HCP Module A.
Step Mask Process Description Process Tool(s) Fig. 4.3.
0 Start: single-sided, 100, P-type (1e17cm-3) N.A.
a
1 Thermal Oxide Growth Tempress Furnaces
2 B-Dope Lithography (defines electrodes) Karl Suss MA6
3 Oxide Patterning (Wet Etch) BHF
4 Trench Grid Lithography (defines stiffeners) Karl Suss MA6
5 Trench Etch (DRIE) STS Pegasus DRIE
6 RCA + Boron Doping Thermco Furnaces b
7 Oxide Stripping (Wet Etch) HF 49%
8 RCA + LPCVD Poly-Si + ANNL Tempress Furnaces
c 9 Poly-Si Lithography (defines membrane edges) Karl Suss MA6
10 Ring Etch (DRIE) STS Pegasus DRIE
11 RCA + LPCVD O-N-O Tempress Furnaces
d
12 LPCVD N-O Tempress Furnaces
13 N-O Lithography (field oxide patterning) Karl Suss MA6
14 N-O Patterning (Wet Etch) BHF and H3PO4
15 O-N-O Lithography (membrane patterning) Karl Suss MA6
16 O-N-O Patterning (RIE) LAM 9400
17 Frame (Back) Lithography (define full-wafer frame) Karl Suss MA6
18 O-N-O Backside Etch (RIE) LAM 9400
19 Cr-Au Sputtering Kurt Lesker Lab18
e
20 Metal Lithography (connection lines patterning) Karl Suss MA6
21 Metal Patterning (Wet Etch) CR14 and AU7
22 Wafer Thin-Down from Backside HNA
(HF + HNO3 + CH3COOH)
23 DWP (Bulk and Surface Micromachining) Ethylenediamine
Pyrocatechol (EDP)
24 Stiction-free Device Drying Critical Point Drier

81
Figure 4.4: SEM Imaging of Module A: side-view of all layers, before release (top left), side-view of refilled doped trenches, before release (top right), backside view upon EDP release (middle), backside view of the trench grid and (111) crystal planes (middle – inset), released membranes and electrodes – some membranes partially-removed on purpose to show the electrodes (bottom left), and close-up of a sliced valve electrode (bottom right).

82
Figure 4.5: Module A under Optical Microscope: front view of a valve and pump – the valve membrane intentionally removed for better visualization of the electrode (top left), close-up of a pump membrane edge showing all layers in detail (top right), close-up of a valve electrode holes (middle left), backside view of 12-stage pump (middle right), close-up of vertical stiffeners from backside (bottom left), and front view of valve electrodes from backside (bottom right).

83
Figure 4.6: Fabricated Module A: full-wafer release of 4-, 12- and 24-stage mechanical resonators, ready for assembly and packaging (top), front-view of released wafer, after removal of a number of devices, using a razor-blade (bottom left), and backside view of a separated 4-stage device (bottom right).

84
4.2.3. Acoustic Resonator (Module B) Microfabrication
The acoustic resonator (or the cavity-package) module is fabricated by either glass
etching or PDMS molding, using two masks, one for top cavity structures and
interconnecting channels and the other for bottom volume-compensating “pillows.” Both
glass and PDMS processes have been developed: isotropic glass-etch using HF and
masked by evaporated Cr-Au for the glass cavity module, and PDMS molding using SU-
8 or Si as the mold, for PDMS cavity module. Both cases are shown in Fig. 4.7.
Figure 4.7: Fabricated Module B: Dual layer multiple height SU-8 processing for PDMS molding (top left), molded thin (500um) PDMS, detached from the SU-8 mold (top right), isotropically-etched glass, using HF and Cr-Au mask (bottom left), microscope image of etched glass wafers, showing an undercut of 1.5X (middle), and hexagonally-diced glass pieces, used for packaging (bottom right).

85
4.2.4. Micropump Assembly and Packaging
The packaging and assembly procedure consists of sandwiching Module A between
top and bottom pieces of Module B, aligned by manuaully using an optical microscope
and sealing the fluidic cavities and interconnects using adhesives or a quick bonding
method, as depicted in Fig. 4.8. Since all fine features are aligned within conventional
photolithography tolerances (i.e. a few microns) during fabrication of Module A (using
conventional photolithography of thin-films), only millimeter-scale structures should be
aligned between Modules A and B. This results in an alignment tolerance of ~100m,
and hence, makes the alignment possible without use of bond-aligners. Tabletop
magnifying lenses (common in microelectronic soldering), or small optical microscopes
(common in assembly of microelectronic components) suffice for this purpose and were
used through the course of this research.
For PDMS cavity-package pieces, the assembly/packaging can simply be done using
PDMS O2-plasma bonding; however, a more sophisticated process is needed for glass
cavity-package pieces, as conventional anodic bonding cannot be used due to lack of
silicon-glass contacts. A spin-on polymer packaging technology method using UV-
curable adhesives has been developed for this purpose and is covered in Section 4.3.
Figure 4.8: Micropump Final Packaging and Assembly: Modules A (Mechanical Resonator) is sandwiched between two pieces of Module B (Acoustic Resonator) to complete the micropump. (Fluidic interconnects and channels are not shown).

86
Figure 4.9: Completed (Assembled) Micropump: packaged 4-stage micropump w/ CVR (top left), packaged 12-stage micropump with two pressure modules and extended electrical pads for stacking capability to form an MPS (top right), packaged 24-stage micropump w/ VVR (middle), front view of a packaged microvalve (bottom left), and backside view of a packaged microvalve (bottom right).

87
4.2.5. Technology Summary and Comparison
Compared to the technology developed by Kim, et al. to realize the previous
Michigan Pump, the modular fabrication technology with all-silicon membrane-electrode
release capability provides the following advantages:
1) Separating fabrication of the sensitive parts of the device from the insensitive,
2) Fabrication of sensitive components (to be accurately aligned to each other) on
one single-sided silicon wafer, eliminating the need for bond-aligning or costly
special wafers, such as silicon on insulator (SOI),
3) Improved control over critical design parameters (volume ratio, membrane and
cavity resonant frequencies and valve alignment),
4) Standard fabrication technology and simplicity,
5) Improved testability both at different points in the process, and after packaging,
6) Significantly improved membrane-release yield (>90%),
7) Higher throughput, at reduced fabrication cost and time.
The modular fabrication technology with all-silicon membrane-electrode release
capability is superior compared to Kim’s technology, in all aspects (as summarized in
Table 4.3) except for dual-electrode actuation. Single electrode actuation has the
following advantages and disadvantages compared to dual-electrode actuation:
Single Electrode Actuation Advantages:
1) Reduced number of drive signals, from 5 to 3, by eliminating the DC bias.
2) No charge accumulation, since the electrode is grounded and bipolar AC signals
(with zero net area under the curve) are used. As a result, the pump can operate
continuously without any need for polarity change, which is a significant
improvement over the old pump control.
3) Process simplicity: fewer fine-feature structures to be aligned, and hence,
improved reliability (yield and repeatability).
4) Visual inspection and optical characterization capability of membranes for the
finished device: since the membrane is not sandwiched in-between two electrodes.

88
Single Electrode Actuation Disadvantages:
1) No pull-pull actuation: the device is only functional around resonant frequency
2) Fatigue might be a concern, due to constant resonance-based actuation
3) Valves are unidirectional, and hence, might do undesirable pumping
4) Valves only rely on membrane tension to open, and hence, might fail (result in
always open or always closed valves) above a certain pressure differential
5) Closed-loop control might be needed to adjust the drive frequency in pump-down
It should be pointed out that lack of dual-electrode actuation is not a fundamental
shortcoming of the modular fabrication technology, since creation of a second electrode
is still possible (see Chapter 7) using electroplating [6], poly-silicon deposition, or wafer
flipping. However, single-electrode actuation is used in realization of the Scalable
Michigan Pump, due to the advantageous process and control simplicity it offers, despite
the disadvantages listed. Necessary considerations should be taken into account in design
of the single-electrode actuator, as described in Section 3.3. We will also pay necessary
attention to single-electrode actuation, when testing the pump, in Chapter 5.
Table 4.3: Comparing the New Modular Fabrication Technology with that of the Old Michigan Pump
Parylene-Based Technology
(by H.S. Kim) All-Silicon Modular Technology
(by A. Besharatian)
Improvement w/r/t Kim’s
Process?
Pump Scalability Not Scalable (VVR not possible) Scalable (VVR quite possible) + + +
Number of masks 15 6 (module A) + 2 (module B) + +
Number of wafers 3 (2 double sided, 1 single sided) 1 single sided silicon, 1 glass +
Device Size (cm2)
(4-stage) 3.0 0.63 +
(18-stage) 5.4 2.5 +
Density/Fraction area used ~60% ~100% +
Number of Drive Electrodes 2 (double sided actuation) 1 (single sided actuation) –
Number of Drive Signals 5 (3 ACs and 2 DCs) 3 (no DC, no charge accumulation) +
Possible Frequency Range Up to 10 kHz Up to 100 kHz + + +
Wafer Bond Alignment Critical Not Critical + +
Testability / Visual Study By the end of the process / No During the process / Yes + +

89
4.3. TECHNOLOGIES DEVELOPED FOR FINAL DEVICE FABRICATION
In order to support the final device microfabrication of the Scalable Modular
Michigan Pump, several technologies, supporting the all silicon membrane-electrode
fabrication, as well as packaging and assembly techniques, have been developed. The all-
silicon technologies are based on combined bulk silicon and surface micromachining of
devices formed by deposition of multiple layers of thin-films on one single sided silicon
wafer, followed by dissolved wafer process (DWP). Two main challenges are to be
addressed here: 1) controlling the stress of multilayer stack of thin-films, and 2) handling
deep, tall and narrow structures as well as very large and thin films, at the same time. On
the other hand, the packaging technologies should offer good tolerance, feasible
alignment, and transparent packages for visual and optical inspections.
4.3.1. Stiffening of Highly Stressed Large Area Thin Structures
The multilayer stack of Fig. 4.3 consists of several highly stressed thin-films, the total
(average) stress of which may easily exceed tens of MPa. The thickness of this stack is,
however, always <20m, since the depth of p++/p+ threshold for DWP applications is
limited to <15m. On the other hand, based on different HCP structures introduced in
Section 3.2, the die size of the Michigan Pump is of the order of 1 centimeter square (e.g.
0.65 cm2 and 2.5 cm2 for 4- and 18-stage devices respectively). Such highly stressed,
overly thin, and relatively large-area structures may easily result in curled or fragile
devices upon release, even if stress of different layers are compensated (Fig. 4.10).
Figure 4.10: Early membrane-electrode release attempts (HCP Gen 1.1 – Jun 09) – all devices curled upon release, due to high tension and lack of support structures.

90
Since the p++ boron doping defines the shape of the device (or its “frame”) upon
DWP, then thicker, and hence more robust, structures can be formed if the doping is done
inside deep trenches as well. Once doped and released, such trenches would behave as
structural support beams, like body bones. The only process steps required then, would be
etching some deep trenches using DRIE, and doping them thoroughly, followed by a
conformal LPCVD poly-silicon or silicon-dioxide trench refill process [7, 8, 9] to form
the support beams. The parameters that should be determined here are: (1) trench pattern,
(2) trench opening (width), (3) trench depth, and (4) minimum doping.
For (1), the most basic pattern (honeycomb – imposed by the architecture) is tried
first, with a single trench line, as shown in Fig. 4.11. For (2), larger trench openings are
preferred, both for an easier DRIE process, and to achieve higher boron concentrations
inside the trench; however, the maximum opening is limited by the thickness of the refill
material. Since the same poly-silicon layer that defines the membrane gap height is also
used for trench refill (Fig. 4.3), hence in order to enable membrane gaps as low as
2.5m, the largest trench opening would be 2 x 2.5 = 5m (for a conformal refill),
otherwise the trench top would not be pinched in refill (Fig. 4.12.a). For (3), a deeper
trench is preferred for better structural support; however, the trench depth is limited by
the maximum aspect ratio that the DRIE process can support for a given trench opening
(e.g. with AR = 22 and W = 5m, maximum depth would be 110m). Moreover, both
boron doping and LPCVD poly-silicon processes are limited to certain depths in order to
provide acceptable doping concentration and conformal deposition (Fig. 4.12.b).
Figure 4.11: Backside view of a 4-stage pump (exaggerated) with vertical support structures added (left), and trench layout (with proper fluidic paths) to realize such structures (right).

91
For (4), the doping process properties are to be considered: the impurity concentration
of the doped silicon depends on the amount of dopant ions that (using a carrier gas,
usually N2) reach the substrate during the high temperature (usually >1000oC) diffusion
process; therefore, the doping effectiveness, and hence the doping concentration, is
reduced in the depth of the trenches, due to the narrow trench openings (Fig. 4.13). We
define the p++/p+ threshold concentration (PPTC) as the minimum dopant concentration
at which the etchant stops, e.g. PPTC = 5e19 cm-3 for EDP. We also define the p++/p+
threshold depth, or PPTD (not to be confused with the trench depth) as the maximum
depth of doped silicon for which the doping concentration is above PPTC. If doping is
considered a two-dimensional process, PPTD can be interpreted either vertically or
laterally, and hence two other parameters, vertical p++/p+ threshold, or PPTV, and lateral
p++/p+ threshold, or PPTL, can also be defined.
Figure 4.13: Conceptual diagram, showing PPTV, PPTL and PPTD, for a given PPTC, oxide mask, and trench depth and opening (not to scale – in particular, the PPTV(y) inside the trench is exaggerated).
Figure 4.12: a) Trench opening not pinched, due to insufficient thickness of the refill material, and b) void at the trench bottom, due to reduced deposition rate of the refill material inside the trench.

92
For different doping times at 1175oC, Table 4.4 (resulted from HCP process
characterization) shows the corresponding PPTL (vs. mask opening) and PPTV (vs.
trench depth) when EDP used as the etchant (PPTC = 5e19 cm-3). Since PPTD, both at
the top and bottom of a trench, increases as a function of doping time, hence a longer
doping time increases the minimum wall thickness (at top and bottom of the trench) and
result in a stronger vertical stiffener. However, a longer doping time would also results in
a larger lateral diffusion at the wafer surface, and hence, the doping time is limited by
electrode hole dimensions. As a result, for (4), the doping process must guarantee that the
entire trench is doped above the PPTC of EDP, while the electrodes are also doped
properly, i.e. the doping process must guarantee that the PPTV is a positive value for the
entire trench depth, while PPTL is well below the electrode hole dimensions. Two
examples of insufficient and sufficient doping concentrations at the bottom of released
trenches are shown in Fig. 4.14: for insufficient concentration the doped silicon wall is
partially dissolved in EDP (indicating a longer doping time needed for a successful
release); while the wall survives the EDP process, when the doping time is long enough.
Table 4.4: Effect of trench depth on PPTV and mask opening on PPTL, for different doping times, when EDP used as the etchant (PPTC = 5e19 cm-3).
Doping time at 1175oC (min) → 45 180 360
PPTV at Different Trench Depths w/ 5um
Opening
PPTV (m) at Surface: 4.5 7.8 14.6
PPTV (m) at 50 m: 2.4 5.6 12.5
PPTV (m) at 100 m: 1.3 3.5 7.4
PPTV (m) at 150 m: <1 1.5 4.2
Surface PPTL and PPTV for Different
Mask Openings
PPTL (m) and PPTV (m) for 5 m: 2.1 and 3.1 2.5 and 5.4 5.1 and 10.5
PPTL (m) and PPTV (m) for 10 m: 2.3 and 4.1 3.1 and 7.3 6.5 and 13.8
PPTL (m) and PPTV (m) for 15 m: 2.3 and 4.4 3.1 and 7.7 6.5 and 14.5
PPTL (m) and PPTV (m) for 20 m: 2.3 and 4.5 3.1 and 7.8 6.5 and 15.0

93
Based on the finalized design parameters (Table 3.3) and obtained characterization
data (Table 4.4), and flatness of the released devices, PPTV at the wafer’s surface was
chosen to be 8 m (3.2 hrs of doping at 1175oC), which would give 3.2 m of PPTL for
electrode areas, so the thermal oxide mask opening for a 20 m electrode hole should be
~26.5 m. Also the trench depths were set to range from 60 m to 100 m (note that if
the cavity height is below this value, e.g. 40 m, bottom “height compensating” pillows
should be used, as previously shown in Fig. 4.8).
Figure 4.14: Shallow boron doping (45 min at 1175oC): vertical stiffeners partially dissolved in EDP, due to insufficient boron concentration at the bottom of trenches (top), and deep boron doping (6 hrs at 1175oC): vertical stiffeners survive the EDP etch (bottom.)

94
A specific DRIE process recipe has been developed on STS Pegasus DRIE tools,
which provides smooth side-walls, minimum “neck” at top of the trench (see Fig. 4.12.a),
good uniformity across the wafer, and slight trench width reduction for deep etches. Note
that the fact that trench width reduction cannot be canceled for a deep trench etching is
not quite unsatisfactory, since the deposition rate of the refill material also reduces deep
down the trench. Indeed, a proper selection of trench width reduction to match the
LPCVD deposition rate reduction helps minimize “void” formation inside the trench, as
shown in Fig. 4.15. The etch recipe achieved an etch rate of 12 m/min for 5 m trench
opening and ~30% exposed area, and <10% non-uniformity across the wafer.
In order to provide better structural support, the number of vertical stiffeners can be
increased to two or three trench lines, as shown in Fig. 4.16. Although this would result
in a better flatness, yet a stronger device frame is needed to accommodate the packaging
technique described in Section 4.2.4. Therefore, to improve structural properties of the
device frame, we add a trench grid in the device “field” areas (i.e. areas without any
membrane), as shown in Fig. 4.17.a. If the trench grid is aligned with the <110> crystal
line (Fig. 4.17.b), then a great portion of bulk silicon will be saved from the DWP once
the etchant hits (111) crystal planes.
Figure 4.15: Results of the developed a “neck-free” etch recipe on STS Pegasus DRIE tools, which gives a 15% width reduction for AR = 15 (left), and the resulted refilled trench bottom (right).

95
Provided with a reasonable alignment with the <110> line, the height of the “trapped”
bulk silicon (shown in Fig. 4.17) for a given trench spacing Str can be calculated as:
hblk htr Str
2cot(54.7)
Figure 4.16: Snapshot of the honeycomb trench layout with different number of lines.
Figure 4.17: a) Top view of a trench grid aligned with <110> line, (b) cross-section along of the same grid along A-A, upon doping, refilling and release – the bulk silicon “trapped” by (111) planes.
Figure 4.18: Refilled doped trench grid with 5 m opening, 25 m spacing and 85 m depth; 45o view (left), and side view (right).
(5.1)

96
4.3.2. Large Membrane Release Technique by Poly-Si Trapping
In order to release freestanding membranes and their corresponding actuating
electrodes, using surface micromachining with poly-silicon as the sacrificial layer, three
different approaches can be pursued when patterning the poly-silicon layer:
1) Island Poly-Si: Complete removal of the poly-silicon layer except for some
“islands” on top of the electrodes, and under “to be made” membranes.
2) Doped Poly-Si Support Rims: Creating some “support rims” by masked doping of
the poly-silicon layer, except for the membrane areas.
3) Poly-Si Trapping: Etching a very narrow ring around the membrane and let the O-
N-O deposition “trap” the poly-silicon layer in the field areas that are not exposed
to the etchant (the etchant attacks the poly-silicon layer through electrode holes).
All three approaches are shown in Fig. 4.19, both form the top and side views. While
the first approach failed due to the high stress of deposited O-N-O, the second approach
would require an extra thermal oxidation and lithography step and was considered too
complex to pursue. Moreover, the second approach goes beyond the thermal budget of
the process, since after the first doping and poly-silicon deposition, any high temperature
(>1000oC) step must be avoided, since it could dilute the doped electrode and cause
dopants to migrate to the sacrificial poly-Si layer. The third option, however, requires no
extra processing or masking step, and only relies on the mask design for poly-Si.
Figure 4.19: Island Poly-Si (left), Doped Poly-Si support rims (middle), and Poly-Si Trapping (right)
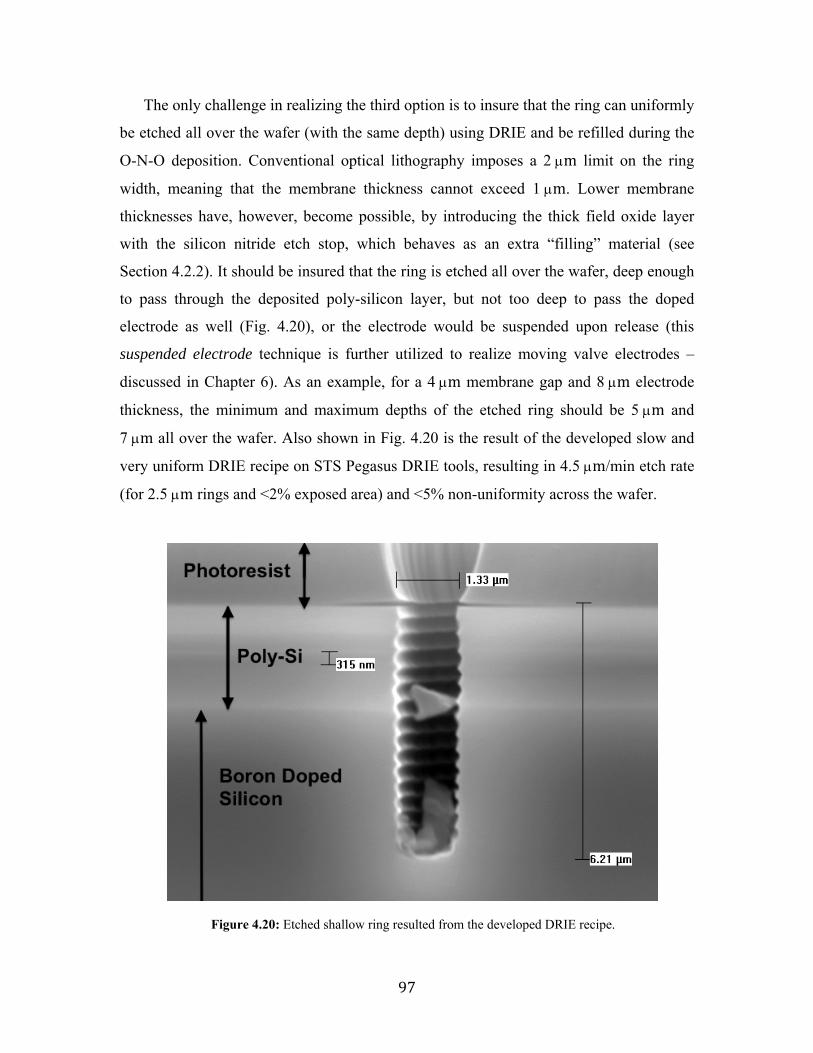
97
The only challenge in realizing the third option is to insure that the ring can uniformly
be etched all over the wafer (with the same depth) using DRIE and be refilled during the
O-N-O deposition. Conventional optical lithography imposes a 2 m limit on the ring
width, meaning that the membrane thickness cannot exceed 1 m. Lower membrane
thicknesses have, however, become possible, by introducing the thick field oxide layer
with the silicon nitride etch stop, which behaves as an extra “filling” material (see
Section 4.2.2). It should be insured that the ring is etched all over the wafer, deep enough
to pass through the deposited poly-silicon layer, but not too deep to pass the doped
electrode as well (Fig. 4.20), or the electrode would be suspended upon release (this
suspended electrode technique is further utilized to realize moving valve electrodes –
discussed in Chapter 6). As an example, for a 4 m membrane gap and 8 m electrode
thickness, the minimum and maximum depths of the etched ring should be 5 m and
7 m all over the wafer. Also shown in Fig. 4.20 is the result of the developed slow and
very uniform DRIE recipe on STS Pegasus DRIE tools, resulting in 4.5 m/min etch rate
(for 2.5 m rings and <2% exposed area) and <5% non-uniformity across the wafer.
Figure 4.20: Etched shallow ring resulted from the developed DRIE recipe.

98
4.3.3. Stress Control of Highly Stressed Stacked Thin Films
As discussed in previous sections, the all silicon microfabrication technique for
Module A results in a stack of several highly stressed thin films (Fig. 4.21), mostly due to
consecutive high temperature deposition steps. Since all the depositions (except for metal
sputtering) occur conformally on both sides of the wafer, only a negligible bowing is
observed prior to device release, but once the device is released, curling might happen, as
seen in Fig. 4.10. While introduction of vertical stiffeners (Section 4.3.1) provides totally
flat devices, it should be noted that the frames of all devices are still under tension, due to
all layers being tensile. This might result in fragile frames and more importantly, affects
the membrane’s flatness, unless the stress of all films are either reduced or compensated.
We introduced the compressive field oxide layer in Section 4.2.2 for stress
compensation (as well as improving insulation, membrane thickness range and wafer
handling) of the device frame. However, since all other layers are highly under tension, a
very thick filled-oxide might be needed for stress compensation, the total thickness of
which may be well above typical LPCVD oxide thickness limits (usually <2 m). For
example, for Fig. 4.21, a >2 m thick oxide compensation layer is needed, which is
definitely not feasible. This indicates stress of some of the films should be reduced in
order to realize a low-stress final device frame, which is necessary to pressure membrane
properties. It should be noted that since the whole purpose of this compensation is
preserving membrane properties by keeping the frame stress-free, we do not consider any
of the films involved in membrane fabrication for stress reduction. This leaves only the
boron-doped silicon and poly-silicon.
Figure 4.21: Cross-sectional view of deposited thin films at membrane edge, with stress values shown

99
The stress of boron-doped silicon results from introduction of high concentration
(>1e19 cm-3) smaller boron atoms in larger silicon lattice, and cannot easily be
manipulated, unless the doping concentration is changed. The stress of the poly-silicon
layer can however be reduced by proper high temperature annealing of the film. Such
annealing is also important from a process standpoint, since the poly-Si deposition is
followed by two high-temperature (up to 850oC) steps of O-N-O and N-O depositions,
which can alter the poly-Si film stress during the process. As a result, the minimum
annealing temperature should be set to 850oC. We saw in the previous section that the
thermal budget of the process does not allow temperatures higher than 1000oC, resulting
in an almost narrow temperature range for annealing (~900oC), making the annealing
time the only process variable.
An N2 annealing process at 950oC has been developed to support this purpose, as seen
Fig. 4.22: while no annealing results in a final stress of 100 MPa (c), with proper
annealing the poly-Si film stress can be reduced to <15 MPa (a). It is interesting that if
the annealing is carried out after the LPCVD O-N-O, the poly-Si stress cannot be reduced
below 50 MPa (b), indicating the importance of having a separate annealing step.
Figure 4.22: Poly-Si film stress at different points of the process; at 2400 Å thickness, at 19200Å thickness, upon 45 min of N2
annealing at 950oC, and upon natural annealing during O-N-O deposition: a) Separate annealing step prior O-N-O, b) Separate annealing step after O-N-O, c) No separate annealing step practiced. (Three monitor wafers used in each case)

100
4.3.4. Spin-on Packaging Technology by Polymer Reflow
Introduction of vertical stiffeners for structural property improvement after device
Gen. 1.2, inspired utilizing such structures to define the fluidic channels and pump
cavities, as well, as shown in Fig 4.11. The first attempt was spinning PDMS on a glass
slide and sealing the channels by “dropping” the device on it while it is still wet, followed
by curing the PDMS by baking, as shown in Fig. 4.25. The same approach could be
pursued for patterned bottom glass pieces with volume compensating “pillows” and top
glass pieces with pumping cavities. The use of “wet” polymer (i.e. PDMS) however
makes the alignment a bit challenging, despite high alignment tolerance (~100 m). This
is mostly because once the device is placed on the glass piece containing uncured PDMS,
it cannot be moved for fine alignment or alignment correction. Moreover, curing PDMS
introduces a great amount of evaporated solvent, which may contaminate the membranes,
and also controlling the PDMS reflow proved to be challeinig (Fig. 4.26).
Another approach would be using pre-cured “dry” polymers that can be spun-on and
also can slightly be reflowed on the substrate by heating. Most thick photoresists may be
used for this purpose, however, only negative resists (that can be exposed to achieve
ultimate strength) are preferred; otherwise, continuous property shift and outgassing
occurs due to un-crosslinked polymer chains. Moreover, most conventional thick positive
resists are too expensive and are not completely transparent for desired visual and optical
device inspection and testing. SU-8, as a negative, transparent (in the visible light range)
and epoxy-based PR is, however, a great match for this application, as it combines spin-
Figure 4.25: backside view of a 24-stage micropump (Gen. 1.8) placed on a glass slide with spun-on PDMS and cured (left), and close-up of the sealed cavity walls from backside (right).
Die
Edg
e
Valve Electrode

101
on features with negative and epoxy-based features (i.e. no outgassing and property shift)
as well as complete transparency.
The process flow for assembly/packaging using SU-8 as the spin-on sealant is as
follows: the bottom and top glass pieces (Fig. 4.7) are diced first, followed by spinning
SU-8-2010 at 4 krpm for 30 sec (resulting in ~10 m) and a short soft bake (<2 min) at
95oC. Next, Module A is sandwiched between and aligned to Module B by manual
optical alignment (since the features and tolerance are large, no aligner needed), and the
whole stack is heated up at 100oC briefly (<2 min) while slight force is applied using
tweezers, to reflow the SU-8 and seal the cavities. UV exposure and post exposure bake
follow to cure the polymer and prevent its properties from shifting over time. Fig. 4.27
shows resulted sealed cavities of a 24-stage pump. In order to achieve optimum sealing,
the first and second bake times, as well as the UV exposure dose should be optimized..
Figure 4.26: Backside of devices with trench grid, packaged using PDMS (left), and SU-8 (right).
Figure 4.27: Oblique view of sealed cavities using SU-8, where the polymer reflow lines and glass cavity lines can be seen (left), close-up of the same device to show the polymer (right).

102
4.4. SUMMARY OF MICROFABRICATION RESULTS
4.4.1. Final Device Layout and Dimensions
To insure high fabrication reliability, it is tried to provide large alignment tolerances
between different layers, regardless of the minimum feature size of each layer. As a
result, only two critical alignments, “membrane to electrode” and “metal to membrane”
are needed, while all other alignments have a tolerance of above 50 m. Table 4.5
summarizes the minimum feature size of each layer, as well as its alignment tolerance
with respect to the previous layer. Fig. 4.29 shows snapshots of different device layers,
for the fabricated single valve structure, shown in Fig. 4.28. Despite simplicity, the single
valve structure sets a very good example for studying the modular fabrication technology
characteristics, as it requires all the fabrication steps and layout componenets used in
realization of larger devices (4-, 12- and 24-stage).
Table 4.5: Final device layout characteristics
Mask Name Min Feature
Size (m) Alignment Tolerance
w/ Previous Layer (m) Patterned
Layer Etch Depth
(m) B-Dope 10 N.A. Thermal Oxide 1.2
Trench Grid 5 >50 Bulk Si 80
Poly-Si Ring 2.5 >50 Poly-Si 6
Field Oxide 100 >50 N-O 2.5
Membrane 10 <5 O-N-O 1.5
Metal 10 <5 Cr-Au 0.45
Figure 4.28: Fabricated single valve structure: front side (left), and backside (right) views.

103
Figure 4.29: Layout snapshots of a microvalve die: B-Dope (top left), Trench Grid (top right), Poly-Si (middle left), Field Oxide (middle right), Membrane (bottom left), and Metal (bottom right).

104
4.4.2. Final Device Microfabrication Statistics
Table 4.6: Final Fabrication Statistics for Different Device Generations of Module A
* device fabrication still ongoing. 4.4.3 Summarized HCP Technology Evolution (2009-13)
The finalized HCP process has resulted from a series of 17 process generations for
Module A, 15 of which been fabricated during technology development. Major layout
modifications are numbered as major process generations, while minor changes in the
layout (usually one or two masks) are numbered as minor process generations. Every
process generation has a (not necessarily unique) process generation for Module B, the
total number of which is 8. Three major challenges have been addressed during
technology development: membrane release (addressed by the rings), frame stiffening
(addressed by the vertical stiffener), and packaging (addressed by the spin-on polymer).
Gen. 3.0 resulted in the first fully fabricated and packaged device that could be tested,
while Gens. 3.1 and 3.4 produced the first significant flow and pressure readings. Table
4.7 summarizes all the layout generations (major and minor) for Module A as well as
their corresponding layout generations for Module B. Main challenges, improvements
and pumping results have also been listed in the table. Also shown in Fig. 4.30 are the
photograph and layout snapshots of the full 4” wafer of all three major generations.
HCP Gen. → 1.1 1.2 1.3 1.4 1.5 1.7 1.8 1.9 2.0 2.1 3.0 3.1 3.2 3.3 3.4*
Number /Percent of ↓ Fabrication
Runs 3 1 1 1 1 3 2 1 2 1 2 1 2 1 2*
Processed Wafers
12 6 4 4 5 10 7 2 8 4 8 4 9 2 9*
Finished Wafers
7 5 2 3 3 8 5 2 6 3 7 4 8 1 6*
Released Wafers
5 3 2 2 2 6 5 2 6 3 7 3 8 1 4*
Survived Frames
< 5%
> 50%
> 30%
> 60%
> 70%
> 70%
> 80%
< 20%
< 20%
< 10%
< 20%
> 95%
> 99%
> 99%
> 99%
Survived Membranes
0 0 0 0 0 >
50% >
50% <
10% <
20% <
20% >
50% >
90% >
95% >
95% >
95% Survived Devices
0 0 0 0 0 >
25% >
30% <
5% <
5% <
5% <
20% >
80% >
90% >
90% >
90% Packaged Devices
0 0 0 0 0 7 15 0 0 0 4 9 41 6 22*

105
Table 4.7: Summary of microfabrication technology evolution (Apr’09 to Apr’13).
Layout Gen. #
HCP-R Gen. #
# of Masks
HCP-C Gen. # (+ # of extra masks)
Process Date (# of Runs)
Modifications w/r/t Previous Generation
Results w/r/t Previous Generation (pros: +, cons: -)
1.x
1.0 8
1.0 (+4) (4 new) Description: Bottom and top cavities fabricated out of PDMS, w/ SU-8 or Si molds, which proved to be too hard to align and challenging to remove once placed (sticky), although the sealing was not even satisfactory.
Not Fabricated (proposed only)
N. A. N. A.
1.1 6 (6 new)
Apr’09 – Aug’09 (3)
Poly-Si membrane replaced w/ ONO (2 masks saved, but dual electrodes not possible anymore)
Devices severely curved (-) Released membranes came off (-) Valve membranes not released (-) Micro-cracks on doped areas (-)
1.2 7 (1 new)
Aug’09 – Nov’09 (1)
Vertical stiffeners added (etched before DeepB), Poly-Si electrode
Absolutely no curving (+) Released membranes came off (-) Valve membranes not released (-) Micro-cracks on doped areas (-)
1.3 6
Vertical stiffeners added (etched before ShallowB), w/ Ins-Ox mask canceled
Negligible curving (+) Released membranes came off (-) Valve membranes not released (-) Micro-cracks on doped areas (-)
1.4 7 Vertical stiffeners added (etched before Ins-Ox)
Fragile devices (-) Released membranes came off (-) Valve membranes not released (-) Micro-cracks on doped areas (-)
1.5 8 (2 new)
Nov’09 – Jan’10 (1)
Based on G1.2, but w refill material stripped (SCS membranes) and holes on valve electrode redesigned
Absolutely no curving (+) All membrane released (+) Released membranes came off (-) Sever micro-cracking (-)
1.6 8 Not Fabricated (proposed only as a backup plan)
Based on G1.5, but w/ a new surface u-machining (poly-Si trapping)
N. A.
1.7 7 (or 6 w/o NtOx) (2 new)
Feb’10 – Jun’10 (3)
Based on G1.3, but w/ a new surface u-machining (poly-Si trapping) and stress control (NtOx) layer
Negligible curving (+) All membrane releases (+) Membranes survived the DWP (+) No cracking (+)
1.8 6 (or 5 w/o NtOx)
2.0 (no masks) Spin-on PDMS
Jun’10 – Jul’10 (2)
Based on G1.7, but w/o DeepB step
Same as G1.7, but: Simpler (+) and A bit fragile (-)
1.9 7 (1 new)
1.9 (+2) (2 new)
Jul’10 – Jul’10 (1)
Based on G1.7 but w/ full-wafer bonding (Parylene)
Parylene bonding worked (+) Paryelen NOT survived DWP (-)
2.x 2.0 7 (7 new)
2.1 (+2) (2 new) PDMS stamping
Sep’10 – Dec’10 (2)
Cables modified, Shapes modified, VCR added, Pirani gauges added,
Fragile devices (-) Poor stress control (-) Stamping failed (-)
2.1 8 (1 new)
2.0 (no masks) Spin-on PDMS
Nov’10 – Dec’10 (1)
Emergency solution: top vertical structures plated w/ an insulation PECVD oxide on top of metal
Successful plating (+) Protection Oxide NOT stripped (-) Plating came off during DWP (-) Fragile and slightly curved (-)
3.x 3.0 6 (6 new)
3.0 (+1) (1 new) PDMS stamping
Feb’11 – Apr’11 (2)
Trenches replaced by trench grids (denser and supposedly much stronger) Cables removed, Pirani gauges removed, Totally new device shapes, Frame: full wafer release,
Refill poly attacked, (except on 1 wafer) due to small margin (-) The ONLY survived wafer generated many devices (+) Wafer bowing observed during process (difficult litho) (-) but released devices are flat (+)
3.1 6 3.1 (+1) Reflow of curable spin-on adhesives (SU-8) and bond then expose
Apr’11 – Sep’11 (1)
Tried to solve in-process bowing by backside dummy trench etch/refill
First fully packaged/testable device realized (++) Bowing resolved (+) Valve buckling observed (-)
3.2 6 (1 new)
Sep’11 – Jan’12 (2)
Increased the OxNt margin for safer release, Valve electrodes modified,
Reached >95% process yield (+) Valve buckling “reduced” (+), but still slightly bowed down (-)
3.3 6 (1 new)
Feb’12 – Mar’12 (1)
Introduced smaller valves for reduced valve-pumping
Valves not actuated (-)
3.4 7 (1 new)
3.2 (+2) Bottom volume compensating “pillows” added
Oct’12 – Jan’13 (2)
Based on Gen. 3.2, but w/ smaller valve gaps, and balanced/symmetric pumping cavity height.
First pressure readout! (+++) Moving valves observed (+/-) Valve-Only pumping realized (+)

106
Figure 4.30: Full wafer view (left) and layout snapshots (right) of major device generations for Module A: Gens 1.x (top), 2.x (middle), and 3.x (bottom).

107
4.5. MANUFACTURABILITY AND BROADER IMPACTS
As covered throughout the chapter, the developed modular fabrication process, along
with the supporting technologies, is capable of realizing a scalable multistage gas
micropump for high differential pressure applications. A discussion on broader impacts
of this process and its manufacturability for other research or industrial applications can
provide a better picture of the true capabilities of the developed process and its
limitations. The following subsections discuss manufacturability and broader impacts of
each of the several developed technologies. Several application examples are given and
comparison with available technologies is provided.
4.5.1. Process Modularity
Dividing fabrication of the device into a number of process modules that can be
assembled during device packaging benefits a variety of applications from several points
of view, two of which can be listed as:
- Feasibility: fabrication of many complex devices that would require several
microfabrication steps can be simplified by grouping the steps that need similar
process technologies as separate fabrication modules. For example, in the
Honeycomb Pump process technology, membranes and electrodes can be
realized by thin-film microfabrication, while the cavities need 3-D vertical
processing. Moreover, membrane and electrodes are active device components,
as they need to be actuated, and hence need electrical connections and
movability, while the cavities are passive solid pieces. The impact is more
significant when unconventional thin film technologies, e.g. PZT and AlN, are
used (as it is common in several acoustic applications such as micro-speakers
and microphones), since some fabrication steps would require totally different
process tools that might even be in separate fabrication facilities. In case of the
micropump, this can also be seen in the device scalability, since without
separating the fabrication of different device modules, volume ratio could not be
changed from stage to stage, and hence, a scalable pump would not be possible.

108
- Characterization and Testability: when different device components are
fabricated as separate process modules, each can be tested before the final
assembly. This is specifically important in many acoustic applications, such as
micropumps and micro-speakers, since for a better performance the resonant
frequency of the moving part (membrane) should match the resonant frequency
of the passive part (cavities). Testing different process components prior to final
assembly of modules also allows elimination of damaged or improperly
fabricated parts, and only assembling and package good parts.
Several other parameters that are of high interest in manufacturing, including process
cost, yield and reliability are directly impacted by the above two factors. For example an
improved reliability is directly resulted from testability and an improved yield is directly
resulted from process simplicity. Both benefit the process cost. There are also other
aspects of a modular process, mostly from industrial point of view, that improve process
cost, yield and reliability. An example would be the capability of parallel manufacturing
of different device modules, which can reduce process cost and improve the yield.
4.5.2. Stress Control
As discussed in the earlier sections, stress control has been one of the biggest
challenges addressed in the micropump fabrication, since the membrane-electrode
module consists of overly large but relatively thin structures that are required to be highly
stressed at membrane areas for high frequency actuation, but stress-free in device frame
areas to ensure a flat device structure. Two techniques, high temperature annealing of
trapped poly-Silicon films, as well as using a stress compensating field oxide layer, have
been implemented in parallel to ensure a good stress control. Both techniques are
important from manufacturing point of view. The first can be utilized in manufacturing of
devices with thick deposited poly-Silicon films, e.g. comb drive actuators and ring
gyroscopes [6, 7], while the latter can be utilized in manufacturing of devices with
stacked thin films, e.g. neural probes [10]. The field oxide layer also provides several
other benefits, including protecting the device surface from physical damage and higher
electrical insulation, which impact the reliability of fabricated devices as well.

109
4.5.3. Single Electrode Actuation
Actuating a membrane using two electrodes, symmetrically placed on both its sides,
is attractive from several standpoints, mainly the capability of membrane actuation at off-
resonance. If a packaged membrane (as it is the case in the micropumps) can be actuated
at off resonance, no cavity resonance considerations would be needed in developing the
device, since the membrane can be actuated over a wide range of signal frequencies. This
enables application of low stress thin films [2], and also significantly reduces membrane
fatigue issues. All the advantages of “pull-pull” actuation are sacrificed in the single
electrode-actuation case, however, a much simpler process, an easier actuation and
control, and significantly improved characterization capability, are resulted instead. The
impact of each case can be summarized as follows:
- Simple Fabrication Process: in case of the Michigan Pump, dual electrode
actuation needs an accurate alignment between holes of the perforated
electrodes to provide checkerboard microvalves capable of good sealing.
Multiple thin film depositions (to form the top electrode using surface
micromachining) or electroplating [6] cause device complexity with good
alignment. Techniques such as wafer bonding [1] suffer from both complexity
and poor alignment between electrodes. The process complexity of dual
electrode actuation is not limited to the case of Michigan Pump, as any other
device with in-plane dual electrode actuation would require a complex
fabrication for alignment, membrane insulation and the additional fabrication
steps for the top electrode.
- Easy Actuation: dual electrode actuation requires two DC signals for each
electrode and an alternating signal to be applied to the membrane. Not only does
this require more number of signals, but also it causes charge accumulation
issues, as reported in [11]. With single electrode actuation, DC signals can be
eliminated and the membrane can be grounded, which significantly simplifies
the setup and also eliminates any charge accumulation possibility.

110
- Improved Characterization Capability: when two electrodes are used on both
sides of the actuated membrane, no further optical characterization of the
membrane would be possible due to the opaque electrodes. In most cases the
membrane could not even be seen, since electrode perforation is only to reduce
the damping, while the number of holes and their sizes are minimized to ensure
a larger electrostatic actuation force. In contrast, single electrode actuation
provides optical characterization capability from above, which is of paramount
importance in device manufacturability: membranes can quickly be investigated
upon release and any device containing a broken membrane(s) can be eliminated
from packaging, resulting in a higher yield, device reliability and reduced cost.
Mechanical tests using probe tips, as well as more advanced testing such as laser
vibrometer testing for resonant frequency measurements can also be performed.
If a transparent package is provided, the optical tests can even be performed
after device packaging.
4.5.4. Poly-Silicon Trapping
Poly-silicon trapping provides the possibility of utilizing a poly-silicon layer both as a
filler and as a sacrificial layer. This can save a large amount of fabrication cost in devices
that require thick layers of poly-silicon to be deposited, since LPCVD deposition rates are
typically <100 Å/min. More importantly, poly-silicon patterning can be done in a very
simple process that only requires a narrow ring to be etched around the membrane (Fig.
4.19). Finally, when membranes are released using poly-silicon trapping, all membrane
features can accurately be aligned to the bottom electrode, which is applicable whenever
perforated membranes and perforated electrodes are required.
There are a number of disadvantages involved in this method too, mainly controlling
the residual stress of the trapped poly-silicon layer. Since thick layers of poly-silicon are
needed for most large-stroke electrostatic actuators (e.g. micro-speakers and
micropumps), even with annealed poly-silicon layers, the released device would suffer
from a high tensile or compressive stress (depending on the type of LPCVD poly-silicon

111
and annealing). This can either be addressed by stress compensating layers (as described
in Section 4.3.3), or by using thicker device frames, such as bossed silicon [12].
4.5.5. Vertical Stiffeners
Vertical stiffener technology, realized by trench etching, doping and refill can benefit
several large thin-film device applications, since most of the process steps (i.e. doping
and refill) are already part of the final device fabrication, and no further processing,
except for trench etch, is required. The flexibility of controlling the trench depth and
spacing, as discussed in Section 4.3.1, enables 3-D devices using thin film deposition.
The features that are specifically important in process manufacturability are:
- Flexibility on Membrane Shape: while creating bossed silicon frames using
DWP and (111) crystal planes (see [12]) is limited to square membranes and
electrodes, when vertical stiffening using trench doping and refill is used, all
membrane shapes, including hexagonal and circular would be possible, which
broadens the application that can benefit from this technology.
- Flexibility on Device Thickness: the final device thickness in most fabrication
processes is limited to the thickness of the starting substrate. In some cases,
expensive processes such as silicon on insulator (SOI) are used to achieve
devices with reduced thickness. While traditional DWP provides devices with
thicknesses limited to the PPTD (see Section 4.3.1), the trench refill process
offers a wide range of device thicknesses, from 10 m to 150 m, as
summarized in Table 4.4. This enables fabrication of a wide range of devices for
different applications, when the device frame thickness is a concern.
4.5.6. All-Silicon Fabrication Technology
As the fundamental material of microelectronic devices, silicon has been the main
focus of the IC industry in the past half a century. All-silicon MEMS devices benefit
from developed standard IC fabrication technologies, as well as monolithic integration
capability with the circuitry and other system components. Moreover, all-silicon devices
can be fabricated at very low cost and high reliability, mainly due to the parallel

112
processing capability: almost all high-temperature process steps, such as doping,
oxidation and LPCVD, are realized by horizontal tube furnaces, capable of processing
hundreds of silicon wafers at once. This reduces the process cost significantly, while also
provides extremely high substrate-to-substrate process reliability. Even non-industrial
fabrication facilities, such as the LNF at the University of Michigan, easily provide up to
95% process uniformity.
4.5.7. Spin-on Packaging Technology
With the transparent package and flexibility on adhesive thickness control, the spin-
on packaging technology provides several features both from prototyping standpoint and
industrial manufacturability. While the process can be done manually at device level for
fast prototyping purposes, commercialization is also possible if automated device
assembly process tools are developed specifically for this process. In summary the
developed process can be used as a fast, very low cost and easy to control packaging
method, with the following features:
- Transparent Package: it offers optical device testing and characterization
capability, the benefits of which have been summarized in Section 4.5.3. Visual
investigation as well as advanced tests, such as laser vibrometer resonant
frequency measurements and stroboscopic motion recording, are possible. It
should be noted that this capability also needs single electrode actuation for full
visibility. Another important feature provided by the transparent package is the
capability of aligning different device modules without the need for
conventional bond-aligners, which is very useful for prototyping applications in
research and development. As the main assembly and packaging part of the
modular process technology, spin-on packaging also provides very high
alignment tolerance (up to 100 m) due to separation of sensitive and insensitive
device modules. This high tolerance also enables mechanical alignments, using
jigs or recessed assembly frames.
- Adhesive Material Features: choice of SU-8, as a negative, transparent (in the
visible light range) and epoxy-based PR enables easy alignment and thickness

113
control, since it combines spin-on features with negative and epoxy-based
features (i.e. no outgassing and property shift) as well as complete transparency.
The spin-on packaging also suffers from a number of shortcomings, mainly
controlling the amount of SU-8 reflow. Although this has been controlled for plain glass
pieces (Fig 4.26), when patterned glasses are used controlling the reflow is somewhat
challenging (Fig. 4.27).

114
4.6. References
[1] H. Kim, A. Astle, K. Najafi, L. Bernal and P. Washabaugh, "A fully integrated high- efficiency peristaltic 18-stage gas micropump with active microvalves," in Proceedings of MEMS 2007, Kobe, Japan, 2007.
[2] H. S. Kim, K. Najafi, P. D. Washabaugh, and L. P. Bernal, "Large- deflection out-of-plane electrostatic buckled-electrode actuator," The 12th International Conference on Solid State Sensors, Actuators, and Microsystems (Transducers '03), Boston, MA, USA, pp. 794-797, 2003.
[3] H. S. Kim and K. Najafi, "Wafer bonding using Parylene and wafer- level transfer of free-standing Parylene membranes," Transducers '03, Boston, MA, USA, pp. 790-793, 2003.
[4] H. Kim and K. Najafi, "Characterization of a low-temperature wafer bonding using thin film Parylene," IEEE Journal of Microelectromechanical Systems, vol. 14, no. 6, pp. 1347- 1355, 2005.
[5] A. Besharatian, K. Kumar, Rebecca L. Peterson, K. Najafi and L. Bernal, “A Scalable, Modular, Multi-Stage, Peristaltic, Electrostatic Gas Micro-Pump,” in Proc. MEMS’12, Paris, France, Feb’11.
[6] S. Y. Yee, R. L. Peterson, L. P. Bernal and K. Najafi, "High-frequency Large-deflection Electrostatic Diaphragm Actuators with Maximized Volume Displacement," in Solid-State Sensors, Actuators, & Microsystems Workshop, Hilton Head Island, SC, 2012.
[7] Ayazi F and Najafi 2001 A HARPSS polysilicon vibrating ring gyroscope J. Microelectromech. syst. 10 169-79
[8] F. Ayazi and K. Najafi, “High aspect-ratio combined poly and single-crystal silicon (HARPSS) MEMS technology,” IEEE Journal of Microelectromechanical Systems, Vol. 9, pp. 288-294, Sept. 2000.
[9] N. Yazdi, R. Najafi, “An All-Silicon Single-Wafer Micro-g Accelerometer with a Combined Surface and Bulk Micromaching Process”, .I of MEMS, Vol. 9, pp.544-550 2000
[10] K. D. Wise, D. J. Anderson, J. F. Hetke, D. R. Kipke, and K. Najafi, “Wireless implantable microsystems: High-density electronic interfaces to the nervous system,” Proc. IEEE, vol. 92, pp. 76–97, Jan. 2004.
[11] H. Kim, “An integrated electrostatic peristaltic gas micropump with active microvalves,” Ph.D. thesis, University of Michigan, Ann Arbor, MI, 2006.
[12] A.V. Chavan, K.D. Wise, “A monolithic fully-integrated vacuum-sealed CMOS pressure sensor” in Proceedings of Transducers 2002.

115
CHAPTER 5
MICROPUMP TESTING AND EXPERIMENTAL
RESULTS
Throughout this chapter, characterization and testing of the microfabricated Scalable
Michigan Pump is presented in detail. Different testing methodologies are covered first,
followed by introduction of all the developed setups for micropump testing as well as
computer-aided interfaces to control them. To discuss some of the obtained results, an
improved pump model, using a new 16-stage reduced order model [1-2] (based on the
original 2-stage model of Section 3.1) is presented. It should be noted that: 1) the
presented testing methodologies have been developed over a course of three years with
many different variations, but only the final setup is covered in each case, 2) most of the
micropump testing was performed with assistance of an on-campus graduate student
colleague (Karthik Kumar from Aerospace Engineering), who helped with developing the
DAQ-Card based automated test setup, attended almost all measurements and
characterization sessions, and provided the improved reduced order model, described in
[3], to interpret some of the obtained results.
5.1. OVERVIEW OF DEVICES UNDER TEST
The first successful membrane release technique was developed in Gen. 1.7 and 1.8,
but the resulting devices were only preliminarily tested for basic membrane actuation
under a probe station. No fluidic test was performed, due to challenges in obtaining good
electrical and fluidic connections, and more importantly, due to lack of proper packaging
technology. Feasible device packaging and assembly became possible by introduction of

116
the spin-on packaging technology along with Gen. 2.1, but the released membrane
modules showed poor structural properties, due to process variations and lack of a robust
stiffening method (see Table 4.7). With both the membrane-electrode module’s and
cavity-package module’s microfabrication technologies improved, and the device layout
modified, Gen. 3.0 produced the first fully packaged testable Scalable Michigan Pump,
with VVR and MPS. The pump also offered improved fluidic and electrical interfacing
methods, as well as stacking capability and greatly improved membrane release yield;
however, most of the devices were used to finalize the packaging technology and the test
setup, instead of actual device testing. Four newer generations have been developed since
then, three of which (3.1, 3.2 and 3.4) demonstrated successful pumping, as well as
secondary pumping effects. Main device design parameters for these device generations
are summarized in Table 5.1 and the devices are briefly overviewed in the following
subsections, before we present the experimental results. For a more detailed overview of
the technology evolution, see Table 4.8 and Appendix A.
Table 5.1: Summary of main devices tested (with major improvements and achievements listed)
What’s New?
HCP Gen. 3.1 (Apr’11 – Sep’11)
HCP Gen. 3.2 (Sep’11 – Jan’12)
HCP Gen. 3.4 (Oct’12 – Jan’13)
Device
1) More Devices Fabricated (more experienced – yield improved) 2) Full Wafer Release (masks #1, #3 and #4 modified) 3) Improved Sealing and Packaging (used SU-8 instead of PDMS)
1) Curved Electrode Issue Reduced (valve electrode pattern modified)
2) Improved Device Release (extended rinse and CPD used) 3) Improved Fluidic Interface (new port assembly method – wax) (new ports, tubing and connections)
1) Valve hg Smaller than Pump hg (one mask added to the process) 2) T/B Cavity Volume Balanced (compensation pillows introduced) 3) Improved Volume Ratio (cavity sizes accurately controlled)
Test Setup
Manual - Signals generated by Func. Gens - Signals synced by master-slave setup
Automated (GPIB) - Signals generated by Func. Gens - Signals synced by GPIB + Matlab
Automated (DAQ Card) - Signals generated by DAQ + Matlab (no Func. Gens used!)
Test Method
- Unipolar Signals - Improved Protection Circuit
- Bipolar Signals (no Unipolar) - Frequency Sweep - Valve Sealing/Leakage Test - Single Point LDV (LabView) - Scanning LDV (Polytec Software)
- Valve Timing Tests - Single Point LDV (Matlab) - N2-Purged Box - Two Flowmeters Used (for leak-test)
Major Issues
Device: Valve Electrodes Curved Testing: Charging, and Manual Setup
Device: Imbalanced Cavity Volume Testing: Complex and Slow Setup
Device: Fluidic Resonant Frequency and Pump Stroke Still Low
Results - Flow by ONE device (0.36sccm) [4] - No pressure accumulation
- Flow by MANY devices (0.32sccm) - Pressure by ONE device (~500Pa) - Droplet test
- Flow by MANY devices (0.30sccm) - Pressure by MANY device (4.4kPa) - Valve-Only Pumping!

117
5.1.1. HCP Gen. 3.1
Once the major fabrication issues (membrane release, frame stress and packaging)
were addressed in Gen. 3.0, a new run, with full-wafer release capability (a slight mask
modification was needed), was fabricated. Special attention was paid to device release
conditions, in particular, HNA thin down, EDP temperature, device handling and device
rinse. More importantly, the finalized SU-8 based spin-on packaging technology insured
cavity wall sealing. Many more devices (compared to Gen. 3.0) were fabricated and
tested, thanks to the improved process yield. However, the tested devices did not produce
significant results, due to curved electrodes and a poor test setup: valve electrodes (likely
due to their pattern and doping-induced stress) curved down unexpectedly, causing larger
valve gaps and hence, high (>125 V) pull-in voltage and poor valve sealing. As a result,
no pressure accumulation was achieved, and only one of the devices generated significant
flow. Some devices were damaged due to use of unipolar signals, which caused charge
accumulation on the dielectric, and its breakdown within a few seconds.
5.1.2. HCP Gen. 3.2
In this Gen, the curved electrode issue was minimized (but not completely resolved)
by redesign of valve electrode patterns. Extended rinsing time, and more importantly, use
of a critical point drier (CPD), helped in releasing stiction-free membranes with little
contamination. The test setup and methodology were significantly improved: a fully
automated test-setup was created, using GPIB and serial communication, controlled by
MATLAB. More importantly, use of bipolar signals helped eliminate dielectric
breakdown completely. A frequency sweep was implemented in the automated test setup,
to help find the flow-peak. As a result, many devices generated significant flow rate
(0.32 sccm). The membrane resonant frequency was measured before and after
packaging, using a laser vibrometer. Although membrane resonance showed a very good
match with design and theory for unpackaged devices, once packaged, all devices (except
4-stage devices) showed a much lower fluidic resonance due to damping and coupling
with the cavity. Only one of the devices generated pressure accumulations above the
pressure gauge’s noise floor, and the total pressure accumulation was only ~500 Pa.

118
5.1.3. HCP Gen. 3.4
Although Gen. 3.2 generated flow rates in the same range as designed (the same order
of magnitude), it did not produce significant pressures (two orders of magnitude lower
than designed). Since the valve sealing had been improved by reducing the curved
electrode issue, two other issues were believed to be causing the poor pressure
performance: (1) imbalanced cavity volumes (due to use of plain glass pieces, bottom
cavities ended up being larger than the top) and (2) inaccurate volume ratio (due to
imbalanced cavity volumes and also insufficient data on thickness of the packaging
adhesive). The volume ratio was set to 93%, as obtained from equation 3.7 for a target
pressure of 250 Torr. It should be noted that the cavity resonant frequency was lower than
expected in Gen. 3.2, which also suggested that cavity volumes should be reduced.
Another issue of Gen. 3.2 was valve pumping (see Chapter 6) that could be addressed by
either reducing the valve area or valve gap – both decreasing the stroke. Reducing valve
area was practiced in Gen. 3.3, but resulted in membrane frequency shift, and also very
high pull-in voltages (indeed, the valves could not seal), so valve gap reduction was tried
in Gen. 3.4, by adding a new mask to the process to create different thicknesses of poly-
Si for valves and pump membranes. These modifications resulted in significant
improvement in the pump’s pressure differential, achieving an accumulation of 4.4 kPa
by a 12-stage pump. Moreover, testing showed a higher degree of repeatability, as many
devices produced similar pumping results. The membrane resonance showed good
agreement with the design (~35 kHz). However, the cavity-induced resonance was still
below 10 kHz, resulting in reduced flow rate generation.
5.2. TESTING METHODOLOGY
In order to characterize the pump properties and study its performance, several
characterization and testing methods have been utilized, which can be divided into three
main categories: 1) membrane vibration studies, 2) fluidic performance measurements,
and 3) electrical properties measurements. All methods and obtained parameters in each
case have been listed in Table 5.2 and the methods are covered in the following sections.

119
Table 5.2: Summary of testing methodologies used for micropump performance analysis
Type Vibration
(Sec. 5.2.2 and 5.3) Fluidic
(Sec. 5.2.3, 5.2.4 and 5.4) Electrical (Sec. 5.5)
Measurement Single Point
Scanning Valve
Sealing Frequency
Sweep Vacuum
Operation Voltage
Power
Setup Based on Single Point LDV
Scanning LDV
Pressure Calibrator
Flowmeter Pressure Sensor
Flowmeter Oscilloscope
Inte
rfac
ing Fluidic None None Full Flow Only Full None None
Electrical Single Membrane
Per Pad Per Valve All Signals All Signals Per Pad All Signals
Optical Laser Laser Naked Eye Naked Eye Naked Eye Naked Eye Naked Eye
Parameters Obtained
vmax fm
fc-m
vmax dmax fm
fc-m
Vpull-in
SFn SF0
Rfluidic
Qmax tcl top
Pmax tcl top
Vpull-in
Vbk Ileakage
Po
5.2.1. Device Preparation and Interfacing
Once the device is fabricated in parts (Modules A and B) and assembled, it is
structurally complete, but still needs to be interfaced both (1) electrically and (2)
fluidically, in order to operate. Quick tests and verifications are done using probe-stations
and single probes mounted on micro-manipulators, but to perform further testing, the
necessary apparatus, fluidic ports and connections are to be developed specifically for the
Scalable Michigan Pump design and the testing methodologies used.
Electrical Connections: To standardize the electrical connections, and minimize
human error, conventional wire bonding is used to connect the device to proper electrical
signals. The device is first mounted on a custom-designed PCB (read by edge-card
connectors) with proper pads for wire bonding, and then wire bonded using 20 m
aluminum wires. The use of edge-card connectors and ribbon cables insures that fragile
aluminum wires are subject to minimum manipulation, and also enables interfacing of
several devices in a short time. It also enables easy further extension of the setup.

120
Fluidic Connections: Fluidic connections are realized using custom-made plastic
ports, capillary tubing (Polymicro), press-tight tapered glass unity connectors (Innerlock
Polymicro), and Tygon tubing (I.D. 1 mm), as shown in Fig. 5.2. A special mounting
technique by use of commercial 5-min epoxy and water-soluble low temperature wax
(Crystalbond 555 HMP) is developed. The use of wax prevents any clogging, as it is first
heated before application, then quickly solidifies as it is driven into the plastic ports by
capillary forces. Other solvent or epoxy-based adhesives take longer time to cure, and
may easily be “sucked” into the port by capillary forces and clog the port.
Figure 5.1: 4-, 12- and 24-stage micropumps, mounted and wire-bonded on custom PCBs, ready for electrical interfacing and testing (left), and close-up of wire-bonded pads (right).
Figure 5.2: Fluidic connection of the pump, using a fluidic port, made of a piece of Tygon tubing, and a capillary tubing, assembled using low temperature wax (left), and fully interfaced micropump (electrical and fluidic) ready for testing.

121
To prevent dust and particles from entering the pump and capillary tubing, a nitrogen-
purged box (Fig. 5.3), with ports for evacuation and purging, as well as vacuum-sealed
electrical connections, has been machined out of aluminum and Plexiglas. Once
evacuated and purged with nitrogen multiple times, the box will provide an inert and
particle-free sealed environment for micropump testing. The box accommodates two
Omega FLV1600 series mass flow meters for flow readout and to detect leakage during
micropump testing, and an Omega pressure gauge to measure pressure accumulation. The
transparent Plexiglas lid provides visual inspection capability and vacuum-sealed
electrical connections and ports for connection to external pressure sensors offers testing
a micropump in different vacuum pressures as well as atmospheric pressure.
5.2.2. Laser Doppler Vibrometer (LDV)
Since the pump’s performance significantly depends on the resonant frequencies of
its membranes, careful characterization of the membrane resonance properties is of
utmost importance in studying the micropump operation and in obtaining design rules for
future improvements. In particular, the Scalable Michigan Pump heavily relies on
resonance to operate (indeed, to be functional), due to single-electrode actuation (see
Section 3.3). In order to gain a full understanding of the pump’s scalability, membrane
resonance should be studied both prior to packaging (singular – uncoupled) and upon
packaging (cascaded – coupled with cavity and other membranes), as coupling and
damping effects may greatly limit the maximum number of stages that can be cascaded.
Figure 5.3: Sealed nitrogen-purged box for particle free pump testing. The box accommodates two mass flowmeters and a pressure sensor.

122
Two different systems, both based on Laser Doppler Vibrometer (LDV) are used to
perform vibration analysis on the membranes: 1) Single Point LDV (Polytec OFV303 +
OFV3001S), shown in Fig. 5.4, and 2) Scanning LDV (MSA 4500), shown in Fig 5.5.
The first system was provided by the Vibration Analysis Laboratory at Mechanical
Engineering Department of the University of Michigan, and was controlled either using
MATLAB or NI LabView, while the latter was provided by the Polytec Vibration
Laboratory, located in Dexter, Michigan. Most of the testing was performed using the on-
campus (single-point) LDV system, described below.
Figure 5.4: Block diagram of the single point LDV setup
Figure 5.5: Photo of the single point LDV setup at the Vibration Laboratory of the University of Michigan. The reflected pattern believed to be caused by membrane hole patterns (same topography as the electrode, transferred to membrane through sacrificial layer), and was used to focus the beam.
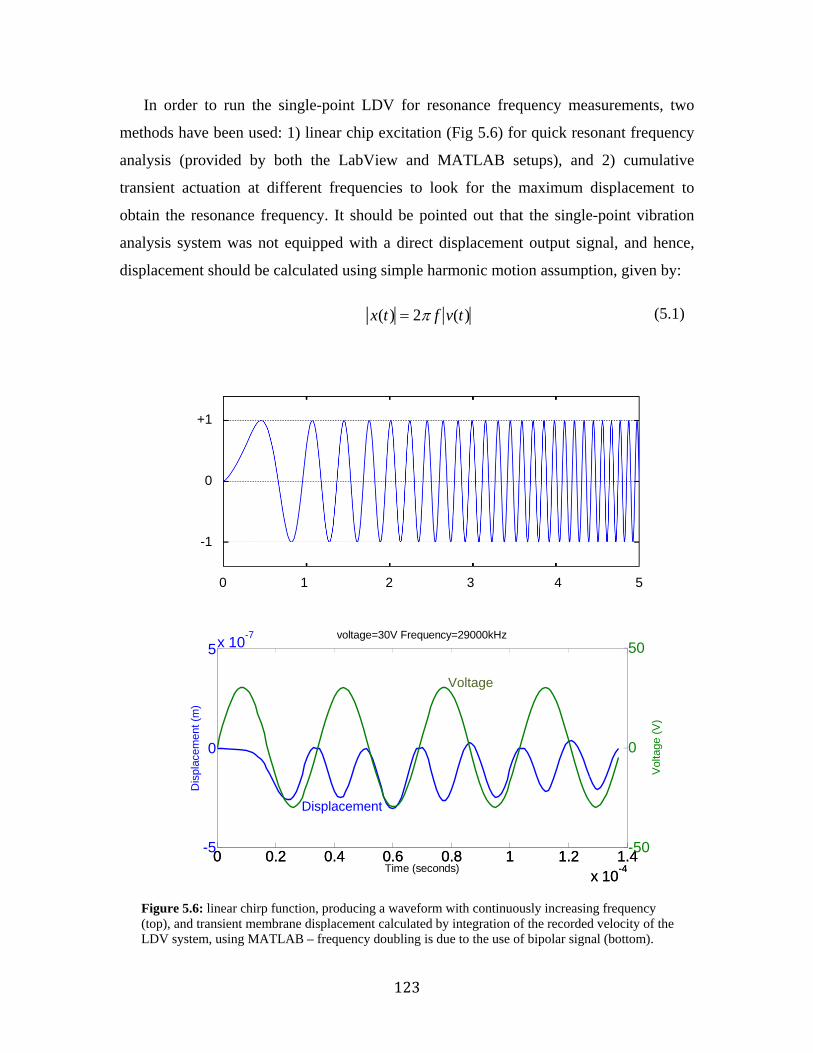
123
In order to run the single-point LDV for resonance frequency measurements, two
methods have been used: 1) linear chip excitation (Fig 5.6) for quick resonant frequency
analysis (provided by both the LabView and MATLAB setups), and 2) cumulative
transient actuation at different frequencies to look for the maximum displacement to
obtain the resonance frequency. It should be pointed out that the single-point vibration
analysis system was not equipped with a direct displacement output signal, and hence,
displacement should be calculated using simple harmonic motion assumption, given by:
x(t) 2 f v(t)
Figure 5.6: linear chirp function, producing a waveform with continuously increasing frequency (top), and transient membrane displacement calculated by integration of the recorded velocity of the LDV system, using MATLAB – frequency doubling is due to the use of bipolar signal (bottom).
0 0.2 0.4 0.6 0.8 1 1.2 1.4x 10
-4
-5
0
5x 10⁻⁷
Dis
plac
emen
t (m
)
Time (seconds)
voltage=30V Frequency=29000kHz
0 0.2 0.4 0.6 0.8 1 1.2 1.4x 10
-4
-50
0
50V
olta
ge (
V)
0 1 2 3 4 5
+1
0
-1
(5.1)
Voltage
Displacement

124
5.2.3. Valve Sealing Test Setup
Fig. 5.7 shows the test setup used to characterize micropump’s fluidic resistance, with
or without its microvalves being actuated. The setup consists of a differential pressure
calibrator (DHI PPC2+) for applying differential pressure, a function generator (Agilent
2305A) for generating the necessary actuation signal, a power amplifier (Krohn-Hite
7602M) for amplifying the actuation signal, and a mass flowmeter (Omega FMA-1601)
to monitor flowrate through the pump. The differential pressure calibrator and the
function generator are controlled using IEEE GPIB protocol, and the mass flowmeter is
controlled using a serial connection port. To operate the PPC2+, two gas lines, one
vacuum (for exhaust) and one nitrogen (for pressure application) are needed, which were
both provided by the Electrical Engineering and Computer Science (EECS) building gas
lines. To operate the setup, a MATLAB GPIB and serial port control interface has been
developed, capable of linearly increasing the actuation voltage on valve membranes as
different differential pressures are applied, and reading out the resulting mass flow rate.
Figure 5.7: Block diagram of the setup used to measure valve sealing and pull-in voltage.

125
At no actuation, reading the flow rate for different applied pressures, results in fluidic
resistance of the micropump and fluidic connections, while with actuation applied, fluidic
resistance of the micropump with closed valves as well as the membrane’s DC pull-in
voltage are resulted (Fig. 5.9). Microvalve sealing factor can be calculated by dividing
the micropump’s fluidic resistance with closed valves, by the micropump’s fluidic
resistance with open valves, which can be given for the entire pump, or a single
microvalve:
vo
vc
QSF
Q
vostage
vc
QSF
NQ
Figure 5.8: Valve sealing and pull-in voltage measurement, by fluidic resistance measurement, for different applied pressures. Top trace shows the applied voltage, bottom shows the flow rate change.
(5.2)
(5.3)

126
5.2.4. The Main Test Setup
Fig. 5.10 shows the main test setup used to study micropump’s performance for
different operating conditions. The setup consists of three high voltage amplifiers
(Krohn-Hite 7602M), a single-ended Omega pressure sensor, two mass flowmeters
(Omega FMA-1600 series), a custom-made current buffer, three high power resistors
(each 100 ) for protection against voltage overshoots during switching as well as
monitoring leakage current through the electrostatic actuator, and a National Instruments
DAQ-Card (NI-6353, operated by MATLAB) to generate necessary signals and control
the instruments.
Once properly interfaced (Section 5.2.1) and after preliminary actuation testing of the
membranes under a probe station, as well as vibration analysis (Section 5.2.2) and valve
sealing tests (Section 5.2.3), every micropump is tested in the following order:
1) Frequency Sweep: At no fluidic load (i.e. with the pump input left open to
atmosphere), the pump is actuated using signals shown in Fig. 5.10, for a given
microvalve timing. Actuation frequency is gradually swept to higher values, with
some rest time between every two adjacent frequency values, and mass flow rate is
Figure 5.9: Experimental setup used to control the micropump [3].
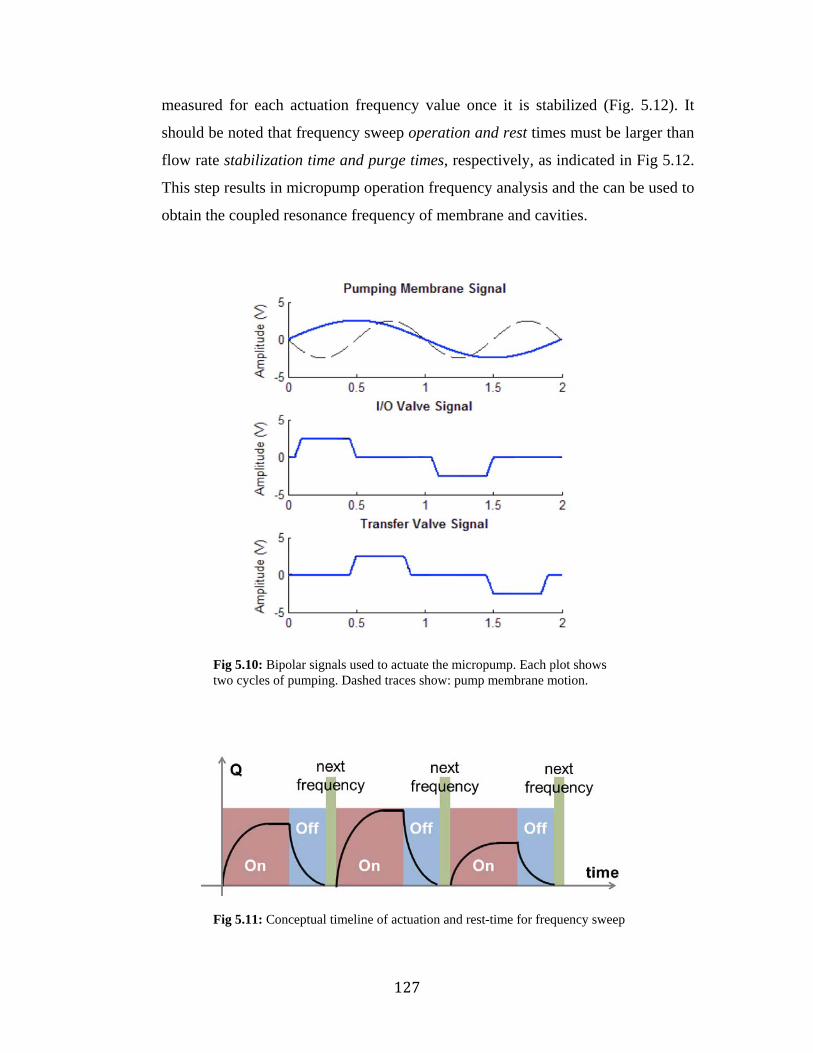
127
measured for each actuation frequency value once it is stabilized (Fig. 5.12). It
should be noted that frequency sweep operation and rest times must be larger than
flow rate stabilization time and purge times, respectively, as indicated in Fig 5.12.
This step results in micropump operation frequency analysis and the can be used to
obtain the coupled resonance frequency of membrane and cavities.
Fig 5.10: Bipolar signals used to actuate the micropump. Each plot shows two cycles of pumping. Dashed traces show: pump membrane motion.
Fig 5.11: Conceptual timeline of actuation and rest-time for frequency sweep

128
2) Valve Timing Optimization for Maximum Flow Rate: Once the optimum operation
frequency for maximum flow rate is obtained (which indicates the coupled
resonance frequency of membranes and cavities) in 1, microvalve timing
parameters (tcl, top as shown in Fig 5.13) are modified at the frequency of
maximum flow rate to achieve higher flow rate generation. This step results in the
optimized microvalve timing for high flow rate generation.
Figure 5.12: Charge accumulation and dielectric breakdown, due to operation of the pump using a unipolar trapezoidal waveform (i.e. positive net surface under the waveform).
t = 4sect = 0
Figure 5.13.a: valve timings (case 1) for inlet/outlet valves (top) and transfer valves (bottom), showing: top (inlet/outlet) top = 0, tcl = 0.2 and rise time = 0.1 and, bottom (transfer) top = 0, tcl = 0.25 and rise time = 0.1

129
3) Vacuum Generation: The pump input is connected to single-ended pressure gauge
(which provides a small cavity volume to evacuate), and the pump is operated at
the optimum operation frequency obtained in 1, while the generated vacuum is
measured by monitoring the pressure readout of the gauge. Once steady-state
pressure is obtained, the test is stopped. It should be noted that performing a
frequency sweep for vacuum generation is not feasible, since both stabilization and
rest times are respectively almost two and three orders of magnitude longer than
that of the frequency sweep, resulting in a much longer pump operation.
4) Valve Timing Optimization for Maximum Pressure: Once steady-state pressure
generation for the cavity-membrane coupled resonance is obtained, the valve
timing of Fig. 5.14.b is optimized for higher-pressure generation.
It should be noted that each of the above steps can be repeated with increased
actuation voltage. Generally, the starting value for actuation voltage is set to the DC pull-
in voltage of membranes, and is increased to 50% of the dielectric’s breakdown voltage.
In case of destructive tests to measure dielectric’s breakdown voltage, the actuation
voltage may be increased until breakdown occurs.
Figure 5.13.b: valve timings (case 2) for inlet/outlet valves (top) and transfer valves (bottom), showing: top (inlet/outlet) top = 0.1, tcl = 0.15 and rise time = 0.1 and, bottom (transfer) top = 0.05, tcl = 0.27 and rise time = 0.1

130
5.2.5. The Automated Test Interface
Besides the NI-DAQ Card setup introduced in the previous Section, the GPIB-based
and serial connection interface introduced in Section 5.2.3 is also capable of operating the
pump to obtain frequency sweep data for flow rate and measure vacuum pressure
generation; but the GPIB-based setup needs function generators to operate. While using
one function generator can be used with no delay in data processing, generating three
signals with phase shifts would require three function generators in a master-slave
configuration for synchronization, resulting in a slow operation. Therefore, the NI-DAQ
Card based setup is chosen as the main test-setup and the GPIB setup is only used for
valve sealing tests, where communication with the pressure calibrator is needed. In order
to drive the NI-DAQ card setup, an automated control interface with GUI, using
MATLAB’s data acquisition toolbox, has been developed by Karthik Kumar (Fig. 5.14)
and is used for most of pump testing [3]. The setup is capable of automatic frequency
sweep and valve timing optimization, as well as driving the single point laser vibrometer
(Section 5.2.2) for chirp function generation or continuous transient operation.
Figure 5.14: Micropump controller developed in MATLAB to generate corresponding signals and interpret flow and pressure data.

131
5.3. STRUCTURAL PROPERTY CHARACTERIZATION OF MEMBRANES
The vibration analysis results provided by single-point and scanning LDV systems
are presented in this section.
5.3.1. Single Point Resonant Frequency Measurements
Fig. 5.15 shows an example of spectral analysis of an unpackaged pumping
membrane from Gen. 3.2. The frequency response of the fabricated membrane is
obtained, when actuated using a linear chirp signal from 100 Hz to 20 kHz. As seen in the
PSD plot, the first resonance mode is measured to be ~38 kHz, which indicates a good
match between the designed value of Table 3.4. Note that since the electrode is connected
to ground and an alternating signal is applied to the membrane, so frequency doubling
occurs, resulting in the vibrometer frequency being twice the drive frequency.
Fig 5.15: Spectral analysis of a pumping membrane in air: actuation and membrane velocity measurements (top), and data analyzed by MATLAB to obtain the resonant frequency (bottom).
0 1 2 3 4 5x 10
4
0
0.02
0.04
0.06
Frequency (Hz)
PS
D
Input x50LV Output

132
5.3.2. Scanning Resonant Frequency Measurements
When vibration analysis is carried out on a packaged device, a better understanding of
the coupling and damping effects can be obtained. Here we use a scanning LDV system
to look at many pump membranes at once. Fig. 5.16 shows the frequency response of all
12 pumping membranes of a 24-stage micropump from Gen. 3.2, measured using a
Polytec MSA system.
The measurements indicates two distinct resonance peaks, one at ~4 kHz and the
other at ~27 kHz. Since the unpackaged device (Fig. 5.15) showed a resonance of
~38 kHz, it can be postulated that the first peak is caused by the cavity, while the second
is the membrane resonance lowered from its unpacked value, due to coupling with the
cavity. A single point displacement measurement obtained by the on-campus OFV
system also confirmed this result.
Figure 5.16: Resonance frequency measurement for all pumping membranes of a 24-stage pump, using a scanning LDV system: velocity (top) and displacement (bottom).

133
5.4. FLUIDIC CHARACTERIZATION OF THE MICROPUMP
The fluidic analysis of different generations of fabricated micropumps is presented in
this section, using the automated test setup, introduced in Sections 5.2.4 and 5.2.5. It
should be noted that the nitrogen-purged box was only used to test couple of pumps from
Gen. 3.4, to maximize micropump lifetime.
5.4.1. Fluidic Resistance Measurements
Fig. 5.17 shows the fluidic resistance measurement results for a 24-stage micropump
from Gen. 3.2, obtained by the test setup introduced in Section 5.2.3, when a linearly
rising DC voltage actuation is applied to the microvalves.
The plot gives the following data:
1) DC pull-in voltage: determines membrane functionality, as well as necessary
actuation data for next fluidic tests.
2) Fluidic resistance with open valves: indicates if there is any clogging in the pump
path, as well as the package sealing quality.
Figure 5.17: Static (DC) fluidic resistance measurements for microvalves (signals are applied after a 50X amplification).

134
3) Fluidic resistance with closed valves: indicates microvalve functionality, as well
as valve-sealing quality (used to study sealing capability of the valve material).
This method, however, does not provide any insight to micropump properties under
high frequency actuation. Fig. 5.18 shows the result of dynamic valve sealing properties
using the same test setup. It should be noted that due to the method being based on
monitoring the flow rate, it could not be used for frequencies higher than tens of hertz.
Table 5.3 summarizes the fluidic resistance measurement results obtained from
different generations of micropumps, as well as the previous Michigan Pump data. The
comparison provides very useful data on the effect of membrane material property on
valve sealing, since the previous Michigan Pump used Parylene to realize the membranes.
Table 5.3: Fluidic resistance measurement data for different generations of fabricated devices
# of devices
tested Minimum DC Pull-in Voltage
Max SFstage Notes
Parylene-Based Pump (2001-06)
8 150 V >65 By Kim, et al. [5-6]
HCP
Gen 1.7 5 108 V ~1 PDMS Package
Gen 3.1 2 83 V >10 Curved Electrode
Gen 3.2 >20 67 V >50 Reduced Curved Electrode
Gen 3.4 >15 53 V >40 Smaller Valve Gap
Figure 5.18: Dynamic fluidic resistance measurement, when the valves are operated using a sinusoidal waveform (left), and close-up of the same measurement data (right).

135
5.4.2. Flow Rate Frequency Response
Frequency analysis of different functional device generations (3.1, 3.2, and 3.4) were
obtained using the automated test setup, introduced in Section 5.2.4. Despite the large
pre-packaging membrane resonant frequency (>30 kHz), most devices exhibited optimum
performances at much lower frequencies (<10 kHz). Although this agrees with the
predictions provided by vibration analysis of packaged devices (Fig. 5.16), such
operation frequencies are much lower than designed. Since mass transfer is directly
affected by pumping frequency, the lowered resonant frequency results in reduced flow,
as depicted in Fig. 5.19, which shows flow rate of a 24-stage pump from Gen. 3.4 over
different frequencies: despite the sharp and distinguishable resonant peak, the total flow
rate is only 70 sccm, most likely due to very low resonance imposed by the cavity
(2 kHz). The same pump would have generated >1 sccm of flow rate (close to the
designed) if the designed membrane resonance actuation (>30 kHz) had been achieved. It
seems that single electrode actuation cannot provide enough displacement for pumping
action, except at cavity resonance. Further investigation is still needed in order to
determine the main cause of the lowered resonant frequency.
Figure 5.19: Flow rate versus actuation frequency, for a 24-stage pump of Gen 3.4

136
5.4.3. Microvalve Timing (Pumping Modes)
The flow rate performances of a 12-stage and 24-stage micropump from Gen. 3.2 are
shown in Fig. 5.20 and 5.21. First, the flow rate is measured for a given operating
frequency using the valve timing shown in Fig. 5.13, and then maximized by modifying
the valve timing. Here top is set to zero and tcl is varied.
The maximum performance from frequency analysis of the devices is estimated to be
at 12 kHz for the 12-stage pump and 7.5 kHz for the 24-stage. This is in accordance with
the laser vibrometer results of Section 5.2, where the maximum displacement of the
membrane was found to occur in the frequency range 4-10 kHz as shown in Fig. 5.16.
The valve timing is optimized at 12 kHz and 7.5 kHz for 12- and 24-stage devices
respectively, and was found to produce flow in a larger range of timings for the 24-stage
pump compared to the 12-stage. We postulate that this is due to the larger total cavity
size of the 24-stage device compared to that of the 12-stage.
Figure 5.20: Valve Timing optimization for a 12-stage micropump
Figure 5.21: Flow rate measurements for a 24-stage micropump. A sine wave and trapezoidal waveform with amplitudes 59 Vrms and 150 V respectively are used to operate the pump.

137
5.4.4. Maximum Pressure Accumulation
Gen. 3.1 produced only negligible pressure accumulations: The pressure would drop
by 100 Pa initially and then rise back up to atmospheric. The device was however,
capable of producing enough backpressure to move a droplet of ~2 mm3 ink in a Tygon
tubing of 1mm ID, as shown in Fig. 5.22.
Gen. 3.2 produced a larger pressure differential of ~500 Pa, using a 24-stage device.
The first notable pressure readout was however obtained on Gen. 3.4, where pressure
accumulations up to 4.5 kPa were recorded on 12-stage devices, as shown in Fig. 5.23. It
is believed that such large pressure accumulations are due to the introduction of smaller
valve gaps, and balanced cavity volumes, realized by height compensating “pillows.”
Figure 5.22: Droplet moved by a 24-stage micropump when operated at 7.5 kHz.
t = 18sect = 0
Figure 5.23: Pump-down, by a 12-stage device of Gen.3.4: flow rate – only one of the two flowmeters of the setup is shown (top), and differential pressure of 4.4 kPa (bottom).

138
Using the maximum accumulated pressure data for infinite load (Fig. 5.23) and
maximum mass flow rate for open load, a pump performance curve can be achieved,
which is not included here, due to lack of enough measurements for different loads (see
Section 2.2 and Fig. 2.4).
5.4.5. Summary of Flow and Pressure Measurements
Table 5.4 summarized pump’s testing results obtained from devices realized in
different fabrication generations.
Table 5.4: Summary of micropump flow and pressure results analysis
Device
# Wafer
# # of
Stages
Trench Height (m)
hg (m) hcT/hcB (m)
Max Flow
(L/min)
Max Pressure
(kPa) pump valve
3.0 1 1 24 90 2.5 45/80 320 ~0.11
Gen
. 3.2
1 2 4
60 4 45/50
360 ~0
2 2 12 160 ~0
3 2 12 30 ~0
4 2 24 310 ~0.55
5 2 24 120 ~0
Gen
. 3.4
1 1 4 60 4 1
45/60 35 ~0
2 1 4 45/60 10 ~0
3 5 12
80 5 2.5
40/45 150 4.4
4 5 4 25/35 30 ~0
5 5 24 25/35 10 ~0
6 7 4 60 6 4
45/60 10 ~0
7 7 24 40/45 20 ~0
8 14 4
80 6 4
40/45 35 ~0.55
9-13 14 4 30/30 30 ~0.5
14 14 24 30/30 70 1.1

139
5.5. DISCUSSING THE EXPERIMENTAL RESULTS
Since reporting the first readable flow rate by Gen. 3.1, three new device generations
were fabricated and tested. Based on the obtained results, several modifications were
made to the pump fabrication, testing setup and testing methodology, which resulted in
gradual improvement of the pump performance, achieving 0.36 sccm of flow rate and
4.4 kPa of pressure by several devices. Although this validates the capability of the
developed technology and the proposed design for successful pumping, and more
importantly, its repeatability, still more work is needed to improve the results. It is
believed that two factors are involved in the lowered pump performance: 1) non-idealities
of the design and process, in particular, single electrode actuation, and 2) unwanted
secondary pumping effects. Both are discussed in more detail through the next chapter.
Here, we only list the possible causes in each case.
5.5.1. Non-Idealities
The basic thermodynamic model (equation 3.7) suggests the reduced flow rate is
either due to reduced operation frequency or reduced displacement – or both. Since the
single electrode actuation heavily relies on resonance to function, reduced operation
frequency implies reduced resonant frequency. On the other hand, reduction of the cavity
size (from Gen. 3.2 to 3.4) did not provide a higher resonant frequency. Yet it could be
observed that 12-stage pumps exhibit higher resonance frequency than 24-stage pumps,
and 4-stage pumps exhibit higher resonance than the 12-stage (Fig. 5.20 and 5.21). This
implies a coupling effect caused by adjacent cavities, which creates a larger “effective”
cavity volume, and hence lowers the resonant frequency. This phenomenon was briefly
reported by Astle [5], but due to dual-electrode actuation, the “Parylene-membrane”
pump developed by Kim was able to operate at higher frequencies up to 20 kHz, despite
the very low natural frequency of the membrane (<5 kHz). The single-electrode pump,
however, either needs improved valve sealing or improved valve timing to minimize the
coupling issues between cavities. Methods to address this issue, by either resizing the
valves, completely canceling the curved valve issue (see Section 5.1) or new actuation
technologies are ongoing, and will be discussed in Chapter 6.

140
5.5.2. Secondary Pumping Effects
Besides the “fatal” issues that caused the total failure of the fabrication (such as
broken membranes, or curved frame), a number of issues have been observed on the
successfully fabricated devices (Gen 3.x), which only caused “secondary effects” rather
than failure of the entire pump fabrication/operation. The main secondary effects can be
listed as:
- Curved Valve Electrodes: as mentioned in Section 5.1, all valve membranes of
Gen. 3.x exhibited some out-of-plane curvature, most likely due to the stress
induced by the boron doping process. While this increases the valve stroke and
reduces their effective sealing, it could also be favorably employed, to form
zipper actuators. However, a better understanding of the phenomenon is required
before being able to utilize it.
- Valve Pumping: it has been observed that with no pumping membrane actuated,
the valves provide up to 45% of the pumping (covered in Chapter 6). This can be
due to the fact that valves are all the same size as the pump membranes (and
hence exhibit the same resonance frequency), while they also have larger strokes
due to the curved electrode issue. It has also been suggested that valve timing can
cause the valve pumping phenomenon. Methods to reduce this effect, or on the
other hand, utilize it in favor of pumping, will be sought in Chapter 6.
- Moving Valve Electrodes: When over-etched, the poly-silicon ring can pass
through the doped silicon, and make a “suspended” electrode (due to the
remaining (111) planes at the edges of the hexagonal electrode, it would not be
detached completely.) Since the electrode stress is lower than that of the
membrane, based on equation 3.20 it would exhibit lower resonance, and hence, it
will be a more compliant spring than the membrane itself. As a result, both the
valve and membrane electrode would move, despite the electrode being much
thicker. If properly utilized, this effect can eliminate the valve pumping down to
zero, as both perforated substrates would move against each other, resulting in no
net air being moved when the valve closes. This is also discussed in Chapter 6.

141
5.6. References
[1] K. Kumar, S. Y. Yee, A. Besharatian, L. P. Bernal, K. Najafi, 'Transient Performance and Coupled Acoustic Structural and Electrostatic Modeling of a Multistage Vacuum Micropump', 2011 ASME IMECE, Denver, CO, Nov. 11-17, 2011.
[2] K. Kumar, A. Besharatian, R. L. Peterson, L. P. Bernal, K. Najafi, “A Multiphysics Reduced Order Model of Valve Pumping in a 4-Stage Vacuum Micropump,” 2012 ASME IMECE, Houston, TX, USA, Nov. 9-15, 2012.
[3] K. Kumar, “Theoretical and Experimental Analysis of an Electrostatically Actuated Multistage Micropump with Active Valves,” Ph.D. thesis, University of Michigan, Ann Arbor, MI, 2013.
[4] A. Besharatian, K. Kumar, R. L. Peterson, L. P. Bernal, K. Najafi, “A Modular, Multistage, Peristaltic, Electrostatic Gas Micropump,” IEEE MEMS'12, Paris, FRANCE, Jan. 29 - Feb. 2, 2012.
[5] H. Kim, A. Astle, K. Najafi, L. Bernal, and P. Washabaugh, “A fully integrated high-efficiency peristaltic 18-stage gas micropump with active microvalves,” in Proc. MEMS 2007, pp. 131-134.
[6] A. Astle, H. Kim, L. Bernal, K. Najafi, and P. Washabaugh, “Theoretical and experimental performance of a high frequency gas micropump”, Sensors and Actuators A: Physical, Volume 134, Issue 1, Pages 245-256, Feb. 2007

142
CHAPTER 6
UTILIZING NON-IDEALITIES AND SECONDARY
PUMPING EFFECTS
During microfabrication and testing of the Scalable Michigan Pump, a number of
non-idealities were observed, which affected the structural properties and performance of
the fabricated micropumps. This chapter covers major unwanted and secondary pumping
effects, as well as the non-idealities, listed in Chapters 4 and 5. We will further suggest
methods to utilize these effects to improve the overall pumping performance, or simplify
the microfabrication process. Utilizing these effects leads to introducing new classes of
gas micropump as well as new simple microfabrication methods to realize future MEMS
actuators. In particular, a “valve-only pumping” mechanism is presented, and utilized to
realize novel compact and simple pumps in which both pumping and flow control are
carried out using microvalves. Fluid dynamic modeling (performed with the help of an
on-campus graduate student colleague, Karthik Kumar, from Aerospace Engineering)
will also be presented to discuss the observed effects.
6.1. CURVED ELECTRODE PHENOMENON
As listed in Tables 4.7 and 5.1, among the major fabrication process challenges that
affected a number of device generations was unwanted out-of-plane curvature of valve
electrodes, while pump electrodes showed reasonable flatness. Although exhibiting a
varying gap and hard to calculate membrane stroke, curved electrodes are of interest from
actuation point of view, resulting in efficient electrostatic actuators known as zipper
actuators. As illustrated in Fig 6.1, due to the smaller gap at edges, such parallel-plate
actuators can function at lower voltages by a “zipping”-type action that is resulted from

143
gradual pull-in of the membrane at edges with smaller gap until a full collapse of
membrane occurs [1, 2, 3].
Since one of the main shortcomings of electrostatic actuation is their reliance on high
voltages for operation, reducing the actuating voltages by utilizing this effect, can
significantly benefit the pump actuation and control; however, a curved pumping
electrode is more preferred than a curved valve electrode, due to the checkerboard
microvalve alignment considerations. As a result reducing the curvature of curved valve
electrodes, and utilizing the results to introduce some curvature to the flat pumping
electrodes may result in improved pump performance. Fig 6.2 shows a released single
valve structure photo and the corresponding SEM image indicating the electrode’s inward
bowing. Also shown in Fig. 6.3 is the measured electrode bowing of a microvalve of
Gen. 3.1, using a Dektak 6M Surface Profilometer. It should be noted that the bowing
“adds” to the designed valve gap, creating a considerable valve membrane stroke.
Figure 6.1: Out of plane “zipper” electrode for low voltage electrostatic actuation
Figure 6.2: Valve electrode buckling for a 24-stage device and single valve structures (left), and SEM image showing a valve electrode buckling.

144
It is suggested that this bowing is mainly due to (1) residual stress gradient (caused by
boron doping) of electrodes and (2) the electrode’s hole pattern. Heavily doped silicon
shows tensile stress due to introduction of high concentrations of smaller boron atoms in
bulk silicon lattice; however, as doping reduces deep inside the substrate, the stress also
reduces as a function of distance from the surface [4]. Since manipulating the doping
needs process modification, the electrode pattern is modified instead, to control the
electrode curvature. Fig. 6.4 shows the valve electrode pattern used in Gen. 3.1, as well
as the modified pattern in Gen. 3.2 to reduce the electrode curvature. Table 6.1
summarizes the measured electrode curvature for two different generations, along with
the measured actuation voltage for each case.
Figure 6.3: Measured curvature for valve and pump electrodes of Gen. 3.1, using a Dektak 6M profilometer. While pumps show completely flat electrodes, valves exhibit up to 15um of curvature.
Pump Electrode Valve Electrode
Figure 6.4: Valve electrode pattern for: Gen. 3.1 (left), and Gen. 3.2 (right).

145
Table 6.1: Valve electrode curvature and pull-in voltage prior and upon modifying its hole pattern
Fig. 6.5 shows two methods pursued using cantilever beams and square diaphragms
to characterize the effect of electrode pattern on the released doped electrode curvature. It
should be noted that non-hexagonal electrodes were used in both characterization to
simplify the release (using crystal dependence of the anisotropic silicon etchants) and
simplify the measurements. Although both methods has shown correlations between the
electrode pattern and curvature, neither resulted in curvatures as high as observed in
actual devices (maximum measured curvature <0.2um). This suggests the impact of
trench grid and device frame on curvature, and hence, more investigation is yet needed
for a better characterization of doping effect and holes pattern on the electrode curvature.
Valve Electrode Bowing
(um) Pull-in Voltage (V)
DC AC
HCP Gen. 3.1 9.0 ~ 15 >85 >125
HCP Gen. 3.2 5.0 ~ 8.5 >60 >90
Figure 6.5: Two methods used to study the correlation between electrode pattern and its curvature: cantilever beams w/ varying hole gradients (top), and square electrodes w/ varying hole size/spacing.

146
6.2. REVERSE/NEGATIVE PUMPING
A number of tested devices exhibited reverse pumping for certain frequencies. This
can potentially be utilized to realize bi-directional micropumps. Fig. 6.6 shows flow rate
versus frequency for a 4-stage device from Gen. 3.2, where both positive and negative
peaks can be observed.
The reverse pumping phenomenon can be a result of phase lag between valve and
pumping membranes, caused by their different resonant frequencies (as reported in [5]),
or by difference between cavity-induced and membrane-induced resonant frequencies.
The former would result in change of flow direction over a narrow range of frequencies,
while the latter would result in distant positive and negative flow peeks, as it is the case
for Fig. 6.6. Both cases provide valuable information in studying cavity and membrane
resonant frequencies.
Reverse pumping can also be observed as a result of different valve timings for a
given actuation frequency, which can change the role of inlet/outlet and transfer valves. It
should be noted that a complete role-change for inlet/outlet and transfer valves in not
possible in single electrode devices, as all valves exhibit similar directionality due to their
electrodes being under the corresponding membranes (see Section 3.3).
Figure 6.6: Flow rate versus frequency for a 4-stage device from Gen. 3.2 – both positive and negative flow can be observed.

147
6.3. VALVE-ONLY PUMPING
Fluid dynamics modeling using the improved 4-stage reduced order model [ 6 ]
predicts considerable mass transfer, and hence pumping, carried-out by valve
membranes. This is mainly because the checkerboard microvalve operation provides
strokes that are comparable to that of the pump membrane, due to equal valve and pump
membrane sizes and similar electrode structures (valve electrode holes number is in the
same order of magnitude as pump electrode holes, while the holes are the same size).
Moreover, the number of valve membrane holes are less than 15% of electrode holes in
the designed pump (220 versus 1600), resulting in a considerable mass transfer when the
membrane moves. Fig. 6.7 the resulted flow rate and transient pressure rise, when only
valve membranes are actuated, using the 4-stage reduced order model.
To further support the theory and modeling, the phenomenon is investigated by
experiments carried out on the micropumps of Gen. 3.2 onward. Only microvalve
membranes are actuated (using the sinusoidal waverforms for both inlet/outlet and
transfer valves with phase delay) while the pump membranes are grounded. To ensure no
coupled resonance could occur between the checkerboard microvalves and pumping
membranes, the pumping membranes are intentionally broken/removed after fabrication
and their electrodes are disconnected and sealed (Fig. 6.8).
Figure 6.7: Fluid dynamics modeling of valve pumping, using the 4-stage reduced order model of [5], when pumping membranes and their corresponding cavities are eliminated: normalized pressure variation in two adjacent stages when only inlet/outlet and transfer valves are actuated (left), and the resulted flow rate vs. frequency, generated by valve-only pumping

148
Fig. 6.9 shows flowrate measurement in a 12-stage pump from Gen. 3.2 (with pump
membranes removed), and with only valve membranes actuated. As can be seen in the
figure, the microvalve-only actuation can provide up to 150µl/min of flowrate (at 125Vpp
and 1kHz) which is equal to the maximum flowrate (at 125Vpp and 20kHz) generated
with the same pump when all membranes are intact and actuated (Table 5.4). This results
can be regarded as the valve-only pumping carried out by only one single pumping stage,
since the stages connected in series.
Fig. 6.10 shows the pressure accumulation result for a 4-stage pump generation 3.2.
The microvalve-only actuation can provide up to 500Pa of pressure accumulation (at
140Vpp and 500Hz) when pumping down from atmosphere, which is equal to the
maximum pressure accumulation (at 125Vpp and 11kHz) generated with a 24-stage pump
from the same device generation when all membranes are intact and actuated (Table 5.4).
Figure 6.9: The measured flow generated by valve-only pumping for the 12-stage pump of Fig. 6.8
Figure 6.8: the 12-stage pump with all pumping membranes removed (crossed-out in the photo), under test.

149
It is believed that the observed valve-only pumping is mainly due to the combination
of resonance-based fluidic jet generation [7] (Fig. 6.11), and the valve timing used (Fig.
6.12). The former performs mass transfer, which is required for gas pumping, while the
latter produces non-zero pressure rise with zero mass transfer. Fig. 6.11 shows the
operation of a single microvalve to generate a net transfer of fluid from the top to the
bottom cells. Fig. 6.12 shows how two valve membranes “catch” and “transfer” gas from
one pumping chamber to the next, when proper timing used (only microvalves shown).
Fig. 6.10: The measured pressure accumulation generated by valve-only pumping for a 4-stage pump, when pumping down from atmosphere. The evacuated chamber size is around ~5cm3.
Figure 6.11: The microvalve mass transfer: starting from the released state (top), the valve membrane is drawn towards the closed side, pushing out a fluid plug and creating a microjet (middle), and (bottom) the valve membrane restored to the open side, without pushing a fluid plug.
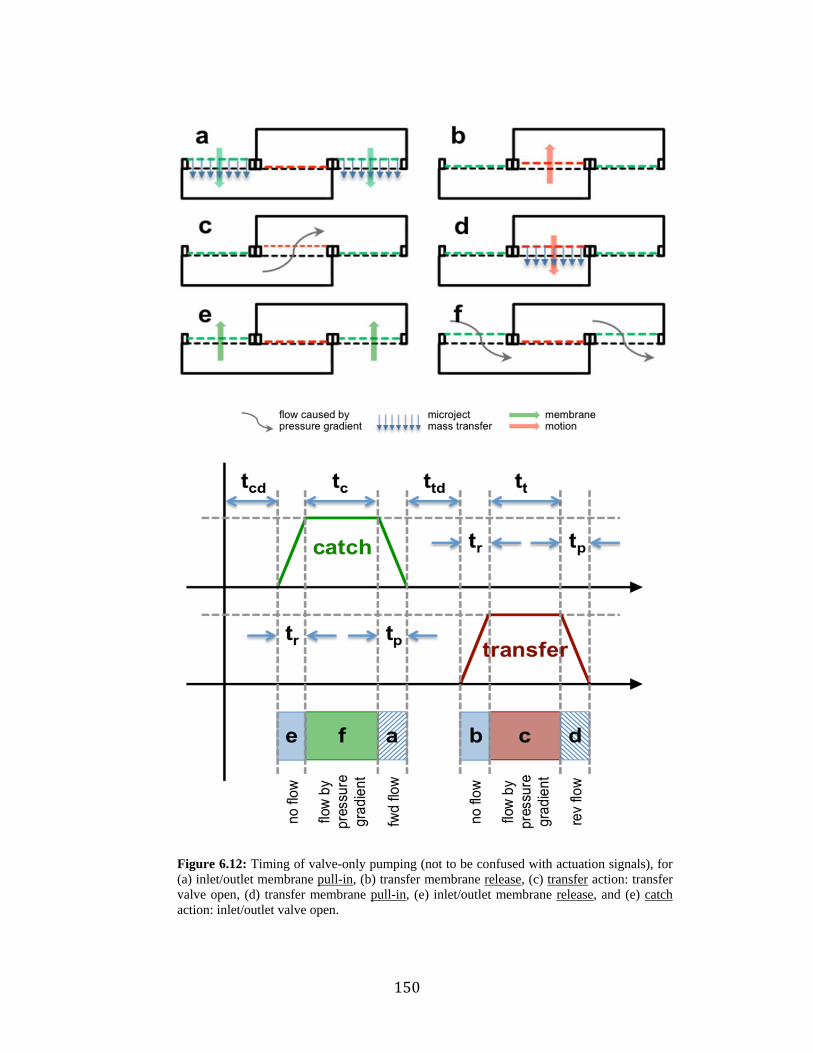
150
Figure 6.12: Timing of valve-only pumping (not to be confused with actuation signals), for (a) inlet/outlet membrane pull-in, (b) transfer membrane release, (c) transfer action: transfer valve open, (d) transfer membrane pull-in, (e) inlet/outlet membrane release, and (e) catch action: inlet/outlet valve open.

151
It would be interesting to note that the microvalves used here are not optimized for
pumping action, but only for flow control. More importantly, only the pump membrane
was eliminated in the devices under test, while the pumping cavity volume was
unchanged, creating a very large dead-volume, and hence lower operation frequency and
maximum flow rate. With proper design of the microvalve configuration (i.e., the number
and size of membranes, electrode holes and their spacing), as well as pumping cavities,
higher flow rate and pressure levels may be achieved. Finally, with pumping membrane-
electrode pairs removed, simple 1-D fluidic paths (in contrast with the 2-D paths of
Section 3.2) would be possible, resulting in magnificently simplified device architecture
and fabrication (Fig 6.13). As a result, utilizing the observed unwanted valve-only
pumping phenomenon, as the primary pumping principle, enables simple, highly
compact, easy-to-scale, easy-to-control, easy-to fabricate gas micropumps in which both
mass transfer and flow generation are carried out using microvalves. Such devices can be
used for high flow and moderate pressure applications.
Figure 6.13: The proposed 20-stage compact valve-only pump architecture, with 1-D fluidic paths, for high flow applications.

152
6.4. MOVABLE VALVE ELECTRODES
When over-etched, the poly-Si ring can pass through the doped silicon layer, resulting
in “suspended” electrodes. Note that the electrode would not completely be detached
from the frame, due to presence of silicon connection points caused by trapped bulked
silicon under (111) planes, shown in Fig. 6.14a. This effect was observed in one of the
wafers fabricated in Gen. 3.4, in which valve electrodes had thinner sacrificial layers than
that of pump electrodes. The etched ring was deeper than the doped silicon electrode in
valve areas (see Fig. 4.20), due to over etching, while pump electrodes were fabricated as
expected. Released devices were tested for DC pull-in voltage measurements, and
exhibited both membranes and electrodes moving, although high frequency actuation was
not performed. This indicates the possibility of realizing microvalves with zero mass-
transfer, which can be sought as a solution to the unwanted valve pumping effect. Figure
6.14b shows the proposed “crab-leg” electrode design to realize moving valve electrodes.
Figure 6.14: (a) Trapped bulk silicon using (111) planes, resulting in “hinged” electrodes, when the poly-Si ring is over-etched, and (b) the proposed “crab-leg” electrode design to realize moving valve electrodes

153
6.4. References
[1] R. Legtenberg, J. Gilbert, S. Senturia, and M. Elwenspoek, “Electrostatic curved electrode actuators”, J. Microelectromech. Syst, 6 (1997), pp. 257-265.
[2] T-K A. Chou and K. Najafi, “Fabrication of out-of-plane curved surfaces in Si by utilizing RIE lag”, Proc. MEMS 2002, pp. 145-148.
[3] H. Kim, K. Najafi, P. Washabaugh, and L. Bernal, “Large-deflection out-of-plane electrostatic buckled-electrode actuators”, Proc. Transducers 2003, pp. 794-797.
[4] O.C. Jeong, S.S. Yang, “Correlation between Residual Stress and Boron Concentration in Boron-Doped Silicon Films”, Japanese Journal of Applied Physics, Volume 44, Issue 1A (2005), pp. 350.
[5] M. Stehr, S. Messner, H. Sandmaier, R. Zengerle, “The VAMP – a new device for handling liquids or gases”, Sensors and Actuators A: Physical, Volume 57, Issue 2, November 1996, pp 153–157. [6] K. Kumar, A. Besharatian, R. L. Peterson, L. P. Bernal, K. Najafi, 'A Multiphysics Reduced Order Model of Valve Pumping in a 4-Stage Vacuum Micropump', 2012 ASME International Mechanical Engineering Congress and Exposition (IMECE), Houston, TX, USA, Nov. 9-15, 2012. [7] Chou, T.-K. A., Najafi, K., Muller, M. O., Bernal, L. P., Washabaugh, P. D. and Parviz, B. A. 2002 Micromachined e-jet for IC chip cooling Proc. IEEE Internaional Solid-State Circuits Conference (ISSCC 02). San Francisco, CA, pp. 356-357.

154
CHAPTER 7
CONCLUSIONS AND FUTURE DIRECTIONS
The presented research work involved the study, design and technology development,
as well as microfabrication and testing of integrated mechanical compression gas
micropumps that can be used as roughing pumps in vacuum on-chip and micro gas
analyzer applications. Theoretical considerations based on the mean free paths of gas
molecules and typical MEMS device dimensions predict the feasibility of absolute
vacuum pressures in the range of 10~50 Torr using mechanical compression micropumps
with relatively high mass transfer capability [1]. However, the micropumps available
today are far from achieving this goal, at least by an order of magnitude. As a result, it is
of utmost importance to understand the challenges impacting the performance of
previously reported pumps, and find, develop and implement necessary tools to overcome
them – fundamentally and practically – in order to realize high performance vacuum
micropumps that can satisfy pressure goals of the theoretical predications. The result of
such research would be of high interest for a variety of chemical, biological, health
monitoring and homeland security applications, while the developed technologies for
device microfabrication also benefit several other areas of MEMS.
To accomplish this, several steps have been undertaken: first, a previous work by
Michigan [2] has been selected as a basis for the current doctoral research, due to its
outstanding features, and was compared to other reported work in the area, to obtain an
understanding of limitations impacting the development of high performance vacuum
micropumps – scalability was identified as the main challenge here. Second, a detailed
analysis has been performed to determine the previous work’s scalability limits, and
methods to overcome this have been developed, resulting in design rules to address issues

155
of the previously reported gas micropump. Based on this analysis, a novel modular
microfabrication technology that provides methods to implement ultimate micropump
scalability has been proposed. An all-silicon microfabrication technology has been
developed to realize the sensitive part of the device, based on the design rules obtained
for scalability, and several device structures have been successfully fabricated using the
modular microfabrication technology, with test results presented. Secondary pumping
effects, degrading the performance of the developed micropump, have been identified
and are further utilized to improve the future device design, modeling and development.
7.1. SUMMARY OF THE RESEARCH
In this dissertation, design, microfabrication and testing of a scalable modular
multistage gas micropump, as well as development of technologies used to realize the
final work, are presented. The modular pump is designed as a cascaded multistage
structure of several pressure modules, and fabricated modularly (in parts), as an assembly
of sensitive and incentive device modules (not to be confused with pressure modules).
The mechanical resonator (the sensitive fabrication module) consists of pumping
membranes (stacked silicon dioxide and silicon nitride film) and electrodes (doped single
crystal silicon), as well as support structures (doped trenches refilled with poly-silicon).
The acoustic resonator (the insensitive fabrication module) consists of large, easy-to-
align glass pieces that provide pumping cavities, as well as the device package. The
device is capable of being scaled down (i.e. shrunk in size) by utilizing several low
power, low force easy-to-integrate electrostatic actuators in a cascaded multistage
configuration, which uniformly distributes the pumping action over several stages of
pumping. The multistage structure is capable of being scaled up (i.e. extended to any
number of cascaded stages) while maintaining uniform pressure distribution, to
accommodate higher-pressure differences, without the need of large actuation forces, and
hence, without degrading the micropump’s miniaturization and integration. The modular
microfabrication technology provided a membrane release yield of >95% with less than
<5% error over critical pump parameters and the fabricated micropump successfully
reached a total pressure accumulation of 4.4 kPa and a flow rate of 360 L/min, at power
consumption of only 10 mW, and actuation voltage levels of <100 V.

156
In summary the accomplishments of this research can be listed as:
Theory and Design: Main challenges impacting the miniaturization and integration of
high performance gas micropumps, in particular the previous Michigan work by Kim, et
al., have been identified. In particular, scalability, as the capability of micropump
miniaturization, and also as the capability of extending multistage pump structures
without performance degradation, has been identified as the main challenge. Primary and
secondary design parameters that affect the pump performance have been identified and
utilized to set necessary design rules for developing a scalable multistage pump with
uniform pressure distribution across the multistage structure. In order to implement the
scalable micropump, new multistage designs (the VVR and MPS) with their technology
requirements were proposed, allowing the multistage configuration to be extended to any
number of stages to satisfy any pressure differential that mean-free-path considerations
allow. Moreover, the novel Honeycomb Pump (HCP) Architecture, providing 100% area
utilization and full scaling capability has been developed. Using the developed design
rules, proposed multistage designs and pump architectures, finalized pump design
parameters are provided, with single electrode electrostatic actuation considerations
including damping and pump directionality.
Technology and Microfabrication: Design rules for implementing a scalable pump
were utilized to develop necessary microfabrication technologies that address both
fundamental and practical challenges. A novel modular microfabrication technology,
dividing the device fabrication into two (sensitive and insensitive) modules, has been
introduced as a solution to scalability and feasibility challenges. An accurate, highly
controllable, high-yield and reliable all-silicon microfabrication technology has been
developed in order to realize the sensitive (mechanical resonator) module, while the
insensitive (acoustic resonator) module is simply fabricated using glass processing. New
packaging and assembly techniques for assembling the two device modules, with
acceptable reliability, have also been developed, implemented and characterized. Several
device generations, including both process modules, have been microfabricated and
characterized, in order to deliver the final optimized micropump. Lessons learned from
both failures and successes in microfabrication technology development have been listed

157
and summarized. The developed all-silicon microfabrication technology reached a
membrane release yield greater than 95% with less than 5% error in controlling critical
pump design parameters. The finalized process technologies support microfabrication of
the fully integrated, fully packaged, testable, and ready-to-implement scalable devices (4-
, 12-, and 24-stage) with the 24-stage pump having the largest number of stages ever
monolithically integrated on a single chip. Moreover, the developed technologies can be
utilized for highly controllable, high-reliability and low-cost development and production
of a variety of acoustic and fluidic MEMS devices, such as micro-speakers, micro-jets
and microelectronic-coolers, for both research and industrial applications.
Testing and Characterization: Device testing and characterization, in order to validate
and investigate the design, modeling and developed technologies, have been performed
on a number of device generations. Structural properties of membranes have been
characterized both prior and post packaging, by resonant frequency measurements using a
Laser Doppler Vibrometer system. Although unpackaged membranes showed a great
match between the design and measured resonant frequency (~35 kHz), packaging
resulted in reduced resonant frequencies due to coupling between membranes and pump
cavities. Upon packaging, 4-, 12- and 24-stage devices respectively showed resonant
frequencies ranging 35~40 kHz, 18~22 kHz and 9~13 kHz. The reduced resonant
frequencies for larger devices are believed to be caused by valve non-idealities, resulting
in all pump cavities coupling with each other through the multistage structure, and hence,
forming effectively larger cavities. Microvalves have also been tested for leakage and
pull-in voltage measurements, resulting in a sealing factor of >50 and >40 and DC pull-in
voltages <100 V for the last two device generations. With all membranes properly timed
at the optimum actuation frequency, maximum flow rate of 360 L/min and maximum
pressure accumulation of 4.4 kPa have been achieved. It is believed that the lower
performance compared to the designed device is resulted from a number of non-idealities,
mainly microvalve non-idealities and packaging non-idealities. Microvalve non-idealities
include curved valve electrodes, valve leakage and valve pumping. Packaging non-
idealities include reduced resonant frequency caused by coupling, inaccurate volume
ratio due to reflow of the sealant and glass etching errors. Methods to utilize some of the
non-idealities as primary pumping effects have been proposed but not utilized.

158
7.2. FUTURE WORK
Based on the developed technology and test results, the future work can be
summarized as:
Technology and Fabrication: Improved pump performance can be achieved by
addressing whether valve or packaging non-idealities. To address valve-non-ideality
issues, methods to characterize valve electrode curvature and control it would improve
valve sealing, and also potentially enable zipper actuators. Pumps with microvalves in
which both the membrane and electrode move at actuation, can effectively reduce valve-
pumping effects to zero. To address packaging non-idealities, an assembly technique to
minimize the volume of the adhesive material, in order to provide a more accurate control
over the cavity volume, and hence the volume ratio, should be developed. Simplifying the
pump architecture to achieve easy-to-calculate cavity volumes also improves control over
the volume ratio. Besides the above improvements, general process characterization, in
particular regarding yield and flexibility in satisfying different design parameters, can
also be beneficial. New classes of gas micropumps, in particular, compact valve-only-
pumps for high flow and moderate pressure applications, to be designed and developed.
Testing and Characterization: Further device testing and characterization is needed, in
particular, more data to be provided to study the effect of critical pump parameters, such
as volume ratio, membrane gap and cavity size, on the pump performance. In particular,
the pump scalability for high-pressure generation using multi-staging should be
investigated and the obtained data should be used to improve the pump modeling and
design, if necessary. As the pumping occurs at cavity resonance, further studies of the
parameters impacting the cavity resonant frequency and methods to increase it, are of
paramount importance. More studies are needed on the single-electrode actuation and its
limitations; in particular, the membrane displacement in both directions must be
determined at resonance, and methods to improve it must be identified. Lifetime, effect of
the test environment, such as pumping medium, temperature and humidity should be
studied through extensive tests. Device integration with other system components in
handheld gas analyzers or vacuum systems should be investigated.

159
7.3. FINAL REMARK
The presented doctoral work has provided a feasible solution to the critical issues of
micropump scalability – both fundamentally and practically – in order to develop
multistage pumps that can truly be scaled to accommodate any differential pressure
possible by mean-free-paths considerations. The solutions include pump designs
providing uniform pressure distributions across multistage pumping structures for any
number of cascaded stages, as well as appropriate technologies to implement pump
designs. The developed technologies can be utilized by wide range of MEMS device
applications, both academically and industrially. In particular, the design and technology
solutions to pump scalability issues are of paramount importance in realizing
miniaturization and integration of future gas micropumps both for vacuum on chip and
gas analyzer applications. This body of work introduces the only micropump that can
potentially be integrated with other system components without limiting their
miniaturization capabilities, or significant loss in performance.

160
7.4. References
[1] H. Kim, K. Najafi, and L. Bernal, “Gas Micropumps” in Comprehensive Microsystems, Elsevier Publishers, 2008, pp 273-299.
[2] H.S. Kim, A.A. Astle, K. Najafi, L.P Bernal, and P.D. Washabaugh, “A fully integrated high-efficiency peristaltic 18-stage gas micropump with active microvalves,” in Proc. MEMS 2007, pp. 131-134.