a Saudi Cement Company
20
KMEFIC Research Department شرا وق ا وا اآ . م. ك. مKuwait and Middle East Financial Investment Company K.S.C.C Expected rate of return on equity in GCC KMEFIC Research Equity Analysis Report – Initiation of Coverage Yamama Saudi Cement Co. January 2012
Transcript of a Saudi Cement Company
KMEFIC Research Department ��را����� ش��� م.ك.م.��آ� ا����� وا���ق ا�و�
Kuwait and Middle East Financial Investment Company K.S.C.C
Expected rate of return on equity in GCC
KMEFIC Research Equity Analysis Report – Initiation of Coverage Yamama Saudi Cement Co.
January 2012

January 2012
KMEFIC Research
Equity Analysis Report
Yamama Saudi Cement Co.
P a g e | 2
Table of Contents
EXECUTIVE SUMMARY ...................................................................................................................................................................... 3
YAMAMA, THE STOCK IN TADAWUL ........................................................................................................................................... 4
BUSINESS PROFILE ............................................................................................................................................................................. 5
YAMAMA SAUDI CEMENT COMPANY ............................................................................................................................................................................ 5 EXPANSIONS & STRATEGIES ............................................................................................................................................................................................ 5
INDUSTRY: OVERVIEW & OUTLOOK ............................................................................................................................................. 6
CEMENT ................................................................................................................................................................................................................................ 6 SAUDI CEMENT INDUSTRY ............................................................................................................................................................................................... 8 SAUDI CEMENT INDUSTRY PERFORMANCE .................................................................................................................................................................. 8 KEY DRIVERS: CEMENT DEMAND ................................................................................................................................................................................ 10 POSITIVE OUTLOOK .......................................................................................................................................................................................................... 10 PORTER’S FIVE FORCES MODEL ................................................................................................................................................................................... 11
FINANCIAL PERFORMANCE .......................................................................................................................................................... 12
DOMESTIC SALES VS. EXPORTS .................................................................................................................................................................................... 12 REVENUE & MARGINS.................................................................................................................................................................................................... 12 ASSETS BREAKDOWN .................................................................................................................................................................................................... 13 FINANCIAL LEVERAGE...................................................................................................................................................................................................... 13
FORECASTS & ASSUMPTIONS ..................................................................................................................................................... 14
REVENUE............................................................................................................................................................................................................................ 14 CAPITAL EXPENDITURES ................................................................................................................................................................................................ 14 SHARE CAPITAL ............................................................................................................................................................................................................... 14 NET INCOME ..................................................................................................................................................................................................................... 14
VALUATION .......................................................................................................................................................................................... 15
DISCOUNTED CASH FLOW ANALYSIS ......................................................................................................................................................................... 15 RELATIVE VALUATION ..................................................................................................................................................................................................... 15 CONCLUSION ..................................................................................................................................................................................................................... 15 KMEFIC RECOMMENDATION SCALE .......................................................................................................................................................................... 16
APPENDICES ....................................................................................................................................................................................... 17
BALANCE SHEETS ............................................................................................................................................................................................................ 17 INCOME STATEMENTS .................................................................................................................................................................................................... 17 RATIOS ............................................................................................................................................................................................................................... 18

January 2012
KMEFIC Research
Equity Analysis Report
Yamama Saudi Cement Co.
P a g e | 3
Yamama Saudi Cement Co. Listing: Saudi Stock Exchange (Tadawul) CMP (01-Jan-12): SAR 70.50 Ticker: 3020 *Adjusted CMP: SAR 47.00 Reuters Code: 3020.SE Fair Value: SAR 56.71 Bloomberg Code: YACCO:AB Upside: 20.6% Sector: Cement Recommendation: ACCUMULATE
*Adjusted for the 50% capital increase
Note: The following report is based on the scenario that the 50% capital increase will be approved.
Executive Summary We initiate in this report our coverage of Yamama Saudi Cement Company. Established as a Saudi joint stock company in 1961, Yamama (which commenced operations in 1966) is the second largest producer of cement in Saudi Arabia. The company is primarily engaged in the manufacture and sale of cement and cement related products with a full production capacity of 6.0 million tons per annum (mtpa) of clinker, the equivalent of 6.3 mtpa of cement. Yamama is listed on the Saudi Stock Exchange (Tadawul) with 77.6% of its shares in free float. The stock has outperformed the market index by an impressive 39.0% during the year 2011. In 2010, the company expanded regionally by acquiring a 20% stake in the Yemeni Saudi Cement Company. On the 19th of October 2011, Yamama announced that it will replace five old production lines with a standalone production line. After the project is completed, Yamama’s expected production capacity will be 23,000 tons of clinker per day, or approximately 7.4 mtpa. Saudi Arabia is the largest cement producer in the GCC with a production capacity exceeding 42 mtpa at the end of 2010. The Saudi cement industry enjoys an abundance of limestone reserves at low prices in addition to natural gas subsidies provided by Aramco. This allows Saudi cement companies to enjoy higher gross margins than their GCC peers. On June 6th, 2008, the Ministry of Commerce & Industry took a decision to ban cement exports in order to fix and lower the domestic price of cement. As a result, Saudi cement companies have suffered from escalating clinker inventories during the last 2 years. However, huge government spending on construction projects is expected to fuel cement demand in the Kingdom. The construction sector is foreseen to remain active and will continue to be the major driver for the cement industry. According to BMI, the construction sector is expected to grow at an average rate of 4% (in real terms) over the years 2012 – 2015 due to a healthy project pipeline and strong government support. Yamama’s revenues grew at an average of 8.1% annually over the 2006 – 2010 period and by 12.1% in the first 9 months of 2011 in comparison to the same period last year. Net income declined in 2008 and 2009 but has recovered ever since, growing 16.9% in 2010 and 10.4% in the first 9 months of 2011 in comparison to the same period last year. Revenues reached SAR 1,272 million in 2010 and net income SAR 657 million, a 52% profit margin. Yamama’s assets have grown at an average annual rate of 3.9% over the 2006 – 9M-2011 period, reaching SAR 3,567 million at the end of September 2011. Fixed assets account for the majority of Yamama’s total assets, representing 56% at the end of September 2011. We valued Yamama Cement using two main approaches: Discounted Cash Flow Analysis and Relative Valuation. In order to compute the fair value per share for Yamama Cement, we used a weighted average of the two approaches. We allocated a 40% weight to the discounted cash flow method and equal weights of 30% to the P/E multiple and P/BV multiple valuation methods. We reached a final fair value of SAR 56.71 for the company’s share, representing a 20.6% upside from the current price level (as of 1/1/2012 and adjusted for the 50% capital increase). Accordingly, we issue our report with an “ACCUMULATE” recommendation for Yamama Cement.
Financial Highlights (mil. SAR)
30-Sep-10 30-Sep-11
Total Assets 3,472 3,567
Total Liabilities 483 412
Total Equity 2,989 3,155
9M-2010 9M-2011
Sales 957 1,073
Operating Income 500 555
Net Income 497 549
January 2012
KMEFIC Research
Equity Analysis Report
Yamama Saudi Cement Co.
P a g e | 4
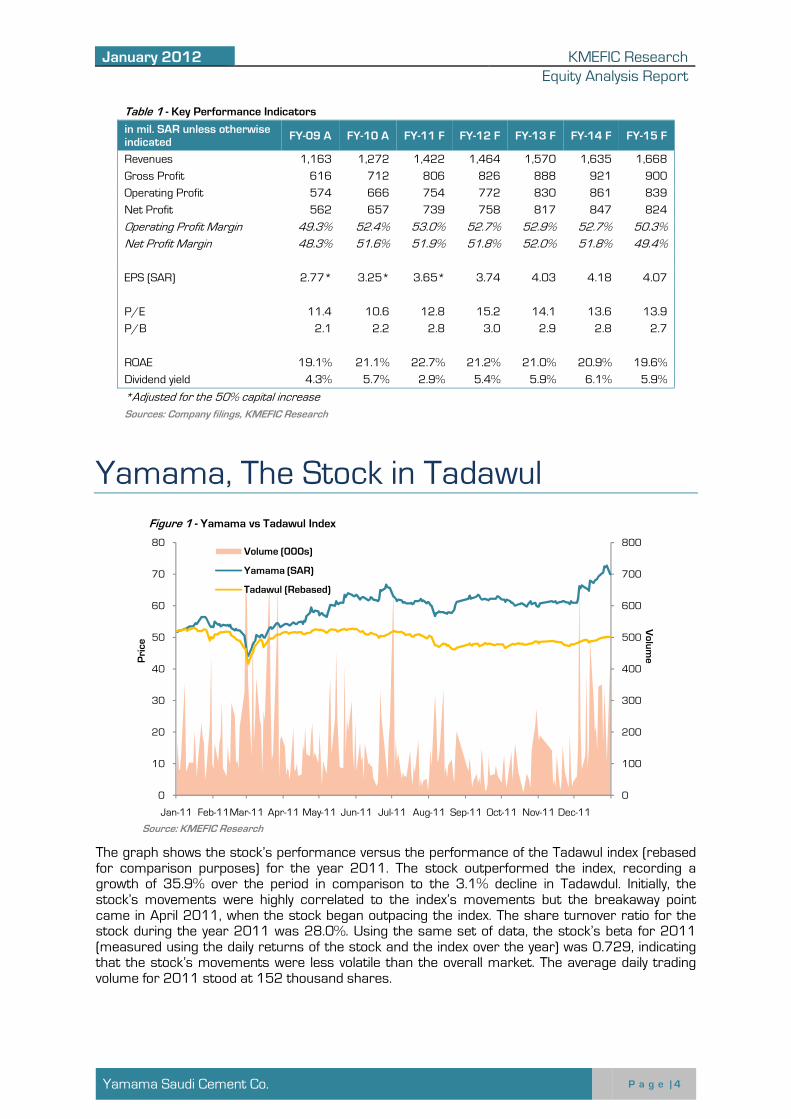
Table 1 - Key Performance Indicators
in mil. SAR unless otherwise indicated
FY-09 A FY-10 A FY-11 F FY-12 F FY-13 F FY-14 F FY-15 F
Revenues 1,163 1,272 1,422 1,464 1,570 1,635 1,668
Gross Profit 616 712 806 826 888 921 900
Operating Profit 574 666 754 772 830 861 839
Net Profit 562 657 739 758 817 847 824
Operating Profit Margin 49.3% 52.4% 53.0% 52.7% 52.9% 52.7% 50.3%
Net Profit Margin 48.3% 51.6% 51.9% 51.8% 52.0% 51.8% 49.4%
EPS (SAR) 2.77* 3.25* 3.65* 3.74 4.03 4.18 4.07
P/E 11.4 10.6 12.8 15.2 14.1 13.6 13.9
P/B 2.1 2.2 2.8 3.0 2.9 2.8 2.7
ROAE 19.1% 21.1% 22.7% 21.2% 21.0% 20.9% 19.6%
Dividend yield 4.3% 5.7% 2.9% 5.4% 5.9% 6.1% 5.9%
*Adjusted for the 50% capital increase
Sources: Company filings, KMEFIC Research
Yamama, The Stock in Tadawul
The graph shows the stock’s performance versus the performance of the Tadawul index (rebased for comparison purposes) for the year 2011. The stock outperformed the index, recording a growth of 35.9% over the period in comparison to the 3.1% decline in Tadawdul. Initially, the stock’s movements were highly correlated to the index’s movements but the breakaway point came in April 2011, when the stock began outpacing the index. The share turnover ratio for the stock during the year 2011 was 28.0%. Using the same set of data, the stock’s beta for 2011 (measured using the daily returns of the stock and the index over the year) was 0.729, indicating that the stock’s movements were less volatile than the overall market. The average daily trading volume for 2011 stood at 152 thousand shares.
0
100
200
300
400
500
600
700
800
0
10
20
30
40
50
60
70
80
Jan-11 Feb-11Mar-11 Apr-11 May-11 Jun-11 Jul-11 Aug-11 Sep-11 Oct-11 Nov-11 Dec-11
Volume
Price
Volume (000s)
Yamama (SAR)
Tadawul (Rebased)
Figure 1 - Yamama vs Tadawul Index
Source: KMEFIC Research

January 2012
Yamama Saudi Cement Co.
Business Profile
Yamama Saudi Cement Company Yamama Saudi Cement Co. is a Saudi joinoperations in 1966. Yamama produces clinker, ordinary Portland cement, and sulfate resisting cement. Its manufacturing facilities are located in Riyadh, with an annualmillion tons of clinker and 6.3 million tons of cement. production lines and the companysingle standalone line in 2015. Yamama is listed on the Saudi Exchange (Tadawul) with 77.6% of its shares in free float. The remaining shares are divided among 3 other shareholders: HH Prince Sultan Mohammed Saud Al Kabir Al Saud(9.7%), General Organization for Social Insurance - Saudi Arabia(7.4%), and The Public Pension Agency (5.3%). As of December 2011, Yamama’s marketcapitalization stood at SAR 9,million.
Expansions & Strategies The company started out with one production line300 tons of clinker. By 1982, Yamama had added four more production lines, bringing the total to five lines that had a daily production capacproduction line in 1991 with a daily production capacity of 3,000 tons of clilatest expansion to production capacity was in 2007production capacity of 10,000 tons of clinker a day. The seventh line brought the total daily production capacity of Yamama to 18,600 tannum (mtpa). On the 27th of April 2011, Yamama’s board of directors met and discussed the feasibility of replacing five of Yamama’s oldest October 2011, the board of directors announced that they have completed the feasibility study and that the results were positive. Consequently, the company began checking for execution offers with specialized companies and further updates are s Apart from replacing older and less efficient production lines with a newer one, the increased capacity brought on by the new production line will help Yamama meet growing domestic demand for cement. The new production line will have a prodday, compared with 5,600 tons provided project is completed (estimated to be in 2015)23,000 tons of clinker per day, As for Yamama’s product portfolio and regional expansions, products to its product portfolio20% stake in the Yemeni Saudi Cement Company, which is expected to begin commercial operations at the end of 2011 with a production capacity of 1.4 million tons of cement a year.
KMEFIC Research
Equity
Business Profile
Yamama Saudi Cement Company
Co. is a Saudi joint stock company established in 1961 and commenced Yamama produces clinker, ordinary Portland cement, and sulfate resisting
manufacturing facilities are located in Riyadh, with an annual production capacity of 6and 6.3 million tons of cement. Its manufacturing facilities consist of
the company currently aims to replace five of its oldest production lines
Yamama is listed on the Saudi Stock Exchange (Tadawul) with 77.6% of its shares in free float. The remaining shares are divided among 3 other
HH Prince Sultan Mohammed Saud Al Kabir Al Saud
, General Organization for Saudi Arabia
Public Pension As of December 28,
2011, Yamama’s market capitalization stood at SAR 9,518
Expansions & Strategies
The company started out with one production line in 1966 that had a daily production capacity o. By 1982, Yamama had added four more production lines, bringing the total to
five lines that had a daily production capacity of 5,600 tons of clinker. Yamama then added another production line in 1991 with a daily production capacity of 3,000 tons of clinker. The company’s latest expansion to production capacity was in 2007, when it added its seventh line that had a daily production capacity of 10,000 tons of clinker a day. The seventh line brought the total daily production capacity of Yamama to 18,600 tons of clinker a day, or equivalently, 6 million tons per
of April 2011, Yamama’s board of directors met and discussed the feasibility of oldest production lines with a standalone production line. On
October 2011, the board of directors announced that they have completed the feasibility study and . Consequently, the company began checking for execution offers with
specialized companies and further updates are still pending.
Apart from replacing older and less efficient production lines with a newer one, the increased capacity brought on by the new production line will help Yamama meet growing domestic demand for cement. The new production line will have a production capacity of 10,000 tons of clinker per day, compared with 5,600 tons provided by the old production lines to be replaced
(estimated to be in 2015), Yamama’s expected production capacity or approximately 7.4 mtpa.
As for Yamama’s product portfolio and regional expansions, the company added two new cement products to its product portfolio in 2009. In 2010, the company expanded regionally 20% stake in the Yemeni Saudi Cement Company, which is expected to begin commercial
with a production capacity of 1.4 million tons of cement a year.
9.70%7.40%
5
77.60%
Figure 2 - Yamama Cement's Ownership Structure
Sources: Zawya, KMEFIC Research
KMEFIC Research
Equity Analysis Report
P a g e | 5
shed in 1961 and commenced Yamama produces clinker, ordinary Portland cement, and sulfate resisting
production capacity of 6.0 Its manufacturing facilities consist of seven
five of its oldest production lines with a
that had a daily production capacity of . By 1982, Yamama had added four more production lines, bringing the total to
ity of 5,600 tons of clinker. Yamama then added another nker. The company’s
when it added its seventh line that had a daily production capacity of 10,000 tons of clinker a day. The seventh line brought the total daily
ons of clinker a day, or equivalently, 6 million tons per
of April 2011, Yamama’s board of directors met and discussed the feasibility of production lines with a standalone production line. On the 19th of
October 2011, the board of directors announced that they have completed the feasibility study and . Consequently, the company began checking for execution offers with
Apart from replacing older and less efficient production lines with a newer one, the increased capacity brought on by the new production line will help Yamama meet growing domestic demand
uction capacity of 10,000 tons of clinker per to be replaced. After the
, Yamama’s expected production capacity will reach
the company added two new cement he company expanded regionally by acquiring a
20% stake in the Yemeni Saudi Cement Company, which is expected to begin commercial with a production capacity of 1.4 million tons of cement a year.
%
5.30%
Yamama Cement's Ownership Structure
HH Prince Sultan Mohammed Saud Al Kabir Al Saud
General Organization for Social Insurance -Saudi ArabiaPublic Pension Agency
Public

January 2012
KMEFIC Research
Equity Analysis Report
Yamama Saudi Cement Co.
P a g e | 6
One of the company's key strategies is to continually improve its information systems and to keep up with the rapid pace of development in the industry. As a result, the company contracted with a private consulting firm in 2010 to study and implement an integrated information system named “YES” with the goal of improving efficiency by reducing time and costs. The system will help the company organize various information as well as speed up the information sharing process between different departments.
Industry: Overview & Outlook
Cement
Introduction
The term "cement" most commonly refers to hydraulic cement. A fine grey powder made of a combination of calcined limestone and clay, cement is mixed with water and sand to make mortar or with water, sand, and aggregate to make concrete. The most common type of cement around the world is Portland cement and was first created by bricklayer Joseph Aspdin in 1824. Portland cement, the fundamental ingredient of concrete, is a closely monitored chemical combination of calcium, silicon, aluminum, iron, and small amounts of other ingredients. Gypsum, a very soft mineral composed of calcium sulfate dihydrate, is added in the final grinding process to regulate the setting time of the concrete.
Uses of Cement The most common use for Portland cement is in the production of concrete. In its simplest form, concrete is a mixture of paste and aggregates (sand, gravel, and crushed stone). The paste, composed of Portland cement and water, coats the surface of the fine (sand) and coarse (gravel or crushed stone) aggregates. Through a chemical reaction called hydration, the paste hardens and gains strength to form the rock-like mass known as concrete. Concrete is composed of 6% air, 11% Portland cement, 41% gravel or crushed stone (coarse aggregate), 26% sand (fine aggregate), and 16% water. (Source: Portland Cement Association). Cement is of vital importance to the construction industry as it is the main ingredient in the production of concrete. Typically, concrete is the essential material used in all types of construction (residential housing, non-residential offices, roads, bridges, etc.), making cement the most significant input to the construction industry. In the long term, cement consumption has increased and will continue to increase due to the rise in construction brought on by population growth.
Cement around the World According to the 9th edition of the Global Cement Report, global cement consumption grew 9.9% in 2010 to reach 3,294 million tons. There are about 149 cement producing nations with China and India crowning the top producers’ as well as the top consumers’ lists. Due to the large costs associated with transporting cement across nations, traded cement amounted for only 5% of the total cement produced worldwide in 2010. Lastly, Bangladesh was the largest importer of cement and Turkey was the largest exporter.
Transportation & Costs Cement, being a bulk commodity, is freight intensive and transporting it over long distances can prove to be uneconomical. Every ton of cement manufactured involves the transportation of 1.6 tons of limestone, 0.25 tons of coal, 0.05 tons of gypsum, and 1 ton of the finished product. It is

January 2012
Yamama Saudi Cement Co.
Quarry
• Cement is made from rawmost common combinationclay and sand (as sources• Limstone and clay are blasted• Rock blasted from the quarrychunks approzimately 1 1/
Prportioning, Blending & Grinding
• The raw materials are analyzed• Plants grind the raw materialsrotating table. The grinded
Preheater Tower
• The preheater tower supportstheir way to the kiln.• To save engery, modern cementkiln heat the raw materials
Kiln
• Raw materials enter a hugehorizontally sloped steel cylinder,the world's largest piece of• Inside the kiln, temperaturesthat are about 3-4 cemtimeters
Clinker Cooling & Grinding
• The clinker is cooled on athe tube rotates, the steel• A small amount of gypsum
Bagging & Shipping
• From the grinding mills, theby trucks, rail, or bage. However,amounts or for special uses
estimated that freight expenses account for about 18% of the total cost. This has resulted in cement being largely a regional play. Furthermore, the cement industry is power intensive and it is estimated that about 120 kWh of power is required to produce one
Cement Manufacturing Process Put simply, cement is manufactured by combining a uniform blend of carefully proportioned raw materials (chalk and clay/shale) at a very high tempermaterials fuse together to form “clinker,” a hard granular material. Clinker is ground to a powder along with gypsum to make cement. By altering the chemistry of the raw material and selecting specific materials for grinding alongside the clinker and gypsum, different types of cement can be made with properties suited to their intended use. (Source: CEMEX) A more detailed & technical explanation of the cement manufacturing process is presented in the following figure.
KMEFIC Research
Equity
raw materials containing four essential minerals: calcium, silicon,combination of raw materials is limestone (for calcium) coupled with
of silica, aluminum, and iron).blasted from rock quarries by boring the rock and setting off explosivesquarry is transported to the crushers, where it is reduced/2 inches in size.
analyzed in the labortory and blended in the proper proportionmaterials with heavy, wheel-type rollers that crush the materials
material is now ready for the kiln or preheater, depending
supports a series of vertical cyclone chambers through which
cement plants preheat the materials before they enter thematerials as they swirl in the cyclones.
huge rotating furnance called a kiln. It's the heart of thecylinder, lined with firebrick, turning about one to three revolutionsof moving industrial equipment.
temperatures of about 1500°C transform the raw materials into clinkercemtimeters in diameter.
grate and is then ground in a ball mill - a horizontal steelballs tubble and crush the clinker into super-fine powder known
gypsum is added during the final grinding to extend the cement's setting
the cement is conveyed to silos where it awaits shipment. MostHowever, a small percentage of the cement is bagged for customersuses such as mortar.
estimated that freight expenses account for about 18% of the total cost. This has resulted in cement being largely a regional play. Furthermore, the cement industry is power intensive and it is
imated that about 120 kWh of power is required to produce one ton of cement.
Cement Manufacturing Process
Put simply, cement is manufactured by combining a uniform blend of carefully proportioned raw materials (chalk and clay/shale) at a very high temperature (1400 °C) in a rotary kiln. The raw materials fuse together to form “clinker,” a hard granular material. Clinker is ground to a powder along with gypsum to make cement. By altering the chemistry of the raw material and selecting
r grinding alongside the clinker and gypsum, different types of cement can be made with properties suited to their intended use. (Source: CEMEX)
A more detailed & technical explanation of the cement manufacturing process is presented in the
Source: Portland Cement Association (PCA)
KMEFIC Research
Equity Analysis Report
P a g e | 7
silicon, aluminum, and iron. Thewith much smaller quantities of
explosives.reduced by crushing or pounding to
proportion.materials into powder against a
depending on plant type.
which the raw materials pass on
the kiln. Hot exit gases from the
cement making process - arevolutions per minute. The kiln is
clinker: small, dark grey nodules
tube filled with steel balls. Asknown as Portland cement.setting time.
Most cement is shipped in bulkcustomers who need only small
estimated that freight expenses account for about 18% of the total cost. This has resulted in cement being largely a regional play. Furthermore, the cement industry is power intensive and it is
of cement.
Put simply, cement is manufactured by combining a uniform blend of carefully proportioned raw ature (1400 °C) in a rotary kiln. The raw
materials fuse together to form “clinker,” a hard granular material. Clinker is ground to a powder along with gypsum to make cement. By altering the chemistry of the raw material and selecting
r grinding alongside the clinker and gypsum, different types of cement can be
A more detailed & technical explanation of the cement manufacturing process is presented in the
Source: Portland Cement Association (PCA)

January 2012
KMEFIC Research
Equity Analysis Report
Yamama Saudi Cement Co.
P a g e | 8
Saudi Cement Industry Saudi Arabia is the largest cement producer in the GCC with a production capacity exceeding 42 mtpa at the end of 2010. The Saudi cement industry enjoys an abundance of limestone reserves at low prices in addition to natural gas subsidies provided by Aramco. This allows Saudi cement companies to enjoy higher gross margins than their GCC competitors. Saudi cement companies have raised a request to increase the natural gas subsidies in order to meet growing domestic cement demand caused by new expansions. On June 6th, 2008, the Ministry of Commerce & Industry took a decision to ban cement exports in order to fix and lower the domestic price of cement. The ban also called for cement companies to maintain 10% of their total cement production in reserves. However, a lot of the companies did not respond to this request despite strong governmental support in the form of low interest rate loans (from the Saudi Industrial Development Fund - SIDF) as well as obtaining quarries at low prices. As a result of the export ban, Saudi cement companies suffered from escalating clinker inventories during 2008 and 2009. Clinker inventory reached 10.9 million tons at the end of 2009, and 7.4 million tons in 2008 against 1.7 million at the end of 2007. In an attempt to curb piling clinker inventories, a lot of the cement companies have shut down some of their production lines. As a result of this step, and in an atmosphere of growing domestic demand due to huge infrastructural projects, clinker inventories of Saudi cement companies fell 0.8 million tons to reach 10.0 million tons at the end of 2010.
Saudi Cement Industry Performance
Table 2 - Total Domestic Volume Sales of Cement (thousand tons)
2010
Jan - Nov 2011
Jan - Nov Growth
% of Total Domestic Sales Jan - Nov 2011
Yamamah Saudi Cement Co. 4,998 5,442 8.9% 13.3%
Saudi Cement Co. 5,389 6,049 12.2% 14.3%
Eastern Province Cement 2,664 2,887 8.4% 7.1%
Qassim Cement Co. 3,831 3,887 1.5% 10.2%
Yanbu Cement Co. 3,536 4,010 13.4% 9.4%
Arabian Cement Co. 2,906 3,473 19.5% 7.7%
Southern Province Cement 4,803 6,142 27.9% 12.8%
Tabuk Cement Co. 1,207 1,455 20.5% 3.2%
Riyadh Cement Co. 2,313 3,032 31.1% 6.2%
Najran Cement Co. 2,749 2,732 -0.6% 7.3%
Al Madina Cement Co. 1,859 1,664 -10.5% 4.9%
Northern Cement Co. 1,005 641 -36.2% 2.7%
Al Jouf Cement Co. 324 1,061 227.5% 0.9%
Total 37,584 42,475 13.0% 100.0%
Source: Yamama Cement
Total domestic demand for cement improved and recorded a notable YoY growth of 13% in sales volume, reaching 42.5 million tons in the first 11 months of 2011 against 37.6 million tons for the same period last year. Saudi Cement Co. had the highest % of total domestic sales (at 14.3%) followed by Yamama Cement (at 13.3%).

January 2012
Yamama Saudi Cement Co.
Table 3 - Total Production of Cement (thousand ton
Yamamah Saudi Cement Co.
Saudi Cement Co.
Eastern Province Cement
Qassim Cement Co.
Yanbu Cement Co.
Arabian Cement Co.
Southern Province Cement
Tabuk Cement Co.
Riyadh Cement Co.
Najran Cement Co.
Al Madina Cement Co.
Northern Cement Co.
Al Jouf Cement Co.
Total
Source: Yamama Cement
Total cement production of the Saudi cement companies reached 43.8 million tons in the first 11 months of 2011, up 12.1% from the same period last year. Saudi Cement Co. had the highest % of total domestic production (at 15.9
Looking at the corporate results of Tadawul’s cement Saudi cement companies was strong during the first not included in this analysis due to the absence of historical financials as it is a newly listed company). Total revenue of the nine listed companies of 2011, growing 18.6% YoY. FurtheYoY growth of 21.3% and 19.3SAR 3.4 billion. The average profit margin of the companies stood at 45.2%,and raw material costs.
0
200
400
600
800
1,000
1,200
1,400
Al Jouf Cement Co.
Arabian Cement Co.
Eastern Province Cement
Source: KMEFIC Research
Figure 3 - Financial performance of Saudi cement companies for the period
KMEFIC Research
Equity
Total Production of Cement (thousand tons)
2010 Jan - Nov
2011 Jan - Nov
Growth % of Total Production
Jan - Nov 2011
Yamamah Saudi Cement Co. 5,032 5,423 7.8% 12.9%
6,231 6,529 4.8% 15.9%
Eastern Province Cement 2,864 3,044 6.3% 7.3%
3,850 3,935 2.2% 9.8%
3,516 4,024 14.4% 9.0%
2,910 3,483 19.7% 7.4%
Southern Province Cement 4,794 6,094 27.1% 12.3%
1,228 1,429 16.4% 3.1%
2,344 3,100 32.3% 6.0%
2,761 2,726 -1.3% 7.1%
1,864 1,684 -9.7% 4.8%
1,321 1,059 -19.8% 3.4%
415 1,319 217.8% 1.1%
39,130 43,849 12.1% 100.0%
Total cement production of the Saudi cement companies reached 43.8 million tons in the first 11 months of 2011, up 12.1% from the same period last year. Saudi Cement Co. had the highest % of
15.9%) followed by Yamama Cement (at 12.9%).
Looking at the corporate results of Tadawul’s cement industry, the performance of the nine listed Saudi cement companies was strong during the first 9 months of 2011 (note: Hail Cement was not included in this analysis due to the absence of historical financials as it is a newly listed
. Total revenue of the nine listed companies reached SAR 7.1 billion for the first 9 months . Furthermore, operating profit and net income witnessed significant
21.3% and 19.3% respectively, with total net income of the companies reaching The average profit margin of the companies stood at 45.2%, reflecting
Eastern Province Cement
Qassim Cement Co.
Saudi Cement Co.
Southern Province Cement
Tabuk Cement Co.
Cement Co.
Revenue Operating Income Net Income
Financial performance of Saudi cement companies for the period 9M-2011 (SAR Millions)
KMEFIC Research
Equity Analysis Report
P a g e | 9
% of Total Production
Nov 2011
12.9%
15.9%
7.3%
9.8%
9.0%
7.4%
12.3%
3.1%
6.0%
7.1%
4.8%
3.4%
1.1%
100.0%
Total cement production of the Saudi cement companies reached 43.8 million tons in the first 11 months of 2011, up 12.1% from the same period last year. Saudi Cement Co. had the highest % of
%).
, the performance of the nine listed (note: Hail Cement was
not included in this analysis due to the absence of historical financials as it is a newly listed reached SAR 7.1 billion for the first 9 months
witnessed significant , with total net income of the companies reaching
reflecting low energy
Yamamah Saudi
Cement Co.
Yanbu Cement Co.
(SAR Millions)

January 2012
KMEFIC Research
Equity Analysis Report
Yamama Saudi Cement Co.
P a g e | 10
Key Drivers: Cement Demand
Construction Sector According to the latest Saudi Arabia Infrastructure Report published by Business Monitor International (BMI), the Kingdom’s construction industry is set to grow 4.1% this year to reach SAR 87 billion ($23.2 billion). The construction sector in Saudi Arabia accounted for 6.9% of the country’s gross domestic product (GDP) in 2010, with a growth of 3.7% YoY. During the first quarter of 2011, the value of contracts awarded by the government grew five folds over the same period last year. A report by National Commercial Bank estimates the total value of these contracts to be around SAR 49.7 billion ($13.5 billion), with the majority of them in the oil and gas sectors.
Construction Projects According to industry experts, Saudi Arabia, Qatar, and Abu Dhabi are attracting the bulk of projects in the region. The construction boom in Saudi Arabia is a result of increased government spending and through the establishment of six ‘’economic cities’’ in different regions of the country. In addition, the Kingdom is planning to spend USD 373 billion between 2010 and 2014 on social development and infrastructure projects to advance Saudi Arabia’s economic development (Source: CIA - The World Fact Book). Table 4 shows a list of some major construction projects in the Kingdom.
Table 4 - Major Ongoing Construction Projects in Saudi Arabia
Project Name Value (USD Billion)
Completion Date
Modon - Sudair Industrial City 40 2028
KHC - Kingdom Tower 30 TBA
Gulf Cooperation Council - GCC Rail Network 30 2017
SAGIA - Jazan Economic City 27 2037
SAGIA - King Abdullah Economic City (KAEC) 27 2026
SAGIA - Ras Al Zour Economic City 25 2020
Sadara Chemical Company - Jubail Petrochemicals Complex 20 2015
SATORP - Jubail Refinery and Petrochemical Complex 14 Dec-13
Khuzam Real Estate Company - Qasr Khuzam 13 2014
Saudi Kayan - Jubail Petrochemicals Complex 12.5 H2-2013
Source: Zawya projects
Population According to the Central Department of Statistics and Information, the population distribution in 2009 showed that 66% of the Saudi population was aged 30 years or less; indicative of an increase in housing demand in the future. The International Monetary Fund (IMF) expects the Saudi population to grow 2.2% in 2011 and at an average rate of 2.1% over the next five years. Furthermore, King Abdulla bin Abdulaziz ordered in 2011 the construction of 500,000 housing units, the building of hospitals, and an increase in mortgage lending. These factors will consequently increase the demand for cement (both directly and indirectly).
Positive Outlook The Saudi cement industry witnessed an increase in output to meet market demand caused by the government's continued spending on mega infrastructural projects. It is expected that Saudi cement companies should be able to satisfy the market’s demand through new expansions or restorations of stopped production lines.
January 2012
Yamama Saudi Cement Co.
The construction sector is foreseen tothe cement industry. According to Business Monitor Internationalexpected to grow at an average rate of 4healthy project pipeline and strong government support. Lastly, the 2022 World Cup being hosted in Qatar will stimulate demand for cement as well as other construction materials. Saudi Arabia stands to benefit from this increased demand as it borders Qatar (the only country that does), putting Saudi cement companies in a good position to meet the excess demand of cement.
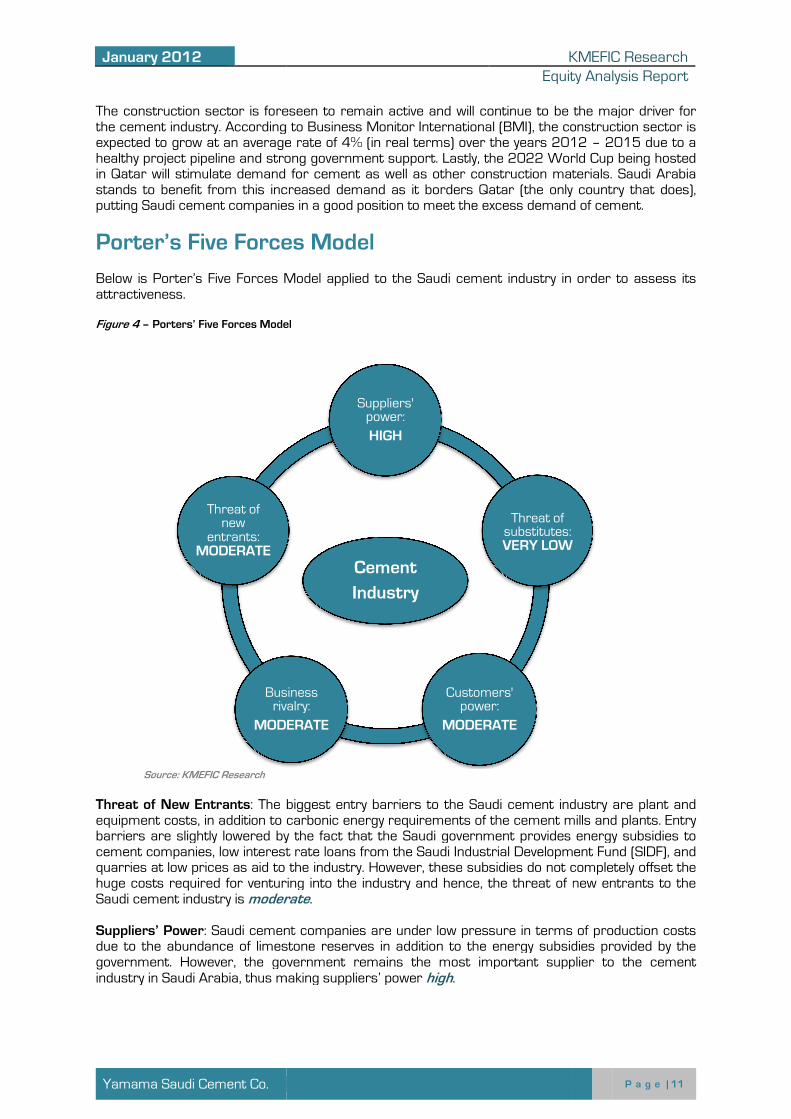
Porter’s Five Forces Model Below is Porter’s Five Forces Model applied to the attractiveness. Figure 4 – Porters’ Five Forces Model
Source: KMEFIC Research
Threat of New Entrants: The biggest entry barriers to the Saudi cement industry are plant and equipment costs, in addition to carbonic energy requirements of the cement mills and plants. Entry barriers are slightly lowered by the fact that the Saudi government provides energy subcement companies, low interest ratequarries at low prices as aid to the industry. However, these subsidies do not completely offset the huge costs required for venturing into the indusSaudi cement industry is moderate Suppliers’ Power: Saudi cement companies are under low due to the abundance of limestone reservesgovernment. However, the government remains the most important supplier industry in Saudi Arabia, thus making suppliers’ power
Business rivalry:
MODERATE
Threat of new
entrants:MODERATE
KMEFIC Research
Equity
is foreseen to remain active and will continue to be the major driver for the cement industry. According to Business Monitor International (BMI), the construction sector is expected to grow at an average rate of 4% (in real terms) over the years 2012 healthy project pipeline and strong government support. Lastly, the 2022 World Cup being hosted in Qatar will stimulate demand for cement as well as other construction materials. Saudi Arabia
benefit from this increased demand as it borders Qatar (the only country that does), putting Saudi cement companies in a good position to meet the excess demand of cement.
Porter’s Five Forces Model
Below is Porter’s Five Forces Model applied to the Saudi cement industry in order to assess its
Porters’ Five Forces Model
The biggest entry barriers to the Saudi cement industry are plant and equipment costs, in addition to carbonic energy requirements of the cement mills and plants. Entry barriers are slightly lowered by the fact that the Saudi government provides energy sub
low interest rate loans from the Saudi Industrial Development Fund (SIDF), and as aid to the industry. However, these subsidies do not completely offset the for venturing into the industry and hence, the threat of new entrants to the
moderate.
cement companies are under low pressure in terms of abundance of limestone reserves in addition to the energy subsidies. However, the government remains the most important supplier
industry in Saudi Arabia, thus making suppliers’ power high.
Cement
Industry
Suppliers' power:
HIGH
Threat of substitutes: VERY LOW
Customers' power:
MODERATE
Business rivalry:
MODERATE
KMEFIC Research
Equity Analysis Report
P a g e | 11
remain active and will continue to be the major driver for , the construction sector is
2012 – 2015 due to a healthy project pipeline and strong government support. Lastly, the 2022 World Cup being hosted in Qatar will stimulate demand for cement as well as other construction materials. Saudi Arabia
benefit from this increased demand as it borders Qatar (the only country that does), putting Saudi cement companies in a good position to meet the excess demand of cement.
Saudi cement industry in order to assess its
The biggest entry barriers to the Saudi cement industry are plant and equipment costs, in addition to carbonic energy requirements of the cement mills and plants. Entry barriers are slightly lowered by the fact that the Saudi government provides energy subsidies to
loans from the Saudi Industrial Development Fund (SIDF), and as aid to the industry. However, these subsidies do not completely offset the
try and hence, the threat of new entrants to the
terms of production costs energy subsidies provided by the
. However, the government remains the most important supplier to the cement
substitutes:

January 2012
Yamama Saudi Cement Co.
Customers’ Power: A lot of the Saudi cement companies hlines due to the export ban placed on cement. This reduction increase in demand due to the huge ongoing infrastructurdemand weakens customers’ power, the standardized nature of the product (cement) raises their power due to very low switching costs. Thus, customers’ power in the Saudi cement industry is moderate. Threat of Substitutes: Cement is a necessary input in most types of construction, and there is no real substitute for it in such projects. Thu Business Rivalry: The large number of competing firms (13 to be exact) in the Saudi cement industry as well as the standardized nature of the product (cement) intensifies competition. However, an increase in total cement production is being met with an increase in sales volume due to growing demand. This makes price wars among the cement companiesfirms do not have to compete fiercely for market share due to the Firms are able to improve revenues simply because of the expanding market. companies are geographical dispersed due Saudi cement industry is moderate
Financial Performance
Domestic Sales vs. Exports Yamama’s sales volume has been iupward trend over the 2007 period, growing on average 6.2% a year to reach 5.5 million tons in 2010. Exports volume faded away after 2008 following the government’s decision to ban cement exports in June 2008 and all subsequent sales volume were domestic. This did not impact Yamama as domestic sales volume grew 28% YoY and 5.4% in 2010, largely due to the hike in cement demand across the Kingdom. Yamama’s sales volume in the first 11 months of 2011 reached 5.4 million tons, growing 8.9% YoY and slightly below the industry’s average sales volume growth
Revenue & Margins Revenues grew at an average of 8.1% annually over the 2006 – 2010 period and grew 12.1% in the first 9 months of 2011 in comparison to the same period last year. Net income declined in 2008 and 2009 but has recovered ever since, growing 16.9% in 2010 and 10.4% in the first 9 months of 2011 in comparison to the same period last year. Revenues reached SAR 1,272 million in 2010 and net income SAR 657 millionrepresenting a 52% profit margin. Yamama’s profit margin has declined over time, going from 63% in 2006 to
KMEFIC Research
Equity
4.3 4.15.2
0.3 0.3
0.0
0.0
1.0
2.0
3.0
4.0
5.0
6.0
2007 2008 2009Sources: Company filings, KMEFIC Research
Figure 5 - Domestic Sales Volume vs Exports Volume (mtpa)
of the Saudi cement companies have shut down some of their production lines due to the export ban placed on cement. This reduction in supply is being coupled with an increase in demand due to the huge ongoing infrastructural projects. While the possibility of excess
mers’ power, the standardized nature of the product (cement) raises their power due to very low switching costs. Thus, customers’ power in the Saudi cement industry is
Cement is a necessary input in most types of construction, and there is no substitute for it in such projects. Thus, the threat of substitutes is very low
The large number of competing firms (13 to be exact) in the Saudi cement dustry as well as the standardized nature of the product (cement) intensifies competition.
However, an increase in total cement production is being met with an increase in sales volume due to growing demand. This makes price wars among the cement companies firms do not have to compete fiercely for market share due to the nature of the growing industry. Firms are able to improve revenues simply because of the expanding market. companies are geographical dispersed due to the Kingdom’s size. Thus the business rivalry in
moderate.
Financial Performance
Domestic Sales vs. Exports
Yamama’s sales volume has been in an the 2007 – 2010
6.2% a year to reach 5.5 million tons in 2010. Exports volume faded away after 2008 following the government’s decision to
in June 2008 and all subsequent sales volume were domestic. This did not impact Yamama as domestic
YoY in 2009 and 5.4% in 2010, largely due to the hike in cement demand across the Kingdom. Yamama’s sales volume in the first 11 months of 2011 reached 5.4 million tons, growing 8.9% YoY and slightly below the industry’s average sales volume growth of 13%.
Revenue & Margins
Revenues grew at an average of 8.1% 2010 period
and grew 12.1% in the first 9 months of 2011 in comparison to the same period
Net income declined in 2008 and 2009 but has recovered ever since, growing 16.9% in 2010 and 10.4% in the first 9 months of 2011 in comparison to the same period last year. Revenues reached SAR 1,272 million in 2010 and net income SAR 657 million,
ting a 52% profit margin. Yamama’s profit margin has declined
63% in 2006 to
63% 62%
54%48%
0
200
400
600
800
1,000
1,200
1,400
SAR Millions
Revenue Net income
Sources: Company filings, KMEFIC Research
Figure 6 - Revenues, Net Income, and Profit Margin
KMEFIC Research
Equity Analysis Report
P a g e | 12
5.5
0.0
2010
Exports
Domestic Sales
Research
Domestic Sales Volume vs Exports Volume (mtpa)
ave shut down some of their production supply is being coupled with an While the possibility of excess
mers’ power, the standardized nature of the product (cement) raises their power due to very low switching costs. Thus, customers’ power in the Saudi cement industry is
Cement is a necessary input in most types of construction, and there is no low.
The large number of competing firms (13 to be exact) in the Saudi cement dustry as well as the standardized nature of the product (cement) intensifies competition.
However, an increase in total cement production is being met with an increase in sales volume due unlikely. Additionally,
nature of the growing industry. Firms are able to improve revenues simply because of the expanding market. Furthermore, the
the business rivalry in the
Yamama’s sales volume in the first 11 months of 2011 reached 5.4 million tons, growing 8.9%
52% 51%
0%
10%
20%
30%
40%
50%
60%
70%
Net income Profit margin
Research
Revenues, Net Income, and Profit Margin

January 2012
Yamama Saudi Cement Co.
51% in the first 9 months of 2011sales (caused by the entrance of new competitors as well as companies are associated with high fixed costs and a contraction in sales can hurt margins. In addition, Yamama conducted maintenance on some of its production lineslifted fixed costs. Lastly, the com2007 and its cost was transferred to the company’s fixed assets, leading to higher depreciation in subsequent years. The export ban in 2008 led to a buildup of inventory industry and this excess supply caused cement prices toYamama’s margins that year. However, prices began to recover ever since and this is reflected inthe improvement of Yamama’s profit margin in 2010. identical to its profit margin over the 2006 the majority of the company’s income were minimal and had no material
Assets Breakdown Yamama’s assets have grown at an average annual rate of 3.9% over the 2006 – 9M-2011 period, reaching SAR 3,567 million at the end of September 2011. Fixed assets account for the majority of Yamama’s total assets, representing 56% at the end of September 2011. The company has a strong cash position with cash and cash equivalents standing at SAR 639 million at the end of September 2011 and representing 18% of total assets.growth, expanding at a compounded annual growth rate (CAGR) of 20.9% over the 2006 2011 period.
Financial Leverage
Table 5 - Leverage & Interest Coverage
Debt/Equity
Interest Coverage
Sources: Company filings, KMEFIC Research
Yamama was debt free in 2003 but expenditures. Its seventh and latest production line was completed in 2007 and the company has been deleveraging itself ever since 2005, with debtthe end of September 2011. The company’s interest coverage ratio has been strong entire period and stood at an outstanding 195x for the first 9 months of 2011.
KMEFIC Research
Equity
51% in the first 9 months of 2011. The first big decline took place in 2008 and was due to lower sales (caused by the entrance of new competitors as well as the export ban on cementcompanies are associated with high fixed costs and a contraction in sales can hurt margins. In addition, Yamama conducted maintenance on some of its production lines in 2008 lifted fixed costs. Lastly, the company completed construction of its seventh2007 and its cost was transferred to the company’s fixed assets, leading to higher depreciation in subsequent years. The export ban in 2008 led to a buildup of inventory in the Saudi cement
excess supply caused cement prices to decline in 2009, Yamama’s margins that year. However, prices began to recover ever since and this is reflected in
Yamama’s profit margin in 2010. Yamama’s operating margin was virtually identical to its profit margin over the 2006 – 9M-2011 period. This was largely due to the fact that the majority of the company’s income originated from operating activities; its other gains/losses were minimal and had no material impact on the company’s bottom line.
Assets Breakdown
representing 18% of total assets. The company’s cash position has experienced exceptional at a compounded annual growth rate (CAGR) of 20.9% over the 2006
Leverage & Interest Coverage
2006 2007 2008 2009 2010
39.3% 21.1% 19.8% 13.8% 8.5%
- - 50.5x 45.2x 115.3x
Sources: Company filings, KMEFIC Research
Yamama was debt free in 2003 but borrowed funds in 2004 and 2005 in order to fund its capital latest production line was completed in 2007 and the company has
been deleveraging itself ever since 2005, with debt-to-equity declining from 39% in 2006 to 6% at the end of September 2011. The company’s interest coverage ratio has been strong entire period and stood at an outstanding 195x for the first 9 months of 2011.
0
500
1,000
1,500
2,000
2,500
3,000
3,500
4,000
2007 2008 2009 2010
Figure 7 - Assets Breakdown (SAR Millions)
Sources: Company filings, KMEFIC Research
KMEFIC Research
Equity Analysis Report
P a g e | 13
in 2008 and was due to lower on cement). Cement
companies are associated with high fixed costs and a contraction in sales can hurt margins. In in 2008 that further
seventh production line in 2007 and its cost was transferred to the company’s fixed assets, leading to higher depreciation in
in the Saudi cement decline in 2009, adversely affecting
Yamama’s margins that year. However, prices began to recover ever since and this is reflected in ing margin was virtually
This was largely due to the fact that from operating activities; its other gains/losses
The company’s cash position has experienced exceptional at a compounded annual growth rate (CAGR) of 20.9% over the 2006 – 9M-
9M-2011
8.5% 6.0%
115.3x 195.0x
borrowed funds in 2004 and 2005 in order to fund its capital latest production line was completed in 2007 and the company has
equity declining from 39% in 2006 to 6% at the end of September 2011. The company’s interest coverage ratio has been strong over the entire period and stood at an outstanding 195x for the first 9 months of 2011.
9M-2011
Other Assets
Inventory
Recievables & Prepayments
Investments
Cash
Fixed Assets

January 2012
KMEFIC Research
Equity Analysis Report
Yamama Saudi Cement Co.
P a g e | 14
Forecasts & Assumptions
Revenue We broke down the company’s annual historical revenue into average cement price per ton (for the year) and sales volume (in million tons per annum). This allowed us to isolate the effects on revenue caused by price fluctuations and sales growth. We expect sales volume to grow at an average annual rate of 4% over the next 2 years, in line with BMI’s (Business Monitor International) forecast for real construction industry growth in the Kingdom (the main driver of cement demand). However, we expect sales volume to level off after 2013 due to Yamama Cement reaching its maximum production capacity of 6.3 mtpa. We anticipate a small decline in Yamama’s average cement price per ton in 2012 due to new cement firms entering the market but expect average prices to increase moderately afterwards due to growing cement demand. Lastly, Yamama’s new planned production line (that will replace five of its older production lines) is not scheduled to be completed until 2015 and thus will have no effect on revenues over the forecast period. Based on the these assumptions and other relevant factors, we forecast revenues to grow during the 2010 – 2015 period at a compounded annual growth rate (CAGR) of 5.57% to reach SAR 1,668 million in 2015.
Capital Expenditures On the 19th of October 2011, Yamama announced that they will proceed with their intended cement plant restoration. The project aims to replace five of Yamama’s oldest production lines (that have a production capacity of 5,600 tons of clinker per day) with a standalone production line (that will have a production capacity of 10,000 tons of clinker per day). We have incorporated the planned project into our forecasts and valuation by taking the following assumptions:
• The new production line will cost approximately SAR 1.5 billion.
• Yamama will not pay a cash dividend for the 2nd half of 2011 but will alternatively issue 1-to-2 bonus shares (which has already been submitted to the general assembly for approval by the board of directors). The cash will instead be utilized to help finance the production line.
• Also to help the company finance the production line, Yamama will borrow part of the project’s cost.
Share Capital We have assumed that the proposed 1-to-2 bonus shares will be approved by the general assembly and will take place in 2012, raising Yamama’s number of shares outstanding to 202.5 million and its share capital to SAR 2,025 million.
Net Income We forecast net income to grow at a compounded annual growth rate (CAGR) of 4.65% over the 2010 – 2015 period to reach SAR 824.5 million in 2015.

January 2012
KMEFIC Research
Equity Analysis Report
Yamama Saudi Cement Co.
P a g e | 15
Valuation We valued Yamama Cement using two main approaches: Discounted Cash Flow Analysis and Relative Valuation.
Discounted Cash Flow Analysis Discounted Cash Flow Analysis was used to discount the company’s forecasted Free Cash Flows to Firm. We applied a top down approach by firstly taking into account all relevant factors to estimate the company’s primary sources of income. These estimates were then coupled with forecasts of expenses in order to work out the company’s operating profits and net profits over the forecast horizon. Capital expenditures and variations in working capital requirements were taken into account when computing Enterprise Value. Adjustments for debt, investments in associates, and cash & cash equivalents were made to compute the company’s equity value. We used a WACC of 9.3% in our DCF Analysis (the CAPM was used to compute the cost of equity) and the terminal growth rate was set to 1.5%. Our DCF model yielded an estimated fair value of SAR 60.57 per share, representing a 28.9% upside to Yamama’s closing share price (adjusted for the 50% capital increase) on the 1st of January, 2012.
Relative Valuation In our relative valuation model, we used the industry’s trailing P/E ratio and P/BV ratio. Based on Yamama’s forecasted EPS in 2011 and the trailing P/E for the industry, we reached a fair value of SAR 52.64 per share, representing an upside of 12.0%. Similarly, based on the forecasted BVPS in 2011 and the trailing P/BV for the industry, we obtained a fair value of SAR 55.62 per share, representing an upside of 18.3%.
Conclusion In order to compute the fair value per share for Yamama Cement, we used a weighted average of the previously mentioned valuation approaches. We allocated a 40% weight to the discounted cash flow method and equal weights of 30% to the P/E multiple and P/BV multiple valuation methods. We reached a final fair value of SAR 56.71 for the company’s share, representing a 20.6% upside from the current price level (as of the 1st of January, 2012 and adjusted for the 50% capital increase). Accordingly, we issue an “ACCUMULATE” recommendation for Yamama Cement.
Table 6 - Yamama Cement Fair Value per Share
Method Value Weight Weighted Value
DCF - FCF to firm 60.57 40% 24.23
Relatives - P/E 52.64 30% 15.79
Relatives - P/B 55.62 30% 16.69
Fair value per share 56.71
Current market price* (as of 1/1/2012)
47.00
Potential upside / (downside) 20.6%
*Adjusted for the 50% capital increase
January 2012
KMEFIC Research
Equity Analysis Report
Yamama Saudi Cement Co.
P a g e | 16
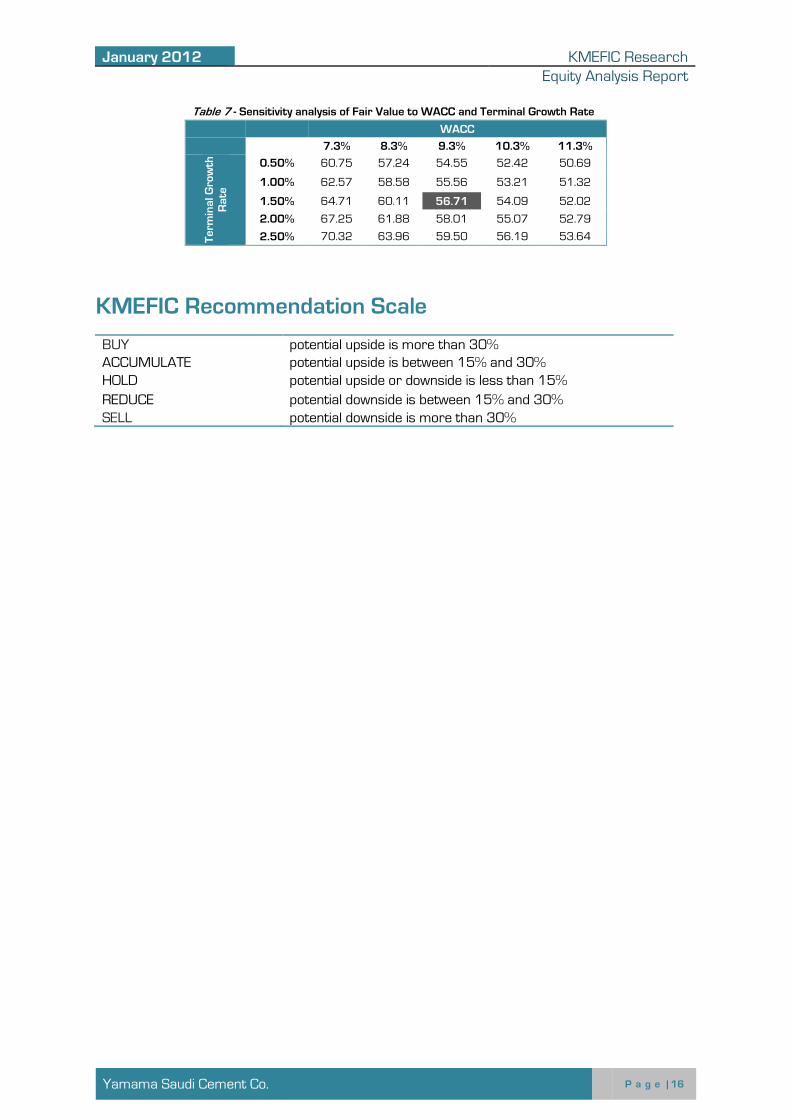
Table 7 - Sensitivity analysis of Fair Value to WACC and Terminal Growth Rate
WACC
7.3% 8.3% 9.3% 10.3% 11.3%
Terminal Growth
Rate
0.50% 60.75 57.24 54.55 52.42 50.69
1.00% 62.57 58.58 55.56 53.21 51.32
1.50% 64.71 60.11 56.71 54.09 52.02
2.00% 67.25 61.88 58.01 55.07 52.79
2.50% 70.32 63.96 59.50 56.19 53.64
KMEFIC Recommendation Scale
BUY potential upside is more than 30% ACCUMULATE potential upside is between 15% and 30% HOLD potential upside or downside is less than 15%
REDUCE potential downside is between 15% and 30% SELL potential downside is more than 30%

January 2012
KMEFIC Research
Equity Analysis Report
Yamama Saudi Cement Co.
P a g e | 17
Appendices
Balance Sheets (SAR million) FY-10 A FY-11 F FY-12 F FY-13 F FY-14 F FY-15 F
Cash 700 908 1,045 860 857 891
Recievables & prepayments 270 298 312 338 357 369
Inventory 132 117 121 130 136 146
Current assets 1,102 1,324 1,478 1,328 1,350 1,406
Investments 394 399 404 410 416 423
Fixed assets 2,106 1,962 1,863 1,749 1,645 3,008
Capital projects under construction 7 29 375 750 1,125 3
Other long term assets 44 49 54 56 60 64
Noncurrent assets 2,552 2,439 2,697 2,965 3,246 3,497
Total assets 3,653 3,763 4,175 4,293 4,596 4,903
LT debt - current portion 77 63 63 63 38 75
Payables & other current liabilities 168 160 183 193 204 218
Current liabilities 246 224 246 256 241 293
LT debt 190 127 63 0 150 263
Other noncurrent liabilties 59 55 61 63 67 72
Noncurrent liabilties 249 181 124 63 217 334
Total liabilities 495 405 371 319 458 627
Total equity 3,159 3,358 3,804 3,974 4,138 4,276
Income Statements (SAR million) FY-10 A FY-11 F FY-12 F FY-13 F FY-14 F FY-15 F
Revenues 1,272 1,422 1,464 1,570 1,635 1,668
COGS (560) (616) (639) (682) (714) (768)
Gross profit 712 806 826 888 921 900
Operating income 666 754 772 830 861 839
Net income 657 739 758 817 847 824
EPS (SAR) 3.25* 3.65* 3.74 4.03 4.18 4.07
*Adjusted for the 50% capital increase

January 2012
KMEFIC Research
Equity Analysis Report
Yamama Saudi Cement Co.
P a g e | 18
Ratios
FY-10 A FY-11 F FY-12 F FY-13 F FY-14 F FY-15 F
Current ratio 4.48x 5.92x 6.00x 5.18x 5.60x 4.79x
Quick ratio 3.92x 5.37x 5.47x 4.65x 5.00x 4.27x
Cash ratio 2.85x 4.06x 4.24x 3.36x 3.56x 3.04x
Gross profit margin 56.0% 56.7% 56.4% 56.5% 56.3% 54.0%
Operating profit margin 52.4% 53.0% 52.7% 52.9% 52.7% 50.3%
Net profit margin 51.6% 51.9% 51.8% 52.0% 51.8% 49.4%
Return on total capital 19.2% 20.8% 19.3% 20.2% 19.6% 17.9%
Return on average assets 17.9% 19.9% 19.1% 19.3% 19.1% 17.4%
Return on average equity 21.1% 22.7% 21.2% 21.0% 20.9% 19.6%
LT Debt to Equity ratio 0.08x 0.06x 0.03x 0.02x 0.05x 0.08x
Debt to assets ratio 13.5% 10.8% 8.9% 7.4% 10.0% 12.8%
January 2012
KMEFIC Research
Equity Analysis Report
Yamama Saudi Cement Co.
P a g e | 19
This report is being provided for informational purposes only and on the condition that it will not form a primary basis for any investment
decision. This report is not an offer to buy or sell any of the securities that may be referred to herein. In no event will KMEFIC be liable for
any loss occurring from investment decisions made based on the recommendation here-enclosed. Past performance is not necessarily
a guide to future performance. Investors should make their own decision on whether or not to buy or sell the securities covered herein
based upon their specific investment goals and in consultation with their financial advisor. KMEFIC has no obligation to update, modify or
amend this report or to otherwise make any notification or announcement thereof in the event that any matter stated herein, or any
opinion, projection, forecast or estimate set forth herein, changes or subsequently becomes inaccurate. The inclusion of any
opinions/estimates does not necessarily imply a recommendation or endorse the views expressed within them. Many areas of the
report contain opinions and/or analysis that represent the involved analysts' views; neither the analysts nor KMEFIC shall be in any way
liable for their opinions expressed in the report. KMEFIC may or may not have ownership or interest in companies mentioned in this
report. This report has been prepared and issued by the Research Department @ Kuwait & Middle East Financial Investment Co. S.A.K.
(KMEFIC), a licensed Kuwaiti investment company regulated by the Central Bank of Kuwait. KMEFIC prepared this report using publicly
available information, internal data, and other sources considered reliable; however, KMEFIC makes no representations or warranties of
any kind, express or implied, about the completeness, accuracy, reliability, suitability with respect to the report or the information,
analysis, opinions, or related graphics contained on the report for any purpose. While great care has been taken to ensure that the facts
stated are accurate, neither KMEFIC nor any of its employees shall be in any way responsible for the contents. Neither this document
nor any of its contents may be distributed in any jurisdiction where its distribution is restricted by law. Neither this document nor its
content may be copied, transmitted or distributed without the prior written consent of KMEFIC. Additional information on the contents of
this report is available on request.

م.ك.م.ا����� ش ��آ� ا����� وا���ق ا�و� �������ر +)965( 63222525: ,�آ+ –+) 965( 22255000: ه�&% –ا����� 13009 –ا�ـ"!�ة 819:ب.ص
Kuwait and Middle East Financial Investment Company K.S.C.C P.O.Box 819 Safat 13009 Kuwait – Telephone: (+965) 22255000 – Fax: (+965) 22252563 [email protected] – www.kmefic.com.kw
Research Team: Safaa Zbib, CVA Ali Al-Moussawi Reda Farran Snr. Manager Equity Analyst Asst. Equity Analyst Research Department Research Department Research Department [email protected] [email protected] [email protected]