
A saliency-based bottom-up visual attention model for ... fileAlbert Einstein College of Medicine,...
20
Biol Cybern (2013) 107:141–160 DOI 10.1007/s00422-012-0542-2 ORIGINAL PAPER A saliency-based bottom-up visual attention model for dynamic scenes analysis David F. Ramirez-Moreno · Odelia Schwartz · Juan F. Ramirez-Villegas Received: 3 October 2011 / Accepted: 13 December 2012 / Published online: 12 January 2013 © Springer-Verlag Berlin Heidelberg 2013 Abstract This work proposes a model of visual bottom- up attention for dynamic scene analysis. Our work adds motion saliency calculations to a neural network model with realistic temporal dynamics [(e.g., building motion salience on top of De Brecht and Saiki Neural Networks 19:1467– 1474, (2006)]. The resulting network elicits strong transient responses to moving objects and reaches stability within a biologically plausible time interval. The responses are statistically different comparing between earlier and later motion neural activity; and between moving and non-moving objects. We demonstrate the network on a number of syn- thetic and real dynamical movie examples. We show that the model captures the motion saliency asymmetry phenom- enon. In addition, the motion salience computation enables sudden-onset moving objects that are less salient in the static scene to rise above others. Finally, we include strong consid- eration for the neural latencies, the Lyapunov stability, and the neural properties being reproduced by the model. David F. Ramirez-Moreno and Juan F. Ramirez-Villegas contributed equally to the research reported in this work. D. F. Ramirez-Moreno (B ) · J. F. Ramirez-Villegas Computational Neuroscience, Department of Physics, Universidad Autonoma de Occidente, Cali, Colombia e-mail: [email protected] O. Schwartz Dominick P. Purpura Department of Neuroscience, Albert Einstein College of Medicine, Yeshiva University, New York, NY, USA O. Schwartz Department of Systems and Computational Biology, Albert Einstein College of Medicine, Yeshiva University, New York, NY, USA Keywords Visual attention · Saliency map · Motion saliency · Neural network · Synaptic depression · Neural latency · Asymmetry phenomenon · Lyapunov stability 1 Introduction Primates’ visual cortex is capable of interpreting complex dynamical scenes in clutter. This process is thought to involve attention shifting; i.e., selecting circumscribed regions of visual information to be preferentially processed and by changing the processing focus over the time course. There have been several approaches in the literature for dynamic attention along the ventral and dorsal pathways, includ- ing both scene-dependent (bottom-up) and/or task-dependent (top-down) strategies (Itti and Koch 2000; De Brecht and Saiki 2006; Bergen and Julesz 1983; Treisman et al. 1977; Treisman and Gelade 1980); and the interactions between these two processes (Fix et al. 2010; Navalpakkam and Itti 2002, 2005, 2006; Torralba et al. 2006; Walther and Koch 2006; Wolfe et al. 2003). Many computational models of human visual search have embraced the idea of a saliency map to accomplish preat- tentive selection. This representation contains the overall neural activity elicited by objects and non-objects, which compete for processing space, and includes salience for primary visual features such as intensity, orientations, col- ors, and motion (Bollman et al. 1997; Chen et al. 2003; Li 2002; Mundhenk and Itti 2005; Park et al. 2002; Rapantzikos et al. 2007; Reynolds and Heeger 2009; Maunsell and Treue 2006). In some theoretical and experimental stud- ies, salience maps have been attributed to early visual areas [e.g., (Li 1999, 2002; Zhaoping 2006)]. In addition, some electrophysiological and imaging studies have also shown 123
Transcript of A saliency-based bottom-up visual attention model for ... fileAlbert Einstein College of Medicine,...

Biol Cybern (2013) 107:141–160DOI 10.1007/s00422-012-0542-2
ORIGINAL PAPER
A saliency-based bottom-up visual attention model for dynamicscenes analysis
David F. Ramirez-Moreno · Odelia Schwartz ·Juan F. Ramirez-Villegas
Received: 3 October 2011 / Accepted: 13 December 2012 / Published online: 12 January 2013© Springer-Verlag Berlin Heidelberg 2013
Abstract This work proposes a model of visual bottom-up attention for dynamic scene analysis. Our work addsmotion saliency calculations to a neural network model withrealistic temporal dynamics [(e.g., building motion salienceon top of De Brecht and Saiki Neural Networks 19:1467–1474, (2006)]. The resulting network elicits strong transientresponses to moving objects and reaches stability withina biologically plausible time interval. The responses arestatistically different comparing between earlier and latermotion neural activity; and between moving and non-movingobjects. We demonstrate the network on a number of syn-thetic and real dynamical movie examples. We show thatthe model captures the motion saliency asymmetry phenom-enon. In addition, the motion salience computation enablessudden-onset moving objects that are less salient in the staticscene to rise above others. Finally, we include strong consid-eration for the neural latencies, the Lyapunov stability, andthe neural properties being reproduced by the model.
David F. Ramirez-Moreno and Juan F. Ramirez-Villegas contributedequally to the research reported in this work.
D. F. Ramirez-Moreno (B) · J. F. Ramirez-VillegasComputational Neuroscience, Department of Physics, UniversidadAutonoma de Occidente, Cali, Colombiae-mail: [email protected]
O. SchwartzDominick P. Purpura Department of Neuroscience,Albert Einstein College of Medicine, Yeshiva University,New York, NY, USA
O. SchwartzDepartment of Systems and Computational Biology,Albert Einstein College of Medicine, Yeshiva University,New York, NY, USA
Keywords Visual attention · Saliency map ·Motion saliency · Neural network · Synaptic depression ·Neural latency · Asymmetry phenomenon ·Lyapunov stability
1 Introduction
Primates’ visual cortex is capable of interpreting complexdynamical scenes in clutter. This process is thought to involveattention shifting; i.e., selecting circumscribed regions ofvisual information to be preferentially processed and bychanging the processing focus over the time course. Therehave been several approaches in the literature for dynamicattention along the ventral and dorsal pathways, includ-ing both scene-dependent (bottom-up) and/or task-dependent(top-down) strategies (Itti and Koch 2000; De Brecht andSaiki 2006; Bergen and Julesz 1983; Treisman et al. 1977;Treisman and Gelade 1980); and the interactions betweenthese two processes (Fix et al. 2010; Navalpakkam and Itti2002, 2005, 2006; Torralba et al. 2006; Walther and Koch2006; Wolfe et al. 2003).
Many computational models of human visual search haveembraced the idea of a saliency map to accomplish preat-tentive selection. This representation contains the overallneural activity elicited by objects and non-objects, whichcompete for processing space, and includes salience forprimary visual features such as intensity, orientations, col-ors, and motion (Bollman et al. 1997; Chen et al. 2003; Li2002; Mundhenk and Itti 2005; Park et al. 2002; Rapantzikoset al. 2007; Reynolds and Heeger 2009; Maunsell andTreue 2006). In some theoretical and experimental stud-ies, salience maps have been attributed to early visual areas[e.g., (Li 1999, 2002; Zhaoping 2006)]. In addition, someelectrophysiological and imaging studies have also shown
123

142 Biol Cybern (2013) 107:141–160
neuronal correlates of salience maps in lateral intrapari-etal cortex (Kusunoki et al. 2000), frontal eye field (Thomp-son and Bichot 2005), superior colliculus (Shen and Martin2007) and amygdala (Gonzalez Andino and Grave de Per-alta Menendez 2012; Santos et al. 2011; Trapp et al. 2012).Other approaches have considered the overall salience as aconsequence of interactions among multiple feature maps,each encoding the saliency of objects for a specific fea-ture (Itti and Koch 2000). Itti and Koch (2000) introduceda bottom-up model, in calculating multiple visual featuresand linearly combining the feature maps to obtain a repre-sentation for describing the overall saliency of the objects onthe static image.
In this work, we focus on bottom-up salienceWe partic-ularly consider a dynamical model by De Brecht and Saiki(2006). The model’s primary visual features are a simpli-fied version of Itti and Koch (2000), but their (static image)model is extended to incorporate a neural network that cap-tures temporal dynamics. Their model incorporates at leastthree aspects: first, their model includes realistic dynamicsbased on data from electrophysiology experiments. Second,the neural activity normalization during saliency process-ing avoids exaggeration of the differences among the cal-culated dimensions (from feature maps to the final saliencymap). Finally, over-competition within the maps is avoidedby synaptic depression, in addition to a linear gain func-tion with a threshold of zero. Synaptic depression is thetemporary decrease in synaptic efficacy between a highlyactive presynaptic neuron and the postsynaptic neuron; pro-vided that as it uses up the synaptic resources faster thanthey can be recovered, the strength of the synaptic connec-tions weakens (Abbott et al. 1997; Tsodyks et al. 1998).This model was shown to be useful for saccadic eye move-ments modeling during free vision tasks and for capturingsudden-onset stimuli, provided that the moving object is itselfsalient.
The present work develops a saliency-based visual atten-tion model for dynamical scene analysis. Our approachexpands the results obtained by Itti and Koch (2000) and DeBrecht and Saiki (2006), by incorporating a motion saliencycomputation (not present even in the dynamical approachof De Brecht and Saiki). Our bottom-up model integratesthe motion saliency computation over time. This avoids aproblem faced by the dynamical model of De Brecht andSaiki (2006) when it is applied to moving targets or to cer-tain sudden-onset ones; i.e., in their model, the transientresponse of moving (or sudden-onset) non-salient stimulicannot be forced to rise above the other objects by the net-work dynamics itself. Therefore, we propose that adding amotion salience computation enables to capture salience ofa sudden-onset target which is not deemed salient in theabsence of motion (i.e., is not salient in the static case, in
comparison to other objects). In addition, our model keepsthe synaptic depression mechanism for motion saliency com-putations in order to avoid over competition and undesiredeffects when the moving target is other than the most salientone.
The final saliency map is implemented as an array ofneural populations with dynamic synapses and with dynamicmotion detection. We used Naka–Rushton functions in meanfield equations with dynamic synapses in order to describethe neurons’ spike rates. Under this representation, the modeldynamics itself causes the target to rise above the distrac-tors even when competition occurs among all neurons in themap.
Neurons in primary visual cortex perform the first stage ofcortical motion processing, which continues along the dor-sal pathway. Spatiotemporal filters are commonly used tomodel the selectivity of V1 neurons for speed and direc-tion of local motion (Schrater et al. 2000; Borst 2000; Chen2005; Ibbotson 2001). Here, we adopt this approach and usea simple implementation of motion detection. Experimentalevidence shows that sudden-onset stimuli or moving stim-uli increase their priority during the transient response ofthe neurons and this priority decays if the given stimulusstops moving, so that the neural assembly reaches its steadystate response (Yantis 1993). This suggests that motion is,as expected, a primary visual feature dynamically computedby the visual system given the time response of the neuralassembly involved in bottom-up saliency processing (Itti andKoch 2000; De Brecht and Saiki 2006). Previous work alsoindicates that motion detection requires a set of non-linearinteractions between locations and instances in time (Mesoand Zanker 2009; Sejnowski et al. 1988; Shormaker et al.2001). As the models of Itti et al. (1998) and De Brecht andSaiki (2006) have shown, the motion salience computationcannot be achieved without the presence of motion detec-tors. In our model, motion detectors are implemented andembedded into the dynamical equations for the computationof motion salience.
We demonstrate our dynamical model with motionsalience examples for both real and synthetic dynamicscenes. In Sect. 2.3 we introduce the dynamical model. InSect. 3.1.2, we discuss the saliency processing latenciesand show that the model reproduces the expected transi-tory responses under different experimental frames. We alsoaddress motion saliency asymmetries and illustrate motionsaliency for dynamic scenes. We make a comparison betweenthe models with and without motion detectors, showing thatthe motion detectors are necessary to capture the salienceof sudden-moving objects. In Sect. 3.2, we consider indetail the Lyapunov stability in the model’s dynamics and inSect. 4 we explore possible integrations to top-down mech-anisms.
123

Biol Cybern (2013) 107:141–160 143
Fig. 1 Flow diagram for the bottom-up visual processing model proposed in this work. The novel part of the model is surrounded by the dashedline
2 Model
2.1 Model’s overview
The model proposed in this work is based on the Itti andKoch (2000) and De Brecht and Saiki (2006) saliency mapsmodels. This model computes saliency using the three fea-tures studied by Itti and Koch: intensity, orientation, andcolor. These features are organized into 54 maps (6 for inten-sity, 24 for orientation, and 24 for color; a detailed expla-nation of this is given further). These maps are combinedusing across-scale sums in order to obtain the conspicuitymaps, which provide input for a unique saliency map imple-mented as an array of neural populations (Fig. 1). These pop-ulations are interconnected by an elliptical Gaussian-shapefunction, which maintains the schemes of collaboration andcompetition between local and distant populations, respec-tively.
Motion detection in our model is accomplished by sub-tracting consecutive neural inputs into the dynamical equa-tions. We found the results of this procedure highly similarto standard motion detectors (over the main peak of the tran-sient response of the system). Given the systems’ dynamics,a population’s Gaussian-shaped connections induce smooth-ing and therefore noise reduction. De Brecht and Saiki (2006)computed visual salience using a network with dynamicsynapses and responses in time. Although their model couldbe suitable to the dynamic scenes analysis, their approachdoes not integrate the computation of motion salience.
Under the setup proposed in this work, the transientresponse of the non-linear system exhibits an overshoot (ora sequence of maximum peaks) when the stimulus suddenlymoves from a place to another (or makes a sequence of move-ments) over different scene frames; then, when the stimulusstops moving the system reaches its steady state response,i.e., the moving stimulus priority decays.
123

144 Biol Cybern (2013) 107:141–160
2.2 Primary visual features extraction
As stated previously, the feature extraction procedureexpands over three main well-studied feature maps: intensity,orientation, and color maps. The center-surround differencesare implemented using fine and coarse scales of the Laplacianpyramid (Burt et al. (1983)) for each feature: the receptivecenter corresponds to a pixel at resolution level c ∈ {2, 3, 4}and the surround is the corresponding pixel at level s = c+δ,
with δ ∈ {3, 4} .
Contrast intensity is extracted by standard band-pass fil-tering to calculate center surround differences between theestablished resolution levels:
I (c, s) = |I (c)�I (s)| , (1)
where I (c) is the center intensity signal, I (s) is surroundintensity signal and the symbol “�” is termed across-scalesubtraction, i.e., standard subtraction of images of differentresolutions by interpolation to the finer scale.
Orientation is extracted using standard Gabor pyramidsO(θ, σ ), where θ ∈ {0◦, 45◦, 90◦, 135◦} (Greenspan et al.1994). Thereby, orientation contrast is defined as:
O(c, s, θ) = |O(c, θ)�O(s, θ)| , (2)
where O(c, θ)yO(s, θ) are the center and surround orienta-tion signals, respectively.
We established four different color maps according to fourbroadly tuned colors, namely RG(c, s), BY (c, s), RC(c, s),and G M(c, s) to account for red/green, blue/yellow, red/cyan, and green/magenta opponency (T’so and Gilbert 1988;Conway 2001, 2009; Engel et al. 1997). Conway (2001)established the existence of certain groups of cells sensitive toanother type of contrast color. According to his experiments,for red-on (L+) or yellow-on (S-) stimuli, the center of thecell is excited and at the same time is chromatically opponentto green-on (M+) and blue-on (S+) stimuli (in the surroundregion). This phenomenon also occurs for green-on centersensitive cells. Both the antagonism and the alignment of Mand S cell stimuli are suggestive of the existence of red–cyanand green–magenta cells. Ramirez-Villegas and Ramirez-Moreno (2012) recently demonstrated that a color modeldriven by red–cyan and green–magenta cells enhances thewhole visual content of natural scenes, i.e., a fully enhancedoutput nonlinearity that predicts human eye fixations withhigher accuracy:
R = r − (g + b)
2, (3)
G = g − (r + b)
2, (4)
B = b − (g + r)
2, (5)
Y = (r + g)
2− |r − g|
2− b, (6)
RG(c, s) = |(R(c) − G(c))�(G(s) − R(s))| , (7)
From Eq. (7), we derive red–cyan double opponent cellsas follows:
RC(c, s) = |(R(c) + Y (c) − G(c) − B(c))�(G(s)
+B(s) − R(s) − Y (s))| , (8)
BY (c, s) = |(B(c) − Y (c))�(Y (s) − B(s))| , (9)
Finally, green–magenta opponency is calculated as:
G M(c, s) = |(G(c) + Y (c) − R(c) − B(c))�(R(s)
+B(s) − G(s) − Y (s))| (10)
For all the former equations, R, G, B, and Y are the red,green, blue, and yellow broadly tuned color channels, respec-tively; R(c), G(c), B(c), and Y (c) are the center color sig-nals and R(s), G(s), B(s), and Y (s) are the surround colorsignals.
2.3 Dynamical model: mathematics and relation toneurobiology
Once the 54 feature maps are created, they are combinedusing across-scale sums in order to obtain the conspicuitymaps (one for each feature) and then a first representation ofthe total saliency of the objects in the scene is created withequal contribution of these conspicuity maps (Itti and Koch(2000)).
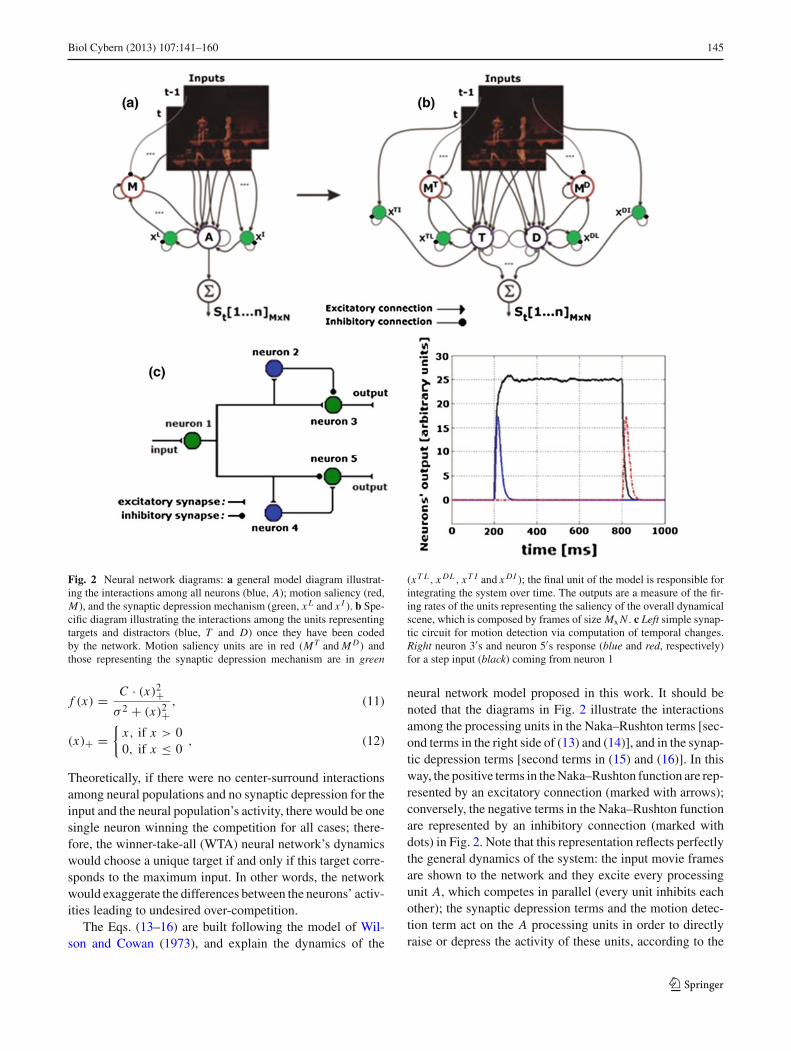
The diagram in Fig. 2a,b illustrates the interactions andthe connectivity among the units of our neural network modelwith motion dynamics. Note that the units A receive the visualinformation about all the inputs coming from the dynamicscene, either a target or distractor; the distinction among themis a consequence of the dynamic behavior of the network, inwhich all the units representing the stimuli compete over time[see Fig. 2a,b; Eqs. (11–14)]. Note that the targets and distrac-tors are not input parameters into the model; they are deter-mined directly by the neural network based on competition.
The final saliency map is implemented as an array ofneural populations with dynamic synapses and with dynamicmotion detection. Rather than implementing each neuronand their synapses, we used Naka–Rushton functions inmean field equations with dynamic synapses in order todescribe the neurons’ spike rates temporal variations (theyare derived from the Wilson (2004) winner-take-all networkapproaches). The Naka–Rushton function f (x) is defined bythe next two mathematical relations where c is the maximumreachable value or the saturation value and σ is the semi-saturation constant, i.e., the value of x for which f (x) is halfof c.
123
Biol Cybern (2013) 107:141–160 145
Fig. 2 Neural network diagrams: a general model diagram illustrat-ing the interactions among all neurons (blue, A); motion saliency (red,M), and the synaptic depression mechanism (green, x L and x I ). b Spe-cific diagram illustrating the interactions among the units representingtargets and distractors (blue, T and D) once they have been codedby the network. Motion saliency units are in red (MT and M D) andthose representing the synaptic depression mechanism are in green
(xT L , x DL , xT I and x DI ); the final unit of the model is responsible forintegrating the system over time. The outputs are a measure of the fir-ing rates of the units representing the saliency of the overall dynamicalscene, which is composed by frames of size Mx N . c Left simple synap-tic circuit for motion detection via computation of temporal changes.Right neuron 3′s and neuron 5′s response (blue and red, respectively)for a step input (black) coming from neuron 1
f (x) = C · (x)2+σ 2 + (x)2+
, (11)
(x)+ ={
x, if x > 00, if x ≤ 0
, (12)
Theoretically, if there were no center-surround interactionsamong neural populations and no synaptic depression for theinput and the neural population’s activity, there would be onesingle neuron winning the competition for all cases; there-fore, the winner-take-all (WTA) neural network’s dynamicswould choose a unique target if and only if this target corre-sponds to the maximum input. In other words, the networkwould exaggerate the differences between the neurons’ activ-ities leading to undesired over-competition.
The Eqs. (13–16) are built following the model of Wil-son and Cowan (1973), and explain the dynamics of the
neural network model proposed in this work. It should benoted that the diagrams in Fig. 2 illustrate the interactionsamong the processing units in the Naka–Rushton terms [sec-ond terms in the right side of (13) and (14)], and in the synap-tic depression terms [second terms in (15) and (16)]. In thisway, the positive terms in the Naka–Rushton function are rep-resented by an excitatory connection (marked with arrows);conversely, the negative terms in the Naka–Rushton functionare represented by an inhibitory connection (marked withdots) in Fig. 2. Note that this representation reflects perfectlythe general dynamics of the system: the input movie framesare shown to the network and they excite every processingunit A, which competes in parallel (every unit inhibits eachother); the synaptic depression terms and the motion detec-tion term act on the A processing units in order to directlyraise or depress the activity of these units, according to the
123

146 Biol Cybern (2013) 107:141–160
activity elicited by synaptic depression and motion detec-tion dynamics. Finally, the self-inhibitory connection of thesynaptic depression units guarantees that the neural activityof the most active A units decreases and that the activity ofthe less active A units increases. Accordingly, the equationsfor the network dynamics are as follow:
τ1dAi
dt= −Ai + f
⎛⎝Eik − r
N−1∑j=1
A j + U LSE
×⎛⎝∑
j
wLi j E jk
⎞⎠ x I
i + xLi Ai + Mi
⎞⎠ , (13)
τ1dMi
dt= −Mi + f
((Eik − Ei(k−1)) + U M
SE
×⎛⎝∑
j
wLi j
(E jk − E j (k−1)
)⎞⎠ + Bx Li
⎞⎠ , (14)
dx Li
dt= −x L
i U LSE Ai + 1 − x L
i
τ2, (15)
dx Ii
dt= −x I
i U ISE Eik + 1 − x I
i
τ2, (16)
with:
C = 40.0; r = 3.0; σ = 120.0; τ1 = 20.0;τ2 = 10.0; U M
SE = U LSE = U I
SE = 1.2; B = 10.0
where Ai is the spike rate of any neuron receiving an inputabout the target or distractor, the constant r describes thefeedback inhibition strength (neurons’ competition); simi-larly, Mi describe the spike rate of any neuron receivingan input about a moving target or an input about a mov-ing distractor; x L
i and x Ii are the variables representing the
synaptic depression between laterally connected populationsand afferent populations (De Brecht and Saiki 2006), respec-tively. As illustrated by the equations of the network, the neu-ron’s net potential at a given time (the squared term in theNaka–Rushton function) is built from the collaborative andcompetitive interactions between the activities of the neuronsrepresenting the saliency map, the synaptic depression mech-anism and the dynamical motion detectors. Furthermore, Eik
(i.e., the input Ei at the frame k) is the activity of any neuronproviding input to the network from the former layer. The lat-eral connection weights among the neural populations in thesaliency map wL
i j are determined by an elliptical difference-of-Gaussians function:
wLi j = wE
2πσ 2E1σ
2E2
exp
[−
(x2
2σ 2E1
+ y2
2σ 2E2
)]− wI
2πσ 2I 1σ
2I 2
exp
[−
(x2
2σ 2I 1
+ y2
2σ 2I 2
)],
(17)
wherewE = 5.0; wI = 250.0; σE1 = 0.05∗ XT ; σE2 =0.05∗YT σI 1 = 0.75∗ XT ; σI 2 = 0.75∗YT , where XT andYT are the number of rows and columns of the saliency map,respectively.
The constants of this function define the form of theGaussian kernels according to the distances x and y. Thisscheme guarantees center-surround competitive interactionsbetween the populations in the saliency map and enhances thedifference between the activity of the neural population rep-resenting the target and the activity of those representing thedistractors without generating undesired over-competitionbetween populations.
In addition, constants C, τ, σ and U LSE are adjustable
parameters of the system, where C is the maximum spikerate of the system, the time constant τn controls the frequencyat which Ai , Mi , x L
i and x Ii reach their maximum value (in
milliseconds), σ is the system’s semi-saturation constant andU L
SE and U ISE defines the synaptic efficiency between intra-
and inter-layer neural connections.The parameters of this model (C, τ, σ and U L
SE) wereadjusted according to experimental evidence available in theliterature (De Brecht and Saiki 2006; Tsodyks et al. 1998;Wilson 2004). In addition, we are introducing parameter B,
defined as the strength of synaptic depression for motionsaliency; it establishes the overall sensitivity of the systemto temporal changes, i.e., the magnitude of the overshootelicited when a stimulus appears or moves. This parame-ter is critical for over-competitive behavior too, as the over-all activity of the distractors weakens remarkably if thisparameter lowers. As synaptic depression relative weightincreases, it also increases the activity of non-winning neu-rons and this solves the problem commonly referred to asexaggeration of the differences between the target and dis-tractors (De Brecht and Saiki 2006). We noticed importantdifferences in the populations’ activity when we varied thisweight by 30 % (amongst the various experiments carriedout). On the other hand, the Naka–Rushton parameters (espe-cially σ ) of the motion saliency equations, were chosen onthe basis of counterbalancing the effect of saturation oftenpresented by Naka–Rushton neurons. That is, if the semi-saturation constant is relatively short (with respect to therange of values of the squared term of the equation), then,regardless of their input, nearly all the neurons would havequite the same output, and this is definitely an undesiredeffect for the overall saliency computation. Thus, it is desir-able to have a semi-saturation constant that permits conserv-ing the main features of the input space. In our model, 120was chosen, given the fact that the values for the squaredNaka–Rushton terms were fully distributed in the interval[0, 104].
We are taking most of the cited parameters from Itti etal. (1998), De Brecht and Saiki (2006), and Wilson (2004),and adding a new parameter related to the motion detection
123

Biol Cybern (2013) 107:141–160 147
term. Therefore, we are adopting their heuristics whileintroducing a novel saliency-based mechanism for motiondetection.
According to our experiments, all these values give arobust response to different stimuli (natural or synthetic);additionally, all the other parameters can be varied by approx-imately 50 % before large changes in the neural populationsresponses occur. For the dynamical motion detection, wehave taken similar parameters to those considered for theequations describing the competitive dynamics betweenneural populations, i.e., Eq. (13). Time constants (oftenreferred to as synaptic recovery constants) were takenfrom the Wilson (2004) competitive models which pro-duce response latencies similar to those of humans (Wilson2004).
As aforementioned, the competition occurs among everyneuron in the map and the network’s dynamics produces theactivity of the neurons representing the target to rise abovethe activity of those representing the distractors. Evidently,the response of the system varies according to what is beingencoded by one given neuron (see Fig. 3b, for reference). Toillustrate this fact clearly, when the input is a target, Eq. (13)can be re-written as:
τ1dTi
dt= −Ti + f
×⎛⎝ET
ik − rN ′∑j=1
D j − rn−1∑j=1
Tj + U LSE
⎛⎝∑
j
wLi j ET
jk
⎞⎠
xT Ii + xT L
i Ti + MTi
), (18)
where ETik is the target input (i, k), Ti is the neural activity
elicited by the target i from a total of n targets; D j is theneural activity elicited by a distractor j in a collection ofN ′distractors, and:
τ1dMT
i
dt= −MT
i + f((
ETik − ET
i(k−1)
)+ U M
SE
×⎛⎝∑
j
wLi j
(ET
ik − ETi(k−1)
)⎞⎠ + BxT L
i
⎞⎠ , (19)
dxT Li
dt= −xT L
i U LSETi + 1 − xT L
i
τ2(20)
dxT Ii
dt= −xT I
i U ISE ET
ik + 1 − xT Ii
τ2, (21)
where xT Li and xT I
i are the variables representing the synap-tic depression mechanism for such particular target.
Similarly, when the input is a distractor, (13) can be re-written as:
τ1dDi
dt= −Di + f
⎛⎝E D
ik − rN ′−1∑j=1
D j − rn∑
j=1
Tj + U LSE
×⎛⎝∑
j
wLi j E D
ik
⎞⎠ x DI
i + x DLi Di + M D
i
⎞⎠ , (22)
where E Dik is the distractor input (i, k), Di is the neural activ-
ity elicited by the distractor i from a total of N ′ targets; Tj isthe neural activity elicited by the target j in a collection of ntargets, and:
τ1dM D
i
dt= −M D
i + f
⎛⎝ (
E Dik − E D
i(k−1)
)+ U M
SE
×⎛⎝∑
j
wLi j
(E D
ik − E Di(k−1)
)⎞⎠ + Bx DL
i
⎞⎠ , (23)
dx DLi
dt= −x DL
i U LSE Di + 1 − x DL
i
τ2, (24)
dx DIi
dt= −x DI
i U ISE E D
ik + 1 − x DIi
τ2, (25)
where x DLi and x DI
i are the variables representing the synap-tic depression mechanism for such particular distractor.Please note that for all the cases ET
ik > E Dik .
Next, we explain how a neural circuit could perform thesubtraction shown in the right side of Eqs. (14), (19), and(23). Figure 2c, shows a synaptic circuit for projecting intothe motion detectors Mi . Neurons 2 and 4 constitute a sim-ple mechanism for short term memory, relaying an inhibitoryand an excitatory delayed signal, respectively, from neuron1 to neurons 3 and 5, and giving them the possibility of com-puting the input temporal change at neuron 1. This simplemechanism allows for motion detection since neuron 3 and 5can signal a change coming from reflected light intensity, forinstance, falling onto neuron 1’s receptive field from a par-ticular space location. This circuit is not shown in Fig. 2a,band should be placed between the input frames and Mi .
In addition, De Brecht and Saiki (2006) implemented theirmodel using a linear function for the second term of themean field equation. However, we preferred to use the Naka–Rushton function, as a linear function can be approximatedusing Naka–Rushton parameters for a range of values. More-over, biological evidence establishes that cell potentials aremore suitable to logistic function profiles (Wilson (2004)).
3 Results
Our approach fully reproduces the results obtained by Ittiand Koch (2000) and De Brecht and Saiki (2006) andalso yields an approach to the motion detection dynamics.In Sect. 3.1, we test the model using both synthetic and
123

148 Biol Cybern (2013) 107:141–160
natural-scene image sequences, focusing on a number ofissues. First, we examine whether the processing latenciesin our model are biologically plausible (also considered tosome extent by De Brecht and Saiki (2006)). At this point,we do not perform direct comparisons to electrophysiolog-ical experiments; we rather focus on the time taken by thesystem to reach the stable state once an object moves or sud-denly appears (De Brecht and Saiki 2006; Yantis 1993). Wealso address the motion salience asymmetry phenomenon(experimentally described by Royden et al. (2001)) with ourmodel. Finally, we also extend previous approaches (e.g.,De Brecht and Saiki (2006)) by making predictions of theattended locations by the human eye during dynamic sceneviewing, and compare the model behavior with and withoutmotion salience detectors. In addition, there are strong con-siderations in relation to the Lyapunov stability in our model(Wilson 2004); and in Sect. 3.2 we discuss in more detailmathematical considerations of the model.
We evaluate the performance of the visual attention modelmainly in cluttered scenes, including synthetic scenes thathave been used in previous simulations. In addition, we haveincluded preliminary consideration of complex motion pat-terns such as the EC Funded CAVIAR project (2011) data-base scenarios (the databases used to evaluate our approachare described below). The frames were shown to the networkat a frequency of 25 frames/s, i.e., one frame every 40 ms. Wefound that this time was enough for the system to integratethe stimulus.
We next describe the data sets used and the experimentalsetup in this work. In general, we used the same procedurefor preliminarily evaluation of both datasets. According tothe holders’ description, these data sets were recorded infairly different conditions (lighting, camera positions, etc.),which introduce some good variability on important fea-tures for saliency computation. On the other hand, thereis no variability regarding the dimensions of the analyzedframes.
3.1 Preliminary empirical evaluation of the dynamicalneural network model
3.1.1 Dynamical scene data sets
Video Sequence Database (ICPR Workshop, Cambridge,United Kingdom, 2011) All these sequences were testedunder three different lighting conditions described in thisdatabase. The sequences were recorded with a head mountedcamera at 25 frames/s, each frame with approximate dimen-sions: 768 × 584 pixels. A smaller downscaled lossless-compressed version of the database to 384 × 292 pixels wasused in order to keep the processing times and computationalload under control.
EC Funded CAVIAR project database test case scenariosThis database contains a number of video clips from dif-ferent scenarios of interest. These include people walking,entering and exiting shops, among others. There are two mainsections of video clips. The first one was recorded using awide angle camera lens at 25 frames/s and compressed usingMPEG2 with fixed resolution of 384×288 pixels. The secondset of data also used a wide angle lens along and across thehallway in a shopping mall. For each sequence, there weretwo synchronized videos; one with a view across the hall-way and another with a view along the hallway. This set ofsequences are longer (approximately 1,500 frames), contain-ing more moving individuals, groups and complex motionpatterns depending on the view. There were no further pre-processing steps for the images of this database.
3.1.2 Results on synthetic and natural, cluttered scenes
Saliency processing latencies Results of our main experi-ments are summarized in Figs. 3, 4, 5, 6, 7, 8, 9 (for syntheticand natural-scene image sequences). We included some ran-dom noise to compute saliency on synthetic scenes in orderto confirm the properties of our model in comparison to theItti et al.’s (1998) model.
Depending on the movement traces, the target activityrises above the distractors’ activity within 100 ms (the timein which the integration of the system is performed to pro-duce a steady-state response). When one single object (themost salient or another) sequentially moves, the transitoryresponse of the system exhibits several overshoots that causethe stimulus to appear temporally more salient than others.Approximately 100 ms later, populations’ activity reachesthe steady state, illustrating the fact that when the stim-ulus stops moving, the visual system activity decays (DeBrecht and Saiki 2006; Desimone and Duncan 1995; Des-imone and Ungerleider 1989). Under the assumptions fromDe Brecht and Saiki (2006), typical pop-out search reactiontime is around 500–600 ms (200–300 ms for the simple reac-tion time); taking approximately 100 ms to compute saliencyseems to be reasonable (Yantis 1993).
Conversely, when motion occurs for one object other thanthe most salient of the scene, as in Fig. 4, the priority ofthe moving object seems to decay faster than in other cases;however, as its activity stabilizes in about 100 ms (like in theother cases), the most salient object becomes more impor-tant provided that its primary visual features encode highersaliency levels, i.e., its level of activity rises above the dis-tractors’. Under these assumptions it is an expected effectfrom the model that relevant non-salient objects elicit weakerneural activity and that the increased neural activity inducedby the most salient objects in static conditions produces itsfaster decay. Additional remarks with regards to the system’s
123

Biol Cybern (2013) 107:141–160 149
Fig. 3 a Representative movie frames (adding 20 % random colornoise): (1) moving objects (white bars, frame 1) marked using whitecircles; (2, 3) objects (subsequent representative frames) performingtranslations. b Population responses: (1) initial saliency map activitybefore the moves occur; (2, 3) saliency map’s transient response (over-
shoots) when the already salient stimuli move; (4) time response rep-resenting the saliency map activity over 440 ms (note that 50 % of theobjects move at the same time and perform two movements on thissequence occurring approximately after 120 and 250 ms). Normalizedvalues on the y axis
Fig. 4 a (Top rows) Representative movie frames. (Bottom rows)Saliency map’s transient responses (overshoots) when stimuli move(multiple objects move at the same time and perform multiple move-
ments on this sequence: note that the camera moves and the neuralresponses increase for appearing objects). b Neural population responserepresenting the saliency map activity. Normalized values on the y axis
analysis without the motion saliency dynamics will be givenlater in the present section.
Saliency asymmetries A classical result in psychophysics isthe existence of saliency asymmetries (e.g., Gao and Vas-concelos (2007)). It has been of great interest to investi-gate whether or not the so-called asymmetry phenomenonexists between moving and stationary targets (Wolfe 2001;Horowitz et al. 2007). A visual asymmetry refers to the sit-uation in which it is easier to find a target of type A amongdistractors of type B than it is to find a target of type B amongdistractors of type A, see Figs. 3 and 5 (Wolfe 2001; Roydenet al. 2001). As biological evidence points out, the reaction
times increase dramatically when the subjects look for a sta-tionary target among moving distractors. Reaction time alsoshows some dependence on the number of moving distrac-tors and on the type of motion performed by such movingdistractors (Itti et al. 1998).
Consequently, consistent with psychophysics, we evalu-ated our model with a series of video sequences as typicallyused in various experimental studies of visual motion asym-metries (Wolfe 2001; Royden et al. 2001). We ran the modelover ten different movie sequences in order to make evidentasymmetry in visual motion search. These movie sequenceswere distributed on three main motion patterns: linear, ran-dom linear, and Brownian. The results of this part of our
123

150 Biol Cybern (2013) 107:141–160
Fig. 5 Motion visual search asymmetries (the object marked in red remains static during the course of the movie sequence): (top rows) representativemovie frames; (bottom rows) neural network transient responses (overshoots). (Colors are necessary here to enable the reader to interpret the figure)
work showed the saliency model reproduces motion searchasymmetries for feature presence vs. feature absence—thathave been previously reproduced on static scene analysis-based models (Gao and Vasconcelos 2007; Itti et al. 1998).Figure 5 illustrates that the approach described in this paperreproduces visual motion asymmetry properties: The objectsthat elicit the higher neural activity are those that are movingrather than the objects that remain stationary.
The network’s topology and connectivity support to someextent the neurobiological basis of the visual motion searchasymmetry phenomenon. One possibility is that the motionamong distractors (especially for Brownian motion pattern)makes the system highly responsive to changes that cannotbe easily “clustered” and therefore relegated as a commonfeature in order to allow the static object to be more salientthan others. As other researchers have suggested, asymme-tries exist with other basic visual features as well (Wolfe2001; Nagy and Cone 1996; Treisman and Gormican 1988).
For instance, it is likely that visual motion information inthe case of Brownian motion, Fig. 5, elicits stronger neuralresponses given the “novelty” presented by frame-to-framemotion traces (Royden et al. 2001). Consequently, the resultsillustrated in Fig. 5, point out that perceptual organizationmust be built in the global context of the movement of otheritems. In other words, the visual system is sensitive to move-ment coherence; items moving coherently are more easilygrouped (Matsuno and Tomonaga 2006). For all the experi-ments carried out in this work, the model presented low neuralresponses for non-moving objects. Another important fact isthat the collaborative and competitive interactions among theneurons of the saliency map (the adaptation strength amongneurons), facilitate nearby elements to rise up with respectto the others.
Motion detection and motion saliency Results clearly showthe main effect of the motion detection dynamical equations
123

Biol Cybern (2013) 107:141–160 151
Fig. 6 (Top rows) representative movie frames. (Bottom rows) Saliency map’s transient responses (overshoots) when stimuli move (multiple objectsmove at the same time and perform multiple movements on this sequence)
and their integration to the dynamical saliency map repre-sented by arrays of neural populations. As a general state-ment, while the objects move over the entire dynamical scene,attention is attracted by the moving targets, and their otherfeatures (such as intensity, orientation and color) modulatetheir instantaneous overall priority (if we consider each frameas a static image). When the moving target is the most salientof the scene under static conditions, as in Figs. 6 and 8, theobserved effect over the other objects (distractors) is an evi-dent decrease of their relative activity. However, these objectsare not eliminated from the central dynamical representa-tion as this is an expected effect derived from the synapticdepression: As the moving target-related activity increases,its self-excitatory connections will become weaker; the sameeffect is expected for inhibitory connections to surround-ing neuron populations (this accounts for automatic dynam-ical normalization of synaptic connections). It is importantto note that the neural responses in Figs. 3 and 4 are theovershoots (transitory responses) of the system to movingstimuli.
In all the analyzed cases (the available sequences from thetwo video databases), the network elicited strong responsesfor simple motion patterns (translations) in the dynami-cal scenes. Complex motion patterns such as contractionsor reductions, rotations or combinations of these kinds ofmovements did not elicit strong transients in the network,since those require more sophisticated visual elaborationsand therefore modeling of neuronal structures of higher level(Tsotsos 2001).
To measure the statistical difference between moving andnon-moving objects’ saliency (only for synthetic images), wecomputed several KS-tests for the main saliency cases statedin 20 different attempts (single or multiple object move-ments) which are indirectly considered in the databases: (1)When the most salient object of the scene performs a sin-gle move; (2) when one object other than the most salientone makes a single move; (3) when the most salient orother object makes multiple moves; and (4) when two ormore objects of the scene make a single or multiple moves.The main results of our experiments are depicted in Fig. 7.
123

152 Biol Cybern (2013) 107:141–160
Fig. 7 (Left column) Objects’ mean neural activity for target (T ) anddistractor(s) (D) during the network’s transitory response. (Right col-umn) Objects’ mean neural activity before (P) and after (F) performing
motion (transitory response). a The moving object was the most salientof the scene. b The moving object was not the most salient of the scene
As expected, there is statistical significance related to thecomparison between the mean saliency of moving and non-moving objects (P < 10−9) during the transient response,even when the moving object is not the most salient objectof the initial static scene (P < 10−9). Moreover, it wasexpected that when comparing the samples of the two groups(when the moving object was or was not the most salient),there were statistical differences especially between the dis-tractors’ activity (P < 10−5) : As the static primary visualfeatures (intensity, color, and orientation) compute the over-all priority of the input stimuli, higher mean saliency valuesare expected for the distractors in the second case.
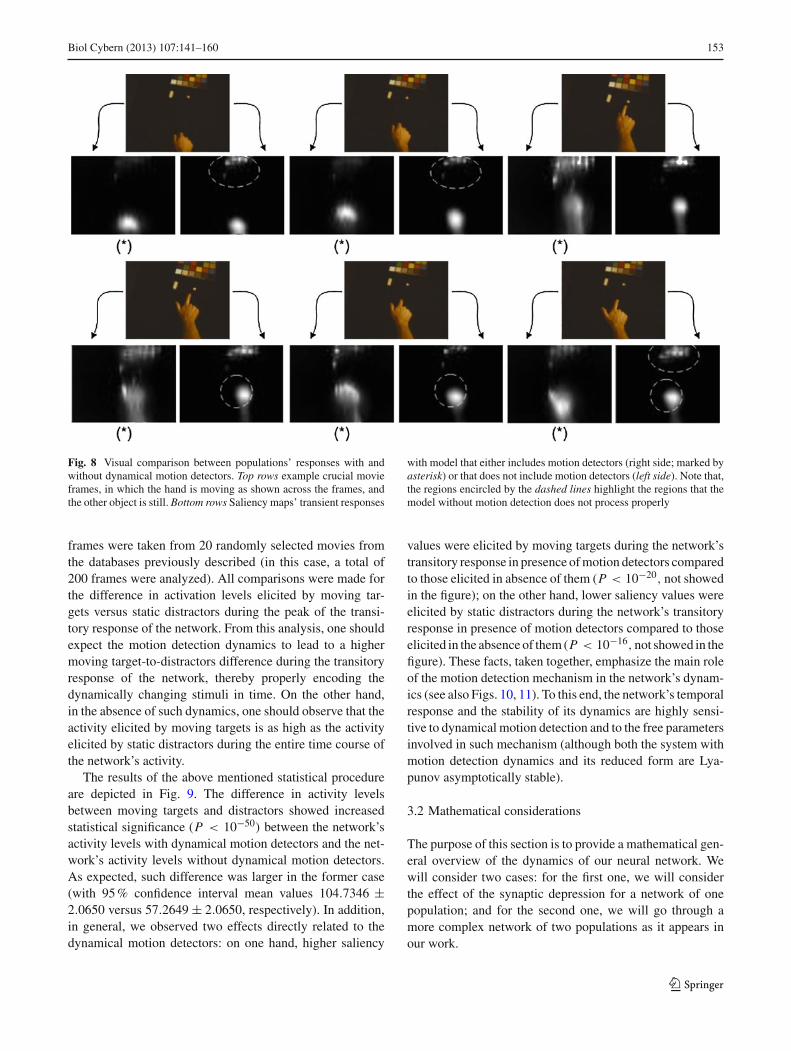
Comparison of model with and without motion detectorsalience De Brecht and Saiki (2006) described a computa-tional neural network model that integrates time responses; itappeared to be highly suitable to explore sudden-onset as wellas moving stimuli. However, their approach would definitelyfail when the moving object is other than the most salient: themodel’s dynamics itself cannot force an adequate responsewhen the moving target is a non-salient object in one giveninstantaneous static representation, the reason is that thereis no dynamic biasing effect in the dynamical equations in
order to treat favorably the moving targets. In other words,the overshoot produced by the activity of the neurons thatremained silent in the scene before motion, is not enough toproduce the transitory moving target stimulus to rise abovethe non-moving distractors in the overall cells’ populationactivity; this leads to the necessity of implementing motiondetection dynamical equations. For reference, Fig. 8 illus-trates our model’s dynamics in absence of the motion detec-tion equations. Note that the changes along the frames elicitsome activity in the network, as the neurons of the map areactivated by the presence of the stimuli; however, the modelfails to produce transient responses in which the activity ofthe moving object(s) rises above the distraction objects as canbe noticed from the encircled regions in Fig. 8. Note that,the model computes static salience but the attention is notattracted by moving stimuli. Presumably, this effect wouldbe also familiar to the De Brecht and Saiki (2006) dynamicalmodel.
As a complement to the formerly reported results, addi-tional KS-tests were performed in order to assess the dif-ference between the neuronal activation levels of the net-work with dynamical motion detectors and without dynami-cal motion detectors. For such purpose, 20 consecutive movie
123
Biol Cybern (2013) 107:141–160 153
Fig. 8 Visual comparison between populations’ responses with andwithout dynamical motion detectors. Top rows example crucial movieframes, in which the hand is moving as shown across the frames, andthe other object is still. Bottom rows Saliency maps’ transient responses
with model that either includes motion detectors (right side; marked byasterisk) or that does not include motion detectors (left side). Note that,the regions encircled by the dashed lines highlight the regions that themodel without motion detection does not process properly
frames were taken from 20 randomly selected movies fromthe databases previously described (in this case, a total of200 frames were analyzed). All comparisons were made forthe difference in activation levels elicited by moving tar-gets versus static distractors during the peak of the transi-tory response of the network. From this analysis, one shouldexpect the motion detection dynamics to lead to a highermoving target-to-distractors difference during the transitoryresponse of the network, thereby properly encoding thedynamically changing stimuli in time. On the other hand,in the absence of such dynamics, one should observe that theactivity elicited by moving targets is as high as the activityelicited by static distractors during the entire time course ofthe network’s activity.
The results of the above mentioned statistical procedureare depicted in Fig. 9. The difference in activity levelsbetween moving targets and distractors showed increasedstatistical significance (P < 10−50) between the network’sactivity levels with dynamical motion detectors and the net-work’s activity levels without dynamical motion detectors.As expected, such difference was larger in the former case(with 95 % confidence interval mean values 104.7346 ±2.0650 versus 57.2649 ± 2.0650, respectively). In addition,in general, we observed two effects directly related to thedynamical motion detectors: on one hand, higher saliency
values were elicited by moving targets during the network’stransitory response in presence of motion detectors comparedto those elicited in absence of them (P < 10−20, not showedin the figure); on the other hand, lower saliency values wereelicited by static distractors during the network’s transitoryresponse in presence of motion detectors compared to thoseelicited in the absence of them (P < 10−16, not showed in thefigure). These facts, taken together, emphasize the main roleof the motion detection mechanism in the network’s dynam-ics (see also Figs. 10, 11). To this end, the network’s temporalresponse and the stability of its dynamics are highly sensi-tive to dynamical motion detection and to the free parametersinvolved in such mechanism (although both the system withmotion detection dynamics and its reduced form are Lya-punov asymptotically stable).
3.2 Mathematical considerations
The purpose of this section is to provide a mathematical gen-eral overview of the dynamics of our neural network. Wewill consider two cases: for the first one, we will considerthe effect of the synaptic depression for a network of onepopulation; and for the second one, we will go through amore complex network of two populations as it appears inour work.
123

154 Biol Cybern (2013) 107:141–160
(a)
(c)
(b)
Fig. 9 Statistical results regarding the difference in activity levelsbetween moving targets and static distractors. The comparison are estab-lished between the network’s activity levels with dynamical motiondetectors (MD) and the network’s activity levels in the absence ofdynamical motion detectors (NM): a box plots; b cumulative distri-bution functions (CDF); and c comparison plot for the mean values of
the distributions. For all purposes, F(x) is the cumulate distribution ofthe values of the random sample, and x runs over the distribution values.The multiple comparison test plot c illustrate the mean of each set/group(corresponding to either MD or N–MD condition) and the standard errorbars around the mean. Furthermore, the 95 % confidence interval (CI)for the difference between the means was (43.3311–51.6082)
Fig. 10 Solution of the system of equations for the network of one population: (left) Numeric solution of the dynamic equations. Normalizedvalues on the y axis. (Right) graphical solution of the fixed-point equation
123

Biol Cybern (2013) 107:141–160 155
First of all, let’s consider the simplest case of our net-work, i.e., a neural network of only one population withthe Naka–Rushton term embedded into the mean field equa-tions with synaptic depression. Consequently, our systemreduces to:
τ1dT
dt= −T + f
(ETk + x1T
), (26)
dx1
dt= −x1U L
SET + 1 − x1
τ2, (27)
For the fixed point, we obtain the following resultingequations:
T − f(ETk + x1T
) = 0, (28)
−x1U LSET + 1 − x1
τ2= 0, (29)
By standard substitution we obtain:
T = f (ETk + 1
U LSEτ2T + 1
T ), (30)
Using the standard model parameters chosen in this work,i.e., C = 40.0; σ = 120.0; τ2 = 10.0; U L
SE = 1.2, weobtained the graphical results in Fig. 10.
Linearization of Eqs. (28–29) around any steady states canbe obtained as follows:
d f
dx=
[∂ f1∂x1
∂ f1∂x2
∂ f2∂x1
∂ f2∂x2
]=
[−1 − S′x1 S′T−x1U L
SE −U LSET − 1
τ2
], (31)
where S′ is the derivative of the Naka–Rushton function eval-uated at the steady state. The eigenvalues of Eq. (31) are:
λ1 = −√
L − τ2S′x∗1 + U L
SEτ2T ∗ + τ2 + 1
2τ2;
λ2 =√
L + τ2S′x∗1 − U L
SEτ2T ∗ − τ2 − 1
2τ2
where
L = S′2τ 22 x∗2
1 − 2S′τ2x∗1 (U L
SEτ2T ∗ + τ2 − 1)
+U L2SE τ 2
2 T ∗2 + 2U LSEτ2T ∗(1 − τ2) + τ 2
2 − 2τ2 + 1
and T ∗ and x∗1 are the values of T and x1 at the fixed point.
As the response of T increases, x1 response must decreasein order for the input to counterbalance the activity elicitedby T . In the absence of x1 it is evident that the unboundedgrowing of T will occur until saturation. On the other hand,for eigenvalues with negative real part, the system will beLyapunov asymptotically stable. It has become obvious thatthe stability of the system depends on the constants of themodel, for which we have recommended to use certain rangesgiven the extensive experimentation we have performed inour work. Like in (Tsodyks et al. 1998), our formulationallows for an analysis of the behavior of the network withany pattern of connections, internal dynamical interactions
and external inputs. All these factors have been taken intoaccount for the current dynamical model.
Conversely, for the second case, we are going to considertwo competing neural populations with the synaptic depres-sion effects for both of them. In this case, the model is sim-plified to:
τ1dT
dt= −T + f
(ETk − r N D + x1T
), (32)
τ1dD
dt= −D + f (EDk − r(N − 1)D − rT + x2 D), (33)
dx1
dt= −x1U L
SET + 1 − x1
τ2, (34)
dx2
dt= −x2U L
SE D + 1 − x2
τ2, (35)
Linearization of Eqs. (32–35) around any steady states isobtained as follows:
d f
dx=
⎡⎢⎢⎣
S′x1 − 1 −r N S′ T S′ 0−r S′ −1 + S′ [x2 − r(N − 1)] 0 DS′−x1U L
SE 0 −U LSET − 1
τ20
0 −x2U LSE 0 −U L
SE D − 1τ2
⎤⎥⎥⎦ ,
(36)
where S’ is the derivative of the Naka–Rushton functionevaluated at the steady state. The determinant solution ofEq. (36) is:
d =−
[τ2U L
SE D(A − (L+1)B)+(A − (λ−S′x2+1)B)(τ2λ+1)]
τ22
,
(37)
where
A = r2 N S2(τ2λ + τ2U L
SET + 1)
+ r S′(1 − N )
×(τ2λ
2 − λ(τ2S′x1 − τ2U L
SET − τ2 − 1)
−S′x1 + τ2U LSET + 1
)
B = τ2λ2 − λ
(τ2S′x1 − τ2U L
SET − τ2 − 1)
−S′x1 + τ2U LSET + 1
As can be noticed, when there are two or more interconnectedpopulations the complexity of the system increases dramati-cally and the responses elicited by the network for given stim-uli and free parameters become in some cases cumbersome tointerpret. Given this fact, there are a wide variety of responsesthat can be expected for different parameters. For instance,for the example illustrated in Fig. 11 we chose the same para-meters as in our lead model in order to keep the latencies wereproduced in our work. In Fig. 11 one important effect canbe noticed: when there is competition among neural popula-tions and it is simulated in the absence of synaptic depres-sion, there will be over-competitive behavior for any given
123
156 Biol Cybern (2013) 107:141–160
Fig. 11 Neural population responses: (left) in the absence of synaptic depression; (right) with synaptic depression. Normalized values on the yaxis
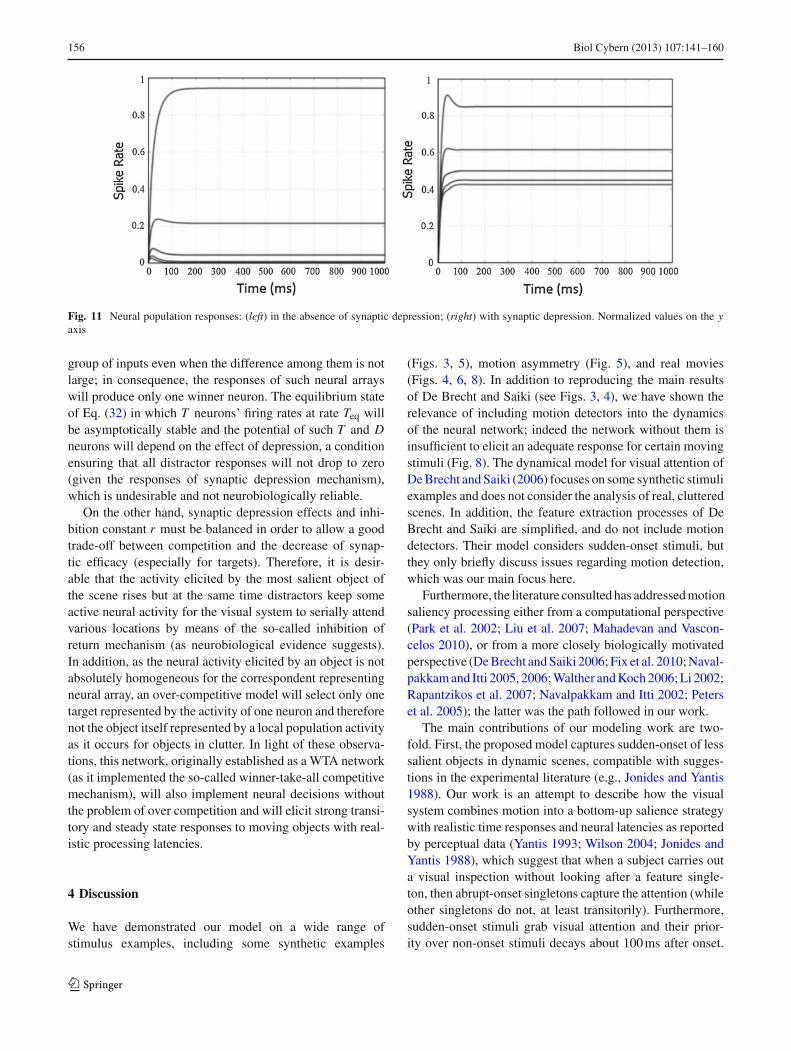
group of inputs even when the difference among them is notlarge; in consequence, the responses of such neural arrayswill produce only one winner neuron. The equilibrium stateof Eq. (32) in which T neurons’ firing rates at rate Teq willbe asymptotically stable and the potential of such T and Dneurons will depend on the effect of depression, a conditionensuring that all distractor responses will not drop to zero(given the responses of synaptic depression mechanism),which is undesirable and not neurobiologically reliable.
On the other hand, synaptic depression effects and inhi-bition constant r must be balanced in order to allow a goodtrade-off between competition and the decrease of synap-tic efficacy (especially for targets). Therefore, it is desir-able that the activity elicited by the most salient object ofthe scene rises but at the same time distractors keep someactive neural activity for the visual system to serially attendvarious locations by means of the so-called inhibition ofreturn mechanism (as neurobiological evidence suggests).In addition, as the neural activity elicited by an object is notabsolutely homogeneous for the correspondent representingneural array, an over-competitive model will select only onetarget represented by the activity of one neuron and thereforenot the object itself represented by a local population activityas it occurs for objects in clutter. In light of these observa-tions, this network, originally established as a WTA network(as it implemented the so-called winner-take-all competitivemechanism), will also implement neural decisions withoutthe problem of over competition and will elicit strong transi-tory and steady state responses to moving objects with real-istic processing latencies.
4 Discussion
We have demonstrated our model on a wide range ofstimulus examples, including some synthetic examples
(Figs. 3, 5), motion asymmetry (Fig. 5), and real movies(Figs. 4, 6, 8). In addition to reproducing the main resultsof De Brecht and Saiki (see Figs. 3, 4), we have shown therelevance of including motion detectors into the dynamicsof the neural network; indeed the network without them isinsufficient to elicit an adequate response for certain movingstimuli (Fig. 8). The dynamical model for visual attention ofDe Brecht and Saiki (2006) focuses on some synthetic stimuliexamples and does not consider the analysis of real, clutteredscenes. In addition, the feature extraction processes of DeBrecht and Saiki are simplified, and do not include motiondetectors. Their model considers sudden-onset stimuli, butthey only briefly discuss issues regarding motion detection,which was our main focus here.
Furthermore, the literature consulted has addressed motionsaliency processing either from a computational perspective(Park et al. 2002; Liu et al. 2007; Mahadevan and Vascon-celos 2010), or from a more closely biologically motivatedperspective (De Brecht and Saiki 2006; Fix et al. 2010; Naval-pakkam and Itti 2005, 2006; Walther and Koch 2006; Li 2002;Rapantzikos et al. 2007; Navalpakkam and Itti 2002; Peterset al. 2005); the latter was the path followed in our work.
The main contributions of our modeling work are two-fold. First, the proposed model captures sudden-onset of lesssalient objects in dynamic scenes, compatible with sugges-tions in the experimental literature (e.g., Jonides and Yantis1988). Our work is an attempt to describe how the visualsystem combines motion into a bottom-up salience strategywith realistic time responses and neural latencies as reportedby perceptual data (Yantis 1993; Wilson 2004; Jonides andYantis 1988), which suggest that when a subject carries outa visual inspection without looking after a feature single-ton, then abrupt-onset singletons capture the attention (whileother singletons do not, at least transitorily). Furthermore,sudden-onset stimuli grab visual attention and their prior-ity over non-onset stimuli decays about 100 ms after onset.
123

Biol Cybern (2013) 107:141–160 157
Fig. 12 Simplified frameworkof the model reported in thiswork
As shown by our results (with special regards to the motiondetection dynamical equations), our model is a step towardvisual modeling applied to dynamic environments and anattempt to reproduce the dynamics of visual neural popula-tions during bottom-up visual search tasks in clutter.
Second, we showed the importance of keeping the synap-tic depression of De Brecht and Saiki (2006) in our extendedmotion salience model: first, impeding unbounded grow-ing of the moving target neural activity when it is themost salient; second, counterbalancing the effects of movingobjects saliency with respect to non-moving objects, pro-vided that in absence of depression these objects would dis-appear transitorily from the central representation; and third,helping non-salient objects to rise above others when theyare under motion conditions or when they suddenly appear.Our model improves the results reported in Wilson (2004),regarding the neural mechanisms of visual processing of sta-tic scenes and those obtained by De Brecht and Saiki (2006)about motion and appearing stimuli. Therefore, our modelis predicting that synaptic depression is useful not only forbuilding a suitable saliency map for static conditions but alsofor dynamic scenes and inputs.
Our work relates to the dynamical saliency computationof attentional shifts in Itti (2004), but there they calculatedsaliency for the specific application of video compression. Inthis way, the dynamic nature of our model makes it potentiallyuseful for saccade target selection or the so-called foveationmechanism modeling (Itti 2004; Pomplun 2007), given theincreased interest to reproduce neural mechanisms of salient
object tracking, which greatly simplifies computer analysis ofdynamic scenes. The so-called virtual foveas (Itti 2004; Burt1988) do not attempt to reproduce saccadic eye movements ina one-to-one eye implementation. Thereby, instead of mod-eling complex rapid ballistic eye movements (often erraticmotions) that create visible artifacts, it is desirable to modelit in a smooth and damped manner in order to track objects(Itti 2004). Incorporating such dynamics to our dynamicalmodel will be a matter of future research efforts along withthe consequent computer vision applications.
Figure 12 illustrates a simplified diagram of our model,including the potential involvement of area V1. Note, how-ever, that we are not addressing V1 data in detail (such asextra classical receptive field effects and related perceptualphenomena), as has been done in V1 dynamical saliencemodeling approaches (e.g., Li (1999, 2002), and Zhaoping(2006)) and in statistical modeling [e.g., Coen-Cagli et al.(2012)]. Rather, we are including some of the properties asdescribed by Itti (2004) and López et al. (2006). Further, thismodel can be expanded to modeling other visual process-ing centers such as area MT (responsible for the selectivityconcerning the angle between local movement direction andspatial velocity gradient), MST and 7a (responsible for morecomplex motion patterns analysis). Top-down volitional con-trol is necessary too in order to complete the overall attentionscheme with realistic dynamics.
Our model only addresses bottom-up processes, andcan be adapted and extended to models that integrate top-down processes. Different features contribute to perceptual
123
158 Biol Cybern (2013) 107:141–160
saliency and their weighing can be influenced by top-downmodulation (Deco and Rolls 2004; Fahy et al. 1993; Cauller1995; Connor et al. 2004; Oliva et al. 2003; Peters et al.2005; Serre et al. 2006; Mira et al. 2006; Sobel et al. 2009).There is experimental evidence concerning strong interac-tions among different visual modalities such as color and ori-entation for certain visual locations (Nothdurft 2000); theseinteractions are subject to top-down modulation and train-ing. In this way, the attention process could select the neces-sary information to discriminate between the distractors andthe target while both bottom-up and top-down processes arecarried out to analyze the same scene: here the top-downprocess is related to previously acquired knowledge thatbiases the neural processing competition among the objects;and recognition could be performed by selecting the next eyemovement that maximizes the information gain. The compu-tational challenge, then, lies in the integration of bottom-upand top-down cues, such as to provide coherent control sig-nals for the focus of attention, and in the interplay betweenattentional orientating and scene or object recognition (Ittiand Koch (2001); see also Mira et al. (2006)). We considertwo possibilities for achieving integration of bottom-up andtop-down in our framework in the future. First, a modulationof the objects’ initial representations at the earlier stages inour model could come from higher cortical centers whichmaintain the associations to the task at hand; this could becarried out via connections through an integrative neural areaor nucleus like the superior colliculus. Second, that integra-tion could be reached through interactions between the lastcomputational stage in our model, the saliency map, and thehigher cortical associative areas in charge of encoding thedeveloping task.
Although the model proposed in this work relies exclu-sively on primary visual processing stages (bottom-up atten-tion), Hamker (2004), Hamker (2006) has built a modelthat encompasses feature-based top-down modulation andbottom-up approaches as two independent and structurallydifferent processes bearing a strong dynamical interaction. Inits current stage, our model does not account for interactionwith higher level visual processing centers or task-dependentattentional effects. Nonetheless, we have introduced a modelarchitecture for which such extensions are possible, alongwith the possibility of reproducing cortical neuronal dynam-ics with realistic time responses.
Tsotsos (2001) and Tsotsos et al. (2005) proposed a feed-forward pyramid-like network model for motion attentionconsidering the following structures: area V1, area MT,area MST and area 7a (this is, to our knowledge, the mostcomplete model in the literature regarding the analysis ofsimple and complex motion patterns). Their model accu-rately resembles the neurophysiological evidence informedby current knowledge of motion analysis in the primatecortex. Their model also explains how it is possible to
integrate the information of certain processing centers andmotion pattern attendance by selective tuning. Selective tun-ing in their model relies on a hierarchy of winner-take-all(WTA) processes with excitatory and inhibitory connectionsin a feed-forward pyramid-like network, adding the requiredfeedback connections (including MST and 7a areas). Theirmodel reproduces, at least qualitatively, some aspects ofvisual processing in human or primate vision. However, intheir model, they do not address the motion analysis with real-istic time responses. It would be interesting to integrate theirfeedforward/feedback approach, with more realistic dynam-ics of the kind we propose here.
Acknowledgments The authors of this work acknowledge the supportof Ruben Coen-Cagli, Albert Einstein College of Medicine, NY, USA.
References
Abbott LF, Varela JA, Sen K, Nelson SB (1997) Synaptic depressionand cortical gain control. Science 275:220–224
Bergen JR, Julesz B (1983) Parallel versus serial processing in rapidpattern discrimination. Nature 303:696–698
Bollman M, Hoischen R, Mertsching B (1997) In: Berlin et al. (ed) Inte-gration of static and dynamic scene features guiding visual attention.Springer, Berlin, pp 483–490
Borst A (2000) Models of motion detection. Nature neuroscience 3:1168Burt PJ (1988) Proceedings of the 9th international conference on atten-
tion mechanisms for vision in dynamic world. Patt Recog 1:977–987Burt PJ, Adelson EH (1983) The Laplacian pyramid as a compact image
code. IEEE Trans Commun 31:532–540Cauller L (1995) Layer I of primary sensory neocortex: where top–down
converges upon bottom-up. Behav Brain Res 71:163–170Chen B (2005) Mathematical models of motion detection in the fly’s
visual cortex. Dissertation, Texas Tech University, TexasChen LQ, Xie X, Fan X, Ma WY, Zhang HJ, Zhou HQ (2003) A visual
attention model for adapting images on small displays. MultimedSyst 9:1–12
Coen-Cagli R, Dayan P, Schwartz O (2012) Cortical surround inter-actions and perceptual salience via natural scene statistics. PLoSComput Biol 8(3):e1002405
Connor CE, Egeth HE, Yantis S (2004) Visual attention: bottom-upversus top–down. Curr Biol 14:R850–R852
Conway BR (2001) Spatial structure of cone inputs to color cells in alertmacaque primary visual cortex (V-1). J Neurosci 21:2768–2783
Conway BR (2009) Color vision, cones and color-coding in the cortex.The Neuroscientist 15:274–290
De Brecht M, Saiki J (2006) A neural network implementation of asaliency map model. Neural Networks 19:1467–1474
Deco G, Rolls ET (2004) A neurodyamical cortical model of visualattention and invariant object recognition. Vis Res 44:621–642
Desimone R, Duncan J (1995) Neural mechanisms of selective visualattention. Ann Rev Neurosci 18:193–222
Desimone R, Ungerleider LG (1989) Neural mechanisms of visualprocessing in monkeys. Elsevier, New York, pp 267–299
EC Funded CAVIAR project/IST 2001 37540 http://homepages.inf.ed.ac.uk/rbf/CAVIAR/. Accessed Jan 2011
Engel S, Zhang X, Wandell B (1997) Colour tuning in human visual cor-tex measured with functional magnetic resonance imaging. Nature388:68–71
Fahy FL, Riches IP, Brown MW (1993) Neuronal activity related tovisual recognition memory: long-term memory and the encoding
123

Biol Cybern (2013) 107:141–160 159
of recency and familiarity information in the primate anterior andmedial inferior and rhinal cortex. Exp Brain Res 96:457–472
Fix J, Rougier N, Alexandre F (2010) A dynamic neural field approachto the covert and overt deployment of spatial attention. Cogn Comput3:279–293
Gao D, Vasconcelos N (2007) Bottom-up saliency is a discriminantprocess. Proceedings of the IEEE international conference on com-puter vision, Rio de Janeiro
Gonzalez Andino SL, de Peralta Grave (2012) Coding of saliency byensemble bursting in the amygdala of primates. Front Behav Neu-rosci 6(38):1–16
Greenspan H, Belongie S, Goodman R, Perona P, Rakshit S, Ander-son CH (1994) Overcomplete steerable pyramid filters and rotationinvariance. Proc IEEE Comput Vis Patt Recog 1:222–228
Hamker FH (2004) A dynamic model of how feature cues guide spatialattention. Vis Res 44:501–521
Hamker FH (2006) Modeling feature-based attention as an active top–down inference process. BioSystems 86:91–99
Horowitz TS, Wolfe JM, DiMase JS, Klieger SB (2007) Visual searchfor type of motion is based on simple motion primitives. Perception36:1624–1634
Ibbotson M (2001) Identification of mechanisms underlying motiondetection in mammals. Springer, Berlin
Itti L (2004) Automatic foveation for video compression using a neu-robiological model of visual attention. IEEE Trans Image Proc13:1304–1318
Itti L, Koch C (2000) A saliency-based search mechanism for overt andcovert shifts of visual attention. Vis Res 40:1489–1506
Itti L, Koch C (2001) Computational modeling of visual attention. NatRev Neurosci 2:194–203
Itti L, Koch C, Niebur E (1998) A model of saliency-based visualattention for rapid scene analysis. IEEE Trans Patt Anal Mach Intel20:1254–1259
Jonides J, Yantis S (1988) Uniqueness of abrupt visual onset in capturingattention. Percept Psychophys 43:346–354
Kusunoki M, Gottlieb J, Goldberg ME (2000) The lateral intraparietalarea as a salience map: the representation of abrupt onset, stimulusmotion, and task relevance. Vis Res 40:1459–1468
Li Z (1999) Contextual influences in V1 as a basis for pop out andasymmetry in visual search. Proc Natl Acad Sci 96(18):10530–10535
Li Z (2002) A saliency map in primary visual cortex. Trend Cogn Sci6:9–16
Liu T, Sun J, Zheng NN, Tang X, Shum HY (2007) Learning to detecta salient object. Proceedings of IEEE computer society conferenceon computer and vision pattern recognition, Providence
López MT, Fenández-Caballero A, Fernández MA, Mira J, DelgadoAE (2006) Motion features to enhance scene segmentation in activevisual attention. Patt Recog Lett 27:469–478
Mahadevan V, Vasconcelos N (2010) Spatiotemporal saliency indynamic scenes. IEEE Trans Pattern Anal Mach Intell 32:171–177
Matsuno T, Tomonaga M (2006) Visual search for moving and sta-tionary items in chimpanzees (Pan troglodytes) and humans (Homosapiens). Behav Brain Res 172:219–232
Maunsell JHR, Treue S (2006) Feature-based attention in visual cortex.Trends Neurosci 29:317–322
Meso AI, Zanker JM (2009) Speed encoding in correlation motiondetectors as a consequence of spatial structure. Biological Cybern100:361–370
Mira J, Delgado AE, Lopez MT, Fernandez-Caballero A, Fernandez MA(2006) A conceptual frame with two neural mechanisms to modelselective visual attention processes. Neurocomputing 71:704–720
Mundhenk TN, Itti L (2005) Computational modeling and explorationof contour integration for visual saliency. Biol Cybern 93:188–212
Nagy AL, Cone SM (1996) Asymmetries in simple feature searches forcolor. Vis Res 36:2837–2847
Navalpakkam V, Itti L (2002) A goal oriented attention guidance model.Lect Notes Comput Sci 2525:453–461
Navalpakkam V, Itti L (2005) Modeling the influence of task on atten-tion. Vision Res. 45:205–231
Navalpakkam V, Itti L (2006) Modeling the influence of task on atten-tion. Proc IEEE Comput Soc Conf Comput Vis Pattern Recognit1:1–8
Nothdurft H (2000) Salience from feature contrast: additivity acrossdimensions. Vis Res 40:1183–1201
Oliva A, Torralba A, Castelhano MS, Henderson JM (2003) Top–downcontrol of visual attention in object detection. Proc Int Conf ImageProc 1:253–256
Park SJ, An KH, Lee M (2002) Saliency map model with adaptivemasking based on independent component analysis. Neurocomput-ing 49:417–422
Peters RJ, Iyer A, Itti L, Koch C (2005) Components of bottom-up gazeallocation in natural images. Vis Res 45:2397–2416
Pointing Gestures: Video Sequence Database (ICPR Workshop, Cam-bridge, United Kingdom). http://www.cvmt.dk/. Accessed Jan 2011
Pomplun M (2007) Advancing area activation towards a general modelof eye movements in visual search. In: Gray WD (ed) Integratedmodels of cognitive systems. Oxford University Press, New York,pp 120–131
Ramirez-Villegas JF, Ramirez-Moreno DF (2012) Color coding inthe cortex: a modified approach to bottom-up visual attention.Biol Cybern. doi:10.1007/s00422-012-0522-6. Accessed on 28 Sept2012
Rapantzikos K, Tsapatsoulis N, Avrithis Y, Kollias S (2007) Bottom-upspatiotemporal visual attention model for video analysis. Image ProcIET 1:237–248
Reynolds JH, Heeger DJ (2009) The normalization model of attention.Neuron 61:168–185
Royden CS, Wolfe JM, Klempen N (2001) Visual search asymmetriesin motion and optic flow fields. Percept Psychophys 63:436–444
Santos A, Mier D, Kirsch P, Meyer-Lindenberg A (2011) Evidencefor a general face salience signal in human amygdala. Neuroimage54:3111–3116
Schrater PR, Knill DC, Simoncelli EP (2000) Mechanisms of visualmotion detection. Nature Neuroscience 3:64–68
Sejnowski TJ, Koch C, Churchland PS (1988) Computational neuro-science. Science 241:1299–1306
Serre T, Wolf L, Bileschi S, Riesenhuber M, Poggio T (2006) Robustobject recognition with cortex-like mechanisms. IEEE Trans PattAnal Mach Intell 29:1–17
Shen K, Martin P (2007) Neuronal activity in superior colliculus signalsboth stimulus identity and saccade goals during visual conjunctionsearch. J Vis 7(5):15: 1–13
Shormaker PA, O’Carroll DC, Straw AD (2001) Implementationof visual motion detection with contrast adaptation. Proc SPIE4591:316–327
Sobel KV, Pickard MD, Acklin WT (2009) Using feature preview toinvestigate the roles of top-down and bottom-up processing in con-junction search. Acta Psychol 132:22–30
Thompson KG, Bichot NP (2005) A visual salience map in the primatefrontal eye field. Prog Brain Res 147:251–262
T’so DY, Gilbert CD (1988) The organization of chromatic and spatialinteractions in the primate striate cortex. J Neurosci 8:1712–1727
Torralba A, Castelhano MS, Oliva A, Henderson JM (2006) Contextualguidance of eye movements and attention in real-world scenes: therole of global features in object search. Psychol Rev 113:766–786
Trapp S, Schroll H, Hamker FH (2012). Open and closed loops: Acomputational approach to attention and consciousness. Adv CognPsychol 8(1):1–8. doi:10.2478/v10053-008-0096-y
Treisman A, Sykes M, Gelade G (1977) Selective attention stimu-lus integration. In: Dornic S (ed) Attention and performance VI.Lawrence Erlbaum Associates, New Jersey, pp 333–361
123

160 Biol Cybern (2013) 107:141–160
Treisman AM, Gelade G (1980) A feature-integration theory of atten-tion. Cogn Psychol 12:97–136
Treisman AM, Gormican S (1988) Feature analysis in early vision:evidence from search asymmetries. Psychol Rev 95:15–48
Tsodyks M, Pawelzik K, Markram H (1998) Neural networks withdynamic synapses. Neural Comput 10:821–835
Tsotsos JK (2001) Motion uniderstanding: task-directed attention andrepresentation that link perception with action. Int J Comput Vis45:265–280
Tsotsos JK, Liu Y, Matinez-Trujillo JC, Pomplun M, Simine E, ZhouK (2005) Attending to visual motion. Comput Vis Image Underst100:3–40
Walther D, Koch C (2006) Modeling attention to salient proto-objects.Neural Networks 19:1395–1407
Wilson HR (2004) Spikes, decisions and actions: the dynamical foun-dations of neuroscience. Oxford University Press, New York
Wilson HR, Cowan JD (1973) A mathematical theory of the func-tional dynamics of cortical and thalamic nervous system. Kybernetik13:55–80
Wolfe J, Butcher SJ, Lee C, Hyle M (2003) Changing your mind: on thecontributions of top-down and bottom-up guidance in visual searchfor feature singletons. J Exp Psychol Hum Percept Perform 29:483–502
Wolfe JM (2001) Asymmetries in visual search: an introduction. PerceptPsychophys 63:381–389
Yantis S (1993) Stimulus-driven attentional capture and attentional con-trol settings. J Exp Psychol Hum Percept Perform 19:676–681
Zhaoping L (2006) Theoretical understanding of the early visualprocesses by data compression and data selection. Network: ComputNeural Syst 17:301–334
123


![Exploring visual attention and saliency modeling for task-based visual …€¦ · Exploring visual attention and saliency modeling for task-based visual analysis ... [22–24], computer](https://static.fdocuments.in/doc/165x107/5f0c58647e708231d434f0d8/exploring-visual-attention-and-saliency-modeling-for-task-based-visual-exploring.jpg)


![Multimodal Saliency-Based Attention for Object-Based …bschauer/pdf/schauerte2011... · Multimodal Saliency-based Attention for Object-based Scene Analysis ... mean shift [36], depending](https://static.fdocuments.in/doc/165x107/5a9e72ec7f8b9a67178b6062/multimodal-saliency-based-attention-for-object-based-bschauerpdfschauerte2011multimodal.jpg)