A robust and sustainableA robust and sustainable business model
21
A robust and sustainable A robust and sustainable business model 13 December 2013 Rodney Alfvén Head of Investor Relations Rodney Alfvén, Head of Investor Relations
Transcript of A robust and sustainableA robust and sustainable business model

A robust and sustainableA robust and sustainable business model13 December 2013Rodney Alfvén Head of Investor RelationsRodney Alfvén, Head of Investor Relations
Nordic ideas
Nordea was created with the vision that the Nordic region was one market and to establish a pan Nordic platform
Today, Nordea is the largest financial services group i th N di d B lti S i
11 million customers- 8 home markets
and to establish a pan-Nordic platform in the Nordic and Baltic Sea region.
8 home markets- Approx. 10 million personal customers- 500 000 corporate customers, incl. Nordic Top 500
Distribution power- Approx. 900 locations in total- Approx. 7 million Netbank customers
Financial strength- EUR 10.2bn in full year income (2012)
- EUR 626bn of assets (Q3 2013)
- EUR 29 0bn in equity capital (Q3 2013)EUR 29.0bn in equity capital (Q3 2013)
- AA credit rating- Core Tier 1 capital ratio of 14.4% (Q3 2013)
EUR ~36.1bn in market cap- One of the largest Nordic corporationsThe Baltic region was added via - A top-10 European retail bankgreen field operation.
2 •

Nordea is the most diversified Nordic bank…
Russia 1%
Largest market contributionTotal loans to public by geography, %Geographic exposure vs. Nordic peers¹, %
~70% ~70%
~80%
~90%
Norway 17%
Baltics 2%Russia 1%
29%
~60%71% Finland 29%
Denmark 25%29%
Sweden26%
25%
Nordea Peer 1 Peer 2 Peer 3 Peer 4 Peer 5
Total: EUR 343bn
1 Comparison based on reported geographical breakdown of loans to the public; latest available financials.
3 •

…with lower earnings volatility and stable ROE over the cycle
61
147Net income volatility vs. Nordic peers1, %
11 13 2454 61
Nordea Peer 1 Peer 2 Peer 3 Peer 4 Peer 5
18 021.5
19.118.1
Stable ROE over the cycle Not a single quarter below
8%. Every year above 11%
ROE development 2007-20132, %
18.0 18.115.816.215.014.413.9
12.011.78.1
11.39.5
12.212.812.011.58.5
12.311.912.510.3
12.311.111.510.8
2008 2009 2010 2011 20122007
CT1 = ~13%CT1 = ~6%
2013
1 Annual net income volatility over last 5 years.2 ROE adjusted for restructuring costs 2011.
4 •

Boring is beautifulBoring is beautiful
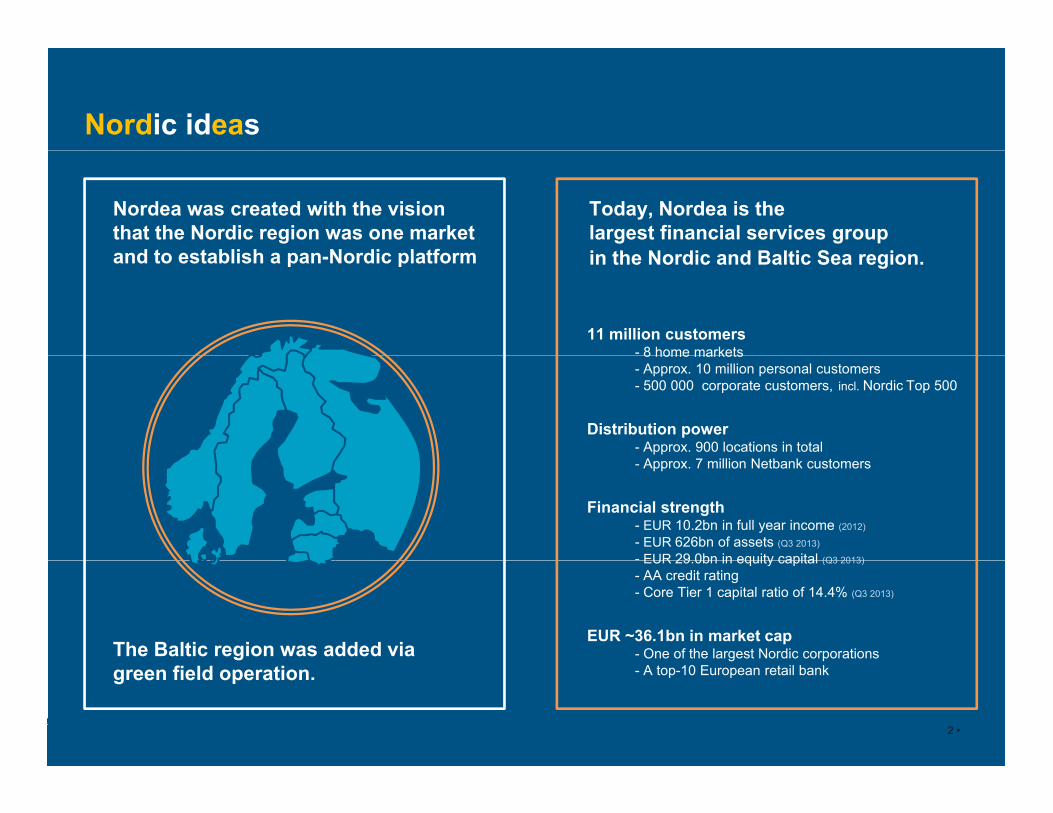
One offering to all our stakeholders
Massive regulatory
Regulationg y
agenda with many and interlinked metrics
A clear value proposition to all
CustomersInvestorsInvestor support a
prerequisite for proposition to all our customers
prerequisite for contributing to
society
Bank sector contributing to
Society
gsociety
6 •

A clear value proposition to our customersCustomers
Continuous inflow of Gold and Private Banking customers Clear value proposition to relationship customers
Customer’s benefits
2.931
3.0513.112
3.168Trust bank’s
ability…
…holistic advice in best
interest…
…one provider of all
services…
…stability; a bank for
sunny and rainy days
2.423
2.568
2.697
Know the customer
Advise the customer
Service the customer
Commit to the
customer
Focus on the id tif
…service all financial l lt d
customer
Q3/07 Q3/08 Q3/09 Q3/10 Q3/11 Q3/12 Q3/13
Number of Gold and Private Banking customers, m
Focus on the right
customers/ projects…
…identify efficient
solutions…
financial needs/
benefit from diversification
…
…loyalty and higher
profitability
Bank’s benefits
7 •

Superior Corporate and institutions franchiseCustomers
100% Only bank with a substantial lead bank footprint in all Nordea
Nordea top ranked for relationship and quality Multi-local presence
70%
80%
90%
ship
s
y pmarkets
Deep and intimate local presence
Interaction on all levels with many touch points
Nordea
Peer 2Peer 1
40%
50%
60%
porta
nt re
latio
n Interaction on all levels with many touch-points
Coordination of effort in customer teams
Proactivity on all levels
Peer 2
Peer 3
Peer 4
P 5
0%
10%
20%
30%Imp Peer 5
0%(40) (20) 0 20 40 60 80 100
Greenwich Quality Index Large Corporates -Difference from average1
8 1 The Greenwich Quality Index reflects a normalised composition of all quantitative scores.
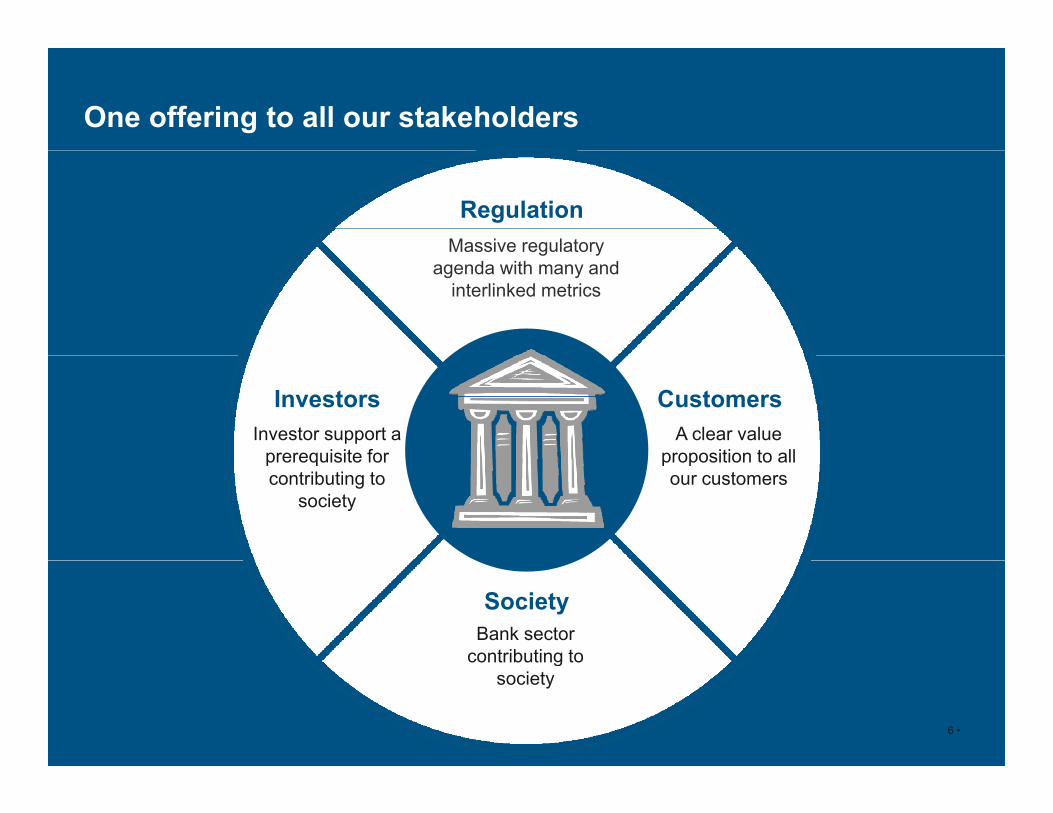
Nordea’s great delivery to customers and societyFirst 3 quarters of 2013
Customers
W h i d
Households
C d t d 240 000
SME Corporates
E t hi
Society
First 3 quarters of 2013
We have issued 200,000 new mortgages making it possible for families t b th i h
Conducted 240,000 corporate customer meetings, ensuring we are close to our
t
Entrepreneurship: Developing young peoples entrepreneurial kill llto buy their homes
Advised 1,2 million customers, and ran 0 5 million financial
customers
Issued 12 billion euros of new or
skills, as well as creativity and self-belief
0.5 million financial plans
1,2 million active mobile bank users
euros of new or refinanced loans, being active with core customers to help them reach their
Financial education: Increasing the financial literacymobile bank users
did 11.6 million transactions on the mobile, banking where they wanted
help them reach their goals
financial literacy among youth and other groups, leveraging our skilled staff
9 •
where they wanted staff

Swedish bank sector contributing to societySociety
Share oftotal corporate tax
Directemployment
DirectContribution to GDP **** p
11%11%p y
85 00085 000 144 144 bnbn ** %%
10 • • Year 2010 ** Incl insurance companies• ** SEK
Source: Bankföreningen

Increased costs of risk… Investors
Beta
Source: UBS 11 •
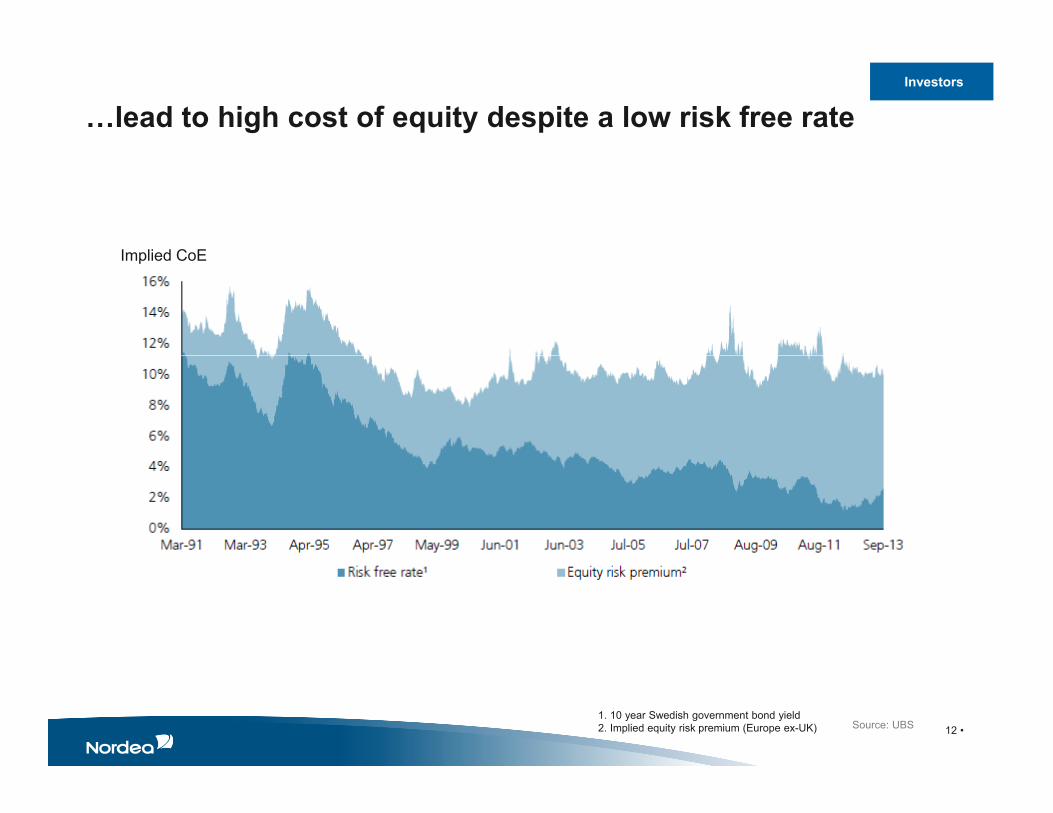
…lead to high cost of equity despite a low risk free rateInvestors
Implied CoEImplied CoE
12 • Source: UBS 1. 10 year Swedish government bond yield2. Implied equity risk premium (Europe ex-UK)

A sound valuation of equity gives positive effect on funding costs and customer offerings
Investors
1.8
2.0
Swedbank
SHB
1.4
1.6
alue
Nordea
SEB
DNB
KBC
1.0
1.2
e to
book
va Nordea DNB
Danske Erste
BBVA
Santander
0.6
0.8Pric
e
BNP
Barclays
Deutsche
Erste
SG
RBS Intesa
U iC dit
0.2
0.4
0 20 40 60 80 100 120 140 160 180 200
CACommerz
UniCredit
13 •
0 20 40 60 80 100 120 140 160 180 200
5 year CDS spread

Efficiency amongst the best in the worldInvestors
Cost / income ratio vs Cost to avg assets
Source: Citi 14 •
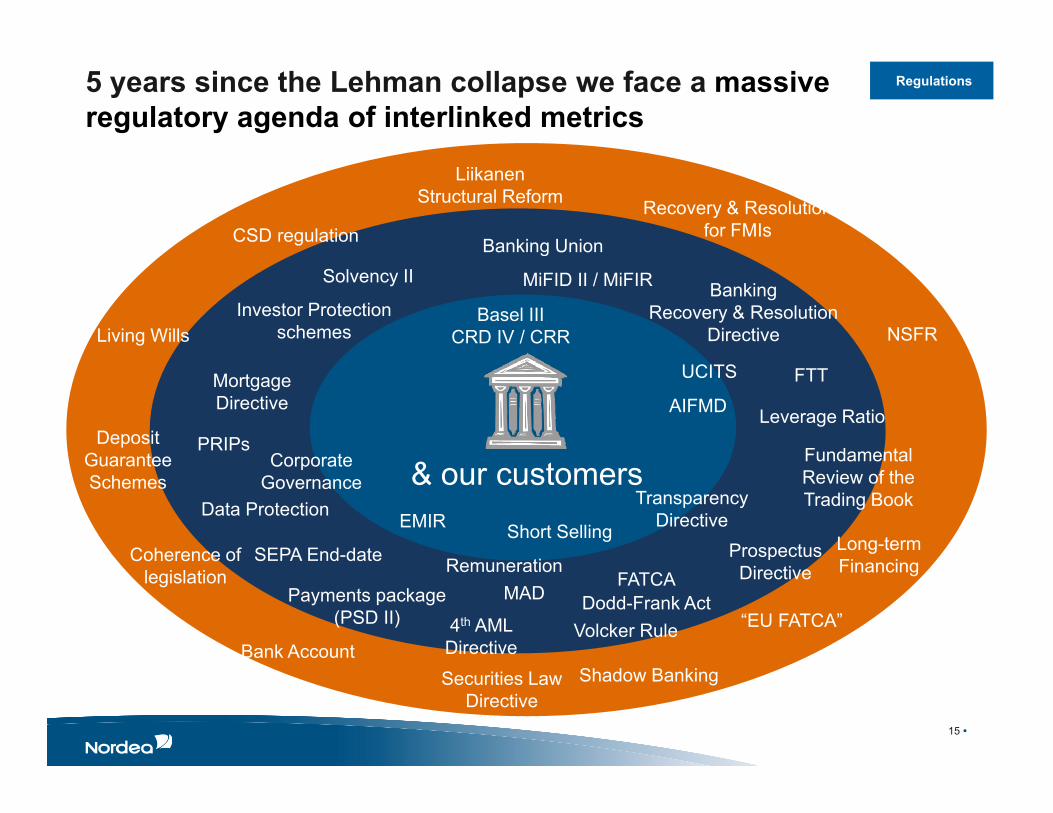
5 years since the Lehman collapse we face a massive regulatory agenda of interlinked metrics
Regulations
Recovery & Resolution for FMIs
LiikanenStructural Reform
CSD regulation Banking Union
Investor Protection schemesLiving Wills
g
MiFID II / MiFIR
Basel IIICRD IV / CRR
BankingRecovery & Resolution
Directive NSFR
Solvency II
PRIPs Deposit Guarantee
Mortgage Directive
FTT
Leverage RatioAIFMD
UCITS
FundamentalCorporate
Long-term Fi i
Data Protection
Guarantee Schemes
Prospectus Coherence of
& our customers
SEPA End-date
EMIR Short Selling
Fundamental Review of the Trading BookTransparency
Directive
CorporateGovernance
R ti
Dodd-Frank Act
FinancingPayments package
(PSD II)Volcker Rule
FATCA Directive Coherence of
legislation
“EU FATCA”4th AML Directive Bank Account
MAD
SEPA End date Remuneration
Securities Law Directive
Shadow Banking
15 •
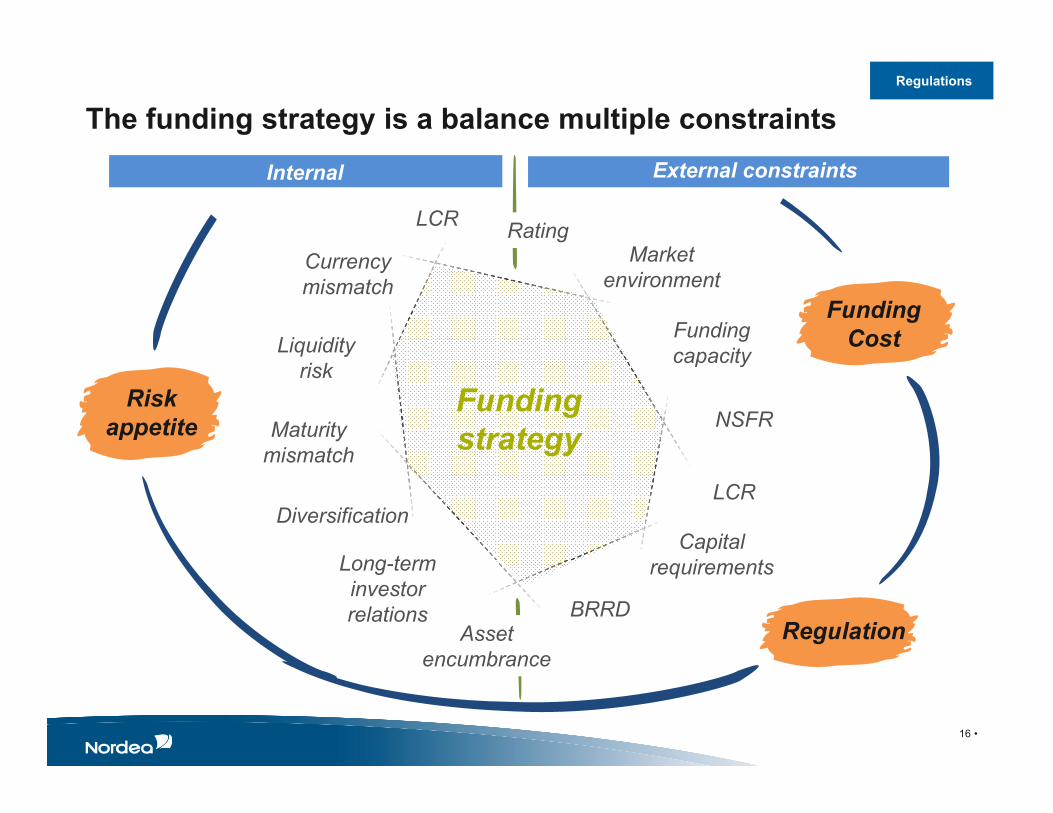
The funding strategy is a balance multiple constraintsRegulations
MarketRatingLCR
Internal constraints
External constraints
Market environment
Funding capacity
Currency mismatch
Liquidity Funding
Cost
Risk appetite
capacity
Maturity mismatch
q yrisk
Funding strategy
NSFR
LCR
Capital i t
mismatch
Long term
Diversification
requirements
Asset encumbrance
BRRDRegulation
Long-term investor relations
16 •
encumbrance
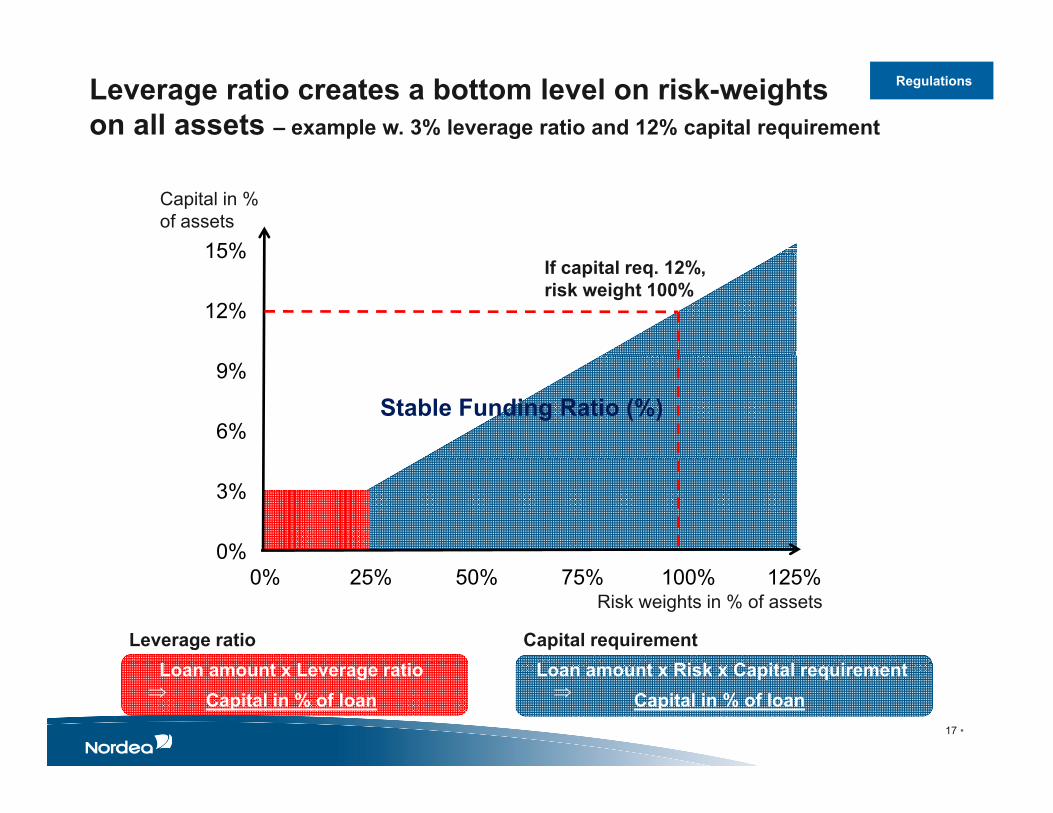
Leverage ratio creates a bottom level on risk-weights on all assets – example w. 3% leverage ratio and 12% capital requirement
Regulations
15%
Capital in % of assets
12%
15%If capital req. 12%,risk weight 100%
6%
9%
Stable Funding Ratio (%)
0%
3%
L Ri k C i l i
0% 25% 50% 75% 100% 125%
L L i
Risk weights in % of assets
Leverage ratio Capital requirementLoan amount x Risk x Capital requirement
Capital in % of loanLoan amount x Leverage ratio
Capital in % of loan
17 •
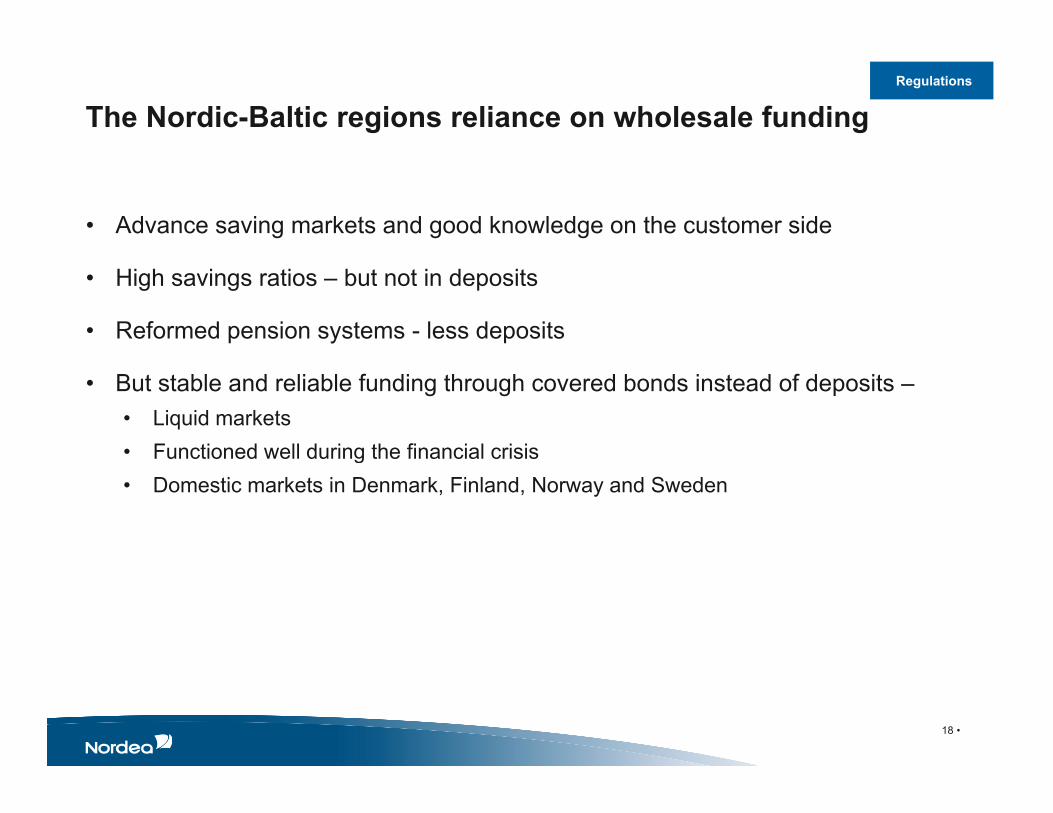
The Nordic-Baltic regions reliance on wholesale fundingRegulations
• Advance saving markets and good knowledge on the customer side
• High savings ratios – but not in deposits
• Reformed pension systems - less deposits
• But stable and reliable funding through covered bonds instead of deposits –• Liquid markets • Functioned well during the financial crisisFunctioned well during the financial crisis• Domestic markets in Denmark, Finland, Norway and Sweden
18 •

Regulations
Structural liquidity- Stable funding ratio by S&P 12
4
122
119
119
113
113
111
109
107
105
105
101
101
101
99 99 99 98 98 97 96 96 95 95 94 94 93 93 92 92 92 91 91 90 90 89 8 8 6 6 6
100
120
140
9 9 9 8 88 88 86 86 86 84 84 82 79 78 75
70 69
40
60
80
28
0
20
40
/A-1
+/A
-1+
e/A
-1e/
A-1
/A-1
+/A
-1+
e/A
-1e/
A-2
e/A
-2e/
A-1
e/A
-2e/
A-1
ive/
Be/
A-1
e/A
-1e/
A-1
e/A
-1e/
A-2
/A-1
+e/
A-1
e/A
-1N
eg/B
ble/
Be/
A-3
e/A
-2e/
A-1
e/A
-1e/
A-2
e/A
-1e/
A-2
Neg
/Be/
A-2
A-1
+e/
A-1
ive/
B
e/A
-3
e/A
-1
e/A
-1
Neg
/B
e/A
-1
e/A
-1
ive/
B
e/A
-3
ive/
B
/A-1
+
e/A
-2
ive/
B
e/A
-1
ive/
C
e/A
-2
anC
har,
AA
-/Neg
ativ
e/ol
ding
s, A
A-/N
egat
ive/
Ers
te, A
/Neg
ativ
eU
BS
, A/S
tabl
e
oper
ativ
e, A
A-/S
tabl
e/ZK
B, A
AA
/Neg
ativ
e/
RZB
, A/N
egat
ive
mer
zban
k, A
-/Neg
ativ
e
KB
C, A
-/Pos
itive
RB
S, A
/Neg
ativ
e
utsc
he, B
BB
+/N
egat
ive
Nat
ionw
ide,
A/N
egat
ive
AIB
, BB
/Neg
atD
NB
, A+/
Sta
ble
Lloy
ds, A
/Neg
ativ
eB
arcl
ays,
A/S
tabl
e
AB
N A
mro
, A/S
tabl
ent
ande
r, B
BB
/Neg
ativ
e
Rab
oban
k, A
A-/S
tabl
e/IN
G, A
+/N
egat
ive
Sw
edba
nk, A
+/S
tabl
eC
aixa
, BB
-/Wat
ch N
BO
I, B
B+/
Sta
bU
nion
e, B
BB
-/Neg
ativ
e
oban
ca, B
BB
/Neg
ativ
eC
redi
t Sui
sse,
A/S
tabl
e
SE
B, A
+/N
egat
ive
niC
redi
t, B
BB
/Neg
ativ
e
Cre
dit M
utue
l, A
/Sta
ble
Inte
sa, B
BB
/Neg
ativ
e
BC
P, B
/Wat
ch N
Dan
ske,
A-/S
tabl
e
orde
a, A
A-/N
egat
ive/
AS
ocG
en, A
/Neg
ativ
e
Pop
olar
e, B
B/N
egat
BB
VA
, BB
B-/N
egat
ive
BN
P, A
+/N
egat
ive
BP
CE
, A/N
egat
ive
o S
anto
, BB
-/Wat
ch N
DB
, A/S
tabl
e
dit A
gric
ole,
A/N
egat
ive
Sab
adel
l, B
B/N
egat
Cai
xa, B
BB
-/Neg
ativ
e
Ban
kia,
BB
-/Neg
at
bank
en, A
A-/N
egat
ive/
Bel
fius,
A-/N
egat
ive
BP
E, B
B-/N
egat
Nyk
redi
t, A
+/N
egat
ive
NB
G, C
CC
/Neg
ati
Dex
ia, B
BB
/Sta
ble
Sta
HS
BC
Ho
Coo
Com
m
Nor
ddeu N
San R U
Med
io C Un C No
Esp
irito
Cre
d
Han
dels
b
-Source: Standard & Poor’s based on YE 2012-Highlighting in; Green = Above Average; Orange = Average; Red = Below Average
19 •

The value of a common Nordic-Baltic approachRegulations
• The Nordic-Baltic region – One market!
• Good cooperation with the various authorities in the region
• But cooperation and harmonization could be improved – would be beneficial for growth and further developments in the Nordic-Baltic region
• We have well developed and advanced banking markets in the Nordic-Baltic region – in some areas a coordinated approach with the authorities to support the distinctiveness of the Nordic-Baltic region would be welcomed
20 •

A robust and sustainableA robust and sustainable business model13 December 2013Rodney Alfvén Head of Investor RelationsRodney Alfvén, Head of Investor Relations


![Robust Model Predictive Control - Carnegie Mellon …cepac.cheme.cmu.edu/.../Ronust_Control_Classnotes.pdf1 Robust Model Predictive Control Formulations of robust control [1] The robust](https://static.fdocuments.in/doc/165x107/5aab45707f8b9a2b4c8bd345/robust-model-predictive-control-carnegie-mellon-cepacchemecmueduronustcontrol.jpg)