A ROADMAP FOR FINDING FLEXIBILITY IN WHOLESALE MARKETS · All generators participating in wholesale...
51
A ROADMAP FOR FINDING FLEXIBILITY IN WHOLESALE MARKETS Best Practices for Market Design and Operations in a High Renewables Future October 2017 By Robbie Orvis and Sonia Aggarwal
Transcript of A ROADMAP FOR FINDING FLEXIBILITY IN WHOLESALE MARKETS · All generators participating in wholesale...
A ROADMAP FOR FINDING FLEXIBILITY IN WHOLESALE MARKETS Best Practices for Market Design and Operations in a High Renewables Future
October 2017
By Robbie Orvis and Sonia Aggarwal
i
ACKNOWLEDGEMENTS The authors would like to thank the following reviewers: John Moore, Jennie Chen, Miles Farmer, Ron Lehr, Lorenzo Kristov, Eric Gimon, Michael O’Boyle, Jeff Dennis, Steve Corneli, Rob Gramlich, and Brendan Pierpont.
ABOUT ENERGY INNOVATION
Energy Innovation: Policy and Technology LLC is an energy and environmental policy firm. We deliver high-quality research and original analysis to policymakers to help them make informed choices on energy policy. We focus on what matters and what works. Our mission is to accelerate progress in clean energy by supporting the policies that most effectively reduce greenhouse gas emissions. Through customized research and analysis for decision makers, we uncover the strategies that will produce the largest results. We work closely with other experts, NGOs, the media, and the private sector to ensure that our work complements theirs.
ABOUT AMERICA’S POWER PLAN
America’s Power Plan is a platform for innovative thinking about how to manage the transformation happening in the electric power sector today. We bring together America’s clean energy thought leaders to assemble information on a package of policies, markets, and regulations to maximize the grid’s affordability, reliability/resilience, and environmental performance. America’s Power Plan curates expert content from the field, with the aim of integrating previously-siloed work into a package of solutions for regulators, policymakers, market operators, utilities, independent energy service providers, and other power sector professionals.
Energy Innovation: Policy and Technology LLC 98 Battery Street, Suite 202 San Francisco, CA 94111 (415) 799-2176
www.energyinnovation.org www.americaspowerplan.org
ii
GUIDE TO TERMS AGC – Automatic Generation Control, an automated way for power plants to respond to dispatch signals
BTM:NG – Behind-the-Meter: Net Generation, a type of resource in the NYISO electricity market
CAISO – California Independent System Operator, the electricity market operator in California
CCT – Central Clock Time, the time zone used by the natural gas industry for scheduling
DAM – Day Ahead Market, the one-day ahead electricity market administered by RTOs
DAMAP – Day Ahead Margin Assurance Payment, an uplift payment compensating generators for lost margins if they are forced to dispatch down for reliability
DER – Distributed Energy Resource, any resource connected to the distribution system (as opposed to the transmission system)
DIR – Dispatchable Intermittent Resource, a type of resource designation in MISO, typically reserved for wind plants
DR – Demand Response, the ability by end-users to reduce demand for electricity in response to market signals
ERCOT – Electric Reliability Council of Texas, the electricity market operator in Texas
FERC – Federal Energy Regulatory Commission, the federal agency tasked with overseeing energy markets
Gas CC – Gas Combined Cycle, a type of natural gas power plant that relies on both a gas turbine and a steam turbine, thereby improving its overall efficiency and generation costs
ISO – Independent System Operator, a non-profit entity that oversees grid operations and administers energy markets (synonymous with RTO)
ISO-NE – Independent System Operator – New England, the electricity market operator for New England states including Maine, New Hampshire, Vermont, Massachusetts, Rhode Island, and Connecticut.
LSE – Load Serving Entity, a retail utility or other entity that secures energy and transmission service for delivery to end-users
MISO – Midcontinent Independent System Operator, the electricity market operator in several states in the Midwest, including parts or all of Montana, North Dakota, South Dakota, Iowa, Minnesota, Wisconsin, Michigan, Illinois, Arkansas, Missouri, Kentucky, Alabama, Louisiana, Mississippi, and Texas
MW – Megawatt, a unit of instantaneous power output equal to one million watts
MWh – Megawatt-hour, a unit of energy output equal to one of hour of continuous power output at one megawatt
NYISO – New York Independent System Operator, the electricity market operator for New York
O&M – Operations and Maintenance
iii
OFO – Operational Flow Order, an overriding order by the manager of natural gas infrastructure to take or cease taking the flow of natural gas to maintain reliability of the natural gas system
ORDC – Operating Reserve Demand Curve, an approximation of the probability-weighted value of lost load for different levels of operating reserves
PJM – PJM Interconnection, the electricity market operator for several states in the Mid-Atlantic region, including parts or all of Delaware, Illinois, Indiana, Kentucky, Maryland, Michigan, New Jersey, North Carolina, Ohio, Pennsylvania, Tennessee, Virginia, West Virginia, and the District of Columbia
PPA – Power Purchase Agreement, a contract between a power plant owner and an offtaker to sell electricity at a fixed (strike) price (with many variations)
PUC – Public Utility Commission, the state regulatory body tasked with regulating utilities
RTM – Real Time Market, the real time electricity market, typically operated in five-minute increments, used to match supply and demand in real time and correct for deviations between day ahead forecasts and real time system conditions
RTO – Regional Transmission Organization, a non-profit entity that oversees grid operations and administers energy markets (synonymous with ISO)
SCED – Security Constrained Economic Dispatch, the method of determining and dispatching the power plants that can produce electricity at the lowest cost with certain reliability constraints.
SIR – Synchronous Inertial Reserve, a proposed market product in ERCOT to procure and pay for inertia from generators
SPP – Southwest Power Pool, the electricity market operator for several states in the Southwest, including parts or all of Arkansas, Iowa, Kansas, Louisiana, Minnesota, Missouri, Montana, Nebraska, New Mexico, North Dakota, Oklahoma, South Dakota, Texas, and Wyoming
TWh – Terawatt-hour, a unit of energy output equal to one hour of continuous power output at 1,000,000 megawatts
iv
EXECUTIVE SUMMARY Competitive markets for electricity, or Regional Transmission Organizations (RTOs), are at an inflection point. When RTOs were first created during the 1990s, they designed operations and practices around the technical elements of the grid of that time. Grid operators dispatched large central station generators to follow inflexible load, with power flowing in one direction from these central generators out to customers. RTOs managed the scheduling and dispatch of these generators, ensuring they met relatively predictable demand. While this system and its concomitant rules, procedures, and definitions has worked well for the last 20 years, it is becoming increasingly strained as the grid continues to modernize quickly.
A RAPIDLY EVOLVING GRID PRESENTS NEW CHALLENEGES AND OPPORTUNITIES
Today’s grid is evolving in at least four ways due to new innovation and cost breakthroughs in technologies like wind, solar, batteries, and information technology (IT). First, RTOs have to plan for predictable variations in supply in new ways. While managing a predictable decrease in supply is nothing new for RTOs (think of a nuclear unit refueling, for example), RTOs now have to do this on a daily basis with an increasingly large pool of resources whose output is changing. For example, in a region with plentiful solar power, grid operators have to manage the decrease in output from solar in the evenings and ensure sufficient alternative resources are available to dispatch.
Second, RTOs also have to manage the unpredictable variations in supply associated with higher penetrations of variable resources. As with managing predictable variations, managing unpredictable variations is not new to grid operators. RTOs have managed the grid around contingency events, such as the loss of a generator or transmission line, for decades. However, with growing levels of variable renewables, the sources and degrees of variability have increased. Some of this increase is offset, however, by the fact that historically, unpredictable variations were often the result of large generator failures. The unpredictable variation in output from renewables, on the other hand, tends be much more modular and not highly correlated across resource types, meaning the unpredictable variations will be smaller in magnitude and tend to balance each other out when compared to the historical paradigm of large generator failures.
Third, grid operators must manage the bulk electricity system (i.e. the transmission system, the domain over which they have control) with increased output coming onto the grid from distributed energy resources (DERs), like rooftop solar. With little visibility into and no control over the types and amounts of resources on the distributed system, RTOs are facing new challenges in accurately forecasting net demand.
Fourth, innovations in load resources are creating vast new opportunities for RTOs or load suppliers to harness the flexibility of load as a valuable resource. From advanced vehicle charging to electric water heaters that together can act as a giant battery, RTOs increasingly are able to dispatch load resources to balance supply and demand.
While changes to the ongoing operations of wholesale markets are necessary, they will be insufficient to fully support the grid transformation. Changes to planning processes, including reliability and resource adequacy approaches – administered by RTOs, public utility commissions (PUCs) and states – will be
v
necessary in competitive power market regions. These capacity and planning issues deserve careful consideration, but are outside the scope of this paper.
FLEXIBILITY IS KEY TO SUCCESSFULLY MANAGING THE TRANSITION
Successfully managing the evolving grid comes down to ensuring the grid is flexible enough to handle the characteristics of new resources and capitalize on their capabilities to the benefit of customers. Flexibility comes in many forms, but broadly, it means the ability to respond over various time frames – from seconds to seasons – to changes in supply, demand, and net load. The more flexible the power system, the easier it is for grid operators to manage the system around variable supply and demand. As the system becomes increasingly modular and renewables-based, ensuring sufficient grid flexibility is key to operating the grid reliably and minimizing costs.
Fortunately, significant amounts of latent flexibility exist in the grid today, and proactive changes to existing market rules can allow RTOs to tap into this flexibility. RTOs must also consider how they can modify existing products and create new ones to harness latent flexibility in the grid today while creating an investment signal for new flexible resources.
Fixing Market Rules to Unlock Flexibility of Existing Resources
Simple changes to market rules could unlock a significant amount of flexibility for RTOs. In some instances, existing market rules, even when well intentioned, preclude certain resources from offering services even though they could provide value. In other instances, market rules designed to accommodate certain technologies or contract structures limit the ability of grid operators to tap those resources.
Require All Generators and Imports to Participate in Economic Dispatch
In all wholesale electricity markets, some degree of self-scheduling occurs where power plant operators, for a range of reasons, choose to run their plants regardless of the price of electricity. Valid reasons sometimes exist for choosing to self-schedule. For example, a hydro plant may not be able to reduce its output if doing so means that it will overflow or violate environmental constraints.
Though these instances exist, self-scheduling is often the product of contract terms or financial decisions rather than the presence of technical limitations on a resource. When self-scheduling makes up a significant share of the total amount of electricity available to market operators, it can introduce challenges to operating the grid flexibly. The challenge is in the fact that if power plants are price-takers, i.e. they will dispatch at any price, then they are not responsive to changes in market prices, which reflect the constraints of the electric grid at any given time.
All generators participating in wholesale markets, including imports and renewables, should be required to participate in economic dispatch. Enforcing this requirement will increase the amount of flexibility available to grid operators by providing them with a wider resource base for balancing the grid. Similarly, during times of very high output of low or zero marginal cost resources, economic dispatch (provided negative prices are allowed) provides a way for grid operators to economically dispatch down specific plants. This doesn’t mean variable renewables ought to or need to be exposed to mark fluctuations; bilateral contracting should continue to be leaned on to mitigate market volatility.
vi
Recommendations Examples
Self-scheduling should be minimized or eliminated, and all resources should participate in economic dispatch. RTOs either can require units to submit offer curves or can lower the offer floor to induce units to participate in economic dispatch.
NYISO requires all units to submit offer curves.
Follow MISO’s example to include variable generation in economic dispatch, subjecting it to all the same conditions and giving it access to all the same benefits that other market participants enjoy (e.g., uplift and make-whole payments).
MISO’s Dispatchable Intermittent Resource Category has virtually eliminated manual curtailments and better integrated wind resources into dispatch.
Increase the share of imports participating in economic dispatch to the maximum extent feasible.
CAISO self-scheduled imports significantly reduce the amount of flexibility available to grid operators. The CAISO Energy Imbalance Market allows imports to participate in economic real time dispatch.
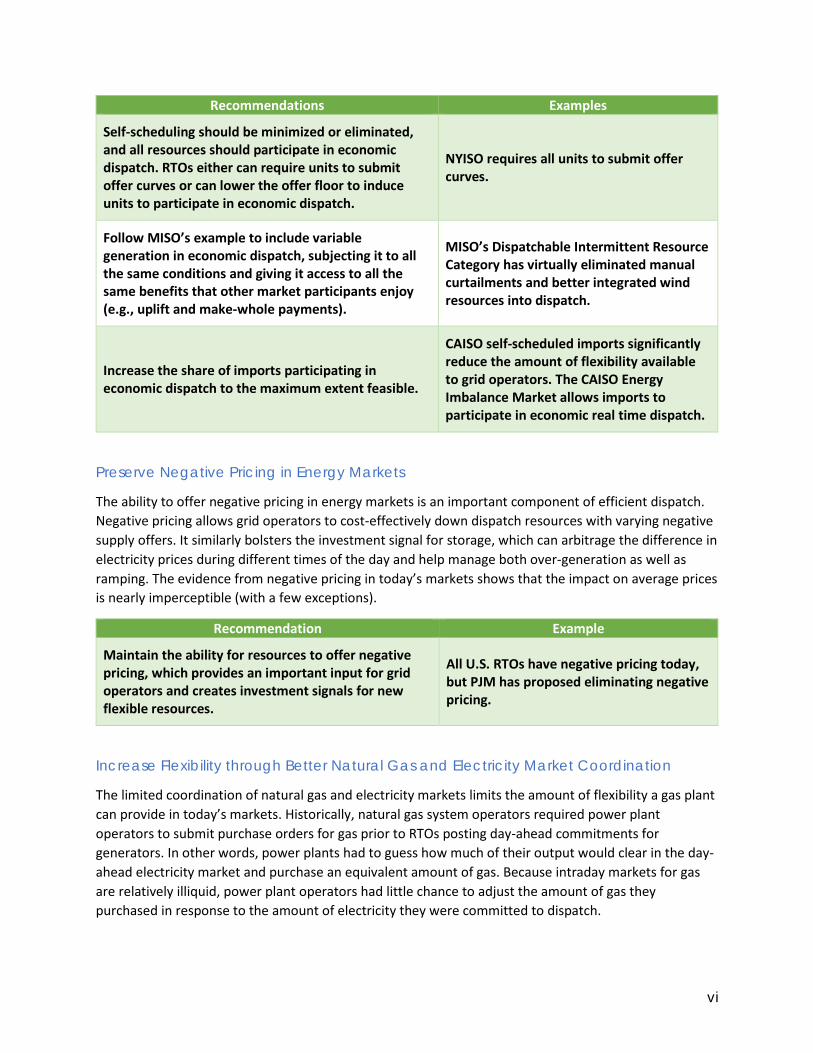
Preserve Negative Pricing in Energy Markets
The ability to offer negative pricing in energy markets is an important component of efficient dispatch. Negative pricing allows grid operators to cost-effectively down dispatch resources with varying negative supply offers. It similarly bolsters the investment signal for storage, which can arbitrage the difference in electricity prices during different times of the day and help manage both over-generation as well as ramping. The evidence from negative pricing in today’s markets shows that the impact on average prices is nearly imperceptible (with a few exceptions).
Recommendation Example
Maintain the ability for resources to offer negative pricing, which provides an important input for grid operators and creates investment signals for new flexible resources.
All U.S. RTOs have negative pricing today, but PJM has proposed eliminating negative pricing.
Increase Flexibility through Better Natural Gas and Electricity Market Coordination
The limited coordination of natural gas and electricity markets limits the amount of flexibility a gas plant can provide in today’s markets. Historically, natural gas system operators required power plant operators to submit purchase orders for gas prior to RTOs posting day-ahead commitments for generators. In other words, power plants had to guess how much of their output would clear in the day-ahead electricity market and purchase an equivalent amount of gas. Because intraday markets for gas are relatively illiquid, power plant operators had little chance to adjust the amount of gas they purchased in response to the amount of electricity they were committed to dispatch.
vii
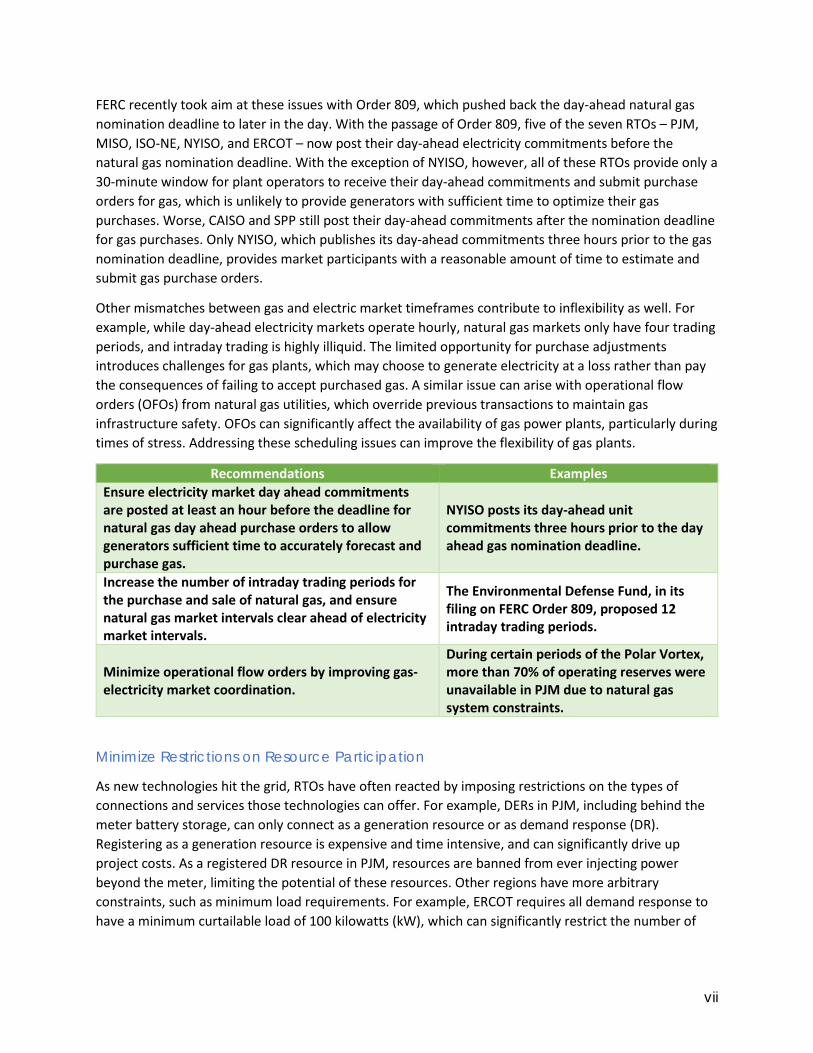
FERC recently took aim at these issues with Order 809, which pushed back the day-ahead natural gas nomination deadline to later in the day. With the passage of Order 809, five of the seven RTOs – PJM, MISO, ISO-NE, NYISO, and ERCOT – now post their day-ahead electricity commitments before the natural gas nomination deadline. With the exception of NYISO, however, all of these RTOs provide only a 30-minute window for plant operators to receive their day-ahead commitments and submit purchase orders for gas, which is unlikely to provide generators with sufficient time to optimize their gas purchases. Worse, CAISO and SPP still post their day-ahead commitments after the nomination deadline for gas purchases. Only NYISO, which publishes its day-ahead commitments three hours prior to the gas nomination deadline, provides market participants with a reasonable amount of time to estimate and submit gas purchase orders.
Other mismatches between gas and electric market timeframes contribute to inflexibility as well. For example, while day-ahead electricity markets operate hourly, natural gas markets only have four trading periods, and intraday trading is highly illiquid. The limited opportunity for purchase adjustments introduces challenges for gas plants, which may choose to generate electricity at a loss rather than pay the consequences of failing to accept purchased gas. A similar issue can arise with operational flow orders (OFOs) from natural gas utilities, which override previous transactions to maintain gas infrastructure safety. OFOs can significantly affect the availability of gas power plants, particularly during times of stress. Addressing these scheduling issues can improve the flexibility of gas plants.
Recommendations Examples Ensure electricity market day ahead commitments are posted at least an hour before the deadline for natural gas day ahead purchase orders to allow generators sufficient time to accurately forecast and purchase gas.
NYISO posts its day-ahead unit commitments three hours prior to the day ahead gas nomination deadline.
Increase the number of intraday trading periods for the purchase and sale of natural gas, and ensure natural gas market intervals clear ahead of electricity market intervals.
The Environmental Defense Fund, in its filing on FERC Order 809, proposed 12 intraday trading periods.
Minimize operational flow orders by improving gas-electricity market coordination.
During certain periods of the Polar Vortex, more than 70% of operating reserves were unavailable in PJM due to natural gas system constraints.
Minimize Restrictions on Resource Participation
As new technologies hit the grid, RTOs have often reacted by imposing restrictions on the types of connections and services those technologies can offer. For example, DERs in PJM, including behind the meter battery storage, can only connect as a generation resource or as demand response (DR). Registering as a generation resource is expensive and time intensive, and can significantly drive up project costs. As a registered DR resource in PJM, resources are banned from ever injecting power beyond the meter, limiting the potential of these resources. Other regions have more arbitrary constraints, such as minimum load requirements. For example, ERCOT requires all demand response to have a minimum curtailable load of 100 kilowatts (kW), which can significantly restrict the number of
viii
resources that can participate (though is a significant improvement over the previous 1,000kW minimum).
Addressing relatively arbitrary resource restrictions can tap into a significant amount of flexibility that is available today but going unused.
Recommendations Examples
Create a net generation product for distributed resources, enable aggregators to participate via fleets, and make the size threshold as small as possible.
NYISO’s Behind-the-Meter net generation resource allows behind the meter storage to participate in wholesale electricity markets, including being dispatched beyond the meter.
Allow resources to provide all services they are capable of providing, ensuring that market rules accommodate varying resource characteristics.
CAISO’s non-generator resource allows storage resources to provide energy and all ancillary services, and accounts for the unique characteristics of storage technologies.
Creating and Modifying Products to Harness the Flexibility of Existing Resources and Incent New Flexible Resources
RTOs must go beyond changing market rules to tap into existing flexibility and incent new flexible resources. To this end, RTOs should modify existing products to harness latent flexibility from existing resources as well as implement new products that create an investment signal for new flexible resources.
Define Need for Flexibility Services and Allow All Resources to Offer their Capabilities
Market products should focus on meeting the specific flexibility need and letting all resources compete to provide the needed service. Focusing on the service desired should lead to products that take advantage of the differential qualities of resources, providing additional flexibility at the lowest cost.
For example, batteries, flywheels, and compressed air storage are able to change output much more quickly than traditional thermal generators, and can therefore provide frequency regulation more effectively, though they tend to be energy-limited. However, frequency regulation rules in many RTOs are designed to accommodate the slower thermal units, in some cases creating barriers for newer technologies.
Market operators should modify existing products to ensure they are technology-neutral and focused on providing a service at the lowest cost. New products should be created under this rubric as well.
Recommendation Example
Create new and modify existing products focusing on the desired service, and allow all resources to compete to provide this service.
PJM redesigned its frequency regulation products (adding RegD) to accommodate new technologies with different resource profiles that can provide better service at a lower cost. The initial success of the RegD product has been undermined by subsequent changes that force energy-limited resources to behave like traditional thermal ones.
ix
Create Value for Flexibility
Increasing shares of variable renewable resources require an increasing amount of flexibility. For example, as solar makes up a higher share of electricity generation in CAISO, grid operators need more ramping in the late afternoon as the sun sets and other units fill in for solar electricity. Flexibility varies widely across power plant types, but is not something market operators have typically considered when designing products or procuring new resources.
The best way to create value for flexibility is to enhance pricing signals in energy markets. Examples include higher scarcity prices, which incent resources to produce during times of need, and reserve shortage adders, which better reflect the value of resources to the system as it approaches a shortage.
Another way to create value is through specific products that pay for and obtain the type of flexibility needed by grid operators. For example, CAISO and MISO have created ramping products designed specifically to ensure adequate ramping capability and that units with greater ability to ramp are rewarded likewise.
Recommendation Examples Reform energy market pricing to better value flexible resources. Higher scarcity pricing and reserve adders are one way to do this.
ERCOT’s high scarcity price and Operating Reserve Demand Curve adder creates additional value for flexible units during times of system stress.
Where necessary, create products for flexibility or products that reward resources that can act flexibly.
CAISO’s Flexi-Ramp product ensures market operators have sufficient ramping capability to maintain reliability while creating value for flexibility.1
Pay for Uncompensated Reliability Services
An evolving mix of resources on the grid will increase the value of certain resource characteristics while decreasing the value of others. For example, turbine-based generators (including steam and gas turbines) provide frequency response (different from frequency regulation) through inertia and governor response. Frequency response is a valuable element as it helps slow the rate of frequency change. Because turbine-based generators have been ubiquitous in the past, RTOs did not see a need to specifically procure frequency response or indeed to even pay for this service. However, the growth in inverter-based generators, specifically wind and solar, means that less frequency response is endogenously available today to system operators than in the past. Using now-standard power electronics, wind, solar, and battery resources can provide frequency response. However, an opportunity cost can exist for plants to provide this service, so a product should be defined and market mechanisms should be created to encourage provision of the service from whichever resources can do so at the lowest cost.
As new resources enter the electricity mix and create value for new and different services, RTOs should create new products that expose the value of these services and allow encourage their provision at least cost. For example, requiring all technologies to provide frequency response will likely increase costs
1 Note that the flexible ramping product is different from the flexible resource adequacy requirement in CAISO, which is a different product/requirement with its own set of issues.
x
unnecessarily. Instead, RTOs should value this capability (and others, as they emerge) and create an incentive for new resources to provide this service as needed.
Recommendation Examples
Pay for reliability services that are of increasing importance but are currently uncompensated, for example frequency response.
In 2015, ERCOT proposed creating a market product and procurement requirement for Synchronous Inertial Response, though this proposal was ultimately rejected.
LONGER TERM STRUCTURAL CHANGES WILL BE NEEDED
The changes to market rules, operations, and products proposed here will help RTOs manage increasing shares of renewables in the near to medium term. Over the long term, however, more significant structural changes are likely required. For example, in a system with very high shares of renewables, it may become impossible to rely on the least-cost dispatch algorithms that RTOs currently use (for example, if you have sufficient zero marginal cost capacity to meet load, how do you decide who to dispatch?). The long-term solution is much more speculative than the rest of the ideas in this paper, but the market may look like an Evolved Energy-Mostly Market (essentially an extension of today’s energy-only markets with price caps removed) or more of a Product Portfolio (a market with many more well-defined products spanning many different timescales). Finding the long-term answer requires new thinking and research.
CONCLUSION
Today’s electricity markets are grappling with a rapidly evolving resource mix. New technologies coming online today are creating challenges and opportunities for RTOs. The existing set of market rules and products must adapt to accommodate new technologies and capitalize on their differences. At the same time, RTOs must modify existing products and create new ones to tap into the latent flexibility in the system today and create a strong investment signal for new flexible resources.
Fortunately, many examples of progressive market changes are already occurring in the seven U.S. power markets. In the Mid-Atlantic and New York, PJM and NYISO are finding new ways to incorporate battery storage. And in MISO, grid operators now have an economic way to manage output from renewables. These are just a few of the innovative market changes that can help RTOs navigate the growing share of new technologies.
A clean, high renewables future is within sight. Grid managers need only look at the best practices of their colleagues around the country to understand how to manage the transition as it happens.
xi
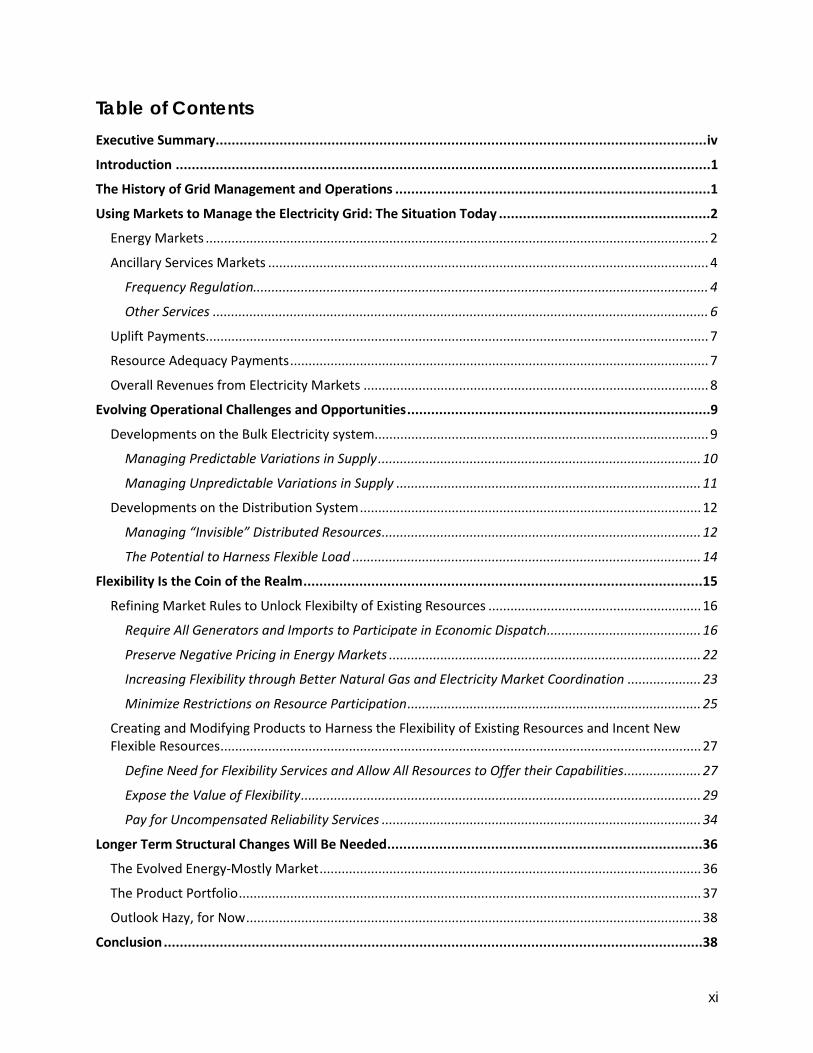
Table of Contents Executive Summary ........................................................................................................................... iv
Introduction ......................................................................................................................................1
The History of Grid Management and Operations ...............................................................................1
Using Markets to Manage the Electricity Grid: The Situation Today .....................................................2
Energy Markets ......................................................................................................................................... 2
Ancillary Services Markets ........................................................................................................................ 4
Frequency Regulation............................................................................................................................ 4
Other Services ....................................................................................................................................... 6
Uplift Payments ......................................................................................................................................... 7
Resource Adequacy Payments .................................................................................................................. 7
Overall Revenues from Electricity Markets .............................................................................................. 8
Evolving Operational Challenges and Opportunities ............................................................................9
Developments on the Bulk Electricity system........................................................................................... 9
Managing Predictable Variations in Supply ........................................................................................ 10
Managing Unpredictable Variations in Supply ................................................................................... 11
Developments on the Distribution System ............................................................................................. 12
Managing “Invisible” Distributed Resources ....................................................................................... 12
The Potential to Harness Flexible Load ............................................................................................... 14
Flexibility Is the Coin of the Realm .................................................................................................... 15
Refining Market Rules to Unlock Flexibilty of Existing Resources .......................................................... 16
Require All Generators and Imports to Participate in Economic Dispatch .......................................... 16
Preserve Negative Pricing in Energy Markets ..................................................................................... 22
Increasing Flexibility through Better Natural Gas and Electricity Market Coordination .................... 23
Minimize Restrictions on Resource Participation ................................................................................ 25
Creating and Modifying Products to Harness the Flexibility of Existing Resources and Incent New Flexible Resources ................................................................................................................................... 27
Define Need for Flexibility Services and Allow All Resources to Offer their Capabilities ..................... 27
Expose the Value of Flexibility ............................................................................................................. 29
Pay for Uncompensated Reliability Services ....................................................................................... 34
Longer Term Structural Changes Will Be Needed ............................................................................... 36
The Evolved Energy-Mostly Market ........................................................................................................ 36
The Product Portfolio .............................................................................................................................. 37
Outlook Hazy, for Now ............................................................................................................................ 38
Conclusion ....................................................................................................................................... 38
1
INTRODUCTION In the United States, a mix of utilities, local balancing authorities, and Regional Transmission Organizations (also called Independent System Operators) manages the electric grid.2 Regional Transmission Organizations (RTOs) are tasked with managing and maintaining reliability across large geographic areas, often crossing several states. These grid operators manage the bulk electric grid via wholesale markets for power and other critical electricity services needed to maintain reliability.
Continued growth of renewable electricity sources and distributed energy resources is fundamentally changing grid management. The old paradigm was oriented around large, thermal-powered central stations and relatively uncontrollable demand. We now have very cheap and clean, but variable, generation and it is becoming increasingly possible to manage and dispatch demand dynamically. Taking advantage of these inexpensive clean energy sources requires new ways of managing the grid. The new paradigm of grid management will be oriented around flexibility, renewable energy generation, and participation of demand as a resource, marking a fundamental departure from how the grid has historically been managed. Flexibility comes in many forms, but broadly, it means the ability to respond over various time frames – from seconds to seasons – to changes in supply, demand, and net load. The more flexible the power system, the easier it is for grid operators to manage the system around variable supply and demand. As the grid decarbonizes, RTOs have an opportunity to ensure the market continues to work with as little friction as possible, minimizing overall system costs for customers.
As RTOs shift to the new grid management paradigm they will need to: 1) ensure market rules allow all technologies to compete to provide whatever valuable grid services they can; 2) adapt or create market products that extract latent flexibility out of the existing system and create a strong investment signal for new flexible resources; and 3) consider more fundamental changes to market structure to be better compatible with a highly renewable and more distributed future in which wholesale markets handle low or zero marginal cost resources effectively.
While changes to the ongoing operations of wholesale markets are necessary, they will be insufficient to fully support the grid transformation. Changes to planning processes, including reliability and resource adequacy approaches – administered by RTOs, public utility commissions (PUCs) and states – will be necessary in competitive power market regions. These capacity and planning issues deserve careful consideration, but are outside the scope of this paper.
THE HISTORY OF GRID MANAGEMENT AND OPERATIONS The 20th century approach to grid management was designed around the dominant resources of that era—large, baseload generating facilities with some dispatchable generators around the margin to meet variable and inflexible load. Power flowed in one direction: from large centralized generators out to customers. Demand was variable on its own schedule and relatively inflexible, but it was predictable in aggregate.
2 Different regions call this kind of organization by different names, but this paper uses the term “Regional Transmission Organization” (RTO) to refer to all non-profit centralized electric grid operators that operate a competitive market for electricity generation.
2
Balancing authorities3 controlled the grid under this framework, and ensured sufficient supply to dispatch around this demand. Dispatchable supply consisted primarily of large, inflexible plants – typically coal and nuclear – which were used for “baseload” power and more expensive, more flexible plants – usually oil, natural gas, and hydro – to help cover peak demand and deviations from predicted load.
This system worked well enough, and power plant owners were motivated by the market opportunity presented by the United States’ growing demand for electricity. But what happens when the system adds many near-zero marginal cost renewables during a period of stagnating electricity demand?
USING MARKETS TO MANAGE THE ELECTRICITY GRID: THE SITUATION TODAY The impact of the Public Utility Regulatory Policies Act and addition of new technologies towards the end of the 20th century demonstrated how competition might drive lower-cost options for power generation.4 In response, many regions of the U.S. restructured their power systems, creating RTOs to operate competitive power markets for bulk power. However, the design of markets focused on the dominant generation technologies and the traditional power system layout: large central power stations dispatched baseload-first to meet demand. At the time, the baseload plants were coming in at least-cost on a marginal basis, and “peaking” facilities cost more on a marginal basis. Given these criteria, the principle of least-cost dispatch based on marginal costs made sense and delivered an economically rational portfolio. Grid operators created markets for energy, contingency reserves, and ancillary services. RTOs also developed other mechanisms to account for limitations of the markets, including uplift payments and resource adequacy requirements.5 Management of the distribution system was left to the utilities.
ENERGY MARKETS Energy markets operate through an auction system in which generators (or energy service companies with real-time demand response capabilities), submit offers to produce energy, and buyers submit offers to purchase energy.6 Suppliers’ offers reflect the marginal cost to produce a unit of energy, i.e. the sum of the fuel, variable operations and maintenance, and other per-unit-energy costs. The marginal generator (the last generator to meet load, in order of price) sets the market-clearing price, which all 3 Balancing authorities are the entities charged with maintaining reliability on the grid through integrated resource planning and operation of the grid and include, depending on the region: utilities, co-ops, munis, federal power authorities, and RTOs/ISOs. 4 There were other reasons as well, for example, stagnant demand and oversupply of over-budget nuclear plants. For more information, see: Sonia Aggarwal and Robbie Orvis, “Distribution Optimization: Ready for Takeoff,” Public Utilities Fortnightly June 2015 (June 2015), https://www.fortnightly.com/fortnightly/2015/06/distribution-optimization-ready-takeoff. 5 Note that these categories are broad and general. Each RTO/ISO has more specific categorizations that may deviate from these. For example, some markets consider reserves part of ancillary services, while others consider them separate, unique products. 6 Other companies, in particular power marketers with no physical assets or load, also participate in the market. This is referred to as virtual bidding (or convergence bidding in CAISO). For more information, see: “Virtual Transactions in the PJM Energy Markets” (PJM Interconnection, LLC, October 12, 2015), http://www.pjm.com/~/media/committees-groups/committees/mc/20151019-webinar/20151019-item-02-virtual-transactions-in-the-pjm-energy-markets-whitepaper.ashx.
3
units are paid. Under this dynamic, no power plant produces power when it is uneconomic to do so, and units that offer energy at prices lower than the marginal unit are paid above their production costs.7 This is how generators recover long-run costs over the life of the plant.
The market operator enters supply and demand offers into a computer program that determines the most cost-effective set of resources to dispatch that maintains reliability. Generators and other resources selected by this software are then committed to generate energy. This process is referred to as security constrained economic dispatch (SCED).
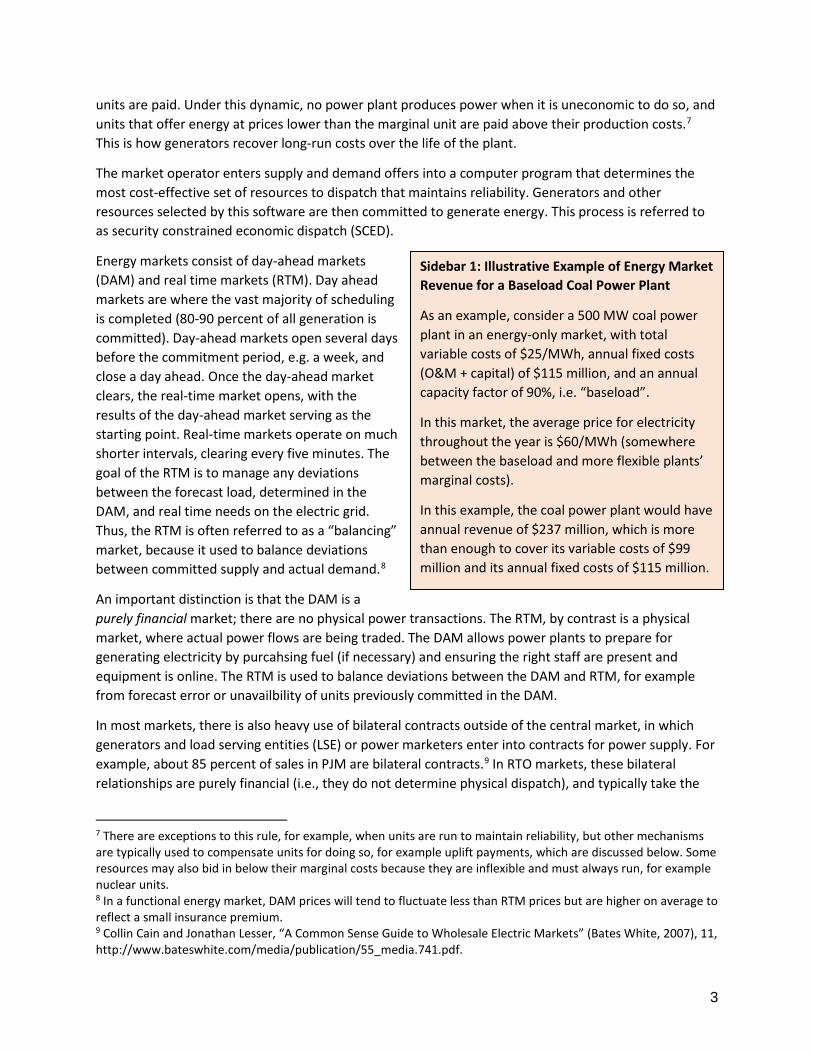
Energy markets consist of day-ahead markets (DAM) and real time markets (RTM). Day ahead markets are where the vast majority of scheduling is completed (80-90 percent of all generation is committed). Day-ahead markets open several days before the commitment period, e.g. a week, and close a day ahead. Once the day-ahead market clears, the real-time market opens, with the results of the day-ahead market serving as the starting point. Real-time markets operate on much shorter intervals, clearing every five minutes. The goal of the RTM is to manage any deviations between the forecast load, determined in the DAM, and real time needs on the electric grid. Thus, the RTM is often referred to as a “balancing” market, because it used to balance deviations between committed supply and actual demand.8
An important distinction is that the DAM is a purely financial market; there are no physical power transactions. The RTM, by contrast is a physical market, where actual power flows are being traded. The DAM allows power plants to prepare for generating electricity by purcahsing fuel (if necessary) and ensuring the right staff are present and equipment is online. The RTM is used to balance deviations between the DAM and RTM, for example from forecast error or unavailbility of units previously committed in the DAM.
In most markets, there is also heavy use of bilateral contracts outside of the central market, in which generators and load serving entities (LSE) or power marketers enter into contracts for power supply. For example, about 85 percent of sales in PJM are bilateral contracts.9 In RTO markets, these bilateral relationships are purely financial (i.e., they do not determine physical dispatch), and typically take the
7 There are exceptions to this rule, for example, when units are run to maintain reliability, but other mechanisms are typically used to compensate units for doing so, for example uplift payments, which are discussed below. Some resources may also bid in below their marginal costs because they are inflexible and must always run, for example nuclear units. 8 In a functional energy market, DAM prices will tend to fluctuate less than RTM prices but are higher on average to reflect a small insurance premium. 9 Collin Cain and Jonathan Lesser, “A Common Sense Guide to Wholesale Electric Markets” (Bates White, 2007), 11, http://www.bateswhite.com/media/publication/55_media.741.pdf.
Sidebar 1: Illustrative Example of Energy Market Revenue for a Baseload Coal Power Plant
As an example, consider a 500 MW coal power plant in an energy-only market, with total variable costs of $25/MWh, annual fixed costs (O&M + capital) of $115 million, and an annual capacity factor of 90%, i.e. “baseload”.
In this market, the average price for electricity throughout the year is $60/MWh (somewhere between the baseload and more flexible plants’ marginal costs).
In this example, the coal power plant would have annual revenue of $237 million, which is more than enough to cover its variable costs of $99 million and its annual fixed costs of $115 million.
4
form of contracts-for-differences, commonly referred to as synthetic power purchase agreements (PPAs). Under a contract-for-differences, both parties agree to a set price for energy, e.g. $30/MWh. The generator submits its energy in the DAM and RTM as it would normally and the LSE purchases electricity from the market as it would normally. If the price cleared in the market is above the agreed-upon price, the generator pays the purchaser this difference. Conversely, if the price cleared in the market is below the agreed upon price, the purchaser pays this difference to the generator. In either case, both parties pay the agreed upon price while committing units through the market. There are many other forms of bilateral contracting used widely across markets.
Even with bilateral contracting, the central grid operator maintains control of the physical balancing of the grid based on least-cost and reliability, while the bilateral contracts allow power plant owners and direct power purchasers to mitigate some price volatility risk. However, when bilateral contracts encourage power plants to self-schedule (in which they are price-takers, generating at any market clearing price), removing them from economic dispatch, they can introduce problems in the proper functioning of the markets. For example, when resources that could provide flexibility choose to self-schedule because of contract terms, they are unexposed to real time prices and therefore unmotivated to operate flexibly. Creating value for other important characteristics of resources, like flexibility, can encourage resources to offer the full suite of their capabilities to market operators. These issues are discussed in more detail below.
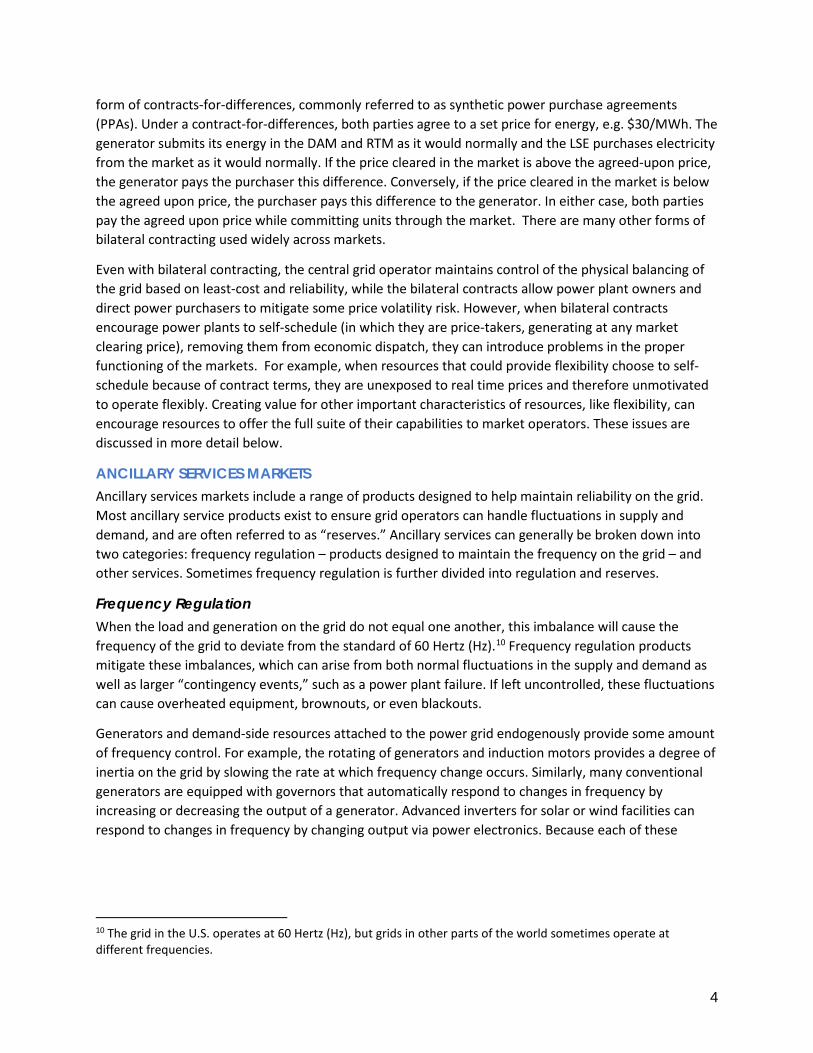
ANCILLARY SERVICES MARKETS Ancillary services markets include a range of products designed to help maintain reliability on the grid. Most ancillary service products exist to ensure grid operators can handle fluctuations in supply and demand, and are often referred to as “reserves.” Ancillary services can generally be broken down into two categories: frequency regulation – products designed to maintain the frequency on the grid – and other services. Sometimes frequency regulation is further divided into regulation and reserves.
Frequency Regulation When the load and generation on the grid do not equal one another, this imbalance will cause the frequency of the grid to deviate from the standard of 60 Hertz (Hz).10 Frequency regulation products mitigate these imbalances, which can arise from both normal fluctuations in the supply and demand as well as larger “contingency events,” such as a power plant failure. If left uncontrolled, these fluctuations can cause overheated equipment, brownouts, or even blackouts.
Generators and demand-side resources attached to the power grid endogenously provide some amount of frequency control. For example, the rotating of generators and induction motors provides a degree of inertia on the grid by slowing the rate at which frequency change occurs. Similarly, many conventional generators are equipped with governors that automatically respond to changes in frequency by increasing or decreasing the output of a generator. Advanced inverters for solar or wind facilities can respond to changes in frequency by changing output via power electronics. Because each of these
10 The grid in the U.S. operates at 60 Hertz (Hz), but grids in other parts of the world sometimes operate at different frequencies.
5
responses is automatic without the need for a dispatch signal, they are referred to as frequency response.11
Frequency response, which is automatic, can be differentiated from frequency regulation, which requires a signal from the grid operator. Power plants and other resources offering these services must be able to increase or decrease output, e.g. to ramp up if needed, and are therefore compensated for being ready to provide these services as well for providing them. In some instances, ancillary service market products expose this value and co-optimize the system including this value. However, not all RTOs have integrated co-optimized market-based reserve pricing and unit dispatch.12,13
Frequency regulation products are generally grouped based on the resources’ response time and duration over which the service can be provided:
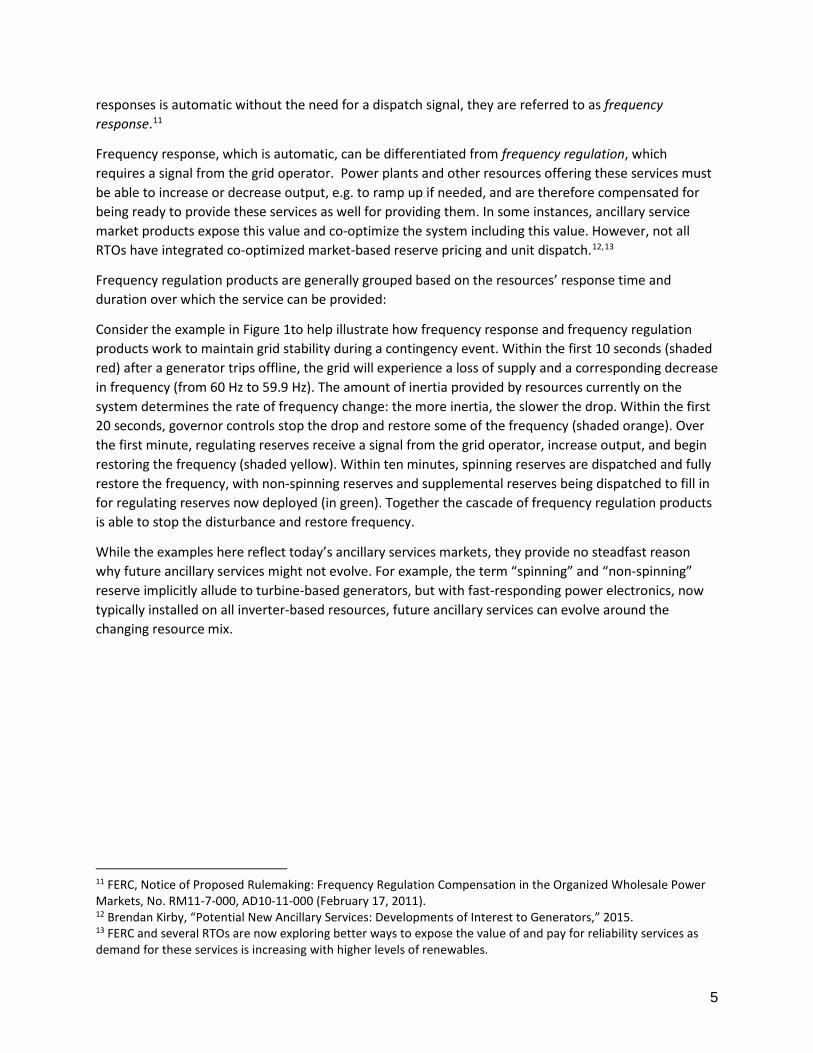
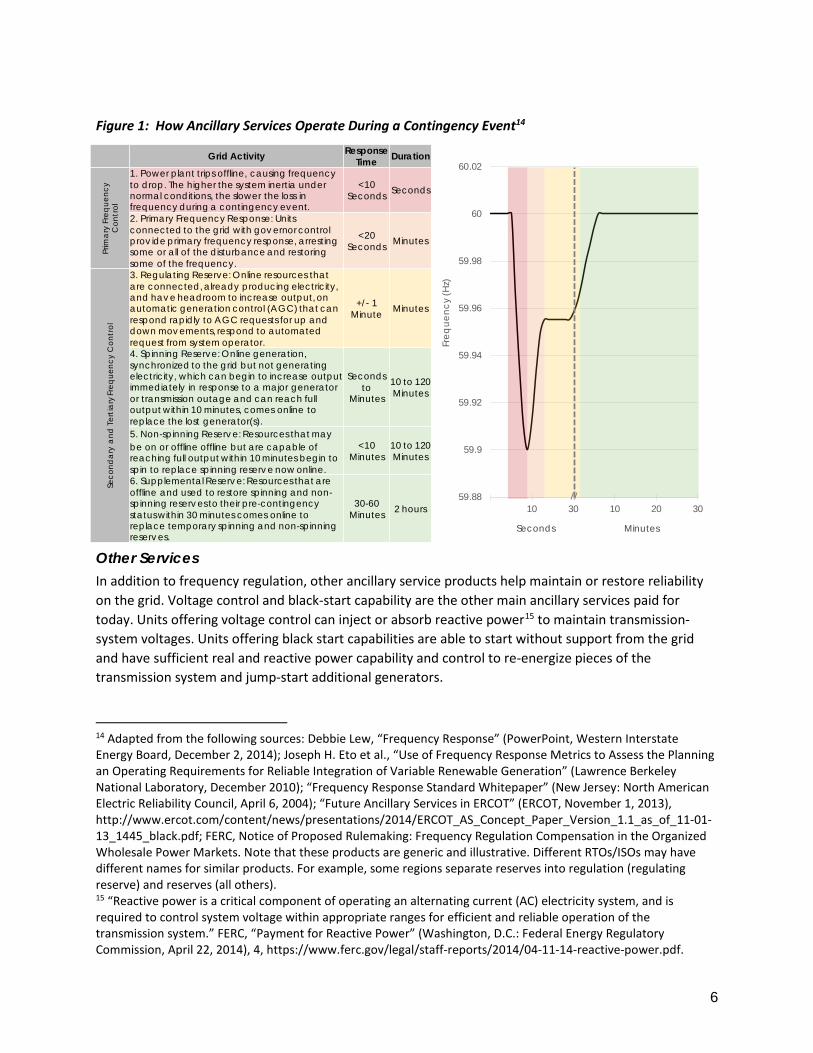
Consider the example in Figure 1to help illustrate how frequency response and frequency regulation products work to maintain grid stability during a contingency event. Within the first 10 seconds (shaded red) after a generator trips offline, the grid will experience a loss of supply and a corresponding decrease in frequency (from 60 Hz to 59.9 Hz). The amount of inertia provided by resources currently on the system determines the rate of frequency change: the more inertia, the slower the drop. Within the first 20 seconds, governor controls stop the drop and restore some of the frequency (shaded orange). Over the first minute, regulating reserves receive a signal from the grid operator, increase output, and begin restoring the frequency (shaded yellow). Within ten minutes, spinning reserves are dispatched and fully restore the frequency, with non-spinning reserves and supplemental reserves being dispatched to fill in for regulating reserves now deployed (in green). Together the cascade of frequency regulation products is able to stop the disturbance and restore frequency.
While the examples here reflect today’s ancillary services markets, they provide no steadfast reason why future ancillary services might not evolve. For example, the term “spinning” and “non-spinning” reserve implicitly allude to turbine-based generators, but with fast-responding power electronics, now typically installed on all inverter-based resources, future ancillary services can evolve around the changing resource mix.
11 FERC, Notice of Proposed Rulemaking: Frequency Regulation Compensation in the Organized Wholesale Power Markets, No. RM11-7-000, AD10-11-000 (February 17, 2011). 12 Brendan Kirby, “Potential New Ancillary Services: Developments of Interest to Generators,” 2015. 13 FERC and several RTOs are now exploring better ways to expose the value of and pay for reliability services as demand for these services is increasing with higher levels of renewables.
6
Other Services14 In addition to frequency regulation, other ancillary service products help maintain or restore reliability on the grid. Voltage control and black-start capability are the other main ancillary services paid for today. Units offering voltage control can inject or absorb reactive power15 to maintain transmission-system voltages. Units offering black start capabilities are able to start without support from the grid and have sufficient real and reactive power capability and control to re-energize pieces of the transmission system and jump-start additional generators.
14 Adapted from the following sources: Debbie Lew, “Frequency Response” (PowerPoint, Western Interstate Energy Board, December 2, 2014); Joseph H. Eto et al., “Use of Frequency Response Metrics to Assess the Planning an Operating Requirements for Reliable Integration of Variable Renewable Generation” (Lawrence Berkeley National Laboratory, December 2010); “Frequency Response Standard Whitepaper” (New Jersey: North American Electric Reliability Council, April 6, 2004); “Future Ancillary Services in ERCOT” (ERCOT, November 1, 2013), http://www.ercot.com/content/news/presentations/2014/ERCOT_AS_Concept_Paper_Version_1.1_as_of_11-01-13_1445_black.pdf; FERC, Notice of Proposed Rulemaking: Frequency Regulation Compensation in the Organized Wholesale Power Markets. Note that these products are generic and illustrative. Different RTOs/ISOs may have different names for similar products. For example, some regions separate reserves into regulation (regulating reserve) and reserves (all others). 15 “Reactive power is a critical component of operating an alternating current (AC) electricity system, and is required to control system voltage within appropriate ranges for efficient and reliable operation of the transmission system.” FERC, “Payment for Reactive Power” (Washington, D.C.: Federal Energy Regulatory Commission, April 22, 2014), 4, https://www.ferc.gov/legal/staff-reports/2014/04-11-14-reactive-power.pdf.
Figure 1: How Ancillary Services Operate During a Contingency Event14
Grid Activity Response Time Duration
Prim
ary
Fre
que
ncy
Con
trol
1. Power plant trips offline, causing frequency to drop. The higher the system inertia under normal conditions, the slower the loss in frequency during a contingency event.
<10 Seconds Seconds
2. Primary Frequency Response: Units connected to the grid with governor control prov ide primary frequency response, arresting some or all of the disturbance and restoringsome of the frequency.
<20 Seconds Minutes
Seco
nda
ry a
nd T
ertia
ry F
req
uenc
y C
ontr
ol
3. Regulating Reserve: Online resources that are connected, already producing electricity, and have headroom to increase output, on automatic generation control (AGC) that can respond rapidly to AGC requests for up and down movements, respond to automated request from system operator.
+/- 1 Minute Minutes
4. Spinning Reserve: Online generation, synchronized to the grid but not generating electricity, which can begin to increase output immediately in response to a major generator or transmission outage and can reach full output within 10 minutes, comes online to replace the lost generator(s).
Seconds to
Minutes
10 to 120 Minutes
5. Non-spinning Reserve: Resources that may be on or offline offline but are capable of reaching full output within 10 minutes begin to spin to replace spinning reserve now online.
<10 Minutes
10 to 120 Minutes
6. Supplemental Reserve: Resources that are offline and used to restore spinning and non-spinning reserves to their pre-contingency status within 30 minutes comes online to replace temporary spinning and non-spinning reserves.
30-60 Minutes 2 hours
59.88
59.9
59.92
59.94
59.96
59.98
60
60.02
10 30 10 20 30
Freq
uenc
y (H
z)
//
Seconds Minutes
7
UPLIFT PAYMENTS Current energy and ancillary services markets (and their underlying computer software) do not fully capture all of today’s grid dynamics. In certain instances, RTOs make out-of-market adjustments to resources in order to maintain reliability. When this happens, market operators sometimes pay the resources providing the reliability service to maintain reliability an out-of-market payment, referred to as “uplift,” to compensate them for providing the service.
One type of uplift occurs when actual operating costs exceed market-clearing prices that result in a generator being committed. For example, startup costs may not be included in market clearing prices, and so a unit may be committed even when its actual costs to start and generate exceed the clearing price during that time interval.16 In some markets, generators are able to recover their startup costs when they exceed the market-clearing price.
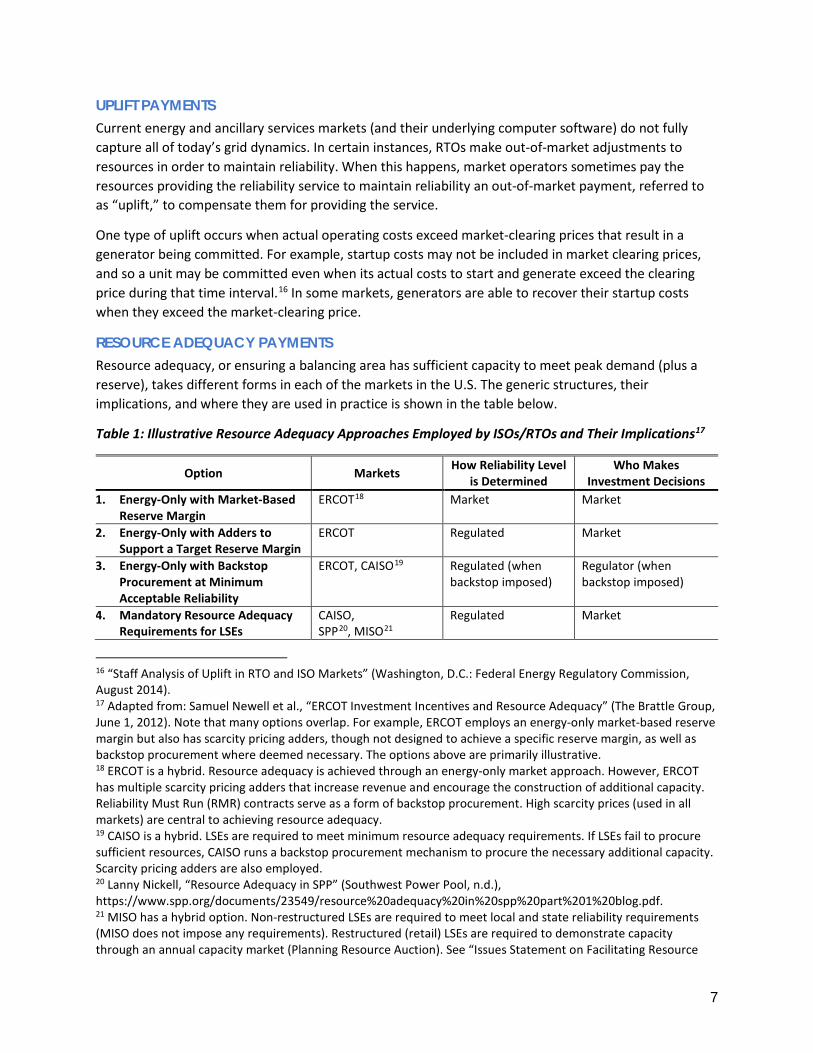
RESOURCE ADEQUACY PAYMENTS Resource adequacy, or ensuring a balancing area has sufficient capacity to meet peak demand (plus a reserve), takes different forms in each of the markets in the U.S. The generic structures, their implications, and where they are used in practice is shown in the table below.
Table 1: Illustrative Resource Adequacy Approaches Employed by ISOs/RTOs and Their Implications17
Option Markets How Reliability Level is Determined
Who Makes Investment Decisions
1. Energy-Only with Market-Based Reserve Margin
ERCOT18 Market Market
2. Energy-Only with Adders to Support a Target Reserve Margin
ERCOT Regulated Market
3. Energy-Only with Backstop Procurement at Minimum Acceptable Reliability
ERCOT, CAISO19 Regulated (when backstop imposed)
Regulator (when backstop imposed)
4. Mandatory Resource Adequacy Requirements for LSEs
CAISO, SPP20, MISO21
Regulated Market
16 “Staff Analysis of Uplift in RTO and ISO Markets” (Washington, D.C.: Federal Energy Regulatory Commission, August 2014). 17 Adapted from: Samuel Newell et al., “ERCOT Investment Incentives and Resource Adequacy” (The Brattle Group, June 1, 2012). Note that many options overlap. For example, ERCOT employs an energy-only market-based reserve margin but also has scarcity pricing adders, though not designed to achieve a specific reserve margin, as well as backstop procurement where deemed necessary. The options above are primarily illustrative. 18 ERCOT is a hybrid. Resource adequacy is achieved through an energy-only market approach. However, ERCOT has multiple scarcity pricing adders that increase revenue and encourage the construction of additional capacity. Reliability Must Run (RMR) contracts serve as a form of backstop procurement. High scarcity prices (used in all markets) are central to achieving resource adequacy. 19 CAISO is a hybrid. LSEs are required to meet minimum resource adequacy requirements. If LSEs fail to procure sufficient resources, CAISO runs a backstop procurement mechanism to procure the necessary additional capacity. Scarcity pricing adders are also employed. 20 Lanny Nickell, “Resource Adequacy in SPP” (Southwest Power Pool, n.d.), https://www.spp.org/documents/23549/resource%20adequacy%20in%20spp%20part%201%20blog.pdf. 21 MISO has a hybrid option. Non-restructured LSEs are required to meet local and state reliability requirements (MISO does not impose any requirements). Restructured (retail) LSEs are required to demonstrate capacity through an annual capacity market (Planning Resource Auction). See “Issues Statement on Facilitating Resource
8
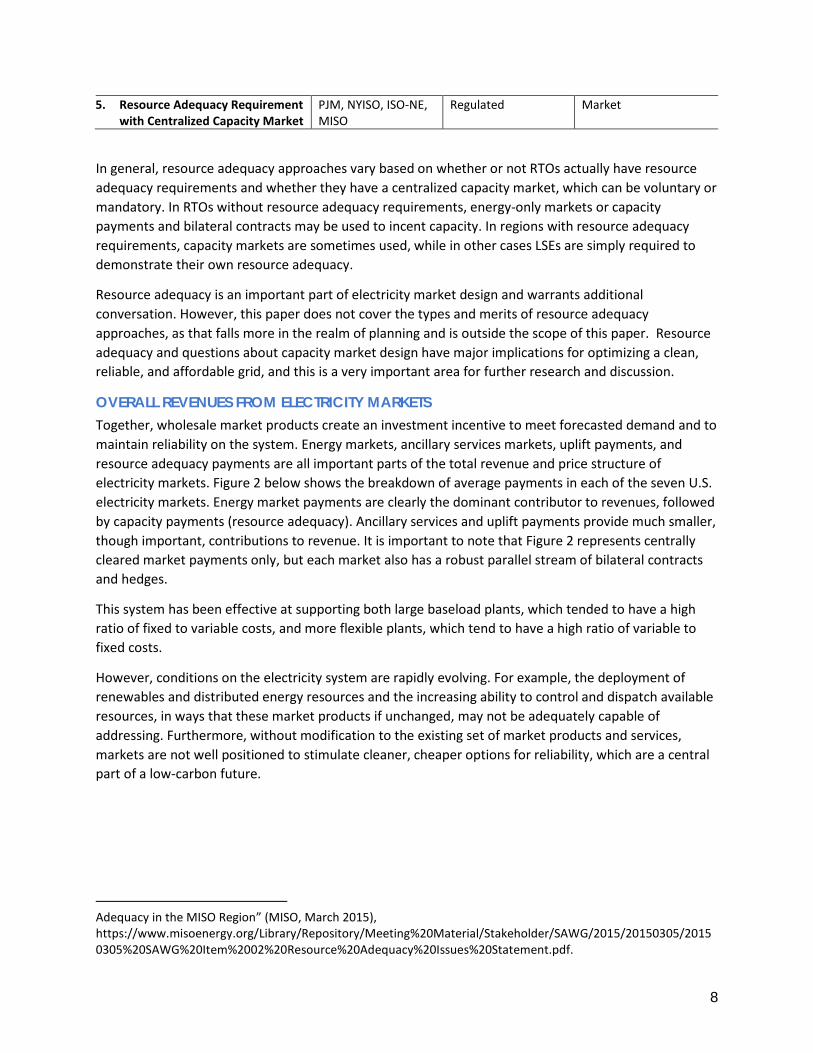
5. Resource Adequacy Requirement with Centralized Capacity Market
PJM, NYISO, ISO-NE, MISO
Regulated Market
In general, resource adequacy approaches vary based on whether or not RTOs actually have resource adequacy requirements and whether they have a centralized capacity market, which can be voluntary or mandatory. In RTOs without resource adequacy requirements, energy-only markets or capacity payments and bilateral contracts may be used to incent capacity. In regions with resource adequacy requirements, capacity markets are sometimes used, while in other cases LSEs are simply required to demonstrate their own resource adequacy.
Resource adequacy is an important part of electricity market design and warrants additional conversation. However, this paper does not cover the types and merits of resource adequacy approaches, as that falls more in the realm of planning and is outside the scope of this paper. Resource adequacy and questions about capacity market design have major implications for optimizing a clean, reliable, and affordable grid, and this is a very important area for further research and discussion.
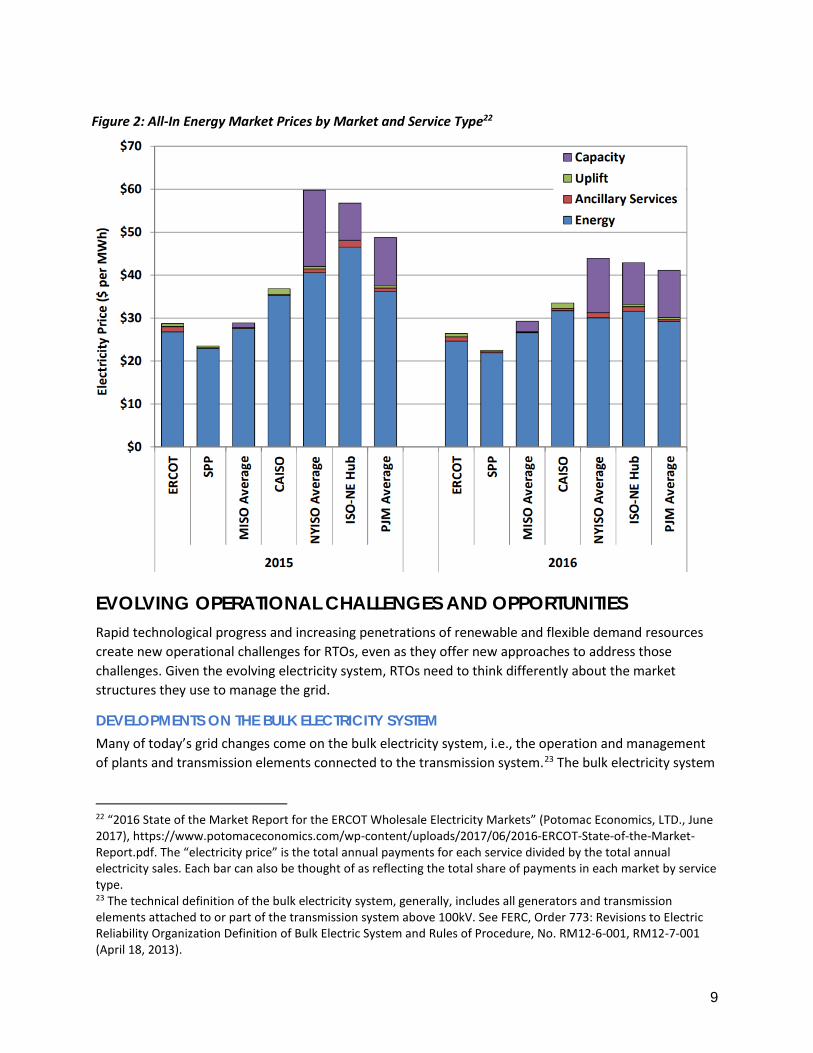
OVERALL REVENUES FROM ELECTRICITY MARKETS Together, wholesale market products create an investment incentive to meet forecasted demand and to maintain reliability on the system. Energy markets, ancillary services markets, uplift payments, and resource adequacy payments are all important parts of the total revenue and price structure of electricity markets. Figure 2 below shows the breakdown of average payments in each of the seven U.S. electricity markets. Energy market payments are clearly the dominant contributor to revenues, followed by capacity payments (resource adequacy). Ancillary services and uplift payments provide much smaller, though important, contributions to revenue. It is important to note that Figure 2 represents centrally cleared market payments only, but each market also has a robust parallel stream of bilateral contracts and hedges.
This system has been effective at supporting both large baseload plants, which tended to have a high ratio of fixed to variable costs, and more flexible plants, which tend to have a high ratio of variable to fixed costs.
However, conditions on the electricity system are rapidly evolving. For example, the deployment of renewables and distributed energy resources and the increasing ability to control and dispatch available resources, in ways that these market products if unchanged, may not be adequately capable of addressing. Furthermore, without modification to the existing set of market products and services, markets are not well positioned to stimulate cleaner, cheaper options for reliability, which are a central part of a low-carbon future.
Adequacy in the MISO Region” (MISO, March 2015), https://www.misoenergy.org/Library/Repository/Meeting%20Material/Stakeholder/SAWG/2015/20150305/20150305%20SAWG%20Item%2002%20Resource%20Adequacy%20Issues%20Statement.pdf.
9
EVOLVING OPERATIONAL CHALLENGES AND OPPORTUNITIES Rapid technological progress and increasing penetrations of renewable and flexible demand resources create new operational challenges for RTOs, even as they offer new approaches to address those challenges. Given the evolving electricity system, RTOs need to think differently about the market structures they use to manage the grid. 22
DEVELOPMENTS ON THE BULK ELECTRICITY SYSTEM Many of today’s grid changes come on the bulk electricity system, i.e., the operation and management of plants and transmission elements connected to the transmission system.23 The bulk electricity system
22 “2016 State of the Market Report for the ERCOT Wholesale Electricity Markets” (Potomac Economics, LTD., June 2017), https://www.potomaceconomics.com/wp-content/uploads/2017/06/2016-ERCOT-State-of-the-Market-Report.pdf. The “electricity price” is the total annual payments for each service divided by the total annual electricity sales. Each bar can also be thought of as reflecting the total share of payments in each market by service type. 23 The technical definition of the bulk electricity system, generally, includes all generators and transmission elements attached to or part of the transmission system above 100kV. See FERC, Order 773: Revisions to Electric Reliability Organization Definition of Bulk Electric System and Rules of Procedure, No. RM12-6-001, RM12-7-001 (April 18, 2013).
Figure 2: All-In Energy Market Prices by Market and Service Type22
10
is the domain of RTOs while the distribution system has historically been the domain of distribution utilities (though that could evolve in the future24).
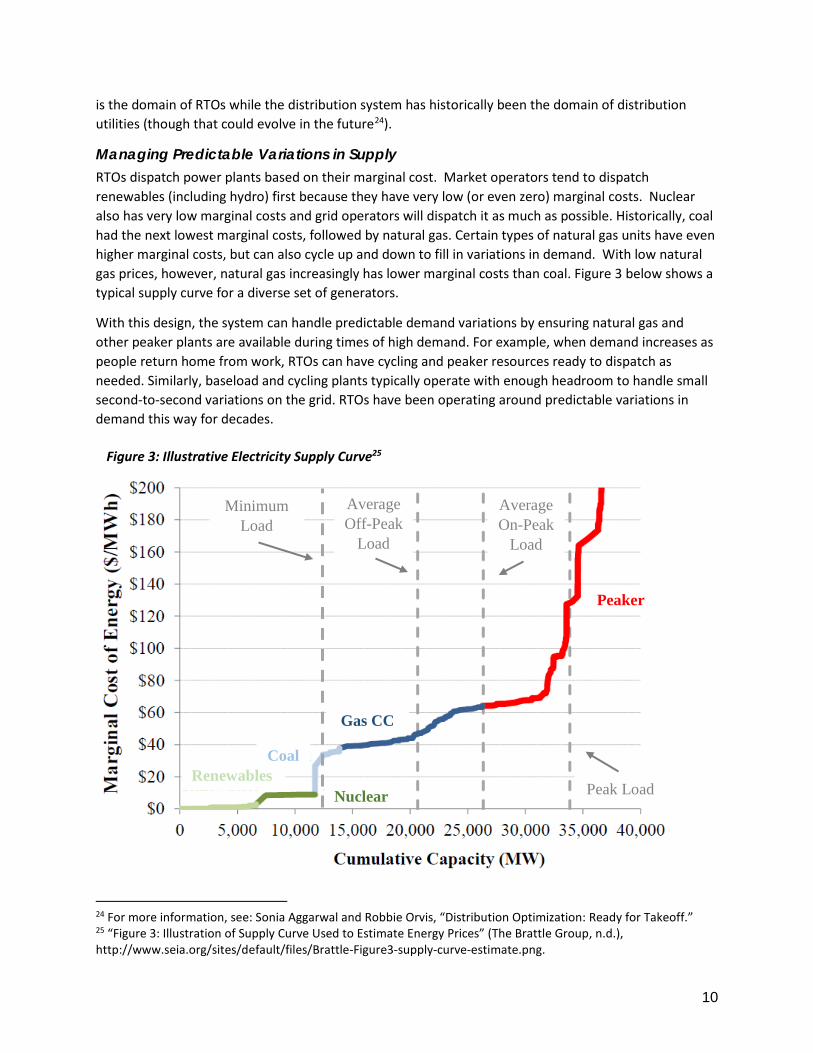
Managing Predictable Variations in Supply RTOs dispatch power plants based on their marginal cost. Market operators tend to dispatch renewables (including hydro) first because they have very low (or even zero) marginal costs. Nuclear also has very low marginal costs and grid operators will dispatch it as much as possible. Historically, coal had the next lowest marginal costs, followed by natural gas. Certain types of natural gas units have even higher marginal costs, but can also cycle up and down to fill in variations in demand. With low natural gas prices, however, natural gas increasingly has lower marginal costs than coal. Figure 3 below shows a typical supply curve for a diverse set of generators.
With this design, the system can handle predictable demand variations by ensuring natural gas and other peaker plants are available during times of high demand. For example, when demand increases as people return home from work, RTOs can have cycling and peaker resources ready to dispatch as needed. Similarly, baseload and cycling plants typically operate with enough headroom to handle small second-to-second variations on the grid. RTOs have been operating around predictable variations in demand this way for decades. 25
24 For more information, see: Sonia Aggarwal and Robbie Orvis, “Distribution Optimization: Ready for Takeoff.” 25 “Figure 3: Illustration of Supply Curve Used to Estimate Energy Prices” (The Brattle Group, n.d.), http://www.seia.org/sites/default/files/Brattle-Figure3-supply-curve-estimate.png.
Figure 3: Illustrative Electricity Supply Curve25
Minimum Load
Average Off-Peak
Load
Average On-Peak
Load
Peak Load Renewables
Coal
Gas CC
Nuclear
Peaker
11
Higher levels of renewables will create predictable times when supply will decrease quickly, much like how demand increases quickly when people come home in the evening. For example, when the sun goes down, solar panels will cease providing power, so other resources, such as flexible (decreasing or shifting) demand, other flexible generators, or storage will be necessary to keep the system balanced.
Managing grid resources to account for predictable variations is not a novel concept. The sun rising and setting is predictable (as are other environmental factors like wind speed), much like grid operators can predict increased demand when people return home from work or a power plant goes offline for maintenance. Grid managers are used to managing the electricity system to accommodate this kind of variation; the main difference in a high renewables grid is that the magnitude of the variation may be larger, especially if resources are not balanced over a wide area.
Managing Unpredictable Variations in Supply In the past, unpredictable supply and load variations have been limited to failures of large equipment, such as transmission equipment and generators tripping offline, and sudden changes in load, for example from an industrial customer turning on equipment. RTOs know these events will occur, but not necessarily when or where on the system they will happen.
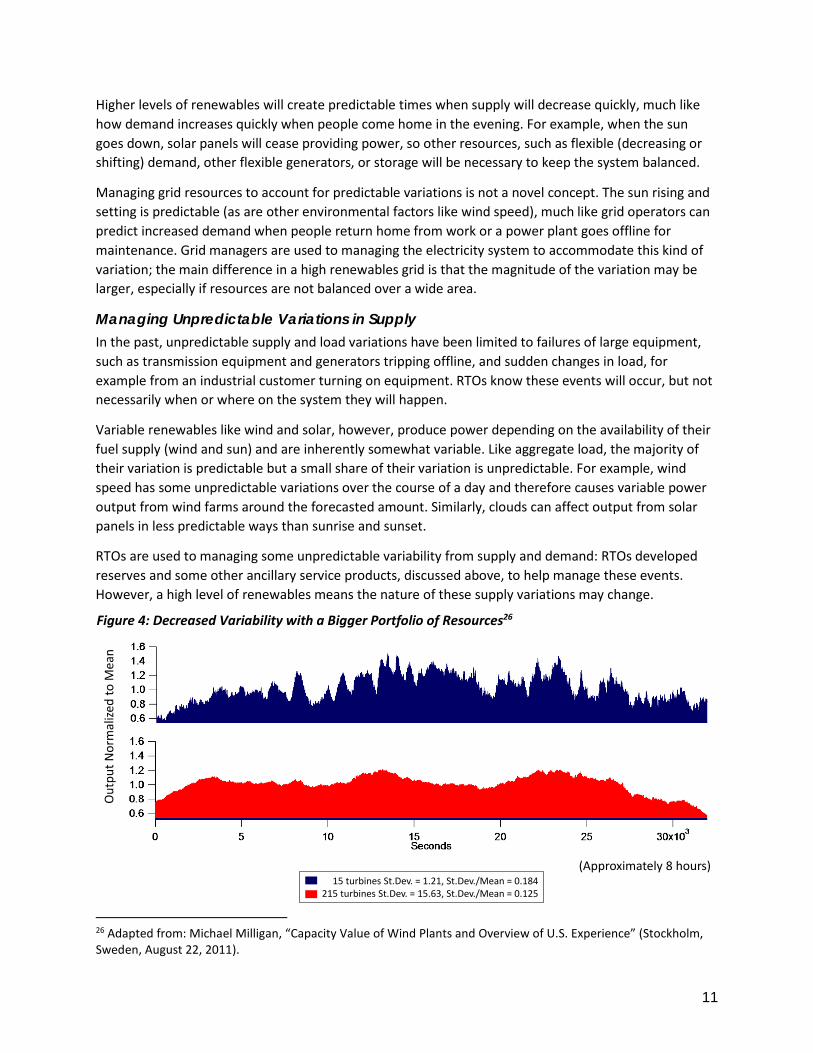
Variable renewables like wind and solar, however, produce power depending on the availability of their fuel supply (wind and sun) and are inherently somewhat variable. Like aggregate load, the majority of their variation is predictable but a small share of their variation is unpredictable. For example, wind speed has some unpredictable variations over the course of a day and therefore causes variable power output from wind farms around the forecasted amount. Similarly, clouds can affect output from solar panels in less predictable ways than sunrise and sunset.
RTOs are used to managing some unpredictable variability from supply and demand: RTOs developed reserves and some other ancillary service products, discussed above, to help manage these events. However, a high level of renewables means the nature of these supply variations may change. 26
26 Adapted from: Michael Milligan, “Capacity Value of Wind Plants and Overview of U.S. Experience” (Stockholm, Sweden, August 22, 2011).
Figure 4: Decreased Variability with a Bigger Portfolio of Resources26
(Approximately 8 hours)
Out
put N
orm
alize
d to
Mea
n
15 turbines St.Dev. = 1.21, St.Dev./Mean = 0.184215 turbines St.Dev. = 15.63, St.Dev./Mean = 0.125
12
RTOs have many ways to deal with both the predictable and unpredictable variations in supply from renewables. Many of the market design solutions are discussed later in this paper, but system characteristics and operational upgrades can also help. For example, wind variability decreases with distance and a greater number of turbines, so part of the solution to the naturally variable nature of wind and solar is to build more turbines and balance them over a wider geographical footprint. As an operational example, improved forecasting tools and more granular dispatch intervals can allow RTOs to make some of the less foreseeable variations predictable. New products and services can help ensure sufficient flexible resources to manage this variability.
As RTOs consider how to manage increased power system supply variation, they will need to think about resources as a dynamic portfolio. Similarly, managing a portfolio of variable resources is somewhat of a departure from historical practices, and RTOs will need to consider whether they need new tradeable products and updated requirements to ensure the system’s balancing capability. Indeed, some RTOs have already started integrating new products and adjusting product definitions, for example the Dispatchable Intermittent Resource in MISO and Regulation D ancillary services in PJM (both discussed further below).
Fortunately, operating the grid with forecasted levels of renewables should not be a near-term problem. Many studies have shown that even with penetrations of up to 50% or higher, variability in output is manageable.27 However, managing this transition requires RTOs to think of existing services and technologies in new ways and may require new products and services.
DEVELOPMENTS ON THE DISTRIBUTION SYSTEM Changes are also taking place on the distribution system. Increasing penetrations of distributed energy resources are changing load profiles while creating new opportunities to manage the grid more effectively, for example through flexible load and the ability to offer grid services at very low cost.
Managing “Invisible” Distributed Resources The electricity grid is broken up into two segments: the transmission grid and the distribution grid. The transmission grid carries high voltage power from generating plants to load centers. Once at or near the load centers, the electricity voltage is “stepped down” at substations to lower voltages and distributed on lower voltage wires that carry energy to buildings and other end-use sites. Distributed energy resources (DERs), for example solar panels on a home, connect to the distribution system while a traditional large power plant connects to the transmission system.
Wholesale electricity markets established independent market authorities to manage the transmission system, but left management of the distribution system to distribution utilities. Thus, RTOs manage units connected only to the transmission system, where they can “see” these resources via real-time physical telemetry, and dispatch them through direct controls or market mechanisms.
DERs including rooftop solar (with and without storage), electric vehicles, smart appliances, and storage are changing this dynamic by introducing resources that sit on the distribution system (often behind
27 For example, see: Aaron Bloom et al., “Eastern Renewable Generation Integration Study” (Golden, CO: National Renewable Energy Laboratory, August 2016), http://www.nrel.gov/docs/fy16osti/64472.pdf; N.W. Miller et al., “Western Wind and Solar Integration Study Phase 3 - Frequency Response and Transient Stability” (Golden, CO: National Renewable Energy Laboratory, December 2014), http://www.nrel.gov/docs/fy15osti/62906.pdf.
13
customer meters) and act independently, but affect grid operations. Because RTOs cannot see DERs, load forecasting becomes more challenging. Unlike a large power plant that connects to the transmission system with sophisticated telemetry, a rooftop solar system for example, connects to the distribution system where it offsets some electricity consumption and may contribute power to the distribution system without RTO-level telemetry. Thus, higher shares of DERs require grid managers to plan for and operate the grid around resources that change the shape of demand in new, sometimes dramatic, ways.
This creates challenges for grid operators because they cannot “see” these resources, which sit below the substation, the same way they can “see” a large transmission connected generator. However, as higher penetrations distributed energy resources are realized, utilities and RTOs are increasingly looking to aggregators to manage these resources on the distribution system and bid them in as a virtual resource to the RTO. The role of aggregators is evolving and will likely grow in importance in the coming years.
DER installers and aggregators often have useful data about the location, functionality, and sometimes the real-time status of these DERs, but systems are not always in place to share that information with grid operators. RTOs need new techniques and enhanced coordination with distribution utilities to improve load forecasting to account for and take advantage of DERs. These needs exist both in the short-term, to support
Sidebar 2: The increasingly blurred line between retail and wholesale markets
The growing ability of consumers to manage and sell their energy resources into different markets is generating new regulatory and legal questions. States mostly regulate the distribution grid and retail sales to consumers, and FERC regulates the transmission system and wholesale sales for resale of electricity in interstate commerce. But unlike the clear point where transmission and distribution systems meet, the regulatory line between wholesale and retail sales is much less clear than in the past. For example, what is the regulatory role, if any, for a state commission when a homeowner wants to sell their “negawatts” of lower energy consumption into a FERC-regulated regional wholesale market? What if a homeowner wants to sell energy from their electric car into a wholesale market and charge the car under a retail rate? Wholesale and retail market rules are very different and were created largely without reference to each other. To maximize the value of DERs for consumers and the power grid, state and federal regulators will need to tackle these questions and harmonize conflicts.
In the future, distribution utilities may serve different roles than they do today. Some distribution utilities may aggregate distributed energy resources on their systems and bid these into a market run by either the RTO or a distribution system optimizer (DSO). Other utilities may operate as the DSO themselves, like the distribution system platform provider model put forth in New York28. In both instances, a central optimizer, either an independent body or the utility itself, may operate a market for service provided by resources on the distribution system and interface with the RTO to offer these services. -John Moore, Sustainable FERC Project
14
operations, and in the longer-term, for infrastructure planning. 28
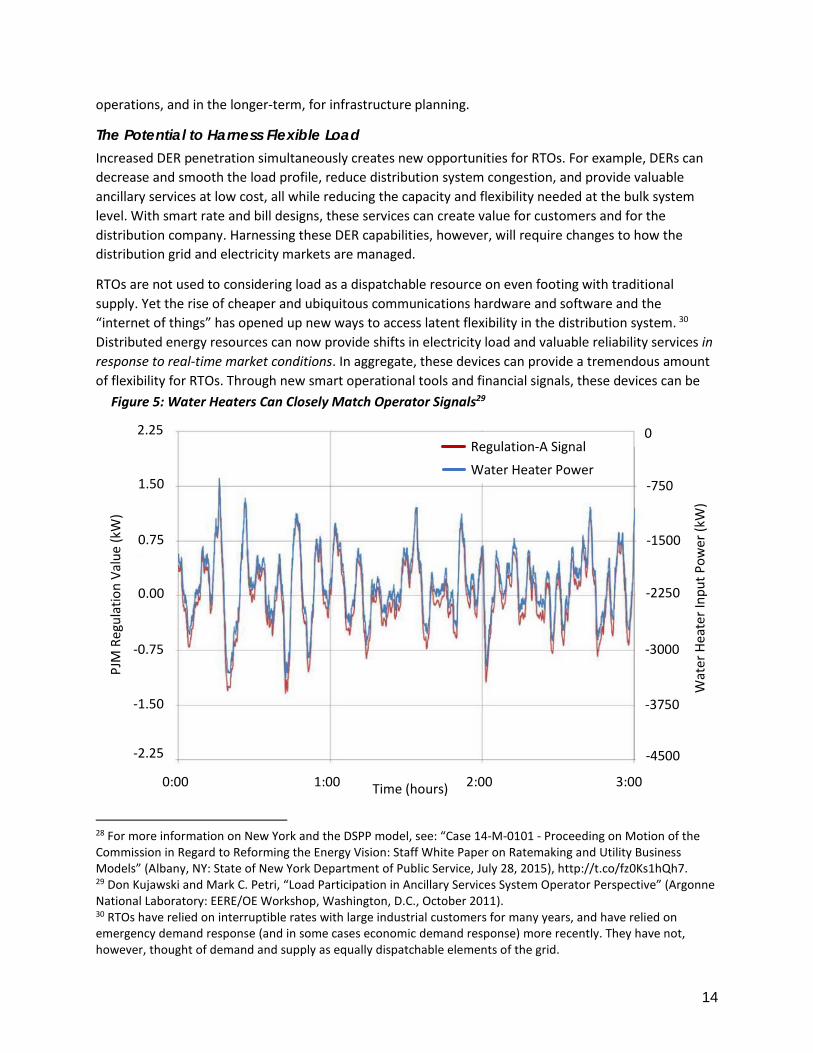
The Potential to Harness Flexible Load Increased DER penetration simultaneously creates new opportunities for RTOs. For example, DERs can decrease and smooth the load profile, reduce distribution system congestion, and provide valuable ancillary services at low cost, all while reducing the capacity and flexibility needed at the bulk system level. With smart rate and bill designs, these services can create value for customers and for the distribution company. Harnessing these DER capabilities, however, will require changes to how the distribution grid and electricity markets are managed. 29
RTOs are not used to considering load as a dispatchable resource on even footing with traditional supply. Yet the rise of cheaper and ubiquitous communications hardware and software and the “internet of things” has opened up new ways to access latent flexibility in the distribution system. 30 Distributed energy resources can now provide shifts in electricity load and valuable reliability services in response to real-time market conditions. In aggregate, these devices can provide a tremendous amount of flexibility for RTOs. Through new smart operational tools and financial signals, these devices can be
28 For more information on New York and the DSPP model, see: “Case 14-M-0101 - Proceeding on Motion of the Commission in Regard to Reforming the Energy Vision: Staff White Paper on Ratemaking and Utility Business Models” (Albany, NY: State of New York Department of Public Service, July 28, 2015), http://t.co/fz0Ks1hQh7. 29 Don Kujawski and Mark C. Petri, “Load Participation in Ancillary Services System Operator Perspective” (Argonne National Laboratory: EERE/OE Workshop, Washington, D.C., October 2011). 30 RTOs have relied on interruptible rates with large industrial customers for many years, and have relied on emergency demand response (and in some cases economic demand response) more recently. They have not, however, thought of demand and supply as equally dispatchable elements of the grid.
PJM
Reg
ulat
ion
Valu
e (k
W)
2.25
1.50
0.75
0.00
-0.75
-1.50
-2.25
Regulation-A Signal Water Heater Power
-750
-1500
-2250
-3000
-3750
0
-4500
Wat
er H
eate
r Inp
ut P
ower
(kW
)
Time (hours) 0:00 1:00 2:00 3:00
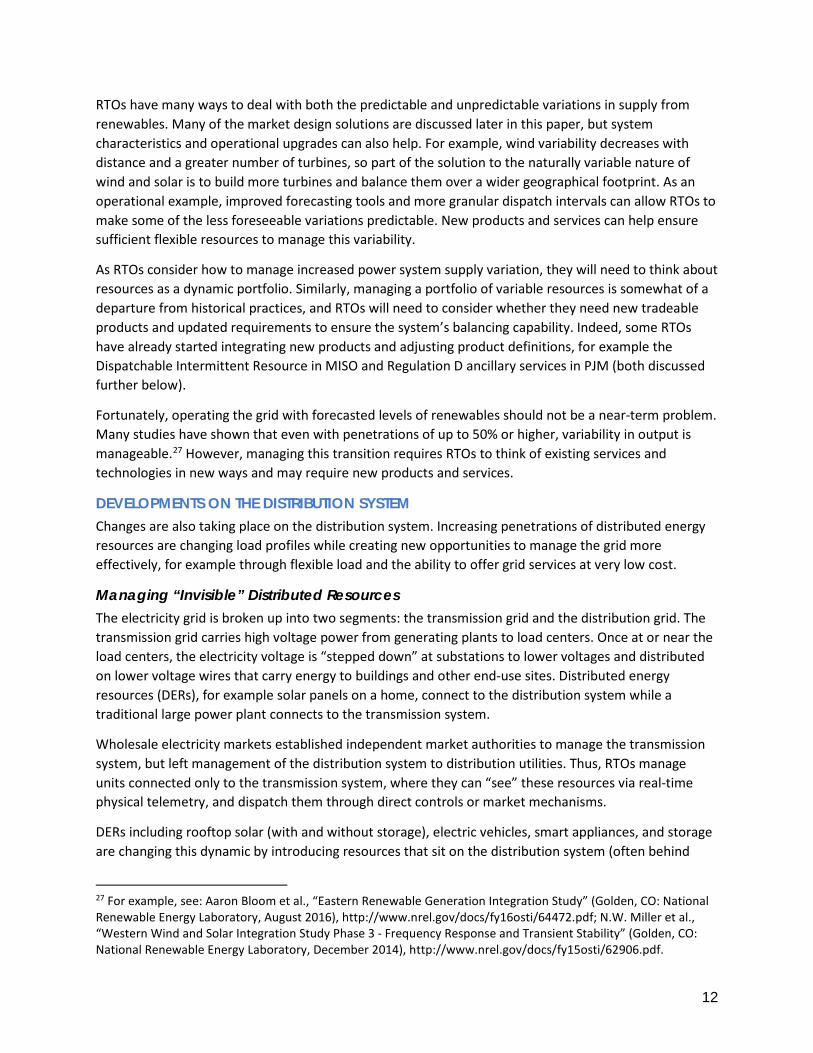
Figure 5: Water Heaters Can Closely Match Operator Signals29
15
co-optimized with generation resources to improve reliability and lower overall system costs. For example, Figure 5 shows how aggregated water heaters can provide a valuable source of flexibility to grid operators.
RTOs might take several paths to integrate DERs and unlock these services: building the bulk markets with future DER deployment in mind, creating financial signals that reward DERs for providing the same services that bulk system resources provide (and giving them comparable treatment), and modernizing the roles and functions of distribution utilities to take advantage of DERs and increase RTO coordination.
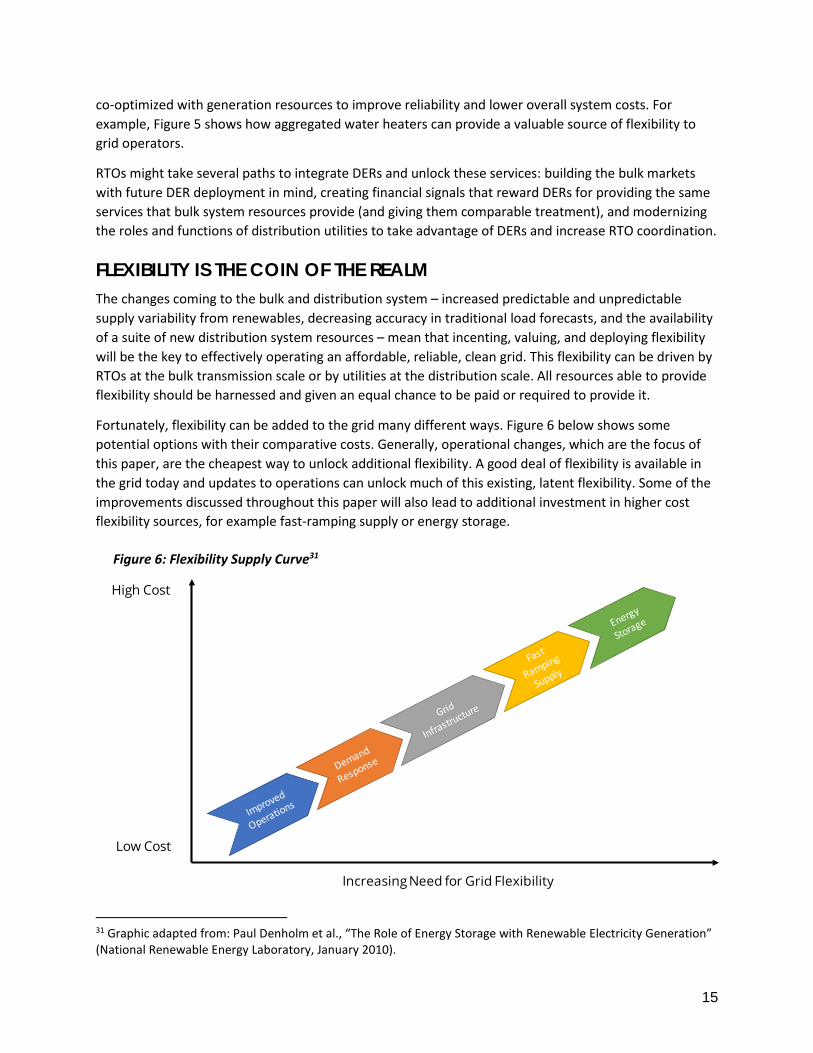
FLEXIBILITY IS THE COIN OF THE REALM The changes coming to the bulk and distribution system – increased predictable and unpredictable supply variability from renewables, decreasing accuracy in traditional load forecasts, and the availability of a suite of new distribution system resources – mean that incenting, valuing, and deploying flexibility will be the key to effectively operating an affordable, reliable, clean grid. This flexibility can be driven by RTOs at the bulk transmission scale or by utilities at the distribution scale. All resources able to provide flexibility should be harnessed and given an equal chance to be paid or required to provide it.
Fortunately, flexibility can be added to the grid many different ways. Figure 6 below shows some potential options with their comparative costs. Generally, operational changes, which are the focus of this paper, are the cheapest way to unlock additional flexibility. A good deal of flexibility is available in the grid today and updates to operations can unlock much of this existing, latent flexibility. Some of the improvements discussed throughout this paper will also lead to additional investment in higher cost flexibility sources, for example fast-ramping supply or energy storage. 31
31 Graphic adapted from: Paul Denholm et al., “The Role of Energy Storage with Renewable Electricity Generation” (National Renewable Energy Laboratory, January 2010).
Increasing Need for Grid Flexibility
High Cost
Low Cost
Figure 6: Flexibility Supply Curve31
16
Proactive improvements to rules and traded market products can help ensure the grid has sufficient flexibility to maintain reliability as new resources come online and old ones retire. RTOs should aim to harness latent flexibility in the existing system and generate new flexibility by updating rules and creating market products that appropriately expose the value of, and tap into, this flexibility.
Given the changes underway, wholesale power markets must adapt by refining market rules to unlock the latent flexibility of existing resources and introducing new products or modifying existing products that harness the flexibility of existing resources and create an investment signal for new flexible resources. The sections below discuss these needs in detail and present some good and bad case studies of existing market designs and practices.
REFINING MARKET RULES TO UNLOCK FLEXIBILTY OF EXISTING RESOURCES32 Tapping into unused flexibility available on the grid today requires updates to market rules – restrictions, exceptions, definitions of resources, and technology requirements – around which the system was originally designed. Many of the RTOs in the U.S. are already tackling some of these changes, with a noticeable increase in the amount of flexibility on the grid and improved ability to integrate renewables. However, RTOs can tap the tremendous wealth of additional flexibility potential by increasing the share of resources that participate in economic dispatch, improving price signals, removing barriers to resources participating in markets, and better aligning natural gas markets with electricity markets.
Require All Generators and Imports to Participate in Economic Dispatch Most RTOs allow resources to choose between being dispatched based on the market price of energy, or to schedule resources to dispatch regardless of price as “self-scheduled” price-takers. Resources might choose to self-schedule for several reasons.
First, resources with very low or zero marginal costs may choose to self-schedule because the clearing price will never fall below their marginal production costs. For example, a merchant wind plant built in 2016 receives a $23 per megawatt-hour (MWh) production tax credit and has zero operational costs, meaning it will make money so long as the energy market price is above -$23/MWh. Because the energy market-clearing price will usually be more than this price, the wind plant can just self-schedule rather than respond to price signals.
Second, resources may choose to self-schedule if the penalties for generating during times of congestion are not sufficiently high. In other words, if the market price floor is too high, generators will not have an incentive to reduce production. Consider a market with a minimum bid price of $0. In this case, even if the same wind generator described above submitted an offer curve, it would never ramp down production; at $0 and with the production tax credit, the generator is still profitable. All U.S. markets currently allow negative prices, though some are reconsidering whether or not to restrict minimum bids to $0. Of course, lowering the price floor can simply penalize resources without improving market efficiency. If resources are physically unable to respond and change output in response to prices, then further lowering the floor will simply fine them for inflexibility. RTOs should therefore conduct careful analysis before deciding to lower their price floor.
32 Adapted from: E. Ela et al., “Evolution of Wholesale Electricity Market Design with Increasing Levels of Renewable Generation” (Golden, CO: National Renewable Energy Laboratory, September 2014).
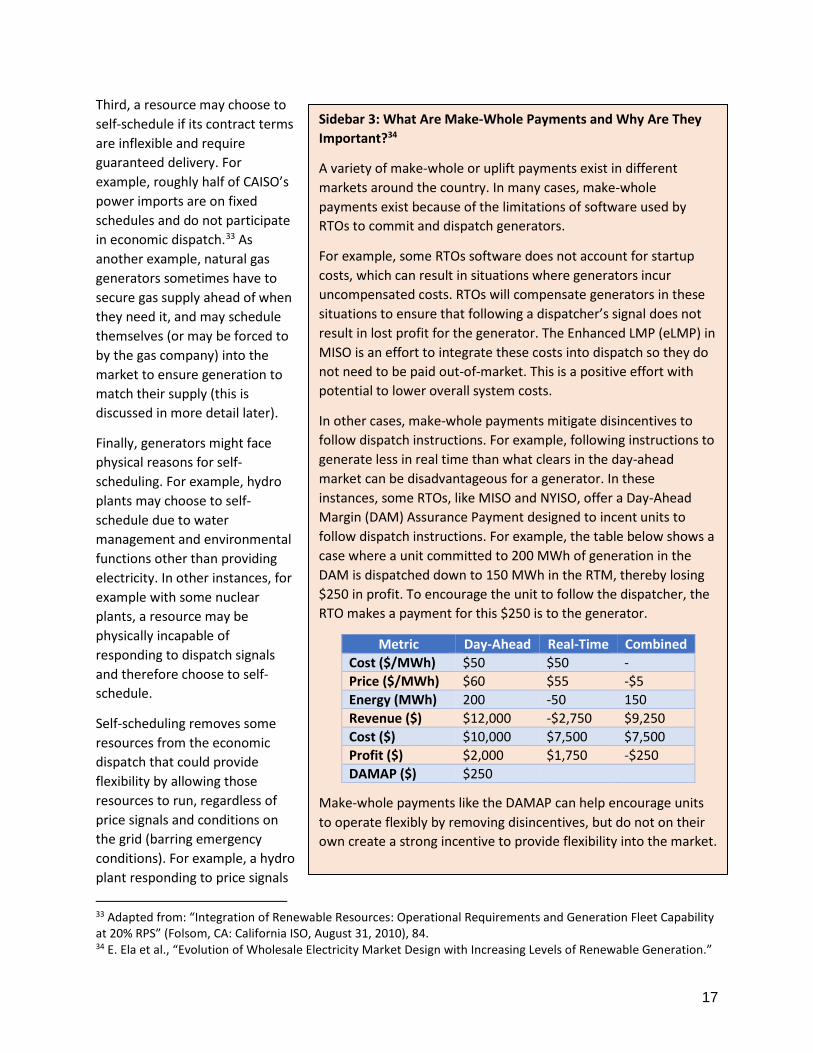
17
Third, a resource may choose to self-schedule if its contract terms are inflexible and require guaranteed delivery. For example, roughly half of CAISO’s power imports are on fixed schedules and do not participate in economic dispatch.33 As another example, natural gas generators sometimes have to secure gas supply ahead of when they need it, and may schedule themselves (or may be forced to by the gas company) into the market to ensure generation to match their supply (this is discussed in more detail later).
Finally, generators might face physical reasons for self-scheduling. For example, hydro plants may choose to self-schedule due to water management and environmental functions other than providing electricity. In other instances, for example with some nuclear plants, a resource may be physically incapable of responding to dispatch signals and therefore choose to self-schedule.34
Self-scheduling removes some resources from the economic dispatch that could provide flexibility by allowing those resources to run, regardless of price signals and conditions on the grid (barring emergency conditions). For example, a hydro plant responding to price signals 33 Adapted from: “Integration of Renewable Resources: Operational Requirements and Generation Fleet Capability at 20% RPS” (Folsom, CA: California ISO, August 31, 2010), 84. 34 E. Ela et al., “Evolution of Wholesale Electricity Market Design with Increasing Levels of Renewable Generation.”
Sidebar 3: What Are Make-Whole Payments and Why Are They Important?34
A variety of make-whole or uplift payments exist in different markets around the country. In many cases, make-whole payments exist because of the limitations of software used by RTOs to commit and dispatch generators.
For example, some RTOs software does not account for startup costs, which can result in situations where generators incur uncompensated costs. RTOs will compensate generators in these situations to ensure that following a dispatcher’s signal does not result in lost profit for the generator. The Enhanced LMP (eLMP) in MISO is an effort to integrate these costs into dispatch so they do not need to be paid out-of-market. This is a positive effort with potential to lower overall system costs.
In other cases, make-whole payments mitigate disincentives to follow dispatch instructions. For example, following instructions to generate less in real time than what clears in the day-ahead market can be disadvantageous for a generator. In these instances, some RTOs, like MISO and NYISO, offer a Day-Ahead Margin (DAM) Assurance Payment designed to incent units to follow dispatch instructions. For example, the table below shows a case where a unit committed to 200 MWh of generation in the DAM is dispatched down to 150 MWh in the RTM, thereby losing $250 in profit. To encourage the unit to follow the dispatcher, the RTO makes a payment for this $250 is to the generator.
Metric Day-Ahead Real-Time Combined Cost ($/MWh) $50 $50 - Price ($/MWh) $60 $55 -$5 Energy (MWh) 200 -50 150 Revenue ($) $12,000 -$2,750 $9,250 Cost ($) $10,000 $7,500 $7,500 Profit ($) $2,000 $1,750 -$250 DAMAP ($) $250
Make-whole payments like the DAMAP can help encourage units to operate flexibly by removing disincentives, but do not on their own create a strong incentive to provide flexibility into the market.
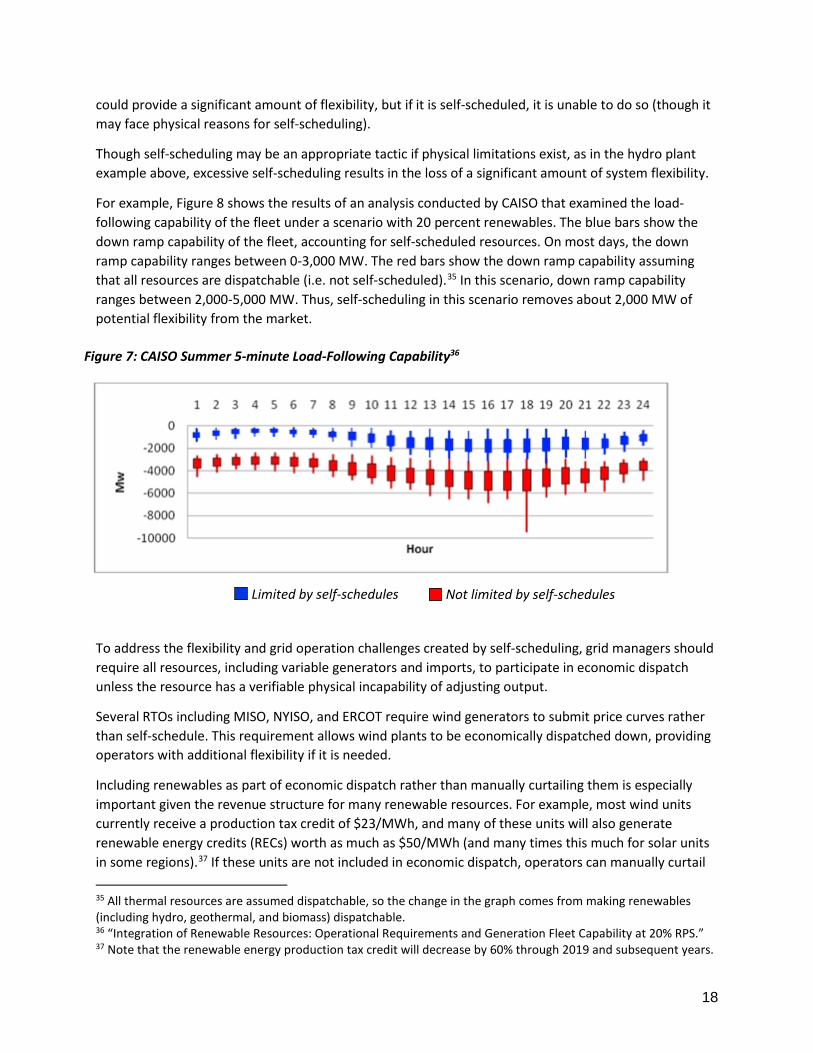
18
could provide a significant amount of flexibility, but if it is self-scheduled, it is unable to do so (though it may face physical reasons for self-scheduling).
Though self-scheduling may be an appropriate tactic if physical limitations exist, as in the hydro plant example above, excessive self-scheduling results in the loss of a significant amount of system flexibility.
For example, Figure 8 shows the results of an analysis conducted by CAISO that examined the load-following capability of the fleet under a scenario with 20 percent renewables. The blue bars show the down ramp capability of the fleet, accounting for self-scheduled resources. On most days, the down ramp capability ranges between 0-3,000 MW. The red bars show the down ramp capability assuming that all resources are dispatchable (i.e. not self-scheduled).35 In this scenario, down ramp capability ranges between 2,000-5,000 MW. Thus, self-scheduling in this scenario removes about 2,000 MW of potential flexibility from the market.36
To address the flexibility and grid operation challenges created by self-scheduling, grid managers should require all resources, including variable generators and imports, to participate in economic dispatch unless the resource has a verifiable physical incapability of adjusting output.
Several RTOs including MISO, NYISO, and ERCOT require wind generators to submit price curves rather than self-schedule. This requirement allows wind plants to be economically dispatched down, providing operators with additional flexibility if it is needed.
Including renewables as part of economic dispatch rather than manually curtailing them is especially important given the revenue structure for many renewable resources. For example, most wind units currently receive a production tax credit of $23/MWh, and many of these units will also generate renewable energy credits (RECs) worth as much as $50/MWh (and many times this much for solar units in some regions).37 If these units are not included in economic dispatch, operators can manually curtail 35 All thermal resources are assumed dispatchable, so the change in the graph comes from making renewables (including hydro, geothermal, and biomass) dispatchable. 36 “Integration of Renewable Resources: Operational Requirements and Generation Fleet Capability at 20% RPS.” 37 Note that the renewable energy production tax credit will decrease by 60% through 2019 and subsequent years.
Figure 7: CAISO Summer 5-minute Load-Following Capability36
Not limited by self-schedules Limited by self-schedules
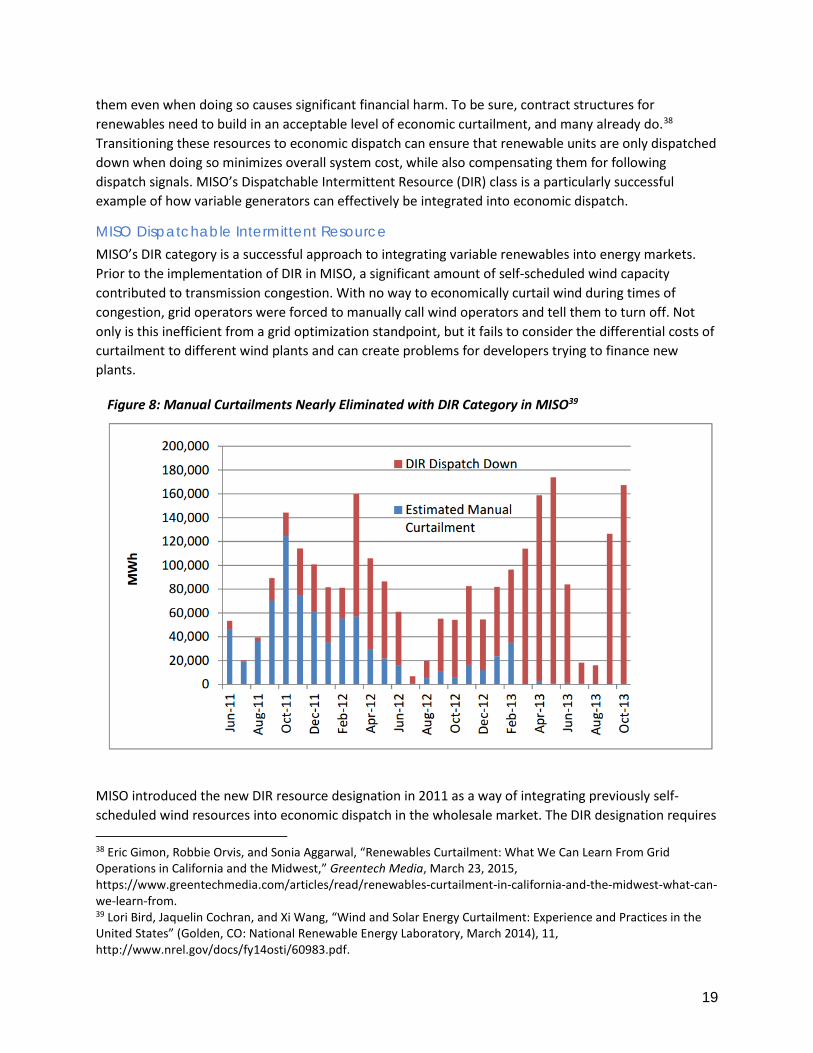
19
them even when doing so causes significant financial harm. To be sure, contract structures for renewables need to build in an acceptable level of economic curtailment, and many already do.38 Transitioning these resources to economic dispatch can ensure that renewable units are only dispatched down when doing so minimizes overall system cost, while also compensating them for following dispatch signals. MISO’s Dispatchable Intermittent Resource (DIR) class is a particularly successful example of how variable generators can effectively be integrated into economic dispatch.
MISO Dispatchable Intermittent Resource MISO’s DIR category is a successful approach to integrating variable renewables into energy markets. Prior to the implementation of DIR in MISO, a significant amount of self-scheduled wind capacity contributed to transmission congestion. With no way to economically curtail wind during times of congestion, grid operators were forced to manually call wind operators and tell them to turn off. Not only is this inefficient from a grid optimization standpoint, but it fails to consider the differential costs of curtailment to different wind plants and can create problems for developers trying to finance new plants.39
MISO introduced the new DIR resource designation in 2011 as a way of integrating previously self-scheduled wind resources into economic dispatch in the wholesale market. The DIR designation requires 38 Eric Gimon, Robbie Orvis, and Sonia Aggarwal, “Renewables Curtailment: What We Can Learn From Grid Operations in California and the Midwest,” Greentech Media, March 23, 2015, https://www.greentechmedia.com/articles/read/renewables-curtailment-in-california-and-the-midwest-what-can-we-learn-from. 39 Lori Bird, Jaquelin Cochran, and Xi Wang, “Wind and Solar Energy Curtailment: Experience and Practices in the United States” (Golden, CO: National Renewable Energy Laboratory, March 2014), 11, http://www.nrel.gov/docs/fy14osti/60983.pdf.
Figure 8: Manual Curtailments Nearly Eliminated with DIR Category in MISO39
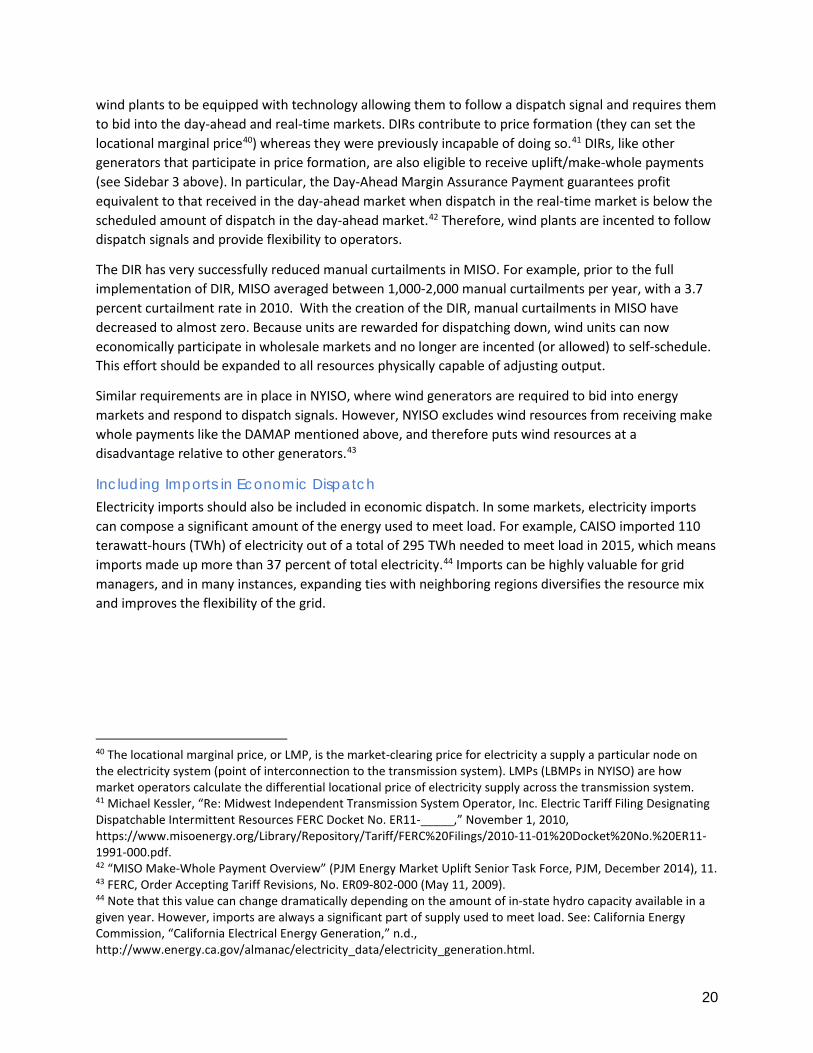
20
wind plants to be equipped with technology allowing them to follow a dispatch signal and requires them to bid into the day-ahead and real-time markets. DIRs contribute to price formation (they can set the locational marginal price40) whereas they were previously incapable of doing so.41 DIRs, like other generators that participate in price formation, are also eligible to receive uplift/make-whole payments (see Sidebar 3 above). In particular, the Day-Ahead Margin Assurance Payment guarantees profit equivalent to that received in the day-ahead market when dispatch in the real-time market is below the scheduled amount of dispatch in the day-ahead market.42 Therefore, wind plants are incented to follow dispatch signals and provide flexibility to operators.
The DIR has very successfully reduced manual curtailments in MISO. For example, prior to the full implementation of DIR, MISO averaged between 1,000-2,000 manual curtailments per year, with a 3.7 percent curtailment rate in 2010. With the creation of the DIR, manual curtailments in MISO have decreased to almost zero. Because units are rewarded for dispatching down, wind units can now economically participate in wholesale markets and no longer are incented (or allowed) to self-schedule. This effort should be expanded to all resources physically capable of adjusting output.
Similar requirements are in place in NYISO, where wind generators are required to bid into energy markets and respond to dispatch signals. However, NYISO excludes wind resources from receiving make whole payments like the DAMAP mentioned above, and therefore puts wind resources at a disadvantage relative to other generators.43
Including Imports in Economic Dispatch Electricity imports should also be included in economic dispatch. In some markets, electricity imports can compose a significant amount of the energy used to meet load. For example, CAISO imported 110 terawatt-hours (TWh) of electricity out of a total of 295 TWh needed to meet load in 2015, which means imports made up more than 37 percent of total electricity.44 Imports can be highly valuable for grid managers, and in many instances, expanding ties with neighboring regions diversifies the resource mix and improves the flexibility of the grid.
40 The locational marginal price, or LMP, is the market-clearing price for electricity a supply a particular node on the electricity system (point of interconnection to the transmission system). LMPs (LBMPs in NYISO) are how market operators calculate the differential locational price of electricity supply across the transmission system. 41 Michael Kessler, “Re: Midwest Independent Transmission System Operator, Inc. Electric Tariff Filing Designating Dispatchable Intermittent Resources FERC Docket No. ER11-_____,” November 1, 2010, https://www.misoenergy.org/Library/Repository/Tariff/FERC%20Filings/2010-11-01%20Docket%20No.%20ER11-1991-000.pdf. 42 “MISO Make-Whole Payment Overview” (PJM Energy Market Uplift Senior Task Force, PJM, December 2014), 11. 43 FERC, Order Accepting Tariff Revisions, No. ER09-802-000 (May 11, 2009). 44 Note that this value can change dramatically depending on the amount of in-state hydro capacity available in a given year. However, imports are always a significant part of supply used to meet load. See: California Energy Commission, “California Electrical Energy Generation,” n.d., http://www.energy.ca.gov/almanac/electricity_data/electricity_generation.html.
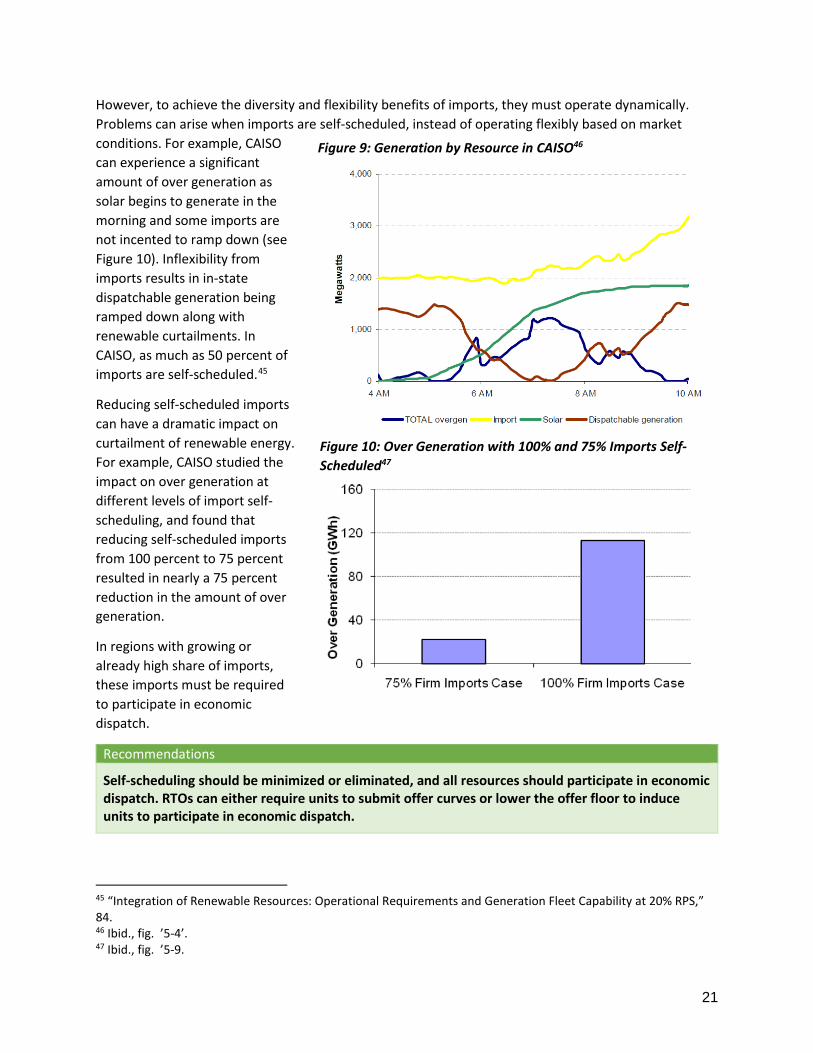
21
However, to achieve the diversity and flexibility benefits of imports, they must operate dynamically. Problems can arise when imports are self-scheduled, instead of operating flexibly based on market conditions. For example, CAISO can experience a significant amount of over generation as solar begins to generate in the morning and some imports are not incented to ramp down (see Figure 10). Inflexibility from imports results in in-state dispatchable generation being ramped down along with renewable curtailments. In CAISO, as much as 50 percent of imports are self-scheduled.45 4647
Reducing self-scheduled imports can have a dramatic impact on curtailment of renewable energy. For example, CAISO studied the impact on over generation at different levels of import self-scheduling, and found that reducing self-scheduled imports from 100 percent to 75 percent resulted in nearly a 75 percent reduction in the amount of over generation.
In regions with growing or already high share of imports, these imports must be required to participate in economic dispatch.
Recommendations
Self-scheduling should be minimized or eliminated, and all resources should participate in economic dispatch. RTOs can either require units to submit offer curves or lower the offer floor to induce units to participate in economic dispatch.
45 “Integration of Renewable Resources: Operational Requirements and Generation Fleet Capability at 20% RPS,” 84. 46 Ibid., fig. ’5-4’. 47 Ibid., fig. ’5-9.
Figure 9: Generation by Resource in CAISO46
Figure 10: Over Generation with 100% and 75% Imports Self-Scheduled47
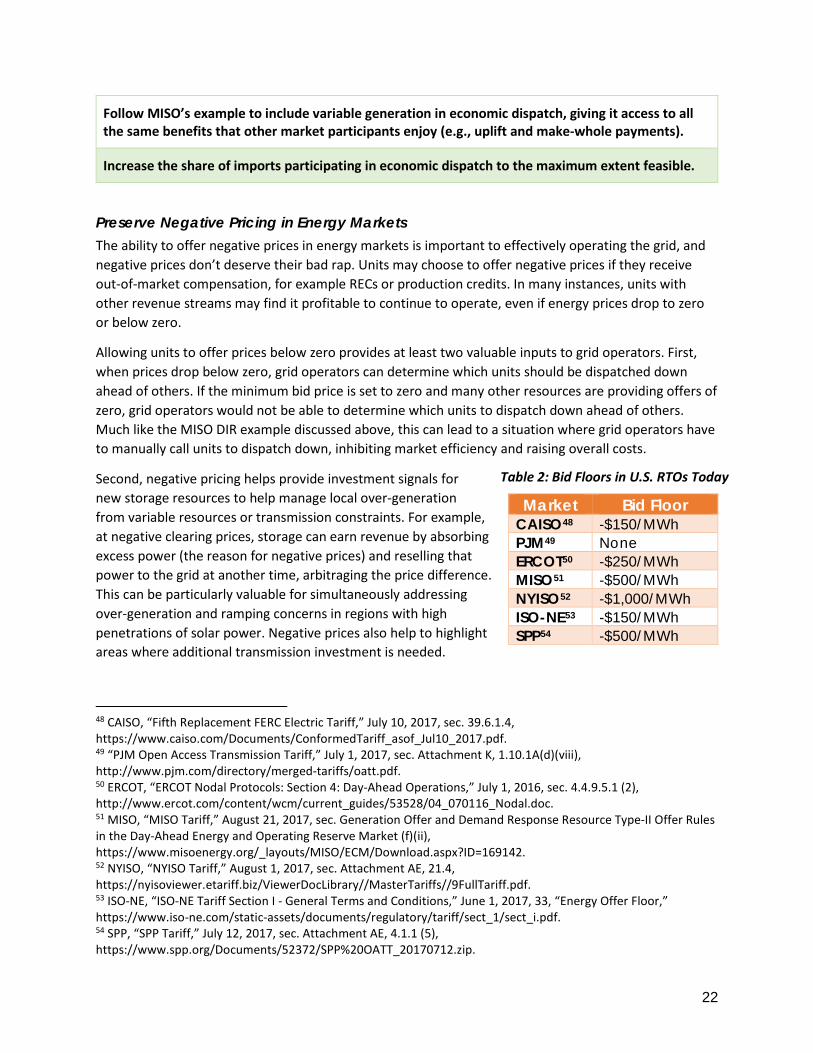
22
Follow MISO’s example to include variable generation in economic dispatch, giving it access to all the same benefits that other market participants enjoy (e.g., uplift and make-whole payments).
Increase the share of imports participating in economic dispatch to the maximum extent feasible.
Preserve Negative Pricing in Energy Markets The ability to offer negative prices in energy markets is important to effectively operating the grid, and negative prices don’t deserve their bad rap. Units may choose to offer negative prices if they receive out-of-market compensation, for example RECs or production credits. In many instances, units with other revenue streams may find it profitable to continue to operate, even if energy prices drop to zero or below zero.
Allowing units to offer prices below zero provides at least two valuable inputs to grid operators. First, when prices drop below zero, grid operators can determine which units should be dispatched down ahead of others. If the minimum bid price is set to zero and many other resources are providing offers of zero, grid operators would not be able to determine which units to dispatch down ahead of others. Much like the MISO DIR example discussed above, this can lead to a situation where grid operators have to manually call units to dispatch down, inhibiting market efficiency and raising overall costs.
Second, negative pricing helps provide investment signals for new storage resources to help manage local over-generation from variable resources or transmission constraints. For example, at negative clearing prices, storage can earn revenue by absorbing excess power (the reason for negative prices) and reselling that power to the grid at another time, arbitraging the price difference. This can be particularly valuable for simultaneously addressing over-generation and ramping concerns in regions with high penetrations of solar power. Negative prices also help to highlight areas where additional transmission investment is needed.
48 CAISO, “Fifth Replacement FERC Electric Tariff,” July 10, 2017, sec. 39.6.1.4, https://www.caiso.com/Documents/ConformedTariff_asof_Jul10_2017.pdf. 49 “PJM Open Access Transmission Tariff,” July 1, 2017, sec. Attachment K, 1.10.1A(d)(viii), http://www.pjm.com/directory/merged-tariffs/oatt.pdf. 50 ERCOT, “ERCOT Nodal Protocols: Section 4: Day-Ahead Operations,” July 1, 2016, sec. 4.4.9.5.1 (2), http://www.ercot.com/content/wcm/current_guides/53528/04_070116_Nodal.doc. 51 MISO, “MISO Tariff,” August 21, 2017, sec. Generation Offer and Demand Response Resource Type-II Offer Rules in the Day-Ahead Energy and Operating Reserve Market (f)(ii), https://www.misoenergy.org/_layouts/MISO/ECM/Download.aspx?ID=169142. 52 NYISO, “NYISO Tariff,” August 1, 2017, sec. Attachment AE, 21.4, https://nyisoviewer.etariff.biz/ViewerDocLibrary//MasterTariffs//9FullTariff.pdf. 53 ISO-NE, “ISO-NE Tariff Section I - General Terms and Conditions,” June 1, 2017, 33, “Energy Offer Floor,” https://www.iso-ne.com/static-assets/documents/regulatory/tariff/sect_1/sect_i.pdf. 54 SPP, “SPP Tariff,” July 12, 2017, sec. Attachment AE, 4.1.1 (5), https://www.spp.org/Documents/52372/SPP%20OATT_20170712.zip.
Market Bid Floor CAISO48 -$150/MWh PJM49 None ERCOT50 -$250/MWh MISO51 -$500/MWh NYISO52 -$1,000/MWh ISO-NE53 -$150/MWh SPP54 -$500/MWh
Table 2: Bid Floors in U.S. RTOs Today
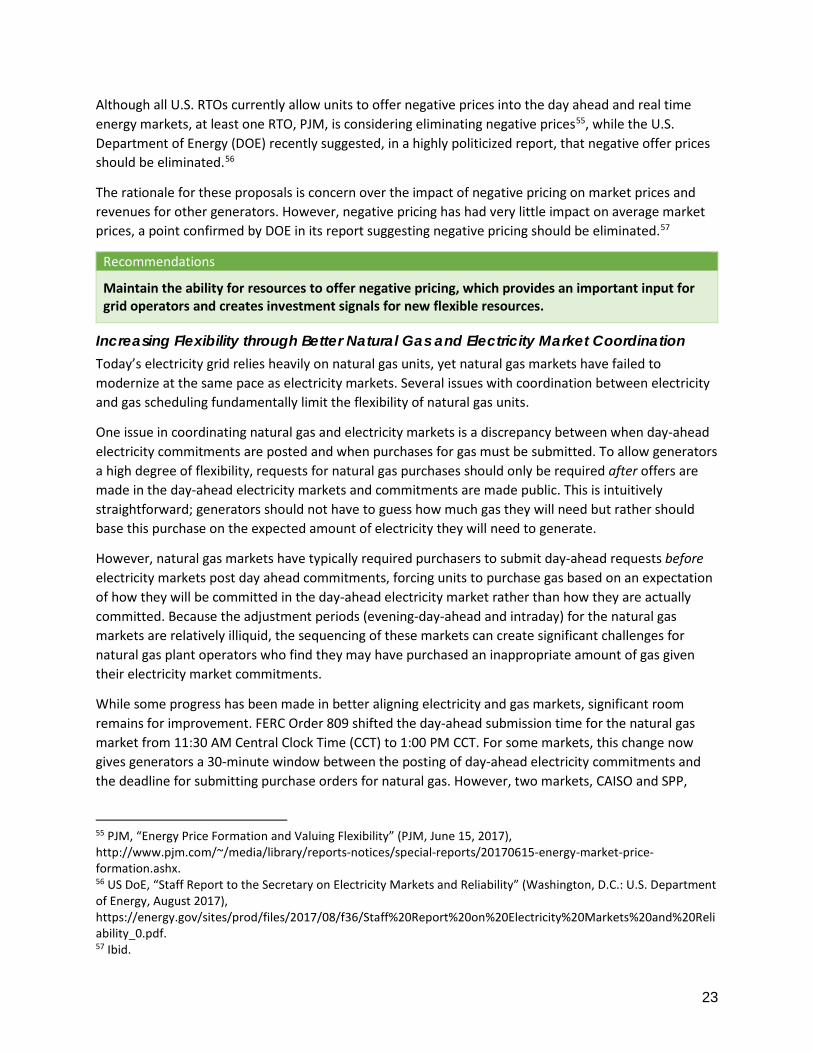
23
Although all U.S. RTOs currently allow units to offer negative prices into the day ahead and real time energy markets, at least one RTO, PJM, is considering eliminating negative prices55, while the U.S. Department of Energy (DOE) recently suggested, in a highly politicized report, that negative offer prices should be eliminated.56
The rationale for these proposals is concern over the impact of negative pricing on market prices and revenues for other generators. However, negative pricing has had very little impact on average market prices, a point confirmed by DOE in its report suggesting negative pricing should be eliminated.57
Recommendations
Maintain the ability for resources to offer negative pricing, which provides an important input for grid operators and creates investment signals for new flexible resources.
Increasing Flexibility through Better Natural Gas and Electricity Market Coordination Today’s electricity grid relies heavily on natural gas units, yet natural gas markets have failed to modernize at the same pace as electricity markets. Several issues with coordination between electricity and gas scheduling fundamentally limit the flexibility of natural gas units.
One issue in coordinating natural gas and electricity markets is a discrepancy between when day-ahead electricity commitments are posted and when purchases for gas must be submitted. To allow generators a high degree of flexibility, requests for natural gas purchases should only be required after offers are made in the day-ahead electricity markets and commitments are made public. This is intuitively straightforward; generators should not have to guess how much gas they will need but rather should base this purchase on the expected amount of electricity they will need to generate.
However, natural gas markets have typically required purchasers to submit day-ahead requests before electricity markets post day ahead commitments, forcing units to purchase gas based on an expectation of how they will be committed in the day-ahead electricity market rather than how they are actually committed. Because the adjustment periods (evening-day-ahead and intraday) for the natural gas markets are relatively illiquid, the sequencing of these markets can create significant challenges for natural gas plant operators who find they may have purchased an inappropriate amount of gas given their electricity market commitments.
While some progress has been made in better aligning electricity and gas markets, significant room remains for improvement. FERC Order 809 shifted the day-ahead submission time for the natural gas market from 11:30 AM Central Clock Time (CCT) to 1:00 PM CCT. For some markets, this change now gives generators a 30-minute window between the posting of day-ahead electricity commitments and the deadline for submitting purchase orders for natural gas. However, two markets, CAISO and SPP,
55 PJM, “Energy Price Formation and Valuing Flexibility” (PJM, June 15, 2017), http://www.pjm.com/~/media/library/reports-notices/special-reports/20170615-energy-market-price-formation.ashx. 56 US DoE, “Staff Report to the Secretary on Electricity Markets and Reliability” (Washington, D.C.: U.S. Department of Energy, August 2017), https://energy.gov/sites/prod/files/2017/08/f36/Staff%20Report%20on%20Electricity%20Markets%20and%20Reliability_0.pdf. 57 Ibid.
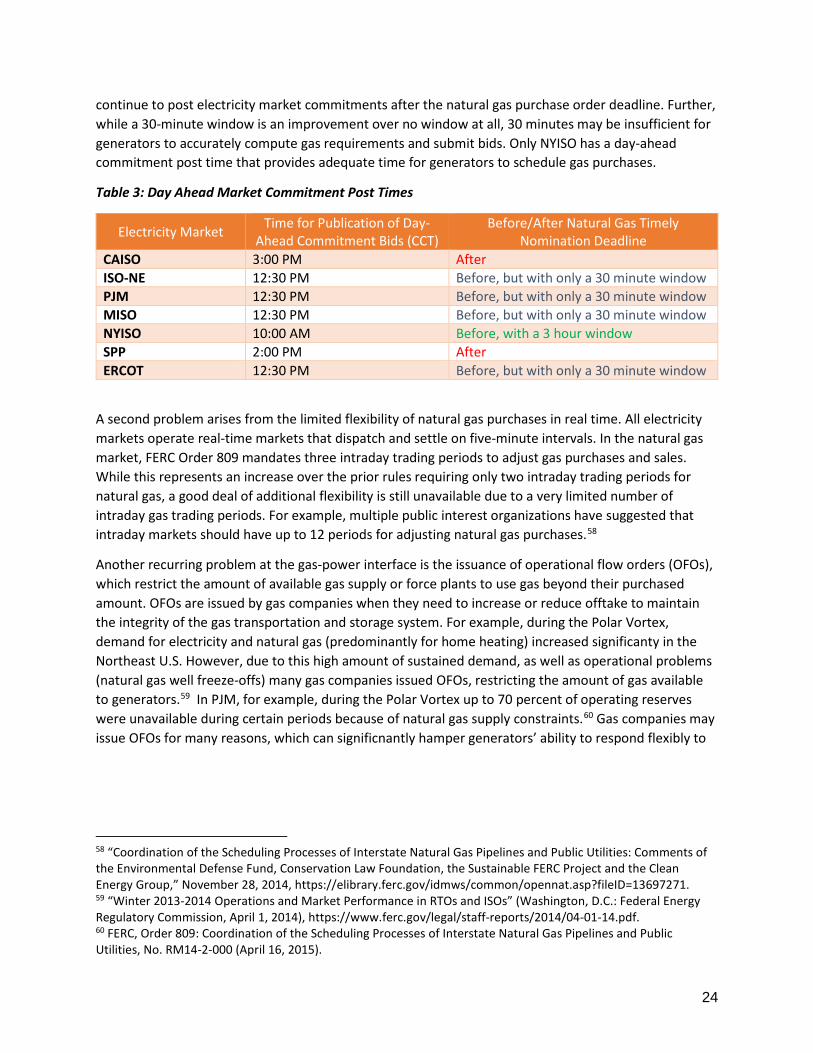
24
continue to post electricity market commitments after the natural gas purchase order deadline. Further, while a 30-minute window is an improvement over no window at all, 30 minutes may be insufficient for generators to accurately compute gas requirements and submit bids. Only NYISO has a day-ahead commitment post time that provides adequate time for generators to schedule gas purchases.
Table 3: Day Ahead Market Commitment Post Times
Electricity Market Time for Publication of Day-Ahead Commitment Bids (CCT)
Before/After Natural Gas Timely Nomination Deadline
CAISO 3:00 PM After ISO-NE 12:30 PM Before, but with only a 30 minute window PJM 12:30 PM Before, but with only a 30 minute window MISO 12:30 PM Before, but with only a 30 minute window NYISO 10:00 AM Before, with a 3 hour window SPP 2:00 PM After ERCOT 12:30 PM Before, but with only a 30 minute window
A second problem arises from the limited flexibility of natural gas purchases in real time. All electricity markets operate real-time markets that dispatch and settle on five-minute intervals. In the natural gas market, FERC Order 809 mandates three intraday trading periods to adjust gas purchases and sales. While this represents an increase over the prior rules requiring only two intraday trading periods for natural gas, a good deal of additional flexibility is still unavailable due to a very limited number of intraday gas trading periods. For example, multiple public interest organizations have suggested that intraday markets should have up to 12 periods for adjusting natural gas purchases.58
Another recurring problem at the gas-power interface is the issuance of operational flow orders (OFOs), which restrict the amount of available gas supply or force plants to use gas beyond their purchased amount. OFOs are issued by gas companies when they need to increase or reduce offtake to maintain the integrity of the gas transportation and storage system. For example, during the Polar Vortex, demand for electricity and natural gas (predominantly for home heating) increased significanty in the Northeast U.S. However, due to this high amount of sustained demand, as well as operational problems (natural gas well freeze-offs) many gas companies issued OFOs, restricting the amount of gas available to generators.59 In PJM, for example, during the Polar Vortex up to 70 percent of operating reserves were unavailable during certain periods because of natural gas supply constraints.60 Gas companies may issue OFOs for many reasons, which can significnantly hamper generators’ ability to respond flexibly to
58 “Coordination of the Scheduling Processes of Interstate Natural Gas Pipelines and Public Utilities: Comments of the Environmental Defense Fund, Conservation Law Foundation, the Sustainable FERC Project and the Clean Energy Group,” November 28, 2014, https://elibrary.ferc.gov/idmws/common/opennat.asp?fileID=13697271. 59 “Winter 2013-2014 Operations and Market Performance in RTOs and ISOs” (Washington, D.C.: Federal Energy Regulatory Commission, April 1, 2014), https://www.ferc.gov/legal/staff-reports/2014/04-01-14.pdf. 60 FERC, Order 809: Coordination of the Scheduling Processes of Interstate Natural Gas Pipelines and Public Utilities, No. RM14-2-000 (April 16, 2015).
25
market conditions.61 These problems are exacerbated by the poor alignment of gas and wholesale electricity markets.
Recommendations Ensure electricity market day ahead commitments are posted at least an hour before the deadline for natural gas day ahead purchase orders to allow generators sufficient time to accurately forecast and purchase gas. Increase the number of intraday trading periods for the purchase and sale of natural gas, and ensure natural gas market intervals clear ahead of electricity market intervals. Minimize operational flow orders by improving gas-electricity market coordination.
Minimize Restrictions on Resource Participation To operate the grid reliably and at least cost, RTOs should rely on all resources that can provide necessary services. RTOs should be technology neutral: If a technology is able to provide services, it must be allowed to do so. This can pose challenges for RTOs when the algorithms and dispatch software they have written to dispatch a set of resources does not apply well to certain new resources.62 However, this does not mean new types of resources should be precluded from offering services where they can, and RTOs must evolve to incorporate new technologies as they become available.
Yet the imposition, either directly or indirectly, of technological limitations on resource types, which preclude them from offering certain services, is a major barrier to utilizing the flexibility of existing resources in some RTOs. These restrictions come in (at least) two forms: restrictions based on the type of resource or restrictions based on the size of the resource.
For example, in PJM, distributed resources, including behind-the-meter battery storage, can only connect as a generation resource or register as demand response (DR). Registering as a generation resource is prohibitively expensive and time consuming for most distributed resources. As a registered DR resource in PJM, resources are banned from ever injecting power beyond the meter, meaning that participation of these resources is limited to reducing on-site load to zero, rather than being able to inject power back into the distribution system.63 Similarly, DR resources are limited to participating in a subset of PJM’s markets, and therefore this designation further limits the ability of distributed storage to offer services to PJM.64 As more distributed energy resources come online, RTOs need to consider how they can better incorporate these technologies and unlock their potential. Some RTOs have already taken steps in this direction.
61 “Comments of CalPeak Power, LLC and Malaga Power, LLC Regarding Implementation of Order 809,” May 7, 2015, https://www.caiso.com/Documents/CalPeak_MalagaComments_FERCOrderNo809.pdf. 62 “Re: Midcontinent Independent System Operator, Inc.’s Sections 205 and 206 Filings to Amend Tariff Provisions to Establish a Stored Energy Resource - Type II Docket No. ER17-___-000; EL17-8-000” (MISO, April 3, 2017). 63 Of course, injecting power at the distribution scale can be challenging for the system to handle, but this tends not to be an issue until the amount of injected power approaches the total amount of demand on the feeder. See: A.F. Mensah (PJM, April 18, 2016), http://www.pjm.com/~/media/committees-groups/committees/mrc/20160418-special/20160418-item-02b-problem-statement-af-mensah-presentation.ashx; “Electric Storage Participation in Regions with Organized Wholesale Electric Markets: Comments of Public Interest Organizations, Docket No. AD16-20-000,” June 6, 2016. 64 “Comments of Advanced Energy Economy,” Electric Storage Participation in Regions with Organized Wholesale Electric Markets (Federal Energy Regulatory Commission, June 6, 2016), 16.
26
NYISO Behind-the-Meter Net Generation Resource NYISO’s Behind-the-Meter Net Generation (BTM:NG) resource is a good example of a proactive change to product definitions that will allow more distributed energy resources to participate in the wholesale market.
Prior to the BTM:NG resource, NYISO prohibited behind-the-meter generators from participating in the wholesale markets. The BTM:NG resource now allows behind-the-meter storage resources connected to the transmission or distribution system to participate in NYISO’s markets by establishing a resource category and introducing new definitions that enable participation by these resources.
NYISO requires BTM:NG resources to submit both their installed capacity as well as their estimated host load when submitting bids into the capacity, energy, and ancillary services markets, which allows NYISO to estimate the net generation available to dispatch. NYISO also allows multiple individual generators serving a single host load to aggregate into a single BTM:NG resource. Though the BTM:NG product is quite new, it could provide a template for other RTOs seeking to incorporate distributed energy resources into wholesale markets.
NYISO still must resolve issues with how BTM:NG resources are classified. For example, only resources at least 2 MW in size with at least 1 MW of capacity available for dispatch are eligible to participate in the wholesale market.65 However, NYISO has indicated that it plans to revise and refine this product over time, including lowering the size threshold. All in all, the BTM:NG resource is a good first step towards including DERs into wholesale markets.
CAISO Non-Generator Resource Another good example for including DERs into wholesale markets is the creation of the non-generator resource (NGR) in CAISO and subsequent policy changes that allow qualifying resources to participate in CAISO’s wholesale markets. The NGR was designed with storage in mind, but was intentionally defined broadly to allow other technologies capable of participating to do so.
Non-generator resources “have the capability to generate energy, consume energy, and/or curtail the consumption of energy, and can be dispatched to any operating level within their entire capacity range.” Under CAISO’s recent tariff changes, NGRs can provide energy and ancillary services on equal footing with traditional generator resources. CAISO also allows NGRs to submit their state of charge as a bid parameter in the day ahead and real time markets, which has allowed the ISO to better plan and operate the grid to incorporate these resources. Similarly, NGRs are capable of “negative generation,” which allows CAISO to better utilize their abilities and minimize constraints to participation.66
Though the non-generator resource is limited to resources that are at least 500 kW in size and connected to the transmission grid, the NGR at least allows storage resources to participate in providing virtually all grid services. Compared to other RTOs where batteries are either precluded from providing
65 NYISO, “Behind-the-Meter Net Generation Fact Sheet,” n.d., http://www.nyiso.com/public/webdocs/markets_operations/services/planning/Documents_and_Resources/CRIS_Transition/BTMNG%20Fact%20Sheet.pdf. 66 Energy Storage Association, Electric Storage Participation in Regions with Organized Wholesale Markets: Comments of the Energy Storage Association, No. AD16-20-000 (FERC June 6, 2016).
27
many services or no language/guidance exists (for example, SPP), the CAISO NGR is a progressive approach to incorporating storage into wholesale markets.
Recommendations Create a net generation product for distributed resources, enable aggregators to participate via fleets, and make the size threshold as small as possible. Allow resources to provide all services they are capable of providing, ensuring that market rules accommodate varying resource characteristics.
CREATING AND MODIFYING PRODUCTS TO HARNESS THE FLEXIBILITY OF EXISTING RESOURCES AND INCENT NEW FLEXIBLE RESOURCES While removing barriers is necessary to access the latent flexibility in existing resources, RTOs also need to modify existing products or create new products that can tap into this flexibility and create incentives to build new flexible resources. These products should allow all resources to provide services if they are able to do so and should explicitly value the flexible attributes, for example ramping capability and balancing, that are necessary to operate the grid in a high-renewables future.
Define Need for Flexibility Services and Allow All Resources to Offer their Capabilities RTOs must ensure that as new resources come online, all resources capable of providing flexibility and other grid services can fairly compete to do so. Enabling these resources requires ensuring product definitions are technology neutral. Along these lines, RTOs should focus on the capabilities desired and then structure or refine products to deliver these capabilities in a technology-neutral way. By focusing on capabilities rather than capacity, for example, RTOs will be able to tap into the unique attributes of varying resources while minimizing costs.
Seemingly well-intended performance requirements can discriminate against certain technologies if they do not isolate and define the grid capabilities they are designed to support. The evolution of the PJM Regulation D ancillary service product demonstrates the importance of refining products by focusing on the desired capabilities and ensuring products are technology neutral.
PJM Regulation D Ancillary Service Product The ability to respond to frequency deviations over very short time frames (seconds to minutes) is becoming more important with higher shares of renewables. As discussed above, a higher share of renewables means that the grid will need more resources that can provide this ability, and fortunately, many new technologies can provide this service.
New technologies like batteries, compressed air storage, and flywheels are able to respond instantaneously to dispatch signals, significantly faster than the traditional thermal units that have provided this service. The ability to respond faster to dispatch signals means fewer regulation resources are needed to maintain reliability, lowering costs to customers while allowing RTOs to operate a more nimble grid. Ample evidence demonstrates large benefits to customers when faster responding resources are allowed to participate in the regulation market.67
67 FERC, Order 755: Frequency Regulation Compensation in the Organized Wholesale Power Markets, No. RM11-7- 000; AD10-11-000 (October 20, 2011).
28
Two types of frequency regulation products existed when PJM was first established: Regulation A and Regulation B. Regulation A was designed around the capabilities of steam units, which could restore and maintain frequency over a longer time frame but could only do so relatively slowly. Regulation B, on the other hand, was designed around the capabilities of fast-ramping hydro units, which could restore frequency much faster than steam units but could only do so over a limited amount of time.
When PJM implemented its ancillary services market in 2001, it depreciated Regulation B, with the result being a single regulation product, Regulation A. All resources seeking to provide regulation were required to offer it under the Regulation A product.
In 2009, AES Energy Storage (AES) and PJM began to work together to integrate battery storage into the wholesale market to offer ancillary services. When they began testing the storage, however, it responded like the phased out Regulation B product: It was able to respond rapidly to changes in frequency but could not maintain this response for long periods. Similarly, the Regulation A signal sent by PJM was designed to fully use available regulation capacity, so the batteries were consistently being fully charged and fully depleted, ruining the battery’s value to the grid and shortening its physical life.
Given these issues, PJM worked with AES to design a new product, Regulation D (RegD), geared specifically for resources like batteries that could provide the valuable service of fast response but had limited storage capabilities. The new RegD product, introduced in 2012, allowed grid operators to take advantage of new technologies’ fast response capability but reduced the call on those resources to zero with 15 minutes of the original signal 95 percent of the time. In other words, the RegD product was designed to take advantage of batteries’ capability to provide more correcting work (pushing the frequency back to normal) without having to sustain this increased output over long periods, which gave grid operators time to get slower responding resources dialed up.68
Coupled with FERC Order 755, which requires grid operators to reward fast-responding frequency regulation resources based on their performance following the dispatch signal, the RegD product has resulted in increased reliability and lower costs for customers. A study conducted by KEMA on behalf of PJM found that the RegD product improved or maintained system reliability across the board while reducing the needed amount of regulation. 69,70 Unsurprisingly, PJM has also experienced a surge in battery storage: Between 2012 and 2016, two-thirds of all storage deployed in the continental U.S. was located in PJM.71
Unfortunately, PJM subsequently modified the RegD product, reducing its utility and value to system operators while undermining the market value of participating resources. In 2017, PJM modified RegD by allowing the 15-minute maximum call time to be overridden and failing to account for the energy limited nature of fast responding resources. In making these changes – made largely to accommodate
68 Scott Benner, “A Brief History of Regulation Signals at PJM” (Markets Coordination, PJM, June 9, 2015). KEMA, “KERMIT Study Report to Determine the Effectiveness of the AGC in Controlling Fast and Conventional Resources in the PJM Frequency Regulation Market” (PJM Interconnection, LLC, December 13, 2011), ’5-4. 70 “PJM Leads the US Fast-Frequency Regulation Market,” NewEnergyUpdate: Energy Storage, April 22, 2015, http://analysis.newenergyupdate.com/energy-storage/pjm-leads-us-fast-frequency-regulation-market. 71 David Hart and Alfred Sarkissian, “Deployment of Grid-Scale Batteries in the United States” (Schar School of Policy and Government, George Mason University, June 2016), https://energy.gov/sites/prod/files/2017/01/f34/Deployment%20of%20Grid-Scale%20Batteries%20in%20the%20United%20States.pdf.
29
the inflexible nature of conventional RegA resources – PJM is no longer utilizing RegD resources cost-effectively and failing to tap their unique characteristics that improve reliability.72
The PJM RegD product is a good example of both how market operators can design products around the required the service and allow all technologies to compete and also how failing to make products technology neutral can undermine market products and increase costs. Similarly, it serves as a good example of why grid operators must continue to assess the resource neutrality of products and services and refine them when barriers to resource participation are identified. The value of being able to quickly respond to frequency changes is likely to increase in a high renewables future. Products like RegD, before its unfortunate changes, can help integrate renewables in other RTOs. The Fast Frequency Response product piloted in ERCOT (but ultimately rejected by stakeholders73) is another example that could serve as a template for other RTOs.
Recommendation Create new and modify existing products focusing on the desired service, and allow all resources to compete to provide this service Ensure products and requirements are technology-neutral, accounting for resource limitations and adjusting as necessary.
Expose the Value of Flexibility Some grid operators are unlocking flexibility and creating an investment signal through market rule changes, new products, or operational changes that focus on flexibility. By creating and trading the desired types of flexibility, RTOs are exposing the value of flexibility services and ensuring that resources that can provide flexibility are incented to do so and rewarded likewise.
Value for flexibility can be exposed through improvements to the energy market that better reflect system constraints. Additional value can be exposed through products, like ramping that are specifically tailored to needed flexible characteristics.
ERCOT’s market reforms, including higher shortage pricing and reserve shortage adders, are a good example of how proactive energy market improvements can help expose value for flexibility. CAISO’s Flexi-Ramp product is an example of a market product created to incent and dispatch a specific capability.
72 Energy Storage Association, Complaint by Energy Storage Association, No. EL17-64-000 (n.d.). 73 The FFR proposal was rejected due to stakeholders not perceiving the future reliability need for the new services as well as concerns over market liquidity. For more information, see: Tom Kleckner, “ERCOT Stakeholders Reject Ancillary Service Revisions,” RTO Insider, May 30, 2016, https://www.rtoinsider.com/ercot-ancillary-service-revisions-27118/.
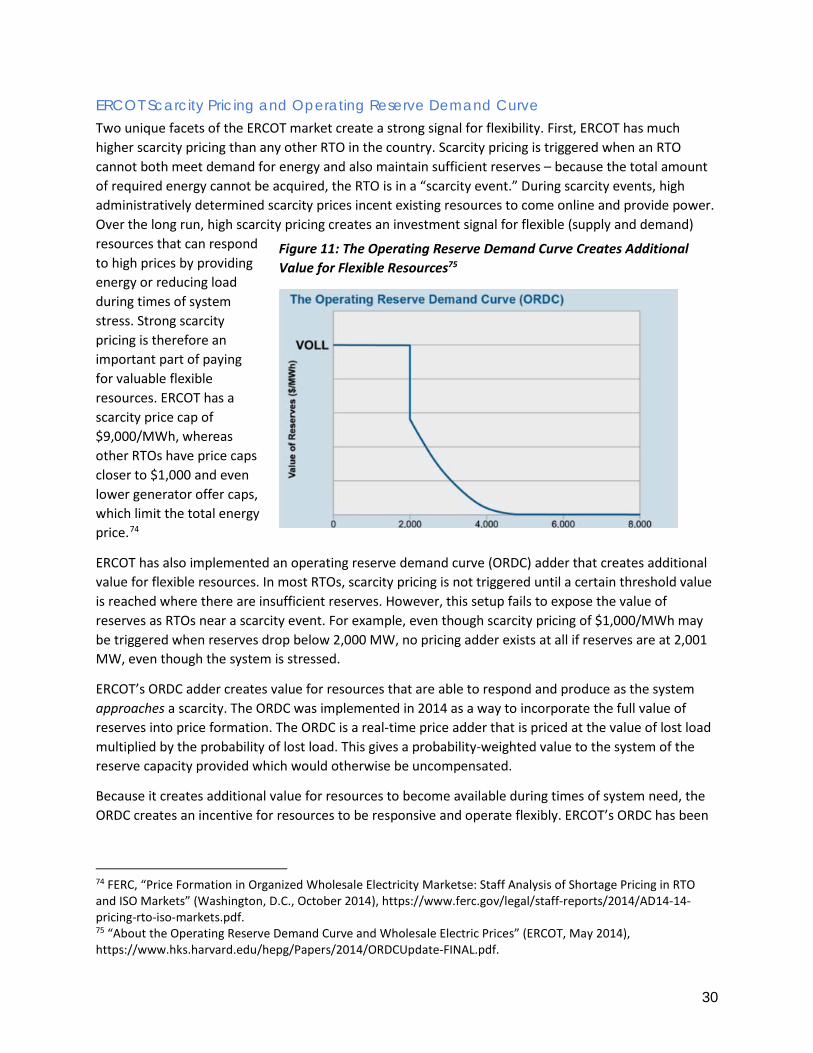
30
ERCOT Scarcity Pricing and Operating Reserve Demand Curve Two unique facets of the ERCOT market create a strong signal for flexibility. First, ERCOT has much higher scarcity pricing than any other RTO in the country. Scarcity pricing is triggered when an RTO cannot both meet demand for energy and also maintain sufficient reserves – because the total amount of required energy cannot be acquired, the RTO is in a “scarcity event.” During scarcity events, high administratively determined scarcity prices incent existing resources to come online and provide power. Over the long run, high scarcity pricing creates an investment signal for flexible (supply and demand) resources that can respond to high prices by providing energy or reducing load during times of system stress. Strong scarcity pricing is therefore an important part of paying for valuable flexible resources. ERCOT has a scarcity price cap of $9,000/MWh, whereas other RTOs have price caps closer to $1,000 and even lower generator offer caps, which limit the total energy price.74
ERCOT has also implemented an operating reserve demand curve (ORDC) adder that creates additional value for flexible resources. In most RTOs, scarcity pricing is not triggered until a certain threshold value is reached where there are insufficient reserves. However, this setup fails to expose the value of reserves as RTOs near a scarcity event. For example, even though scarcity pricing of $1,000/MWh may be triggered when reserves drop below 2,000 MW, no pricing adder exists at all if reserves are at 2,001 MW, even though the system is stressed.
ERCOT’s ORDC adder creates value for resources that are able to respond and produce as the system approaches a scarcity. The ORDC was implemented in 2014 as a way to incorporate the full value of reserves into price formation. The ORDC is a real-time price adder that is priced at the value of lost load multiplied by the probability of lost load. This gives a probability-weighted value to the system of the reserve capacity provided which would otherwise be uncompensated.75
Because it creates additional value for resources to become available during times of system need, the ORDC creates an incentive for resources to be responsive and operate flexibly. ERCOT’s ORDC has been
74 FERC, “Price Formation in Organized Wholesale Electricity Marketse: Staff Analysis of Shortage Pricing in RTO and ISO Markets” (Washington, D.C., October 2014), https://www.ferc.gov/legal/staff-reports/2014/AD14-14-pricing-rto-iso-markets.pdf. 75 “About the Operating Reserve Demand Curve and Wholesale Electric Prices” (ERCOT, May 2014), https://www.hks.harvard.edu/hepg/Papers/2014/ORDCUpdate-FINAL.pdf.
Figure 11: The Operating Reserve Demand Curve Creates Additional Value for Flexible Resources75
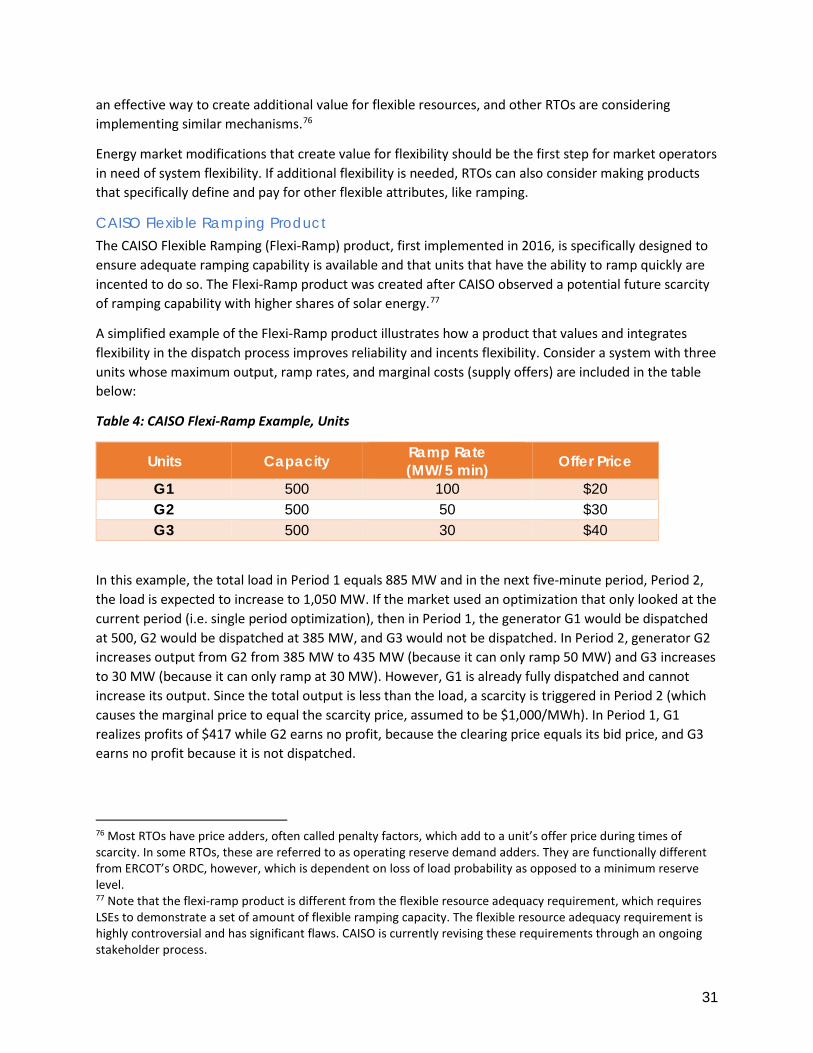
31
an effective way to create additional value for flexible resources, and other RTOs are considering implementing similar mechanisms.76
Energy market modifications that create value for flexibility should be the first step for market operators in need of system flexibility. If additional flexibility is needed, RTOs can also consider making products that specifically define and pay for other flexible attributes, like ramping.
CAISO Flexible Ramping Product The CAISO Flexible Ramping (Flexi-Ramp) product, first implemented in 2016, is specifically designed to ensure adequate ramping capability is available and that units that have the ability to ramp quickly are incented to do so. The Flexi-Ramp product was created after CAISO observed a potential future scarcity of ramping capability with higher shares of solar energy.77
A simplified example of the Flexi-Ramp product illustrates how a product that values and integrates flexibility in the dispatch process improves reliability and incents flexibility. Consider a system with three units whose maximum output, ramp rates, and marginal costs (supply offers) are included in the table below:
Table 4: CAISO Flexi-Ramp Example, Units
Units Capacity Ramp Rate (MW/5 min) Offer Price
G1 500 100 $20 G2 500 50 $30 G3 500 30 $40
In this example, the total load in Period 1 equals 885 MW and in the next five-minute period, Period 2, the load is expected to increase to 1,050 MW. If the market used an optimization that only looked at the current period (i.e. single period optimization), then in Period 1, the generator G1 would be dispatched at 500, G2 would be dispatched at 385 MW, and G3 would not be dispatched. In Period 2, generator G2 increases output from G2 from 385 MW to 435 MW (because it can only ramp 50 MW) and G3 increases to 30 MW (because it can only ramp at 30 MW). However, G1 is already fully dispatched and cannot increase its output. Since the total output is less than the load, a scarcity is triggered in Period 2 (which causes the marginal price to equal the scarcity price, assumed to be $1,000/MWh). In Period 1, G1 realizes profits of $417 while G2 earns no profit, because the clearing price equals its bid price, and G3 earns no profit because it is not dispatched.
76 Most RTOs have price adders, often called penalty factors, which add to a unit’s offer price during times of scarcity. In some RTOs, these are referred to as operating reserve demand adders. They are functionally different from ERCOT’s ORDC, however, which is dependent on loss of load probability as opposed to a minimum reserve level. 77 Note that the flexi-ramp product is different from the flexible resource adequacy requirement, which requires LSEs to demonstrate a set of amount of flexible ramping capacity. The flexible resource adequacy requirement is highly controversial and has significant flaws. CAISO is currently revising these requirements through an ongoing stakeholder process.
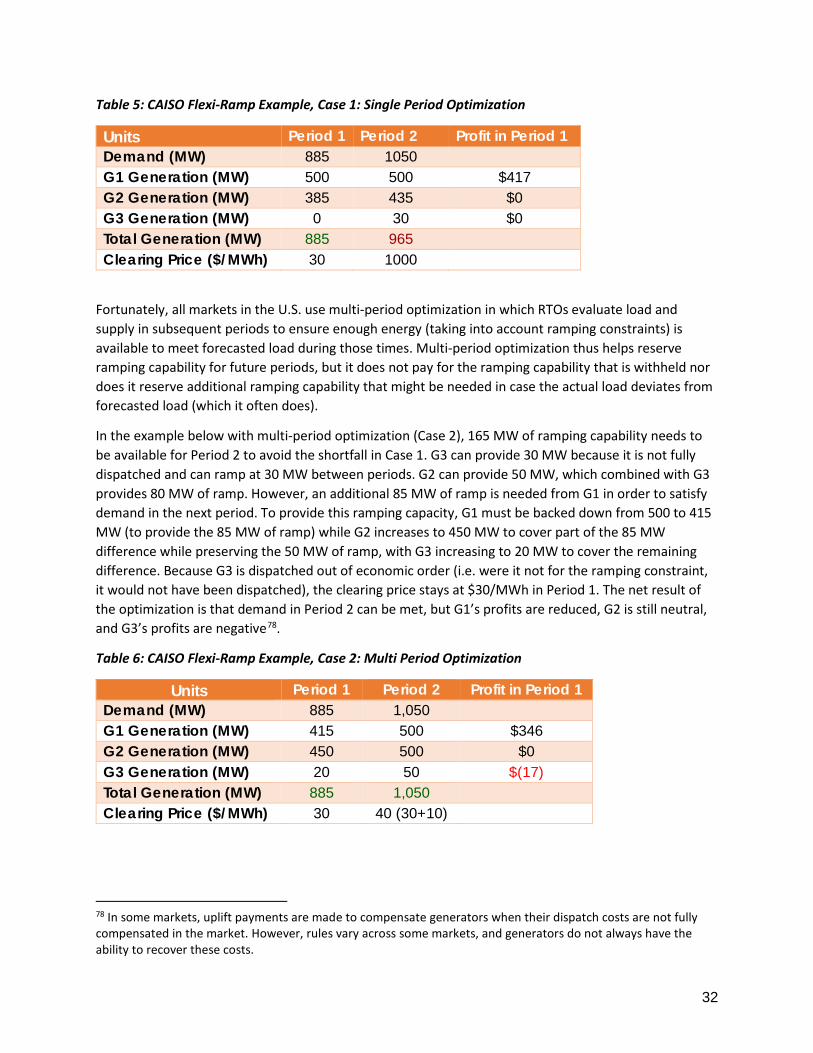
32
Table 5: CAISO Flexi-Ramp Example, Case 1: Single Period Optimization
Units Period 1 Period 2 Profit in Period 1 Demand (MW) 885 1050 G1 Generation (MW) 500 500 $417 G2 Generation (MW) 385 435 $0 G3 Generation (MW) 0 30 $0 Total Generation (MW) 885 965
Clearing Price ($/MWh) 30 1000
Fortunately, all markets in the U.S. use multi-period optimization in which RTOs evaluate load and supply in subsequent periods to ensure enough energy (taking into account ramping constraints) is available to meet forecasted load during those times. Multi-period optimization thus helps reserve ramping capability for future periods, but it does not pay for the ramping capability that is withheld nor does it reserve additional ramping capability that might be needed in case the actual load deviates from forecasted load (which it often does).
In the example below with multi-period optimization (Case 2), 165 MW of ramping capability needs to be available for Period 2 to avoid the shortfall in Case 1. G3 can provide 30 MW because it is not fully dispatched and can ramp at 30 MW between periods. G2 can provide 50 MW, which combined with G3 provides 80 MW of ramp. However, an additional 85 MW of ramp is needed from G1 in order to satisfy demand in the next period. To provide this ramping capacity, G1 must be backed down from 500 to 415 MW (to provide the 85 MW of ramp) while G2 increases to 450 MW to cover part of the 85 MW difference while preserving the 50 MW of ramp, with G3 increasing to 20 MW to cover the remaining difference. Because G3 is dispatched out of economic order (i.e. were it not for the ramping constraint, it would not have been dispatched), the clearing price stays at $30/MWh in Period 1. The net result of the optimization is that demand in Period 2 can be met, but G1’s profits are reduced, G2 is still neutral, and G3’s profits are negative78.
Table 6: CAISO Flexi-Ramp Example, Case 2: Multi Period Optimization
Units Period 1 Period 2 Profit in Period 1 Demand (MW) 885 1,050 G1 Generation (MW) 415 500 $346 G2 Generation (MW) 450 500 $0 G3 Generation (MW) 20 50 $(17) Total Generation (MW) 885 1,050
Clearing Price ($/MWh) 30 40 (30+10)
78 In some markets, uplift payments are made to compensate generators when their dispatch costs are not fully compensated in the market. However, rules vary across some markets, and generators do not always have the ability to recover these costs.
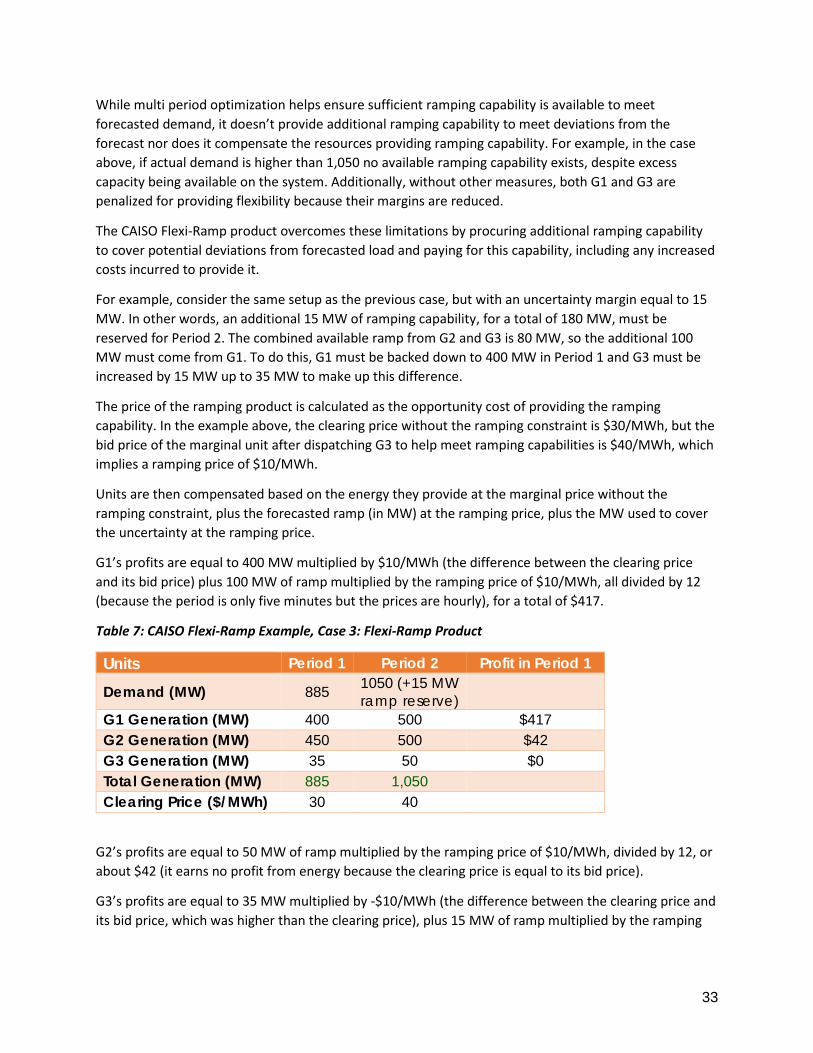
33
While multi period optimization helps ensure sufficient ramping capability is available to meet forecasted demand, it doesn’t provide additional ramping capability to meet deviations from the forecast nor does it compensate the resources providing ramping capability. For example, in the case above, if actual demand is higher than 1,050 no available ramping capability exists, despite excess capacity being available on the system. Additionally, without other measures, both G1 and G3 are penalized for providing flexibility because their margins are reduced.
The CAISO Flexi-Ramp product overcomes these limitations by procuring additional ramping capability to cover potential deviations from forecasted load and paying for this capability, including any increased costs incurred to provide it.
For example, consider the same setup as the previous case, but with an uncertainty margin equal to 15 MW. In other words, an additional 15 MW of ramping capability, for a total of 180 MW, must be reserved for Period 2. The combined available ramp from G2 and G3 is 80 MW, so the additional 100 MW must come from G1. To do this, G1 must be backed down to 400 MW in Period 1 and G3 must be increased by 15 MW up to 35 MW to make up this difference.
The price of the ramping product is calculated as the opportunity cost of providing the ramping capability. In the example above, the clearing price without the ramping constraint is $30/MWh, but the bid price of the marginal unit after dispatching G3 to help meet ramping capabilities is $40/MWh, which implies a ramping price of $10/MWh.
Units are then compensated based on the energy they provide at the marginal price without the ramping constraint, plus the forecasted ramp (in MW) at the ramping price, plus the MW used to cover the uncertainty at the ramping price.
G1’s profits are equal to 400 MW multiplied by $10/MWh (the difference between the clearing price and its bid price) plus 100 MW of ramp multiplied by the ramping price of $10/MWh, all divided by 12 (because the period is only five minutes but the prices are hourly), for a total of $417.
Table 7: CAISO Flexi-Ramp Example, Case 3: Flexi-Ramp Product
Units Period 1 Period 2 Profit in Period 1
Demand (MW) 885 1050 (+15 MW ramp reserve)
G1 Generation (MW) 400 500 $417 G2 Generation (MW) 450 500 $42 G3 Generation (MW) 35 50 $0 Total Generation (MW) 885 1,050
Clearing Price ($/MWh) 30 40
G2’s profits are equal to 50 MW of ramp multiplied by the ramping price of $10/MWh, divided by 12, or about $42 (it earns no profit from energy because the clearing price is equal to its bid price).
G3’s profits are equal to 35 MW multiplied by -$10/MWh (the difference between the clearing price and its bid price, which was higher than the clearing price), plus 15 MW of ramp multiplied by the ramping
34
price of $10/MWh, plus 15 MW of “uncertainty ramp,” or the available ramp that wasn’t used but was made available, multiplied by the ramping price of $10/MWh, for a total of $0.
CAISO’s Flexi-Ramp product is an example of a market product that will help grid operators manage the grid more reliably while rewarding resources that can provide flexibility. A similar product is also in place in MISO, called the Ramp Capability Product.
While the CAISO product is a nice example, it is not without its flaws. In particular, the Flexi-Ramp product allocates the costs of providing ramping capability to the resources “causing” the demand for this ramp. Two issues exist with this approach. First, the electricity system is dynamic, and determining which units cause the need for ramping may be impossible. Second, allocating the costs to specific types of resources obscures the fact that both the change in output from uncontrollable factors and also the inability to adjust power output due to technical limitations of other resources (i.e., the “inflexibility” of certain supply resources) both contribute to the need for ramping capability. For example, when the sun rises in the morning and solar units come online with zero bid costs but self-scheduled imports and nuclear units do not adjust their output (even if their marginal price is higher than the solar), responsibility for creating the demand for ramping is unclear. Allocating costs (i.e. blame) to a specific resource type is impossible in such a dynamic system with different resources. It also runs counter to how RTOs socialize other system costs, like reserves.
Recommendation Reform energy market pricing to better value flexible resources. Higher scarcity pricing and reserve adders are one way to do this. Where necessary, create products for flexibility or products that reward resources that can act flexibly. Make sure products require being available as close to real time as grid operators need them.
Pay for Uncompensated Reliability Services One consequence of increasing shares of renewables is that demand for reliability services, for example frequency response and frequency regulation, will likely increase. At the same time, new technologies and advances in power electronics allow solar, wind, batteries, and other newer technologies to provide frequency response, often at a higher quality than traditional generators.
Going forward, FERC is proposing to require that all new large and small generators, including renewables, be equipped to provide frequency response. Synthetic inertia, however, is not required at this time.
Given the grid’s changing composition and anticipated changes from increasing shares of renewables, grid operators should consider defining needed reliability services as market products (e.g., system inertia or primary frequency response), and trading them to expose their value. Rather than requiring all units to have these capabilities, market products may be able to procure sufficient amounts of these capabilities to maintain or improve reliability. Furthermore, units that can provide such a valuable service should be incented to do so.
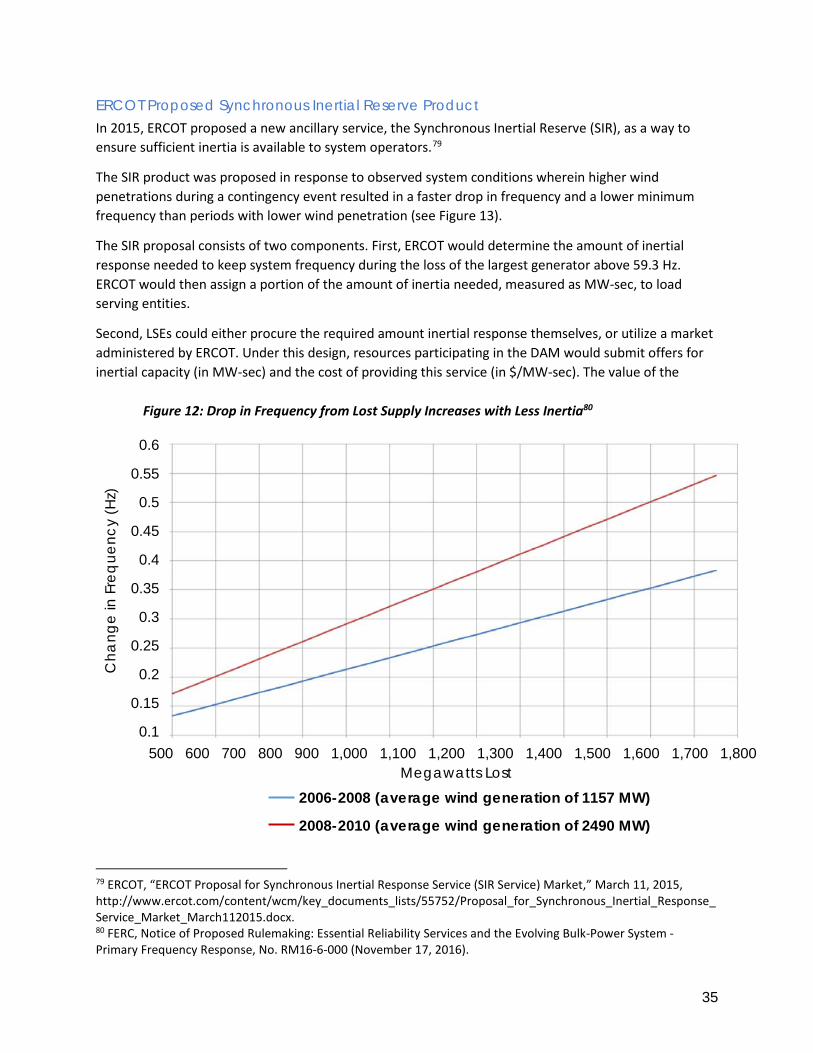
35
ERCOT Proposed Synchronous Inertial Reserve Product In 2015, ERCOT proposed a new ancillary service, the Synchronous Inertial Reserve (SIR), as a way to ensure sufficient inertia is available to system operators.79
The SIR product was proposed in response to observed system conditions wherein higher wind penetrations during a contingency event resulted in a faster drop in frequency and a lower minimum frequency than periods with lower wind penetration (see Figure 13).
The SIR proposal consists of two components. First, ERCOT would determine the amount of inertial response needed to keep system frequency during the loss of the largest generator above 59.3 Hz. ERCOT would then assign a portion of the amount of inertia needed, measured as MW-sec, to load serving entities. 80
Second, LSEs could either procure the required amount inertial response themselves, or utilize a market administered by ERCOT. Under this design, resources participating in the DAM would submit offers for inertial capacity (in MW-sec) and the cost of providing this service (in $/MW-sec). The value of the
79 ERCOT, “ERCOT Proposal for Synchronous Inertial Response Service (SIR Service) Market,” March 11, 2015, http://www.ercot.com/content/wcm/key_documents_lists/55752/Proposal_for_Synchronous_Inertial_Response_Service_Market_March112015.docx. 80 FERC, Notice of Proposed Rulemaking: Essential Reliability Services and the Evolving Bulk-Power System - Primary Frequency Response, No. RM16-6-000 (November 17, 2016).
Cha
nge
in F
req
uenc
y (H
z)
0.6
0.55
0.5
0.45
0.4
0.35
0.3
0.25
0.2
0.15
0.1 500 600 700 800 900 1,000 1,100 1,200 1,300 1,400 1,500 1,600 1,700 1,800
Megawatts Lost 2006-2008 (average wind generation of 1157 MW)
2008-2010 (average wind generation of 2490 MW)
Figure 12: Drop in Frequency from Lost Supply Increases with Less Inertia80
36
procured inertia is the incremental cost of procuring this service in optimized security constrained economic dispatch.
Though the SIR product is still under consideration in ERCOT, it is the first example of an RTO considering paying for inertial response.
Over the long term, other reliability services that are currently uncompensated may likely become increasingly valuable. RTOs should continue to monitor these services and consider paying for them where they are needed.
LONGER TERM STRUCTURAL CHANGES WILL BE NEEDED The changes to market rules, operations, and products proposed in this paper will help RTOs manage increasing shares of renewables in the near to medium term. Over the long term, however, wholesale markets will likely require more significant structural changes.81 For example, in a system with very high shares of renewables, relying on the least-cost dispatch algorithms that RTOs currently use may become much harder( for example, if you have sufficient zero marginal cost capacity to meet load, how do you decide who to dispatch?).
Potential long-term solutions are much more speculative than the nearer-term solutions presented in the earlier sections of this paper, but at least two pathways seem particularly viable: an Evolved Energy-Mostly Market or a Product Portfolio.82
THE EVOLVED ENERGY-MOSTLY MARKET Of all the wholesale market structures in existence today, the Evolved Energy-Mostly Market looks most like an extension of ERCOT. Importantly, though, price caps would need to be removed to expose the value of flexibility. Prices would likely become much more volatile—jumping from near-zero or negative prices to high scarcity pricing. As with today’s markets, bilateral hedging could help manage risk, but even more hedging would be expected than in today’s markets. The Evolved Energy-Mostly Market would benefit from better definition and categorization of demand-side resources, such that market operators could co-optimize price-differentiated demand with supply. Flexible price-responsive demand would become a key element and would help to limit gaming and minimize market power.
Debate currently centers over whether it is worth establishing distribution-level locational marginal pricing (LMP). In an Evolved Energy-Mostly Market, distribution LMPs might enable efficient co-optimization of distribution-level resources with transmission-level ones, but it is difficult to imagine grid operators controlling millions of distributed devices from a central location, even if LMPs are known.
81 Eric Gimon, “On Market Designs for a Future with a High Penetration of Variable Renewable Generation” (Department of Energy), forthcoming. 82 Sonia Aggarwal, “Future Wholesale Markets and Implications for Retail Markets” (Resources for the Future and National Renewable Energy Lab Meeting, Washington DC, September 14, 2017), http://energyinnovation.org/wp-content/uploads/2017/09/Future-wholesale-markets_Energy-Innovation_Sonia-Aggarwal.pdf
Recommendation Pay for reliability services that are of increasing importance but are currently uncompensated, for example frequency response.
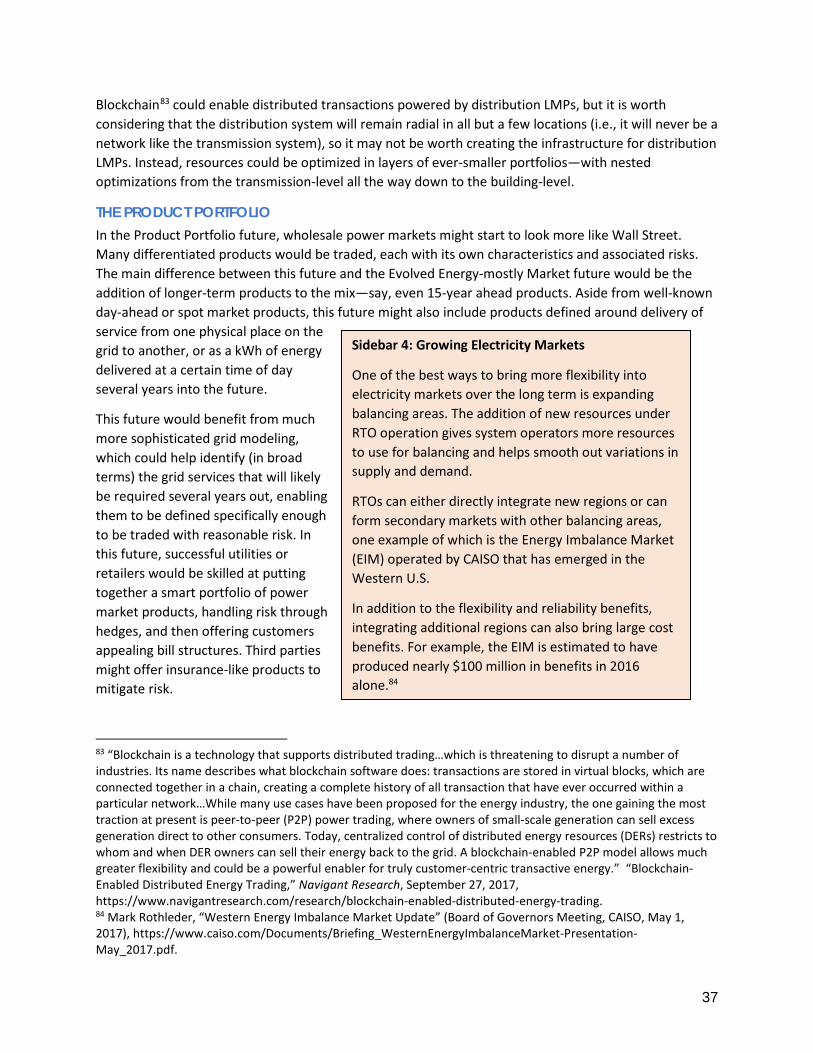
37
Blockchain83 could enable distributed transactions powered by distribution LMPs, but it is worth considering that the distribution system will remain radial in all but a few locations (i.e., it will never be a network like the transmission system), so it may not be worth creating the infrastructure for distribution LMPs. Instead, resources could be optimized in layers of ever-smaller portfolios—with nested optimizations from the transmission-level all the way down to the building-level. 84
THE PRODUCT PORTFOLIO In the Product Portfolio future, wholesale power markets might start to look more like Wall Street. Many differentiated products would be traded, each with its own characteristics and associated risks. The main difference between this future and the Evolved Energy-mostly Market future would be the addition of longer-term products to the mix—say, even 15-year ahead products. Aside from well-known day-ahead or spot market products, this future might also include products defined around delivery of service from one physical place on the grid to another, or as a kWh of energy delivered at a certain time of day several years into the future.
This future would benefit from much more sophisticated grid modeling, which could help identify (in broad terms) the grid services that will likely be required several years out, enabling them to be defined specifically enough to be traded with reasonable risk. In this future, successful utilities or retailers would be skilled at putting together a smart portfolio of power market products, handling risk through hedges, and then offering customers appealing bill structures. Third parties might offer insurance-like products to mitigate risk.
83 “Blockchain is a technology that supports distributed trading…which is threatening to disrupt a number of industries. Its name describes what blockchain software does: transactions are stored in virtual blocks, which are connected together in a chain, creating a complete history of all transaction that have ever occurred within a particular network…While many use cases have been proposed for the energy industry, the one gaining the most traction at present is peer-to-peer (P2P) power trading, where owners of small-scale generation can sell excess generation direct to other consumers. Today, centralized control of distributed energy resources (DERs) restricts to whom and when DER owners can sell their energy back to the grid. A blockchain-enabled P2P model allows much greater flexibility and could be a powerful enabler for truly customer-centric transactive energy.” “Blockchain-Enabled Distributed Energy Trading,” Navigant Research, September 27, 2017, https://www.navigantresearch.com/research/blockchain-enabled-distributed-energy-trading. 84 Mark Rothleder, “Western Energy Imbalance Market Update” (Board of Governors Meeting, CAISO, May 1, 2017), https://www.caiso.com/Documents/Briefing_WesternEnergyImbalanceMarket-Presentation-May_2017.pdf.
Sidebar 4: Growing Electricity Markets
One of the best ways to bring more flexibility into electricity markets over the long term is expanding balancing areas. The addition of new resources under RTO operation gives system operators more resources to use for balancing and helps smooth out variations in supply and demand.
RTOs can either directly integrate new regions or can form secondary markets with other balancing areas, one example of which is the Energy Imbalance Market (EIM) operated by CAISO that has emerged in the Western U.S.
In addition to the flexibility and reliability benefits, integrating additional regions can also bring large cost benefits. For example, the EIM is estimated to have produced nearly $100 million in benefits in 2016 alone.84
38
OUTLOOK HAZY, FOR NOW Other long-term solutions are likely to emerge, as the thinking is still nascent on this subject.85 For example, some stakeholders have presented the idea of a “bifurcated market,” either separating variable resources from dispatchable resources86 or separating energy from delivery87. Others have suggested that markets should optimize around carbon minimization rather than marginal cost. More research is needed on this subject.
CONCLUSION The old electricity market paradigm was oriented around resource adequacy and ensuring enough dispatchable supply was available to meet uncontrollable demand and cover a generator failure. With these goals in mind, grid operators designed the system around large, inflexible generators meeting load as an independent variable.
But today’s grid is evolving rapidly. The system is no longer composed primarily of large baseload units, but is instead transitioning to a highly flexible system made up of many smaller, more modular resources. New carbon- and fuel-free resources are available with different characteristics from older “baseload” and dispatchable power plants. New demand-side technologies are enabling grid operators to send price signals that, for the first time, can allow supply and demand to be truly co-optimized.
Market operators have many options available to help cost-effectively and reliably integrate new resources. Grid managers must start by refining market rules and operations to unlock the latent flexibility in existing grid resources. Requiring all generators, including imports, to participate in economic dispatch will provide flexibility by providing more options for grid operators to increase or decrease energy supply. Grid managers should reduce the offer floor if necessary to incent all units to participate in economic dispatch and respond to dispatch instructions. At the same time, grid managers must continue to improve coordination between electricity and gas markets, which will improve the flexibility of gas units. They must also look closely at how the existing set of rules unfairly discriminates against certain classes of technologies that can provide valuable grid services, and then make the proper changes to expose the value of these resource capabilities. Technology neutrality is of paramount importance, and new and existing products or restrictions must account for the differential qualities of resources, ensuring they can provide needed capabilities if able.
New and modified market products can also help harness existing resource flexibility while creating a strong investment signal for new, flexible resources. All resources should be incented to provide valuable grid services if they are able to do so, with valuable grid capabilities defined clearly to enable the most competition between resources to provide them. Products for reliability services are increasing in importance, for example ramping or fast frequency response. Implementing these products will help
85 For promising thinking on this subject, see: Eric Gimon (Energy Innovation), Brendan Pierpont (Climate Policy Initiative), Michael Liebreich (Bloomberg New Energy Finance), Jesse Jenkins (MIT), Dallas Burtraw and Karen Palmer (Resources for the Future), David Bielen and Daniel Steinberg (National Renewable Energy Laboratory), University of Toronto (Josh A. Taylor). 86 Michael Liebreich, “Six Design Principles for the Power Markets of the Future” Bloomberg New Energy Finance, May 24, 2017. https://data.bloomberglp.com/bnef/sites/14/2017/05/Liebreich-Six-Design-Principles-for-the-Power-Markets-of-the-Future.pdf 87 Brendan Pierpont, “Markets for Low-carbon, Low-cost Electricity Systems” Climate Policy Initiative, forthcoming.

39
ensure efficient grid operations while creating an incentive to deploy more resources capable of providing needed services. And over the longer-term, even more fundamental structural changes may be required to support efficient market operations, but potential long-term solutions are still quite speculative.
A clean, high renewables future is within sight. Grid managers need only look at the best practices of their colleagues around the country for inspiration on how to manage the transition as it happens.