
A Review on Supercritical Fluidization
20
Chapter 6 A Review on Supercritical Fluidization Youjun Lu, Liping Wei and Jikai Huang Additional information is available at the end of the chapter http://dx.doi.org/10.5772/intechopen.68180 Abstract Supercritical water fluidized bed (SCWFB) has been used to gasify biomass, coal and solid waste to produce gas fuel. Supercritical carbon dioxide fluidized bed (SCCO 2 FB) was applied in the coating industry. Both the two fluidized bed treats the supercritical fluids as fluidization medium. The fluidization behaviours of particles in the supercritical fluids are quite important issues for achieving the basic two phase flow pattern. Few research institutions have conducted experimental and numerical investigations on the fluidization in supercritical conditions. The authors try to establish a comprehensive insight of fluid dynamics of the supercritical fluidized bed. For the SCWFB, the fluidization transitions of fixed bed, homogeneous bed expansion and bubbling were demarcated by discrimination number D n . A flow pattern map of Reynolds number vs. Archimedes number was avail- able for describing the flow patterns and their boundaries of the SCCO 2 FB. Ergun equation was acceptable for calculating the fixed bed pressure drop for both SCWFB and SCCO 2 FB. Wei and Lu correlations of the minimum fluidization velocity, minimum bubbling velocity and homogeneous bed expansion rate are suggested to design the SCWFB. Wen and Yu equation of the minimum fluidization velocity, Vogt et al. correlation of the homogeneous bed expansion rate and their method for determining the minimum bubbling velocity, Nakajima et al. equation of transition velocity, and Bi and Fan correlation of turbulent velocity were recommended to calculate SSCO 2 FB. Keywords: supercritical fluids, fluidized bed, flow pattern, simulation, experiment 1. Introduction Supercritical fluidized bed fluidizes solids with supercritical fluids. The supercritical fluids is the fluid phase, and the solid particles including silica sand, biomass, coal or some coating particles are used in specific applications. Normally, supercritical fluidized bed can be divided into two types according the different supercritical fluids: supercritical water (SCW) and supercritical © 2018 The Author(s). Licensee IntechOpen. This chapter is distributed under the terms of the Creative Commons Attribution License (http://creativecommons.org/licenses/by/3.0), which permits unrestricted use, distribution, and reproduction in any medium, provided the original work is properly cited.
Transcript of A Review on Supercritical Fluidization

Chapter 6
A Review on Supercritical Fluidization
Youjun Lu, Liping Wei and Jikai Huang
Additional information is available at the end of the chapter
http://dx.doi.org/10.5772/intechopen.68180
Provisional chapter
A Review on Supercritical Fluidization
Youjun Lu, Liping Wei and Jikai Huang
Additional information is available at the end of the chapter
Abstract
Supercritical water fluidized bed (SCWFB) has been used to gasify biomass, coal and solidwaste to produce gas fuel. Supercritical carbon dioxide fluidized bed (SCCO2FB) wasapplied in the coating industry. Both the two fluidized bed treats the supercritical fluidsas fluidization medium. The fluidization behaviours of particles in the supercritical fluidsare quite important issues for achieving the basic two phase flow pattern. Few researchinstitutions have conducted experimental and numerical investigations on the fluidizationin supercritical conditions. The authors try to establish a comprehensive insight of fluiddynamics of the supercritical fluidized bed. For the SCWFB, the fluidization transitions offixed bed, homogeneous bed expansion and bubbling were demarcated by discriminationnumber Dn. A flow pattern map of Reynolds number vs. Archimedes number was avail-able for describing the flow patterns and their boundaries of the SCCO2FB. Ergun equationwas acceptable for calculating the fixed bed pressure drop for both SCWFB and SCCO2FB.Wei and Lu correlations of the minimum fluidization velocity, minimum bubbling velocityand homogeneous bed expansion rate are suggested to design the SCWFB. Wen and Yuequation of the minimum fluidization velocity, Vogt et al. correlation of the homogeneousbed expansion rate and their method for determining the minimum bubbling velocity,Nakajima et al. equation of transition velocity, and Bi and Fan correlation of turbulentvelocity were recommended to calculate SSCO2FB.
Keywords: supercritical fluids, fluidized bed, flow pattern, simulation, experiment
1. Introduction
Supercritical fluidized bed fluidizes solids with supercritical fluids. The supercritical fluids is thefluid phase, and the solid particles including silica sand, biomass, coal or some coating particlesare used in specific applications. Normally, supercritical fluidized bed can be divided into twotypes according the different supercritical fluids: supercritical water (SCW) and supercritical
© The Author(s). Licensee InTech. This chapter is distributed under the terms of the Creative Commons
Attribution License (http://creativecommons.org/licenses/by/3.0), which permits unrestricted use,
distribution, and eproduction in any medium, provided the original work is properly cited.
DOI: 10.5772/intechopen.68180
© 2018 The Author(s). Licensee IntechOpen. This chapter is distributed under the terms of the CreativeCommons Attribution License (http://creativecommons.org/licenses/by/3.0), which permits unrestricted use,distribution, and reproduction in any medium, provided the original work is properly cited.

carbon dioxide (SCCO2). The critical point of SCW and SCCO2 is Tc = 374�C and PC = 22.1 MPa,and Tc = 31.26�C, PC = 7.36 MPa, respectively. The properties including density, viscosity, con-ductivity, and specific heat capacity vary with operating temperature and pressure. The proper-ties of water are calculated by ISAWP-IF97 equations based on the operating temperature andpressure [1]. The drastic and fast variation of property under temperatures near the pseudo-critical temperature greatly affects the multiphase flow and heat transfer processes [2, 3].
1.1. Applications of supercritical fluidized bed
The supercritical water fluidized bed (SCWFB) has been used for gasifying biomass and coalfor hydrogen production. The concept of SCWFB reactor was proposed first by Matsumuraand Minowa [4]. In 2008, State Key Laboratory of Multiphase Flow in Power Engineering(SKLMF) of Xi’an Jiaotong University developed a SCWFB reactor for hydrogen productionby gasifying wet biomass [5]. The reactor could avoid plugging, increase the hydrogen yieldand improve gasification efficiency. Then, SKLMF successfully applied the SCW fluidized bedreactor to gasify coal and established pilot plant for gasification of biomass or coal [6]. Inaddition, the water fluidized bed operating in high pressure and temperature is a promisingreactor for other high temperature water reactions to produce gas or liquid fuels.
The SCCO2 is treated as a solvent and fluidization medium in the fluidized bed. Coating someinert substrate or pharmaceutical particle within the supercritical carbon dioxide fluidized bed(SCCO2FB) can help to improve the material performance or control the release processes ofthe active substance. The SCCO2FB coating processes have many advantages: narrow particlesize distribution, simple process step, simple solvents, moderate temperatures, and easilycontrolling the particle fluidizations. A further advantage is that they offer control over solidstate properties, producing either amorphous or crystalline material and sometimes poly-morphs [7].
1.2. Challenges of supercritical fluidized bed
One of the challenges for industrial applications of chemical technology of the supercriticalfluidized bed is the reliability of continuous running of the reactor. Another challenge of thesupercritical fluidized bed is enlargement. The inner diameter or size of the fluidized bed arelimited to the operating high temperature and high pressure. An increase in the inner diameterleads to larger wall thickness, which may reduce the heat transfer coefficient. The unclear flowpattern and transitions processes may affect the chemical reaction efficiency. The theories ofoptimal matching of mass, momentum, heat, and chemical reaction are still not perfect.
1.3. Important issues within the supercritical fluidization
The design and operation of the fluidized bed reactor are greatly dependent on the under-standing of the two-phase flow characteristics in the fluidized bed. An exact determination offlow patterns in fluidized bed reactor will help to keep the chemical reaction under suitableconditions. The evolution of flow patterns, key design parameters (minimum fluidization
Thermal Power Plants - New Trends and Recent Developments94

velocity, minimum bubbling velocity, bed expansion rate, etc.) of the supercritical fluidized bedare important issues for perfecting the theory of the supercritical fluidized bed.
Although the experimental investigations of the supercritical fluidized bed are still limited, theflow patterns and their boundaries of the supercritical fluidized bed have been graduallyobtained, and the correlations of the minimum fluidization velocity, homogenous bed expan-sion rate and minimum bubbling velocity, transition velocity and turbulent velocity were alsopartially proposed based on the experimental data. They can help readers to understand thebasic two-phase flow characteristics and achieve a calculation of design work.
2. Experiment and simulation
2.1. Experiment study
Tarmy et al. [8] studied the three-phase flow characteristics of fluidized beds under a pressureof 17 MPa and temperature of 450�C. Jiang et al. [9] investigated bed contraction and expan-sion in a gas–liquid–solid fluidized bed at pressures from 0.1 to 17.4 MPa and temperaturesfrom 20 to 94�C. Liu et al. [10] operated a CO2-fluidized bed system from ambient to 9.4 MPa.The fluidized bed is a stainless steel column with 25 mm i.d. and 1.2 m height. They experi-mentally studied the fluidization of Geldart Group A, B, and D particles in CO2 under ambientto supercritical conditions. They found that fluidization of the supercritical CO2 fluidized bedwas intermediate between the classical aggregative (gas-solid system) and particulate (liquid-solid system) fluidizations. Marzocchella and Salatino [11] fluidized Geldart Group A and Bparticles by CO2 at temperature of 35�C with pressure ranging from 1 to 8 MPa. The fluidiza-tion column consisted of a lower section made of a polycarbonate pipe with height of 600 mmand inner diameter of 30 mm and a higher stainless steel upper section with height of 700 mm.The temperature of CO2 varies from ambient to 80�C. The pressure varies from ambient to100 bar and regulated by a back pressure regulating valve. The maximum flow rate was up to100 kg h-1. Pressure drop transducer and a hot wire anemometer were applied to measure thefluctuations signals, pressure drop, and average voidage. The fluidization regimes of fixedbed, homogeneous bed expansion, bubbling zone, and turbulent regime were mapped. Vogtet al. investigated the fluidization behaviors of supercritical CO2-fluidized bed with pressureup to 30 MPa [12]. The experimental system was designed with a maximum operating pres-sure of 35 MPa and a maximum CO2 flow of 50 kg � h�1. The largest steel autoclave had avolume of 2.5 · 10�3 m3 with inner diameter of 39 or 21 mm. They provided a comprehensivepicture for the supercritical CO2-fluidized bed when the superficial velocity was not very high.Potic et al. [13] visually studied the fluidization process of Geldart Group A particles in highpressure water within a cylindrical quartz reactor with an internal diameter of 1.0 mm in therange of 0.1–24.4 MPa and 20–500�. Lu et al. [14] experimentally obtained the minimumfluidization velocity by measuring the pressure drops of a SCWFB with a diameter of 35 mmfor temperature ranging from 360 to 420�C and pressure ranging from 23 to 27 MPa. Wei andLu [15] built a SCWFB fluid dynamics teasing systems; the fluidized bed section is made ofstainless steel with 1.2 m height and 35 mm inner diameter. It is designed for the temperatureup to 550�C and the pressure up to 30 MPa. A porous metal foam with bore diameter of 30 μm
A Review on Supercritical Fluidizationhttp://dx.doi.org/10.5772/intechopen.68180
95

is used as the distributor of the fluidized bed test section, and a metal foam filter is installed inthe exit of the fluidized bed to avoid the escape of the bed materials. They measured the fixedbed pressure drop, minimum fluidization velocity, and bed expansion, minimum fluidizationbubbling velocity of a water-solid fluidized bed from ambient to supercritical conditions, andthey proposed a flow pattern map of the SCWFB.
2.2. Simulation advance
The fluidization of particles in the supercritical fluidized beds has been simulated by fewresearchers. Potic et al. [13] applied a DPM model to qualitatively simulate a micro-fluidizedbed with an inner diameter of 1 mm. The model provided consistent flow structures with thetested results in the sub-critical and supercritical zones. Vogt et al. [16] developed acompromised model to compute the movement of bubbles in a SCCO2FB on the basis ofempirical correlations. The model describes local fluid dynamics within the SCCO2FB bytreating the surrounding emulsion phase as a continuum and bubble as the other phase.Rodriguez-Rojo and Cocero [17] simulated a SCCO2FB with an Eulerian two-flow modelincorporating the classical drag model of Gidaspow. Wei et al. [18] simulated the feedingmethods of a SCW fluidized bed reactor based on the Eulerian two-flow model incorporatingparticle kinetic theory. Bubbling phenomenon of Geldart Group B particles was observed inthe simulation results. Lu et al. [19] derived a non-sphere drag equation to determine themomentum transfer between non-sphere particles and fluid in a dilute suspension system. Acombination drag of the non-spherical particle drag model and the Ergun equation has beenvalidated by comparing experimental data of the SCWFB. More recently, Lu et al. [20, 21]studied the fluidization process of Geldart Group B particles in SCW by a CFD-DEM model.Fluidization transition of fixed–homogeneous-bubbling zone was observed in the simulationwork. The two-fluid model and CFD-DEM model are two effective simulation method toinvestigate the fluid dynamics of the supercritical fluidized bed.
3. Flow dynamic in the supercritical fluidized bed
Fixed bed pressure drop, minimum fluidization velocity, minimum bubbling velocity, homoge-nous expansion rate, bubble properties and transitions, and turbulence flow regimes of thesupercritical fluidized bed are summarized. The flow characteristics of each flow regime areanalyzed. The correlations for the key parameters are proposed. In this part, the results ofmeasured method or simulated method for obtaining these parameters are discussed. The prop-erties of SCWand SCCO2 used in the experiments were shown in Tables 1 and 2, respectively.
P/MPa 27 27 27 27 27 25 23 23
T/�C 201 350 400 430 479 386 421 406
ρf/kg.m�3 880.1 616.1 200.0 150.5 108.2 283.8 112.2 136.5
μf/10�5 Pa∙s 13.5 7.16 3.12 2.96 3.04 3.67 2.71 2.75
Table 1. Properties of SCW.
Thermal Power Plants - New Trends and Recent Developments96

3.1. Fixed bed pressure drop
Fixed bed pressure drop is greatly affected by properties of fluid (density and viscosity), solidproperties (diameter, density, and shape factor), and superficial velocity and operation condi-tions. The description of the fixed bed pressure drop is a key element in the calculation of theminimum fluidization velocity. The calculation of fixed bed pressure drop can be achieved byErgun equation,
ΔPL
¼ að1� εÞ2
ε3·
μu
ðψdpÞ2þ b
1� εε3
·ρf u
2
ψdpð1Þ
whereΔP is the pressure drop, μ is the viscosity of fluid, ρf is the density of fluid, ε is the fixed bedvoidage, dp is the equivalent volume diameter of the particle, and ψ is the sphericity. The param-eters a and b are 1.50 and 1.75, respectively, which are from the investigations of Ergun [22]. Ergunequation has been accepted to calculate the fixed bed pressure dropwidely in literature [23].
Figure 1(a) shows the bed pressure drop vs. superficial velocity at temperature from ambient tosupercritical zone. The pressure drop increased with an increase in the superficial velocity. Anelevated temperature greatly affects bed pressure drop, and the main reason is the density andviscosity of high pressure water decrease with an increase in temperature. Figure 1(b) shows thesimulated instantaneous bed pressure drop under each superficial velocity was time-averaged,and the relationship between bed pressure drop and fluidization number (superficial velocitydivided by umf). When the superficial velocity is below the minimum fluidization velocity umf,the bed pressure drop increases with the increasing superficial velocity. When the superficialvelocity is above the minimum fluidization velocity, the curve of the bed pressure become flat.Wei and Lu [15] found the deviation of Ergun equation was about�30%, which was suitable forpredicating fixed bed pressure drop in the sub-critical and supercritical zones.
Figure 2 shows the pressure drop of SCCO2-fluidized bed. The experimental data are providedby Marzocchella and Salatino [11], and Vogt et al. [12]. It was found that Ergun equation wasgenerally giving a good description of the measured relationship between pressure drop andsuperficial velocity. Considering the different supercritical fluids and operating pressures andtemperature from ambient to supercritical zone, Ergun’s equation is also well applicable forfixed bed flow with a supercritical fluid.
3.2. Minimum fluidization velocity
The minimum fluidization velocity serves as a critical parameter for the design and operation offluidized bed. The determination ofminimum fluidization velocity is conventionally based on the
P/MPa 0.1 2 4 6 8 9.1 10.1 14.8 17.9 24.8
T/�C 18 35 35 35 35 54 57 56 57 57
ρf/kg.m�3 1.8 36 85 150 480 266.8 316.4 637.2 707.1 799.1
μf/10�5Pa∙s 1.46 1.65 1.73 1.91 4.18 2.25 2.49 4.92 5.77 7.13
Table 2. Properties of SCCO2.
A Review on Supercritical Fluidizationhttp://dx.doi.org/10.5772/intechopen.68180
97

curve of experimentally measured pressure drop vs. superficial velocity. The minimum fluidiza-tion velocity was determined by the turning point of the curves, as shown in Figures 1 and 2.The minimum fluidization velocity is a function of temperature and pressure for Geldart-A andGeldart-B particles. The minimum fluidization velocity increased with an increase in tempera-ture. The results are attributed to the decrease in density and viscosity of water induces a largerrelative velocity for achieving force balance of particles in fluidization. Wei and Lu [15] proposedthat an empirical equation of minimum fluidization velocity was achieved for fluidization ofGeldart-B and Geldart-A particles in water from ambient zone to supercritical zone. The correla-tion combined the experimental data in supercritical zone and the expression is shown as follows
Remf ¼ 6:17 · 10�4Ar0:9324, 70 < Ar < 52000 ð2Þ
where Ar is the Archimedes number Ar ¼ gd3pρf ðρs � ρf Þ=μ2f .
Figure 1. Bed pressure drop vs. superficial velocity for water-solid fluidized bed: (a) experimental data [15] and (b)simulation results by CFD-DEM model [20].
Figure 2. Bed pressure drop vs. superficial velocity for SCCO2 fluidized bed: (a) Marzocchella and Salatino [11], and (b)Vogt et al. [12].
Thermal Power Plants - New Trends and Recent Developments98

In literature, Wen and Yu [24] equation has been usually used to calculate the minimumfluidization velocity of fluidized bed, even at high pressure conditions. Vogt et al. [12] foundWen and Yu equation predicated the minimum fluidization velocity with an average error of14.3% in a SCCO2 fluidized bed. Rodríguez-Rojo and Cocero [17] also used Wen and Yuequation to determine the minimum fluidization velocity in the simulation work. Marzocchellaand Salatino [11] used Chitester et al. [25] equation to calculate the minimum fluidizationvelocity of the supercritical CO2 fluidized bed. Wei and Lu [15] have examined the applicabil-ity of those reported correlations in SCW fluidized bed. It was found that Wen and Yuequation predicated acceptable minimum fluidization velocity from ambient to supercriticalconditions, and the deviations of most predicated results are within �30%. However, Chitesteret al. equation predicated much higher minimum fluidization velocities than the experimentaldata.
Chitester et al. equation
Remf ¼ffiffiffiffiffiffiffiffiffiffiffiffiffiffiffiffiffiffiffiffiffiffiffiffiffiffiffiffiffiffiffiffiffiffiffiffiffiffiffið28:7Þ2 þ 0:0494Ar
q� 28:7 ð3Þ
Wen and Yu equation
Remf ¼ ð33:72 þ 0:0408ArÞ0:5 � 33:7 ð4Þ
3.3. Bed expansion
Figure 3 shows the curves of bed voidage vs. superficial velocity in typical operating conditionsfor the SCW fluidized bed. The slopes of the curves after the turning point were obviously lowerthan that before the turning point. Similar phenomenawere also observed in the SCCO2 fluidizedbed, as shown inFigure 4. The turningpoints of the voidage curves indicated bubbling occurrencein the fluidized bed. The homogenous bed expansion existed before the turning point and afterwhich bubbling was formed. The experimental results show that the transitions from homoge-nous to bubbling occur in several supercritical conditions for both Geldart A and B particles.
Figure 5 shows the relation curve of bed pressure drop and superficial velocity vs. time. Itcan be observed that the curve of bed pressure drop vs. time can be divided into three stages.
Figure 3. Typical results of voidage vs. superficial velocity for the SCW fluidized bed [20].
A Review on Supercritical Fluidizationhttp://dx.doi.org/10.5772/intechopen.68180
99

Stage I, the bed pressure drop increases step by step with the superficial velocity and withoutfluctuation when u < umf. Stage II, the pressure drop stops increasing with superficial velocityand fluctuates around a fixed value and decays rapidly when umf < u < umb. Stage III, thepressure fluctuates more violently with the increasing of superficial velocity when u > umb.
Figure 6 shows three snapshots of particles in the three stages. Figure 6(a) shows the fixed bedalmost no particle moves. Figure 6(b) shows the homogeneous fluidization regime withoutbubbling fluidization in SCW fluidized bed. Figure 6(c) shows a bubble fluidization. Bubblesare quite small and scattered in SCW fluidized bed and the bed expansion is more obvious. Thedistribution characteristics of bubbles benefit the mixing state of fluid phase and solid phase.
For predicating the homogenous bed expansion rate at supercritical pressure, Richardson andZaki equation [26] was modified based on the experimental data. The basic equation was given:
Figure 4. Typical results of voidage vs. superficial velocity for the SCCO2 fluidized bed Vogt et al. [12], and Marzocchellaand Salatino [11].
Figure 5. Bed pressure drop and superficial velocity vs. time for the SCW fluidized bed [21].
Thermal Power Plants - New Trends and Recent Developments100

u ¼ utεn ð5Þ
where ut is the terminal velocity, which can be calculated by correlation from Haider andLevenspiel [27].
Vogt et al. [12] proposed an empirical correlation for homogeneous bed expansion in theSCCO2 fluidized bed, which was given:
n ¼ 11:8Re�0:23t ð6Þ
Wei and Lu [15] provided a modified correlation for homogeneous bed expansion in the SCWfluidized bed, which is shown as follows,
n ¼ 10:364Re�0:09973t , 2 < Ret < 270 ð7Þ
The exponent n obtained from linear fitting of experimental data, thus they diverge each othergreatly. The deviation of Eqs. (6) and (7) may indicate that the effects of fluid properties oroperating conditions on bed expansion rates are remarkable. Care should be taken to use thebed expansion correlation. The correlation should be carefully used for the design of sub- andsupercritical water or SCCO2 fluidized bed.
The Gibilaro’s equation [28] was used to predicate the bed expansion of SCCO2 fluidized bedin literature [17].
ΔP ¼ 18Rep
þ 0:33� �
�ρf u
2H
dpð1� εÞε�4:8 ð8Þ
Figure 6. Snapshots of particles in various fluidization regimes [20].
A Review on Supercritical Fluidizationhttp://dx.doi.org/10.5772/intechopen.68180
101

3.4. Bubbling fluidization
3.4.1. Minimum bubbling velocity
The minimum bubble velocity can be obtained from the figure of the standard deviation σ ofpressure drop and heat transfer coefficient vs. superficial velocity in the vicinity of the incipientfluidization and incipient bubbling velocities. Figure 7 shows the simulated and experimen-tally measured method of the minimum bubbling velocity. As shown in Figure 7, beforebubbling, the standard deviations kept nearly invariable with an increase in the superficialvelocity. After bubbling, an approximately linear relationship between the standard deviationσ and superficial velocity were observed. The onset increase in σ was related to the bubbleoccurrence. Based on the two methods, the minimum bubbling velocities were obtained.
For the classical gas-solid fluidized bed, Abrahamsen and Geldart correlation is usually usedto calculate the minimum bubbling velocity [29]. However, Vogt et al. [12] found Abrahamsenand Geldart correlation predicated a much higher minimum bubbling velocity for the SCCO2
fluidized bed. They suggested to use Foscolo and Gibilaro [30] criterion to predicate the εb, andthen use Eqs. (5) and (6) to calculate the minimum bubbling velocity by intruding the minimum
Figure 7. Typical results of variance of variables in the vicinity of incipient fluidization and bubbling: (a) SCW fluidizedbed [15], (b) SCCO2 fluidized bed [11], and (c) SCW fluidized bed by CFD-DEM simulation [21].
Thermal Power Plants - New Trends and Recent Developments102

fluidization velocity and minimum fluidization voidage. Foscolo and Gibilaro found system ishomogeneous when the kinematic wave velocity is higher than the dynamic wave velocity,otherwise bubble occurs. When the two velocities are equal, the limit of stability of the systemis reached. The criterion is expressed as:
Ud �Uk
Uk¼
þ : Homogeneous0 : Stability limit� : Bubbling
8><>: ð9Þ
The kinematic wave speed is
Uk ¼ nutð1� εÞεn�1 ð10Þ
The dynamic wave velocity is
Ud ¼ffiffiffiffiffiffiffiffiffiffiffiffiffiffiffiffiffiffiffiffiffiffiffiffiffiffiffiffiffiffiffiffiffiffiffiffiffiffiffiffiffiffiffiffiffiffiffiffiffiffiffiffi3:2gdpð1� εÞðρs � ρf Þ=ρs
qð11Þ
However, Wen and Lu [15] evaluated the adaptability of Foscolo and Gibilaro criterion for thewater-solid fluidized bed from ambient to supercritical conditions. They found that Foscoloand Gibilaro’s criterion qualitatively predicated bubbling occurrence, the transformation pro-cesses of homogenous to bubbling were not captured. Therefore, it was difficult to use Foscoloand Gibilaro’s criterion to predicate the minimum bubbling velocity for the SCW fluidizedbed. They provided a polynomial function of Archimedes number for calculating the mini-mum bubbling velocity for the SCWFB.
Remb ¼ 2 · 10�8Ar2 � 9 · 10�8Arþ 1:4608, 700 < Ar < 34000 ð12Þ
3.4.2. Visible bubble flow rate
Based on the investigations of Vogt et al. [12], the visible bubble flow is multiplying the bubblegas holdup with the local mean bubble rise velocity,
Vb ¼ εbub ð13Þ
The linear relationship between the visible bubble flow and the excess velocity was observed inFigure 8.
Vb ¼ ϕðu� umbÞ ð14Þ
where ϕ = 0.6. When the emulsion phase voidage and bed average voidage are known, thebubble voidage can be obtained εb ¼ ðε� εeÞ=ð1� εeÞ. Then the bubble rising velocity can becalculated by Eq. (13). Eq. 14 reflects a linear relationship between the visible bubble flow andthe excess velocity, which is adapted to the ambient conditions. Although the correlation hasnot been validated for the SCWFB, the equation is suggested to evaluate bubble rising velocityin the situation of lack of reliable formula for predication.
A Review on Supercritical Fluidizationhttp://dx.doi.org/10.5772/intechopen.68180
103
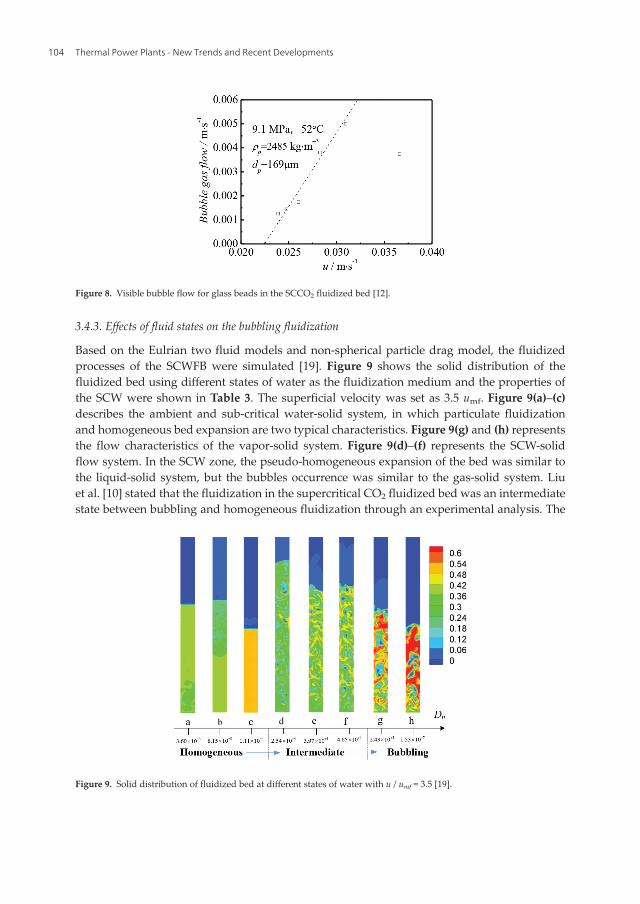
3.4.3. Effects of fluid states on the bubbling fluidization
Based on the Eulrian two fluid models and non-spherical particle drag model, the fluidizedprocesses of the SCWFB were simulated [19]. Figure 9 shows the solid distribution of thefluidized bed using different states of water as the fluidization medium and the properties ofthe SCW were shown in Table 3. The superficial velocity was set as 3.5 umf. Figure 9(a)–(c)describes the ambient and sub-critical water-solid system, in which particulate fluidizationand homogeneous bed expansion are two typical characteristics. Figure 9(g) and (h) representsthe flow characteristics of the vapor-solid system. Figure 9(d)–(f) represents the SCW-solidflow system. In the SCW zone, the pseudo-homogeneous expansion of the bed was similar tothe liquid-solid system, but the bubbles occurrence was similar to the gas-solid system. Liuet al. [10] stated that the fluidization in the supercritical CO2 fluidized bed was an intermediatestate between bubbling and homogeneous fluidization through an experimental analysis. The
Figure 8. Visible bubble flow for glass beads in the SCCO2 fluidized bed [12].
Figure 9. Solid distribution of fluidized bed at different states of water with u / umf = 3.5 [19].
Thermal Power Plants - New Trends and Recent Developments104

intermediate fluidization has the characteristics of the two-phase flow in both bubbling andhomogeneous fluidization. Obviously, the present simulation results showed an intermediatestate of the SCW fluidized bed, which was a pseudo-homogeneous expansion with a largenumber of small bubbles. With an increase in the discrimination number Dn, the fluidization ofwater-solid system evolved from particulate to intermediate to aggregative.
3.5. Turbulence fluidization and transition zone
Marzocchella and Salatino [11] observed the σ2ΔP1=ΔP21 vs. u pattern of the SCCO2 fluidized bed
is the well-known bell-shaped curve, as shown in Figure 10. With an increase in superficialvelocity, σ2ΔP1=ΔP
21 increase first and then decrease. Gas superficial velocities at which σ2ΔP1=ΔP
21
is at a maximum and at which it levels off, have been assumed, respectively, as the beginningUC and the endUk of the transition to the turbulent fluidization regime. Note that no detectabledecrease in the pressure drop across the bed was observed over several minutes of operation ofthe bed even at fluid superficial velocities over Uk. Based on the experimental investigations,Marzocchella and Salatino [11] suggested Nakajima et al. [31] equation to calculate the transi-tion velocity, and Bi and Fan [32] correlation to determine the turbulent velocity.
Fluid states Ambient Subcritical SCW Steam
No. (a) (b) (c) (d) (e) (f) (g) (h)
P/MPa 0.1 6.3 25.1 25.4 25.2 25.5 6 0.1
T/�C 20 207 224 387 403 428 400 400
ρf/kg.m�3 998.2 859.9 854.1 296.7 162.9 128.7 21.1 0.322
μf/10�5 Pa∙s 100.1 13.06 12.48 3.787 2.913 2.87 2.437 2.446
Table 3. Simulation conditions and parameters in Figure 9.
Figure 10. Dimensionless variance of the bed pressure drop vs. superficial fluid velocity for the SCCO2 fluidized bed.
A Review on Supercritical Fluidizationhttp://dx.doi.org/10.5772/intechopen.68180
105

Nakajima et al. equation is,
Rec ¼ 0:663Ar0:467 ð15Þ
Bi and Fan correlation is,
Rek ¼ 0:601Ar0:695 Ar ≤ 1252:28Ar0:419 Ar > 125
�ð16Þ
4. Flow pattern maps of supercritical fluidized bed
Mapping flow pattern based on experimental data is a useful method to characterize the flowregimes and transitions. For the classical gas-solid or liquid-solid fluidized bed, maps ofpressure drop vs. supercritical velocity, slip velocity vs. solid fraction, voidage vs. supercriticalvelocity, DP standard deviations vs. voidage, non-linear parameters vs. supercritical velocity,dimensionless diameter vs. dimensionless gas velocity, and Reynolds number vs. Archimedesnumber have been investigated [33, 34, 35]. Those maps can be classified into two groups:dimension and dimensionless. Obviously, the dimensional flow pattern maps are hard to beused in present situation because the fluid state varies greatly from ambient to supercriticalconditions. For example, although a plot of velocity vs. fluid density shows a clear physicalmeaning, it cannot include all the cases for different particles. The dimensionless flow patternmaps are promising to solve the shortcoming. The horizontal ordinates of dimensionless gasvelocity or Archimedes number in the traditional flow maps have been proved effective to theclassical fluidized bed. However, they are useless for present situations because they cannotdiscriminate the different transitions of flow regimes. The transitions of flow regimes aremainly depending on the properties of each phases and operating parameters. Obviously, justusing Archimedes number cannot reflect effects of both sides. The main obstacle of mappingthe flow pattern is describing the horizontal ordinates reasonably.
4.1. SCWFB
Wei and Lu [15] drew the flow pattern maps with abscissa Dn demarcating the three transi-tions processes and ordinate charactering the operating parameters. The discrimination num-ber Dn was proposed by Liu et al. [10] to demarcate the fluidization quality.
Dn ¼ ArRemf
� � ρs � ρf
ρf
!ð17Þ
The discrimination umber shows the effect of properties of two phases in Ar � ρs�ρfρf
� �, and the
effect of operating parameters in 1Remf
. This paper found the discrimination number Dn can
demarcate the flow pattern evolution processes. Based on the experimental analysis, fluidiza-tion state of fixed-homogeneous (F-H), fixed-homogeneous-bubbling (F-H-B) and fixed-bubbling (F-B) was summarized as follows:
Thermal Power Plants - New Trends and Recent Developments106

Dn < 1:2· 104
1:2· 104 ≤Dn < 6:4 · 104
Dn ≥ 6:4· 104
F�H
F�H � B
F� B
8>><>>: ð18Þ
The discrimination number Dn of 1.2 · 104 is little higher than the experimental results by Liuet al. [10]. The boundary of F-H fluidization can be determined by the minimum fluidizationvelocity correlation Eq. (2), and the boundary of F-B and H-B fluidization can be calculated bythe minimum bubbling velocity correlation Eq. (12).
4.2. SSCO2FB
Marzocchella and Salatino [11] gave a flow pattern map of Reynolds numbers Re vs. Archi-medes number for the SCCO2 fluidized bed. In the original map, they calculated Remf
according to Chitester et al. [25] correlation, Rec by Nakajima et al. [31] correlation, and Rekcould be calculated by Bi and Fan [32]. Here, the map was redrawn by adding the Wen andYu equation to evaluate the minimum fluidization velocity as shown in Figure 11. What’smore, the minimum bubble velocity is suggested to be determined according to Foscolo andGibilaro’s criterion.
5. Conclusion
Supercritical bed is a kind of new and promising reactors. This work tries to conduct acomprehensive study on supercritical fluidized bed to provide information of basic two-phaseflow and theories of design and operation. A review of main research progress is illustratedand important results were summarized. The main conclusions are obtained as follow:
Figure 11. Flow pattern for the SCCO2 fluidized bed.
A Review on Supercritical Fluidizationhttp://dx.doi.org/10.5772/intechopen.68180
107

1. Fixed bed pressure drop in supercritical conditions can be predicated by Ergun equation.
2. Wei and Lu correlation Eq. (2) was suggested as a new correlation for minimum fluidiza-tion velocity of water-solid fluidized bed in high pressure, near-critical and supercriticalconditions. Wen and Yu equation Eq. (4) was acceptable for calculating the minimumfluidization velocity of the SCWFB and SCCO2FB.
3. The homogeneous bed expansion rate of supercritical fluidized bed can be described bymodified Richard and Zaki equation. The index function n can be correlated by Wei and Luequation Eq. (7) and Vogt et al. equation Eq. (6) for the SCWFB and SCCO2FB, respectively.
4. The bubbling fluidization was found for both Geldart A and B particles in the supercriticalfluidized bed. An empirical correlation of minimum bubbling velocity in Eq. (12) wasachieved by Wei and Lu for the SCWFB. Vogt et al. provided a method to determine theminimum bubbling velocity of the SCCO2FB by using Foscolo and Gibilaro criterion.
5. The fluidization state of the supercritical fluidized bed can be viewed as an intermediatebetween classical gas-solid and liquid-solid fluidizations. The visible bubble flow rate canbe predicated by Vogt et al. equation Eq. (14).
6. For the SCWFB, discrimination number Dn was used to determine the fluidizationregimes from ambient to supercritical conditions. Fluidization of F-H was found whenDn was below 1.2 · 104; fluidization of F-H-B was found when Dn was between 1.2 · 104
and 6 · 104, and fluidization of F-B was found when Dn was above 6 · 104. As suggestedby Marzocchella and Salatino [11], Nakajima et al. [31] equation was used to calculate thetransition velocity, and Bi and Fan [32] correlation was applied to determine the turbulentvelocity of the SSCO2FB. A flow pattern map of Reynolds numbers Re vs. Archimedesnumber has been provided for the SSCO2FB.
Acknowledgements
This work is currently supported by the National Natural Science Foundation of Chinathrough contract No. 91634109, 51676158, and 51606153.
Nomenclature
Ar Archimedes number (Ar ¼ gd3vρf ðρs � ρf Þ=μ2f )
d Particle diameter (m)
db Bubble equivalent diameter (m)
Dn Discrimination number
FB Fluidized bed
g Acceleration due to gravity (m s�2)
n Index function
Thermal Power Plants - New Trends and Recent Developments108

Author details
Youjun Lu1*, Liping Wei1,2 and Jikai Huang1
*Address all correspondence to: [email protected]
1 State Key Laboratory of Multiphase Flow in Power Engineering (SKLMF), Xi’an JiaotongUniversity, Xi’an, Shaanxi, China
2 School of Chemical Engineering, Northwest University, Xi’an, Shaanxi, China
References
[1] Wagner W, Kruse A. Properties of water and steam-the industrial standard IAPWS-IF97for the thermodynamic properties and supplementary equations for other properties:tables based on these equations. Berlin: Springer Verlag; 1998
P Pressure (Pa)
Re Reynolds number
Rep Particle Reynolds number
Ret Terminal Reynolds number
SCW Supercritical water
SCCO2 Supercritical carbon dioxide
t Time (s)
T Temperature (K or �C)
u Superficial fluid velocity (m s�1)
umb Minimum bubbling velocity (m s�1)
umf Minimum fluidization velocity (m s�1)
ut Terminal velocity (m s�1)
Greek letters
ε Voidage
ρ Density
Subscripts
c Transition
f Fluid
k Turbulence
o Initial state
s Particle phase
t Terminal state
A Review on Supercritical Fluidizationhttp://dx.doi.org/10.5772/intechopen.68180
109

[2] Wei L, Lu Y, Wei J. Numerical study on laminar free convection heat transfer betweensphere particle and high pressure water in pseudo-critical zone. Thermal Science. 2014;18(4):1293-1303
[3] Yang CY. Numerical simulation of convection heat transfer for supercritical carbondioxide in tube. Beijing: North China Electric Power University; 2013
[4] Matsumura Y, Minowa T. Fundamental design of a continuous biomass gasificationprocess using a supercritical water fluidized bed. International Journal of HydrogenEnergy. 2004;29(7):701-707
[5] Lu Y, Jin H, Guo L, Zhang X, Cao C, Guo X. Hydrogen production by biomass gasifica-tion in supercritical water with a fluidized bed reactor. International Journal of HydrogenEnergy. 2010;31(7):822-831
[6] Guo L, Jin H. Boiling coal in water: Hydrogen production and power generation systemwith zero net CO2, emission based on coal and supercritical water gasification. Interna-tional Journal of Hydrogen Energy. 2013;38(29):12953-12967
[7] Leeke G A, Lu T, Bridson R H, et al. Application of nano-particle coatings to carrierparticles using an integrated fluidized bed supercritical fluid precipitation process. Jour-nal of Supercritical Fluids. 2014;91(7):7-14
[8] Tarmy, B, Chang, M, Coulaloglou C, Ponzi, P. Hydrodynamic characteristics of threephase reactors. Chemical Engineer. 1984;407:18-23
[9] Jiang P, Luo X, Lin T J, et al. High temperature and high pressure three-phase fluidization—bed expansion phenomena. Powder Technology. 1997;90(2):103-113
[10] Liu D, Kwauk M, Li H. Aggregative and particulate fluidization—The two extremes of acontinuous spectrum. Chemical Engineering Science. 1996;51(17):4045-4063
[11] Marzocchella A, Salatino P. Fluidization of solids with CO2 at pressures from ambient tosupercritical. Aiche Journal. 2000;46(5):901-910
[12] Vogt C, Schreiber R, Brunner G, et al. Fluid dynamics of the supercritical fluidized bed.Powder Technology. 2005;158(1–3):102-114
[13] Potic B, Kersten S, Ye M, et al. Fluidization with hot compressed water in micro-reactors.Chemical Engineering Science. 2005;60(22):5982-5990
[14] Lu Y, Zhao L, Han Q, et al. Minimum fluidization velocities for supercritical water fluid-ized bed within the range of 633–693K and 23–27MPa. International Journal of MultiphaseFlow. 2013;49(3):78-82
[15] Wei L, Lu Y. Fluidization behavior in high-pressure water at temperature from ambientto supercritical. Powder Technology. 2016;304:89-100
[16] Vogt C, Hartge E, Werther J, et al. Simulation of particle coating in the sueprcrticalfluidized bed. Particuology. 2005;3(Z1):113-124
Thermal Power Plants - New Trends and Recent Developments110

[17] Rodríguez-Rojo S, Cocero M. Supercritical fluidized bed modeling. Journal of Supercrit-ical Fluids. 2009;50(1):54-60
[18] Wei L, Lu Y, Wei J. Hydrogen production by supercritical water gasification of biomass:Particle and residence time distribution in fluidized bed reactor. International Journal ofHydrogen Energy. 2013;38(29):13117-13124
[19] Lu Y, Wei L, Wei J. A numerical study of bed expansion in supercritical water fluidizedbed with a non-spherical particle drag model. Chemical Engineering Research & Design.2015;104:164-173
[20] Lu Y, Huang J, Zheng P. Fluid hydrodynamic characteristics in supercritical water fluid-ized bed: A DEM simulation study. Chemical Engineering Science. 2014;117(1):283-292
[21] Lu Y, Huang J, Zheng P, et al. Flow structure and bubble dynamics in supercritical waterfluidized bed and gas fluidized bed: A comparative study. International Journal ofMultiphase Flow. 2015;73:130-141
[22] Ergun S. Fluid flow through packed columns. Journal of Materials Science & ChemicalEngineering. 1952;48(2):89-94
[23] Luckos A, Bunt J. Pressure-drop predictions in a fixed-bed coal gasifier. Fuel. 2011;90(3):917-921
[24] Wen C, Yu Y. Mechanics of fluidization. The Chemical Engineering Progress SymposiumSeries. 1966;62:100-111
[25] Chitester D, Kornosky R, Fan L, et al. Characteristics of fluidization at high pressure.Chemical Engineering Science. 1984;39(2):253-261
[26] Richardson J, Zaki W. Sedimentation and fluidisation: Part I. Transactions of the Institu-tion of Chemical Engineers. 1954;32(35):35-53
[27] Haider A, Levenspiel O. Drag coefficient and terminal velocity of spherical andnonspherical particles. Powder Technology. 1989;58(1):63-70
[28] Gibilaro L. Fluidization dynamics. Oxford: Butterworth Heinemann, 2001
[29] Abrahamsen A, Geldart D. Behaviour of gas-fluidized beds of fine powders part I.Homogeneous expansion. Powder Technology. 1980;26(1):35-46
[30] Foscolo P, Gibilaro L. A fully predictive criterion for the transition between particulateand aggregate fluidization. Chemical Engineering Science. 1984;39(12):1667-1675
[31] Nakajima M, Harada M, Yamazaki R, et al. Bubble fraction and voidage in an emulsionphase in the transition to a turbulent fluidized bed. Kagaku Kogaku Ronbunshu. 1990;16(2):322-328
[32] Bi H, Fan L. Existence of turbulent regime in gas-solid fluidization. Aiche Journal. 1992,38(2):297-301
A Review on Supercritical Fluidizationhttp://dx.doi.org/10.5772/intechopen.68180
111

[33] Bi H, Grace J, Zhu J. Regime transitions affecting gas-solids suspensions and fluidizedbeds. International Journal of Multiphase Flow. 1996;22(97):154-161
[34] Bai D, Shibuya E, Nakagawa N, et al. Characterization of gas fluidization regimes usingpressure fluctuations. Powder Technology. 1996;87(2):105-111
[35] Zhu J, Karamanev D, Bassi A, et al. (Gas-) liquid-solid circulating fluidized beds and theirpotential applications to bioreactor engineering. Canadian Journal of Chemical Engineer-ing. 2009;78(1):82-94
Thermal Power Plants - New Trends and Recent Developments112