150502232 changing-landscape-of-finance-in-india-during-the-past-decade

Private Sector, Small-scale, Grid-connected
Renewable Power Generation in Sri Lanka
A review of the experience of the past decade 1996 to 2006
Prepared for:
Project Director, RERED Project World Bank
DFCC Consulting (Private) Limited August 2007
Private Sector, Small-scale, Grid-connected Renewable Power Generation in Sri Lanka:
A review of the experience of the past decade
Purpose and Scope Ten years have evolved since the first modern small hydro power (SHP) project was commissioned in Sri Lanka on 30 April 1996. A decade after Mr. Premasiri Sumanasekera of Hydro Tech Lanka (Private) Limited connected the first plant to the national grid in Dick Oya, Nawalapititya, 47 projects totaling 89.73 MW was supplying electricity to Ceylon Electricity Board (CEB). In 2005 alone, 44 privately owned projects of less than 10 MW generated 277 GWh, contributing over 3% of the nation‟s demand1. The SHP experience in Sri Lanka has been an exemplary success and has been hailed by many experts as a commendable development model for similar private sector, small scale, and grid-connected renewable energy industries in emerging economies. The notable progress of the SHP industry has paved the way for the development of other private sector, small-scale, grid-connected renewable energy technologies in Sri Lanka. Moreover, policy-makers are now considering private investor participation in the construction of larger scale indigenous energy projects, which has hitherto been the sole domain of public sector enterprises. The objective of this report, therefore, is to provide a comprehensive analysis of the development of the renewable power generation sector in the country over the past ten years, as a reference for the design of future policy and market interventions in Sri Lanka and other countries. This analysis aims to assist stakeholders to assess the potential for growth in terms of energy contribution from indigenous renewable resources, private sector investment and rural infrastructure development. The report also serves to reveal the conflicting priorities of stakeholders impacting the development of indigenous energy resources with the intent of creating a platform for constructive debate towards realizing a sustainable and optimal outcome for the country.
1 Energy Purchase Branch, Ceylon Electricity Board
1

Page
Section 1 Executive Summary 3 Section 2 Non-Conventional Renewable Energy Technologies
– An Overview 5 Section 3 Sri Lanka‟s Small Hydro Power Experience 15 Section 4 Exploiting Sri Lanka‟s Wind Power Potential 47 Section 5 The Future of Bio-Power in Sri Lanka 56 Section 6 A Review of the Past Decade 69
Acronyms 73
References 74 Acknowledgements 76
Annexure: NRE Tariff Setting Methodologies
2
Contents
Sri Lanka‟s demand for electricity is projected to grow at 8% per annum. This means that the electricity generating capacity has to be augmented by about 200 MW per annum. To meet national demand till 2015, the Government of Sri Lanka is finalizing an energy policy and strategy that introduces coal and non-conventional renewable energy as the third and fourth fuel options respectively. The strategy targets 10% of the electricity requirement in 2015 to be supplied from non-conventional renewable energy sources, currently identified as small hydro, wind and bio-power. The institutional framework required to implement these targets has also been determined. Since its inception in 1996, the modern small hydro power industry has commissioned over 100 MW of privately owned, small-scale (less than 10 MW), grid-connected projects. The total potential is estimated at 400 MW. This study has conducted detailed analyses of the capacity, efficiency, investment and project life cycle of small hydro power plants. A straightforward application process, a standardised power purchase agreement with the utility, a viable and guaranteed tariff, tax and duty incentives, and concessionary financing arrangements have been the cornerstones of this industry‟s success. The potential estimated for wind and bio-power technologies in Sri Lanka too is vast. The bio-power industry targets the installation of 100 MW by 2010, while over 24,000 MW of good to excellent wind resource potential has been identified. However, to fully exploit these resources, all three technologies have to overcome many obstacles, with the assistance of the Government of Sri Lanka and the country‟s sole utility, Ceylon Electricity Board. Issues common to all are the absence of a renewable energy policy, a sustainable tariff setting methodology, creative project financing options, a technology specific standardized power purchase agreement and a streamlined approval process. The utility‟s planning, absorption and evacuation limitations too have an adverse effect on the growth of these industries. Indigenous, non-conventional renewable energy generation has a significant positive impact on the economy, society and environment of Sri Lanka. The country‟s energy security is improved because of the diversification of the energy mix; local private sector investment is mobilized to develop the nation‟s infrastructure; policy makers are encouraged to steer the country towards sustainable development, by balancing economic progress with the conservation of the environment and empowerment of rural communities. These reasons compel the Government to accord due priority to realize, without delay, the small hydro, wind and bio-power resource potential Sri Lanka has been endowed with.
3
S
E
C
T
I
O
N
O
N
E
Executive Summary

Following the executive summary, the report describes the national policy and strategies pertaining to non-conventional renewable energy technologies, with a brief introduction to the performance of the power sector in Sri Lanka. The three technology options considered are small hydro, bio-mass and wind power. A section is devoted to each energy source to identify its particular potential, barriers and strategies for growth. The final section concludes by establishing the significance of non-conventional renewable energy generation for Sri Lanka.
Report Organization
4
S
E
C
T
I
O
N
T
W
O

Section Two
Non-Conventional Renewable Energy Industry
An Overview

Sri Lanka is an island nation with a population of 19.7 million. 74.9% of the approximately 4.6 million households in the country had access to electricity, by the end of 2005. The annual per capita electricity consumption averaged 348 kWh per person, last year, and the total demand for electricity amounted to 7,254 GWh generated from 2,407 MW of installed capacity. Historically, there exists a positive co-relation between the growth of the economy and the demand for electricity, as depicted in Chart 2.1. In 2005, the real Gross Domestic Product grew by an estimated 6%, while the sale of electricity increased by 8.8%. Analysis of past demand yields an average growth of 8% for the electricity sector. This means that to meet the growing demand, the electricity generating capacity has to be augmented by about 200 MW per annum2.
Chart 2.1
Growth of GDP and Electricity Sales 1985-2004
Source: Ceylon Electricity Board,
Long Term Generation Expansion Plan 2006-2020
Though amounting to 50% of the installed capacity, hydro power plants contributed only 36% of the total generation in 2005. Thermal plants were responsible for a little over 60% of the electricity generated. As recently as 1991, more than 90% of the required power for the country was generated from hydro electricity. Today, however, power generation in Sri Lanka relies mainly on imported diesel based thermal sources, with relatively high costs of generation. Large diesel imports are also a substantial drain on the foreign exchange reserves of the country.
2 Ceylon Electricity Board, Long Term Generation Expansion Plan, 2006-2020, p. 1-2
5
S
E
C
T
I
O
N
T
W
O
Strengthening Sri Lanka’s Power Sector

Chart 2.2
Source: Central Bank Annual Report, 2005
The average consumer tariff in 2005 was SLR 7.70 per unit, a high tariff compared with its competitor countries3. The average cost of production was SLR 10.35 per unit. Thus, the resulting net operating loss of the CEB increased by 49% in 2005 due to „the compounded effect of higher oil prices and heavy reliance on thermal power generation‟4. According to the Central Bank of Sri Lanka, “the long-term sustainability of the electricity sector is being threatened by delays in implementing new low cost power plants, the non-implementation of necessary reforms and the delay in addressing high system losses”. In response to these challenges, the Ministry of Power and Energy (MoPE) has drafted a policy framework for the energy sector in Sri Lanka as a primary measure. “The National Energy Policy and Strategies of Sri Lanka” as it is known is expected to be ratified by the Government of Sri Lanka (GoSL) before the end of the year. The elements of this policy include ensuring energy security by diversifying and rationalizing the energy mix, while developing indigenous resources to optimal levels to minimize dependence on non-indigenous resources, subject to resolving economic, environmental and social constraints. In a bid to move from the present two-energy resource (hydropower and oil) status to a multiple resource status, coal and non-conventional renewable energy (NRE) are recognized as the third and fourth fuel options respectively5.
3 According to the Central Bank Annual Report of 2004, the average electricity tariff rates applicable to
the industrial sector in US Cents in selected countries were: Sri Lanka 7.00-7.50, Indonesia 1.52-3.90,
Malaysia 2.63-10.52, Singapore 4.23-6.78, Thailand 2.89-7.01 and the Philipines 3.30-10.68. 4 The overview on power sector performance is based on the analysis on energy in the Central Bank
Annual Report of 2005, p. 44 5 The National Energy Policy and Strategies of Sri Lanka, Final Draft, 2006, p. 13-14
6
S
E
C
T
I
O
N
T
W
O
Strengthening Sri Lanka’s Power Sector
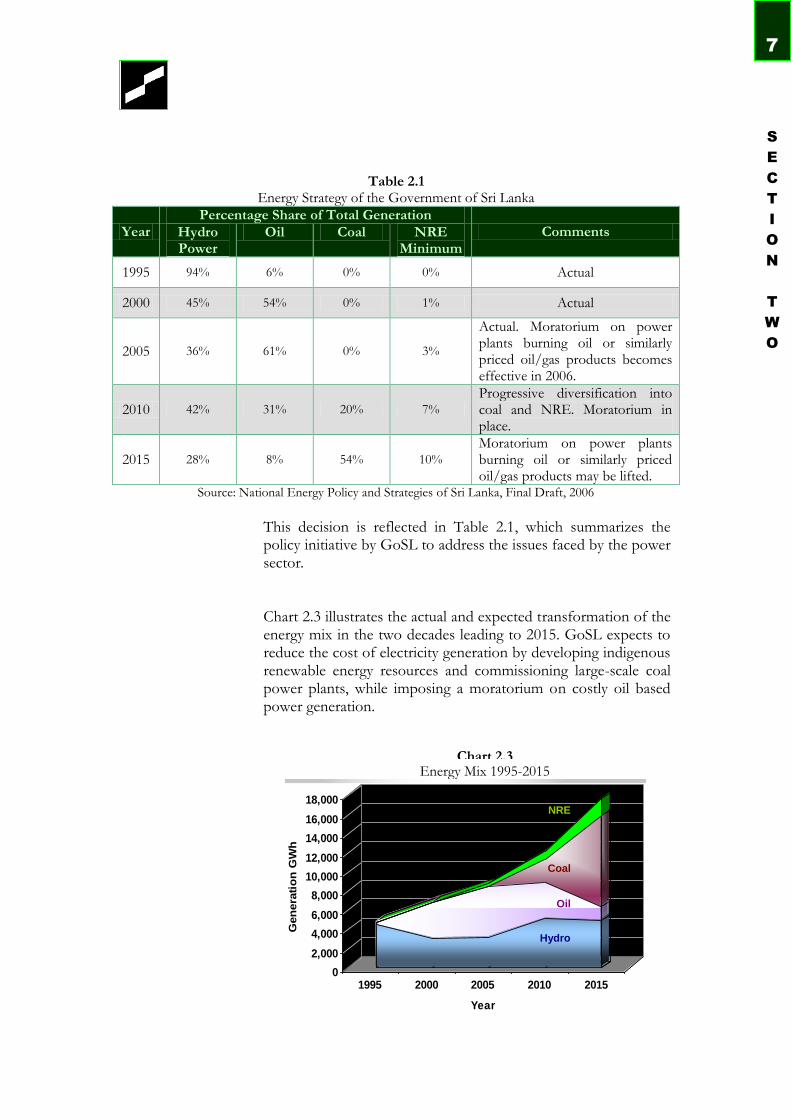
Table 2.1
Energy Strategy of the Government of Sri Lanka
Year Percentage Share of Total Generation
Comments Hydro Power
Oil Coal NRE Minimum
1995 94% 6% 0% 0% Actual
2000 45% 54% 0% 1% Actual
2005 36% 61% 0% 3%
Actual. Moratorium on power plants burning oil or similarly priced oil/gas products becomes effective in 2006.
2010 42% 31% 20% 7%
Progressive diversification into coal and NRE. Moratorium in place.
2015 28% 8% 54% 10%
Moratorium on power plants burning oil or similarly priced oil/gas products may be lifted.
Source: National Energy Policy and Strategies of Sri Lanka, Final Draft, 2006
This decision is reflected in Table 2.1, which summarizes the policy initiative by GoSL to address the issues faced by the power sector. Chart 2.3 illustrates the actual and expected transformation of the energy mix in the two decades leading to 2015. GoSL expects to reduce the cost of electricity generation by developing indigenous renewable energy resources and commissioning large-scale coal power plants, while imposing a moratorium on costly oil based power generation.
Chart 2.3 Energy Mix 1995-2015
0
2,000
4,000
6,000
8,000
10,000
12,000
14,000
16,000
18,000
Gen
era
tio
n G
Wh
1995 2000 2005 2010 2015
Year
Coal
NRE
Oil
Hydro
7
S
E
C
T
I
O
N
T
W
O

The Draft National Energy Policy and Strategies of Sri Lanka 2006 states that the GoSL will endeavour „to reach a minimum level of 10% of electrical energy supplied to the grid…by a process of facilitation… and the target year to reach this level of NRE penetration is 2015‟ (14). This is the first national policy that has given serious consideration to the development of NRE6. NRE in Sri Lanka is identified in the Draft Policy as small-scale hydro-power, biomass, including dendro power, biogas and waste, solar power, wind power and, in the future, resources such as wave and ocean thermal energy (14). The resource endowment of Sri Lanka limits the small-scale, grid-connected renewable energy potential to essentially three energy sources - hydro, bio-mass and wind power - in the period under review. “Small-scale” can be defined as projects of less than 10 MW in capacity, the limit which is imposed on the private sector for NRE projects that are not subject to public tender. Though small-scale hydro and bio-mass plants have been in existence for many decades, the World Bank funded Energy Services Delivery (ESD) Project from 1997 to 2002 and subsequently the Renewable Energy for Rural Economic Development (RERED) Project since 2002 were undoubtedly important catalysts for the recognition of these technologies as private sector, grid-connected generation options with significant potential. The first NRE project to be commissioned under the ESD Project was an SHP plant with an installed capacity of 0.96 MW, in 1996. Two years later, a 0.10 MW waste heat plant was commissioned. In May 2000, the first pilot wind power plant was connected to the national grid with the assistance of the ESD Project, establishing wind power too as a viable technology that merits serious consideration. In November 2004, the first commercial-scale dendro power plant became operational in Walapane.
6 Interview with Mr. Harsha Wickramasinghe, General Manager, Energy Conservation Fund
8
S
E
C
T
I
O
N
T
W
O
Non-Conventional Renewable Energy Industry

0
10
20
30
40
50
60
1995 1997 1999 2001 2003 2005
Year
Nu
mb
er
of
Pro
jec
ts
LoI Issued SPPA Signed Commissioned
Chart 2.4 Incremental Growth of NRE Projects
Table 2.2 Cumulative Commissioned Capacity of Small Scale, Grid-Connected
Renewable Energy Technologies in Sri Lanka 1996-2006
Technology 1996 1997 1998 1999 2000 2001 2002 2003 2004 2005 2006 Small Hydro 1.03 2.00 - 8.68 11.21 23.64 31.26 39.66 74.42 86.50 *94.53
Bio-Mass - - 0.10 - - - - - 1.10 - -
Wind - - - - 3.00 - - - - - -
Other - - - - - - 0.02 - - 1.00 -
* As at 30 June 2006 Source: Energy Purchase Branch, Ceylon Electricity Board
As evident from Table 2.2, of the three identified technologies, only small-scale hydro power has matured into a thriving industry which is set to exceed 100 MW by end of 2006. As per CEB data as at 30 June 2006, there has been visible growth during the latter half of the past decade, in terms of both the number as well as installed capacity of NRE projects. This is captured in Chart 2.4 and 2.5. CEB had received 1050 project proposals, but Letters of Intent (LoI) were issued to only 242. In subsequent sections, the progress of each technology is presented in detail.
Source: Energy Purchase Branch, Ceylon Electricity Board
Institutional Framework for Non-Conventional
Renewable Energy Development
9
S
E
C
T
I
O
N
T
W
O

0
50
100
150
200
2501
99
6
19
97
19
98
19
99
20
00
20
01
20
02
20
03
20
04
20
05
Year
MW
SPPA Signed Commissioned
Chart 2.5 Cumulative Growth of NRE Capacity
Source: Energy Purchase Branch, Ceylon Electricity Board
The success of the grid-connected component of ESD and RERED Projects can be defined in terms of the growth of the SHP industry. However, the development of bio-mass and wind technologies are yet to take off. Each technology has its particular menu of impediments that must be dealt with to pave the way for progress. A judicious analysis of the lessons learnt over the past ten years from the evolution of the SHP industry, nevertheless, will prove invaluable to shorten the learning curve for both bio-mass and wind power sectors, while aiding to further accelerate the growth rate of the SHP industry. The structural framework to support GoSL‟s NRE policy now necessitates the formation of a regulatory authority and an implementing agency. The Public Utilities Commission of Sri Lanka will be empowered to act as the regulator and the Sustainable Energy Authority will be set up to drive the NRE industry to achieve the targets set-forth by the energy policy and strategies of GoSL. As detailed in the Draft National Energy Policy and Strategies of Sri Lanka, the institutional responsibilities for the development of NRE will revolve around the first four institutions described hereafter. The fifth mentioned is a forum that has contributed significantly to NRE development in the past year.
10
S
E
C
T
I
O
N
T
W
O
Institutional Framework for Non-Conventional
Renewable Energy Industry
i] Ministry of Power and Energy MoPE is the line ministry and the apex institution of GOSL responsible for the country‟s power and energy sectors. As such, MoPE formulates national policies and strategies for the energy sector and oversees their effective and timely implementation7. According to the Draft National Energy Policy and Strategies of Sri Lanka, MoPE shall:
Prepare essential long-term plans, including an integrated national energy plan for 25 years;
Maintain the National Energy Database and publish the national energy balance and energy sector performance annually, with the assistance of the Department of Census and Statistics and
Carry out rural electrification programs, with the assistance of the Ministry of Finance and the Public Utilities Commission of Sri Lanka (PUCSL).
ii] Public Utilities Commission of Sri Lanka The PUCSL was established under the Public Utilities Commission of Sri Lanka Act No. 35 of 2002 to regulate „certain utilities industries pursuant to a coherent national policy‟8. The main objectives and functions as detailed in this Act include (Part IV):
Protect the interest of consumers and promote safety and service quality;
Promote competition and efficiency in resource allocation, operation and investment
Exercise licensing, regulatory and inspection functions and enforce related provisions;
Regulate tariff and other charges levied by the regulated entities where required by any industry Act and
Set and enforce technical and other standards relating to the safety, quality, continuity and reliability of the utilities
PUCSL will be empowered to execute regulation once individual industry legislations are enacted and made effective9.
7 The Energy and Resources Institute, Draft Report on Deliverable 7: Legal and Regulatory Approach
for Renewable Resource Based Electricity Generation - July 2005, p. 3 8 Public Utilities Commission of Sri Lanka Act, No 35 of 2002
9 National Energy Policies and Strategies of Sri Lanka, Final Draft, February 2006, p. 4
Institutional Framework for Non-Conventional
Renewable Energy Development
11
S
E
C
T
I
O
N
T
W
O

The Draft National Energy Policy and Strategies of Sri Lanka holds PUCSL accountable for:
Implementing long-term plans, policies and targets as set out by MoPE for GoSL, with the assistance of other stakeholders such as the Energy Conservation Fund or Sustainable Energy Authority, electricity utilities etc.;
Approving electricity pricing policies proposed by electricity distribution utilities, with the concurrence of the General Treasury;
Planning and executing rural electrification programs, including targeted subsidies, as decided by MoPE and the Ministry of Finance;
Carrying out fuel diversity and security measures with the assistance of electricity utilities and other key players and
Ensuring supply-side energy efficiency, together with electricity utilities.
iii] Energy Conservation Fund The Energy Conservation Fund (ECF) has been established under the Energy Conservation Fund Act, No.2 of 1985 to finance, promote and initiate activities and projects relating to efficiency, conservation and demand-side management of energy. ECF also investigates and encourages alternative sources of new and renewable energy10. The Draft National Energy Policy and Strategies of Sri Lanka requires the ECF to prepare, promote and facilitate a 20 year NRE Plan, detailing interim targets for specific NRE technologies, upper thresholds of pricing and resource costing. In addition, ECF is assigned the task of executing demand-side energy efficiency strategies and targets, with the aid of other stakeholders. Legislation is currently being drafted to reconstitute the ECF as the Sustainable Energy Authority (SEA) with a broader mandate to:
Develop renewable energy resources
Implement energy efficiency improvement and conservation programs
Analyze, develop and recommend policies
Source and manage funds to achieve above objectives
10
Energy Conservation Fund Act, No.2 of 1985, Part II
12
S
E
C
T
I
O
N
T
W
O
Institutional Framework for Non-Conventional
Renewable Energy Industry

Among the key functions of SEA will be the identification of energy development areas, the rationalization of the approvals process for NRE projects, the administration of the Sri Lanka Energy Fund and serving as the National Technical Service Agency of the Clean Development Mechanism in Sri Lanka11. If officially requested, the RERED Project will consider assisting MoPE to procure experts to prepare an institutional development plan for the SEA12. v] Ceylon Electricity Board CEB is a single, vertically integrated, state-owned electric utility, which is responsible for the planning, generation (public sector), transmission, distribution and sale of power in the country13. Without the support of the utility, the development of any grid-connected generation option will not be possible.
CEB‟s financial health governs investor confidence and the risk appetite of lending institutions. Favourable utility reforms are therefore vital to the growth of all private sector investments in the power sector, including in NRE opportunities. Nonetheless, it must be noted that the SHP industry flourished within the existing framework sans reform. The CEB, the MoPE, the World Bank and other stakeholders together have created an enabling environment in the past ten years to encourage indigenous NRE technologies in Sri Lanka. iv] Renewable Energy Cluster The Renewable Energy Cluster (REC) was formed in September 2005 under the National Council for Economic Development (NCED). The NCED was set up to bring together private and public sector stakeholders to jointly develop national economic policies and plans14.
11
Interview with Mr. Harsha Wickramasinghe, General Manager, Energy Conservation Fund 12
RERED Project, Implementation Review Mission Aide-Mémoire, April 2006, p. 2 13
The Energy and Resources Institute, Draft Report on Deliverable 7: Legal and Regulatory Approach
for Renewable Resource Based Electricity Generation - July 2005, p. 3 14
National Council for Economic Development, NCED – A Participatory Approach towards
Development, 2005, p. 1
Institutional Framework for Non-Conventional
Renewable Energy Development
13
S
E
C
T
I
O
N
T
W
O

As such, under the effective joint chairmanship of the Secretary to the MoPE and the Director General of PUCSL, REC has been instrumental in initiating almost all significant resolutions pertaining to the renewable energy sector to date. At least eight important decision-makers, stakeholders and/or experts are represented at most REC meetings. REC has successfully paved the way for PUCSL and SEA to carry out their functions by establishing a constructive consultation process among all parties concerned.
14
S
E
C
T
I
O
N
T
W
O
Sri Lanka’s Small Hydro Power Experience

Section Three
Sri Lanka’s Small Hydro Power Experience

The first SHP turbine in recorded history was installed in 1887 by Gilbert Gilkes and Company. Between 1887 and 1959, 369 plants totaling approximately 10 MW were commissioned, mostly in tea plantations. About 60 of these are still in operation15. Almost four decades later, the first modern SHP plant was commissioned in 1996. Ten years hence, over 100 MW have been connected to the national grid. As at 30 June 2006, CEB had on record 141 SHP projects amounting to 269.64 MW at various stages of completion.
Source: DFCC Consulting (Pvt) Ltd.
According to the Grid Connected Small Power Developers Association (GCSPDA), the sole organization representing the SHP industry, the commercially viable potential totals about 400 MW, which they claim can be developed by 2010 with the right encouragement from the GoSL. This estimate can well become a reality in the future, given official statistics. As at 30 June 2006, CEB had received a total of 1050 project proposals; only 242 of those were issued LoIs; 93 of the projects with LoIs proceeded to sign SPPAs with CEB; and 89 projects are still under development or commissioned16.
There has been a steady growth in the number of commissioned projects, which totaled 44 at the end of 2005, as apparent from Chart 3.1. In 2004, 11 projects were connected to the national grid, the highest recorded in a given year. In addition, there is a marked increase in the number of SPPAs signed per annum from 2002 onwards. At the end of 2005, the total number of valid SPPAs (excluding those cancelled) was 75.
15
Dr. Romesh Dias Bandaranaike, Grid Connected Small Hydro Power in Sri Lanka: The Experience
of Private Developers, 2000, p. 1 16
Data sourced from Energy Purchase Branch, Ceylon Electricity Board
Status Capacity (MW) Number of Projects
31 Dec 2005 30 June 2006 31 Dec 2005 30 June 2006
Commissioned 83.64 94.53 81 51
SPPAs signed 168.79 92.38 44 38
LoIs issued 71.55 82.74 42 52
Total 323.98 269.64 167 141
Table 3.1 SHP Industry at a Glance
15
S
E
C
T
I
O
N
T
H
R
E
E
Sri Lanka’s Small Hydro Power Experience

0
20
40
60
80
100
120
140
160
180
Ca
pa
cit
y (
MW
)
1996 1997 1998 1999 2000 2001 2002 2003 2004 2005
Year
SPPA Signed Commissioned
0
10
20
30
40
50
60
70
80
90
Pro
jec
ts
1996 1997 1998 1999 2000 2001 2002 2003 2004 2005
Year
SPPA Signed Commissioned
Source: DFCC Consulting (Pvt) Ltd.
Accordingly, 17 SPPAs totaling an unequaled 64 MW of capacity were commissioned in 2002. Since then, over 10 MW of SPPAs have been signed and commissioned every year, apart from 2003. In that year, the SHP industry installed only 3 projects amounting to 5.4 MW.
Source: DFCC Consulting (Pvt) Ltd.
16
S
E
C
T
I
O
N
T
H
R
E
E
Sri Lanka’s Small Hydro Power Experience
Chart 3.1
Cumulative Number of Commissioned SHP Projects
Chart 3.2
Cumulative Installed Capacity of Commissioned SHP Projects

0
2
4
6
8
10
12
14
16
18
20
<1 1 ≤ 2 2 ≤ 3 3 ≤ 4 4 ≤ 5 5 ≤ 6 6 ≤ 7 7 ≤ 8 8 ≤ 9 9 ≤ 10
Capacity (MW)
Nu
mb
er
of
Pro
jec
ts
Commissioned Valid SPPA Valid LoI
The significant features of this industry are that they are run-of-the river hydro projects, less than 10 MW in capacity and developed by the private sector. In August 1997, the Ministry of Irrigation and Power announced a policy direction to encourage private sector financing for power generation from small-scale renewable energy resources. Small-scale projects for this program have been defined as plants under 10 MW, though approval from CEB for those marginally above 10 MW are considered on a case-by-case basis17. Furthermore, in an attempt to mitigate the social and environmental impact of these projects, the Central Environmental Agency issues strict guidelines on the release of water back into the river after utilization for power generation. Thus, all projects are run-of-the-river type with minimal alteration of the natural flow.
The following analyses refer to all relevant projects, except in those instances when the sample employed has been mentioned.
Analysis of Capacity 89% of the installed capacity of commissioned projects in 2005 are less than or equal to 3 MW and 64% are less than or equal to 2 MW. Similarly, the design capacity of the majority of projects with valid SPPAs and LoIs are less than or equal to 2 MW.
Source: DFCC Consulting (Pvt) Ltd.
17
Guidelines on Private Sector Participation in Small Hydro Power Development, www.ceb.lk
17
S
E
C
T
I
O
N
T
H
R
E
E
Characteristics of the Small Hydro Power
Industry in Sri Lanka
Performance Appraisal
Chart 3.3
Analysis of Capacity of SHP Projects

0%
10%
20%
30%
40%
50%
60%
2001 2002 2003 2004 2005
Year
Pla
nt
Facto
r
Deniyaya WimalasurendraKiribathkumbura Nuwara EliyaBalangoda RatnapuraSeethawaka Annual Average
Analysis of Plant Efficiency Between 2001 and 2005, the simple average of the efficiency level of all commissioned plants is 39%. A significant co-relation between annual rainfall patterns and variation in actual generation data cannot be established.
Year 2001 2002 2003 2004 2005
Plant Factor
37% 38% 38% 41% 39%
Source: DFCC Consulting (Pvt) Ltd.
Further analysis reveals that performance of plants does depend on the grid sub-stations they are connected to. Balangoda leads the list, followed by Wimalasurendra and Seethawaka, as evident from Chart 3.4. Plants connected to Deniyaya and Kiribathkumbura show a relatively poor performance.
Source: DFCC Consulting (Pvt) Ltd.
18
S
E
C
T
I
O
N
T
H
R
E
E
Characteristics of the Small Hydro Power
Industry in Sri Lanka
Table 3.2 Efficiency Factor of SHP Plants
2001-2005
Chart 3.4
Efficiency Factor of SHP Plants Analyzed by Grid Sub-Station

0%
10%
20%
30%
40%
50%
60%
2001 2002 2003 2004 2005
Year
Pla
nt
Facto
r
Kahawatte Katugastote Kegalle
Nawalapitiya Nuwara Eliya Annual Average
Ratnapura Ruwanwella
`
The efficiency of plants was analyzed by their location as well. The interesting outcome can be summarized as follows:
Kahawatte - plants connected to the Balangoda sub-station performed well relatively to those connected to the Deniyaya sub-station.
Nawalapitiya – plants connected to the Wimalasurendra sub-station performed better than those connected to Seethawaka and Kiribathkumbura sub-stations.
Ratnapura – interestingly, all plants have relatively high efficiency factors, regardless of the grid sub-station they are connected to.
Ruwanwella – all plants are connected to the Seethawaka sub-station and show a satisfactory performance, though the one plant connected to this sub-station but located in Nawalapitiya has a relatively low efficiency level.
Source: DFCC Consulting (Pvt) Ltd.
Thus, the location of the plant and the grid sub-station it is connected to have considerable bearing on the performance of most plants. However, the period of analysis is too brief for a responsible conclusion. Low plant factor trends also imply that the hydrology studies on which the project capacities have been designed have not been accurate. Developers will do well to pay heed to the location and the grid connection facilities of the plant in the future.
19
S
E
C
T
I
O
N
T
H
R
E
E
Characteristics of the Small Hydro Power
Industry in Sri Lanka
Chart 3.5 Efficiency Factor of SHP Plants Analyzed by Grid Sub-Station

0
1
2
3
4
5
6
7
8
9
-41 ≥
-45
-36 ≥
-40
-31 ≥
-35
-26 ≥
-30
-21 ≥
-25
-16 ≥
-20
-11 ≥
-15
-6 ≥
-10
-1 ≥
-5 0
1 ≤
5
6 ≤
10
11 ≤
15
16 ≤
20
21 ≤
25
26 ≤
30
Percentage Deviation
Nu
mb
er
of
Pro
jec
ts
An examination of the differences between planned and actual average plant efficiencies between 2001 and 2005 considered data from 32 projects that have been in operation for more than a year. The study yielded the results presented in Chart 3.6. The deviation between planned and actual plant factors ranged from ± 6 to 45%. Only four projects exceeded expected values. Two of the three plants with the worst performance are connected to the Kiribathkumbura grid sub-station. The plants with the largest negative and positive deviation are connected to the Seethawaka grid sub-station. Notably, projects located in Ratnapura had achieved the least deviation, while all plants in Kahawatte carried relatively high differences in the range of ± 20 to 30%.
Source: DFCC Consulting (Pvt) Ltd.
Inaccurate designing can result from the lack of adequate rainfall and river flow data and the failure to adequately capture terrain information such as ground water retention ability and the impact of upstream development. Further, the above results reinforce the view that performance forecasts should factor in electricity evacuation limitations. Deviations in plant efficiencies can also signal the existence of operational shortcomings. For instance, performance can be seriously undermined if plant operators do not ensure that trash tracks and channel paths are kept free of debris during heavy rainfall.
20
S
E
C
T
I
O
N
T
H
R
E
E
Characteristics of the Small Hydro Power
Industry in Sri Lanka
Chart 3.5
Percentage Deviation between Planned and Actual Plant Efficiency
0
20
40
60
80
100
120
140
160
180
1996 1999 2000 2001 2002 2003 2004 2005 2006
Year
Co
st
per
MW
(S
LR
Millio
ns)
<1 1 ≤ 3 3+ Ave
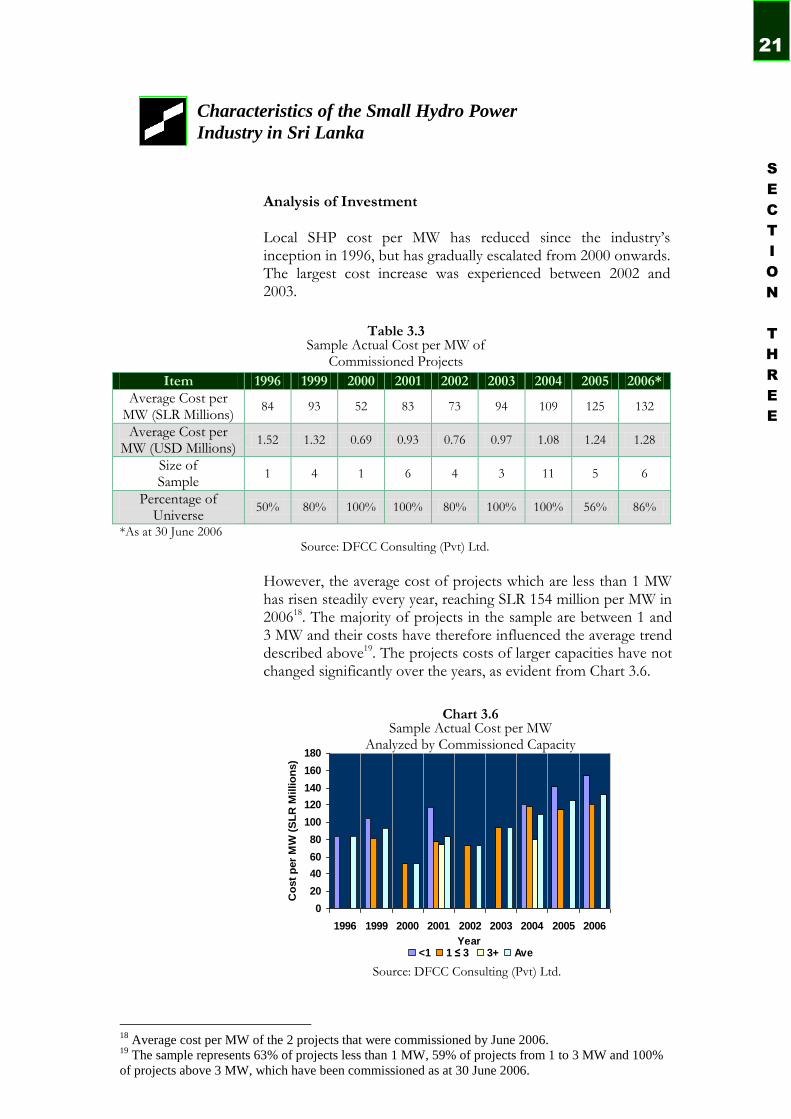
Analysis of Investment
Local SHP cost per MW has reduced since the industry‟s inception in 1996, but has gradually escalated from 2000 onwards. The largest cost increase was experienced between 2002 and 2003.
Item 1996 1999 2000 2001 2002 2003 2004 2005 2006*
Average Cost per MW (SLR Millions)
84 93 52 83 73 94 109 125 132
Average Cost per MW (USD Millions)
1.52 1.32 0.69 0.93 0.76 0.97 1.08 1.24 1.28
Size of Sample
1 4 1 6 4 3 11 5 6
Percentage of Universe
50% 80% 100% 100% 80% 100% 100% 56% 86%
*As at 30 June 2006 Source: DFCC Consulting (Pvt) Ltd.
However, the average cost of projects which are less than 1 MW has risen steadily every year, reaching SLR 154 million per MW in 200618. The majority of projects in the sample are between 1 and 3 MW and their costs have therefore influenced the average trend described above19. The projects costs of larger capacities have not changed significantly over the years, as evident from Chart 3.6.
Source: DFCC Consulting (Pvt) Ltd.
18
Average cost per MW of the 2 projects that were commissioned by June 2006. 19
The sample represents 63% of projects less than 1 MW, 59% of projects from 1 to 3 MW and 100%
of projects above 3 MW, which have been commissioned as at 30 June 2006.
21
S
E
C
T
I
O
N
T
H
R
E
E
Characteristics of the Small Hydro Power
Industry in Sri Lanka
Table 3.3 Sample Actual Cost per MW of
Commissioned Projects
Chart 3.6 Sample Actual Cost per MW
Analyzed by Commissioned Capacity

0
50
100
150
200
250
300
350
1999 2000 2001 2002 2003 2004 2005
Year
Ind
ex (
Base Y
ear
1999=
100)
Cement (SLR) Steel (SLR)Copper (SLR) USD:SLREuro:SLR CCPIAverage SHP Cost per MW (SLR)
In the period between 1999 and 2005, steel, copper and cement prices have increased steadily and, at times, steeply. International steel and copper prices affect the cost of electro-mechanical imports and the local price of cement has a considerable impact on civil construction costs. In addition, inflation has predictably risen and the Rupee has depreciated against the US Dollar and the Euro. The compounded effect of all these factors should have resulted in a sharp escalation of development costs, as illustrated in Chart 3.7. However, the average development costs of projects in the sample have increased, albeit relatively modestly. An index of the period summarized in Table 3.4 shows that by 2005, average cost per MW has grown by only 34% as opposed to all other factors, whose increase range from 43% to 230%.
Item 2005
Cement (SLR) 174
Copper (SLR) 330
Steel (SLR) 186
Exchange Rate – USD:SLR 143
Exchange Rate – Euro:SLR 167
Inflation – Colombo Consumers‟ Price Index 164
Average Cost per MW 134
Source: Central Bank of Sri Lanka, London Metal Exchange, DFCC Consulting (Pvt) Ltd.
S
E
C
T
I
O
N
T
H
R
E
E
22
Characteristics of the Small Hydro Power
Industry in Sri Lanka
Chart 3.7 Sample Actual Cost per MW
Analyzed by Capacity
Table 3.4 Price and Cost - 2005
Index 1999=100

Nevertheless, projects costs continue to increase, as has been concluded from an examination of 15 projects that are currently under construction. 8 projects are between 1 and 3 MW and have shown a 2.5% increase in their average cost as compared to 2006 for similar projects. The projects below 1 MW and above 3 MW have increased by 25% or more, when compared to like capacities in previous years.
Item <1 MW 1 ≤ 3 MW 3+ MW
Average Cost per MW (SLR Millions)
221 124 117
Size of Sample
1 8 5
* As at 30 June 2006 Source: DFCC Consulting (Pvt) Ltd.
By the end of 2005, 31 unique companies had developed 44 SHP projects and the majority ownership of only one project is held by a foreign company. Thus, the bulk of the investment in the SHP industry comes from local companies and individuals. Furthermore, with one exception, the five main engineering firms who provide turnkey services to this sector are owned and managed by Sri Lankans. A physical inspection of 15 sites was carried out for the purpose of this study. 4 of the plants have installed machinery and equipment manufactured in China, while the other plants operate with those sourced from Europe. Discussions with engineers have confirmed that as long as the manufacturer of equipment has a credible track record and a reliable operation, the point of origin has no bearing on the procurement decision. However, the plant efficiencies of established European manufacturers have remained relatively high. As evident from the above data, local engineers must be given due credit for employing innovative ways to control the development cost of projects, against all odds. This achievement can be attributed to three main reasons. Improved construction methodology and project management have reduced the time, effort and cost of building SHP projects. Moreover, engineers are increasingly resorting to low cost electro-mechanical solutions. Though there is no evidence of compromises in the quality of plants constructed, only time can prove the reliability of innovations used by engineers in SHP development in Sri Lanka.
23
S
E
C
T
I
O
N
T
H
R
E
E
Characteristics of the Small Hydro Power
Industry in Sri Lanka
Table 3.5
Cost per MW of Projects under Construction Analyzed by Capacity*

0 2 4 6 8 10 12 14 16 18
< 1
1 ≤ 2
2 ≤ 3
3 ≤ 4
4 ≤ 5
5 ≤ 6
Nu
mb
er
of
Ye
ars
Number of Projects
Analysis of the Project Life Cycle As at 30 June 2006, three stages of the project life cycle have been analysed as follows: a] LoI to SPPA 38 SPPAs were valid as at 30 June 2006. 45% of these projects took 1 to 2 years, and 40% of the projects took 2 to 3 years to meet the requirements set out in the LoI in order to sign the SPPA, as shown in Chart 3.8.
Source: DFCC Consulting (Pvt) Ltd.
b] SPPA to Commissioning Of all commissioned projects as at 30 June 2006,
84% of those less than 1 MW became operational within 1 year of signing the SPPA. The time frame for these projects has not exceeded 2 years;
85% of the projects in the 1-3 MW range were completed within 2 years. The number of the projects that took less than a year slightly surpassed the number commissioned between 1 and 2 years of entering into the SPPA.; and
only 5 projects were delayed beyond 2 years, all of which were commissioned in 2004 and after.
Thus, one can only conclude that most developers proceed with construction before signing the SPPA.
S
E
C
T
I
O
N
T
H
R
E
E
24
Characteristics of the Small Hydro Power
Industry in Sri Lanka
Chart 3.8 Time Taken to Convert
LoIs into SPPAs

0 5 10 15 20
< 18
18 ≤ 24
24 ≤ 36
Nu
mb
er
of
Mo
nth
s
Number of Projects
< 1 MW 1≤ 3 MW > 3 MW
0 5 10 15 20
< 1
1 ≤ 2
2 ≤ 3N
um
ber
of
Years
Number of Projects
< 1 MW 1≤ 3 MW > 3 MW
Source: DFCC Consulting (Pvt) Ltd.
c] Launch to Commissioning The period between the launch and commissioning of 42 projects in operation by 30 June 2006 was analysed. Within 18 months, 10 of the 13 projects less than 1 MW and 18 of the 24 projects between 1 and 3 MW were commissioned. The first SHP project at Dick Oya took 30 months to construct. Since then, the capacity of the project, the year of commissioning or the experience of the developer seem irrelevant in determining the duration of the construction period for projects equal to or below 3 MW. Nonetheless, before 2003, the two projects in the sample which are above 3 MW took over 3 years to complete, though similar projects thereafter were constructed in less than 18 months.
Source: DFCC Consulting (Pvt) Ltd.
Chart 3.9 Time Taken to Commission
Projects with SPPAs
25
S
E
C
T
I
O
N
T
H
R
E
E
Characteristics of the Small Hydro Power
Industry in Sri Lanka
Chart 3.10 Time Taken to Complete Construction of Projects

The majority of projects take 3 years to obtain a SPPA and 2 years to commission a project, disregarding the waiting period to obtain a LoI. To sign the SPPAs, developers with LoIs are required to obtain approvals from a myriad of institutions. This is a long, drawn out process. Having then signed the SPPAs, they face innumerable difficulties to secure both private and crown land. Once construction has commenced, projects can get stalled again because of the unavailability of grid evacuation facilities. These are the prime reasons that have impeded the progress of SHP projects. External factors such as political, social and legal issues also can lengthen the project life cycle. Furthermore, as per the records of GCSPDA, an analysis of 47 complaints has yielded the results depicted in Chart 2.3. Bureaucratic delays, subjective decision- making and lack of any state facilitation are some of the key obstacles faced by these developers.
Chart 3.11 Analysis of Complaints Lodged with
Grid Connected Small Power Developers Association
Political Pressure
6%
Environmental
NGO
4%
Grid
Interconnection
17%
Local Authorities
13%
Crown Land
33%Private Land
9%
Central
Environmental
Authority
9%
Other
Departments
9%
* Other Departments – 1 complaint each on approvals from Department of Agrarian Services, Department of Irrigation, National Water Supply and Drainage Board and National Building Research Organization.
Source: Grid Connected Small Power Developers Association
S
E
C
T
I
O
N
T
H
R
E
E
26
Characteristics of the Small Hydro Power
Industry in Sri Lanka

An effective framework has been established to attract private sector investment for the development of small-scale, run-of-the-river projects in Sri Lanka. This framework rests on five key cornerstones, which together provide a powerful incentive and support structure that tilts the scale towards continued investor confidence, despite numerous obstacles and long delays in implementation. These five factors deserve careful scrutiny as their combined influence draws the fine line between success and failure for the SHP industry. Additionally, the availability of stream flow data, rainfall statistics and high quality topographical detailing have proved invaluable to the industry. The following five factors have played a pivotal role in the progress of the SHP industry. i] Straightforward Application Process CEB issues a LoI to any applicant for any site that can be connected to the national grid, indicating willingness to purchase electricity from the proposed project. The application for LoI is straightforward and issued on a first-come, first served basis. There is no pre-qualification process to screen applicants. This has prompted many developers, with the know-how and interest, to search for suitable sites and apply for LoIs. A developer can be an individual or any form of partnership, registered or otherwise, with no adverse civil, commercial or criminal track-record. A developer must forward an initial proposal to CEB, requesting formal approval from CEB to purchase electricity. “The details of the initial project proposal are studied by CEB for reasonableness, any conflicts with other on going private or CEB Master Plan Projects and a tentative grid connection point at 33kV level is identified. In this process, CEB will establish that the project is prima facie technically and financially viable”20.
The LoI is issued for six months. A non-refundable application processing fee is levied. During this period the developer is required to submit the feasibility report to CEB including an outline plan for the construction of the plant, provide CEB the information required for interconnection studies and obtain all approvals necessary for the construction of the plant and interconnection facilities from relevant government institutions and other agencies.
20
Guidelines on Private Sector Participation in Small Hydro Development, www.ceb.lk
27
S
E
C
T
I
O
N
T
H
R
E
E
Key Drivers of Development

The “CEB Guide for Grid Interconnection of Embedded Generators, Sri Lanka” provides the requirements and procedures for the plant‟s design, testing, commissioning and operation of the interconnection with the CEB network. The developer must sign the SPPA with CEB within the validity period of the LoI and, until such time, submit a monthly report of progress to CEB21. Rationale for Success The ease of application for potentially lucrative projects, combined with the reservation of projects according to priority of application, has been proven to be the most effective method for identification of a large number of small sites scattered across a region. One can safely assume that the greater part of the SHP potential has by now been identified and has received or awaits approval from CEB. If, as has been suggested over the years, the identification of sites were carried out by a consultant employed by the utility or similar entity and the sites tendered thereafter, or the qualifications for application were more restrictive, the SHP industry would not have developed this rapidly. ii] Standardised Power Purchase Agreement An Independent Power Producer (IPP) must sign a Standardised Power Purchase Agreement with CEB, once the terms and conditions as set out in the LoI have been fulfilled. SPPA is a standardised, non-negotiable, 15 year contract. The SPPA defines the terms and conditions for the generation and sale of power22. Briefly:
The SPPA ensures that CEB considers an IPP plant a Must Run Facility.
The plant must be operated and maintained in a manner consistent with Prudent Utility Practices23.
CEB agrees to purchase all energy output delivered at the interconnection point. Such energy output must substantially satisfy the quality specified by CEB in the SPPA.
21
Ceylon Electricity Board, Letter of Intent for Embedded Generating Plant 22
Ceylon Electricity Board, Standardised Power Purchase Agreement 23
SPPA defines Prudent Utility Practices as accepted international practices, standards and engineering
and operational considerations, including but not limited to manufacturers’ recommendations and the
exercise of reasonable skill, diligence, foresight and prudence that would be exercised or generally
followed in the operation and maintenance of facilities similar to the Facility.
S
E
C
T
I
O
N
T
H
R
E
E
28
Key Drivers of Development

IPPs are made responsible for the cost and construction of all facilities required for the delivery of energy output to CEB at the interconnection point. Transmission lines must be constructed according to CEB and IEC standards.
The SPPA details the tariff calculation methodology applicable for the duration of the project.
The developer is required to commission the project within twenty four months of signing the SPPA.
Rationale for Success The SPPA has established a practical basis for private sector involvement24. Before venturing in to a project, a developer knows the terms and conditions the project is governed by. He can forecast the price of sale, since the methodology has been detailed. He is aware of the potential risk and, thus, can take an educated decision. Once the documentation has been submitted to and accepted by CEB, the SPPA can be signed within a relatively short period (approximately two weeks), since the agreement process is standardised and hence, devoid of cumbersome negotiation. From the perspective of the buyer, the SPPA has effectively saved CEB from an administrative nightmare involving a large number of IPPs and a multitude of distinct requirements. The SPPA also lays down stringent requirements for the quality of power purchased. This has resulted in the entire SHP industry maintaining satisfactory technical standards, which in turn guarantees the long term stability of the sector. Hence, detrimental decisions that can be taken by IPPs, to employ low cost, poor quality measures with a view to increasing short term profitability, have been effectively curtailed. iii] Viable and Guaranteed Tariff The current tariff calculation methodology based on avoided cost principles is based on the World Bank commissioned study conducted by Robert Vernstrom in 1995. The tariff setting methodology is detailed in Appendix 1 of the SPPA thus:
The tariff is based on the principle of avoided cost of marginal generation. The tariff is equivalent to the average value of units generated by CEB owned plants which are displaced at the margin by renewable resources based electricity generation of less than 10 MW.
24
A key achievement of ESD Project of the World Bank was the successful resolution of the tariff
determination issue between the CEB and the developers, through the SPPA that was developed under
the ESD Project. (The World Bank, Sri Lanka Energy Services Delivery Project, Project Performance
Assessment Report, June 2004, p. 7)
29
S
E
C
T
I
O
N
T
H
R
E
E
Key Drivers of Development

0
20
40
60
80
100
120
140
160
1996 1997 1998 1999 2000 2001 2002 2003 2004 2005
Year
Cu
mu
lati
ve C
ap
acit
y (
MW
)
0.00
1.00
2.00
3.00
4.00
5.00
6.00
Weig
hte
d T
ari
ff (
SL
R)
SPPA Signed Commissioned Weighted Tariff
The published tariff for a given year is a rolling three-year average of the avoided cost estimated for that year and the preceding two years.
There is no capacity charge.
This is a two-part tariff. The rate for the dry season (February to April) is higher than that for the wet season (May to January).
For the duration of the project, the SPPA guarantees a floor price of 90% of the tariff applicable in the year the Agreement was signed.
The rate for delivery of energy output is published by CEB every year, before the first day of December of the previous year.
Rationale for Success The tariff expectation drives the investment decision. Knowledge of the tariff setting methodology and the guaranteed floor price has enabled investors to take a calculated business decision. Interest in the sector and tariff rate changes are positively co-related as evident from the increase in the number of applications, signing of SPPAs and commissioning of projects in those years with favourable tariff rates, as indicated in Charts 3.12 – 3.14.
*Tariff is weighted with 3 months of the dry tariff rate and 9 months of the wet tariff rate.
Source: Energy Purchase Branch, Ceylon Electricity Board, DFCC Consulting (Pvt) Ltd.
S
E
C
T
I
O
N
T
H
R
E
E
30
Chart 3.12 Annual Tariff* versus Capacity
1996-2005
Key Drivers of Development

0
10
20
30
40
50
60
70
80
90
1996 1997 1998 1999 2000 2001 2002 2003 2004 2005
Year
Nu
mb
er
of
Pro
jects
0.00
1.00
2.00
3.00
4.00
5.00
6.00
Weig
hte
d T
ari
ff
SPPA Signed Commissioned Weighted Tariff
0
2
4
6
8
10
12
14
16
18
1993
1994
1995
1996
1997
1998
1999
2000
2001
2002
2003
2004
2005
Year
Nu
mb
er
of
Pro
ject
Ad
dit
ion
s
0
1
2
3
4
5
6
Weig
hte
d T
ari
ff
Number of Projects Weighted Tariff
Annual Tariff* versus Launched Projects
1993-2005
The SHP sector took off only after 2000. For instance, more capacity was added in 2001, than that of the combined total of all projects in the previous 5 years. Taking advantage of favourable tariff rates in 2002, IPPs signed more than twice the number of SPPAs entered into in all the preceding years.
Source: Energy Purchase Branch, Ceylon Electricity Board, DFCC Consulting (Pvt) Ltd.
Similarly, an analysis of 59 projects launched since 1993 revealed a clear growth trend after 2001.
Source: DFCC Consulting (Pvt) Ltd. *Tariff is weighted with 3 months of the dry tariff rate and 9 months of the wet tariff rate.
Chart 3.14
31
S
E
C
T
I
O
N
T
H
R
E
E
Key Drivers of Development
Chart 3.13 Annual Tariff* versus Project Total
1996-2005

iv] Tax and Import Duty Concessions Tax holidays can range from 5 to10 years depending on the scale of the investment. In addition, capital goods are exempt from import duty during the period of construction and implementation. Some capital goods also enjoy a zero value added tax (VAT)25. Rationale for Success Tax and duty concessions for SHP projects enable IPPs to produce and sell electricity at current tariff levels. Elimination of the present concessions will seriously hinder the SHP industry. From the cocktail of tariffs, tax concessions and subsidies offered thus far developers have been able to forecast and earn an adequate return on their investments. v] Project Financing Subsequent to the successful completion of the ESD Project from 1997-2002, the World Bank introduced the RERED Project. Both projects have achieved their targets. “As part of the ESD Project, 31 MW were installed through 15 sub-projects as against a target of implementing 21 MW of grid-connected mini-hydro projects”26. Similarly, the RERED Project was scheduled to finance 85 MW of grid-connected electricity generation capacity addition from renewable energy resources by 2008. As at 30 September 2006, exceeding all expectations the Project had approved 108.49 MW of SHP, 58.63 MW of which were already commissioned. However, only SLR 3.6 billion was disbursed, though credit facilities totaling SLR 4.8 billion have been approved27. The geographic distribution of approved loans is presented in Figure 3.1. The ESD and RERED Projects have established a disciplined legacy of astute risk assessment and management. Each sub-project is closely monitored. Loan officers inspect sites before every disbursement to ascertain if milestones have been successfully met. Independent consultants are also employed to verify compliance. The loan recovery rate is highly commendable.
25
Board of Investment of Sri Lanka, Industry-wise Incentives at a Glance 26
Sri Lanka Energy Services Delivery Project, Second Power Distribution and Transmission Project,
Project Performance Assessment Report, June 2004, p. 5 27
Statistics, www.energyservices.lk
S
E
C
T
I
O
N
T
H
R
E
E
32
Key Drivers of Development

Geographic Distribution of Approved RERED Projects as at 30 September 2006
Source: www.energyservices.lk
The RERED Project provides refinancing to six participating credit institutions (PCIs), namely DFCC Bank, National Development Bank, Hatton National Bank, Sampath Bank, Commercial Bank and Seylan Bank, for on-lending to private sector, small scale, grid-connected renewable energy projects, subject to the terms stated below28:
PCIs receive refinance up to 80% of the total sub-loan amount.
The rate of interest is equal to the six-month weighted average deposit rate (AWDR).
Sub-loans granted by PCIs shall not exceed 10 years, including a maximum two-year grace period.
28
Sri Lanka Energy Managers Association, Seminar on Investment Opportunities in Renewable Energy
in Sri Lanka, February 2003, p. 52
33
S
E
C
T
I
O
N
T
H
R
E
E
Key Drivers of Development
Figure 3.1

ESD and RERED Project Financing versus Commercial Lending
The maturity period shall not exceed the economic life of the asset financed.
The maximum amount of re-financing available per sub-project is USD 8 million.
Sub-loans are granted in Sri Lanka Rupees (SLR) with GoSL bearing the exchange risk.
Other terms are decided at the discretion of the PCIs. The PCIs lend to qualified SHP projects generally on the following terms:
The project is mortgaged to the lenders.
Of the total project cost, only 60%, and at most 70%, is considered for a loan facility.
The interest rate levied is generally five percentage points, or for a select few, four percentage points higher than the six-month AWDR.
The term of the loan rarely exceeds eight years, with the grace period limited to two years.
Loans are often co-financed by two or three PCIs.
A specified portion of the revenue from the sale of tariff is held in escrow until the loan is repaid.
Rationale for Success The SHP industry developed because of the availability of medium to long term financing, via the ESD and RERED Projects. Lower interest rates, higher debt to equity ratios and longer grace and repayment periods matched the requirements of IPPs.
Terms 1997-2002
ESD Finance Commercial Lending
Debt: Equity Ratio 60:40 / 70:30 60:40 / 70:30
Interest Rate Weighted Average Deposit Rate
+ 4% Prime Lending Rate +
2-3%
Grace Period 1-2 Years 1-2 Years
Loan Repayment Period 6 to 8 years 6 to 10 years
Terms 2003 onwards
RERED Finance Commercial Lending
Debt: Equity Ratio 60:40 / 70:30 60:40 / 70:30
Interest Rate Weighted Average Deposit Rate
+ 4-5% Prime Lending Rate +
2-3%
Grace Period 1.5 – 2 Years 1-2 Years
Loan Repayment Period Maximum of 8-9 years 6 to 10 years Source: Participating Credit Institutions, ESD and RERED Projects
S
E
C
T
I
O
N
T
H
R
E
E
34
Key Drivers of Development
Table 3.6

Table 3.7 Financing based on Commercial Banks‟
Weighted Average Deposit Rate (AWDR) versus Prime Lending Rate (PLR)
Interest Rate 2000 2001 2002 2003 2004 2005
AWDR 9.9 10.8 7.5 5.3 5.3 6.2
AWDR + 5% (a) 14.9 15.8 12.5 10.3 10.3 11.2
PLR 21.5 14.3 12.2 9.3 10.2 12.2
PLR + 3% (b) 24.5 17.3 15.3 12.3 13.2 15.2
Differential (b-a) 9.6 1.5 2.8 2.0 2.9 4.0
Source: Central Bank Annual Reports 2004, 2005
At the given tariff levels, with ESD and RERED financing, SHP projects became good investment options. This attractive level of profitability for the private sector cannot be maintained, unless similar medium to long term development finance is made available to the renewable energy industry. Else, for the continued flow of investment for renewable energy projects, IPPs will seek a higher tariff to compensate for more costly financing. vi] Local Technical Expertise The SHP industry is endowed with a skillful pool of local engineers and engineering firms. The industry has access to experienced and disciplined engineers who have honed their skills in the development of large scale hydro power projects in Sri Lanka. Following in their wake, another generation of business savvy engineers is now gaining recognition both locally and internationally. Rationale for Success Investor confidence in local engineering skills has paid off well. Local engineers have ingeniously adapted imported technology and know-how to suit indigenous conditions. As a result of their efforts, the cost of development in Sri Lanka is 20-30% lower than internationally accepted benchmarks29. As evident from the foregoing Analysis of Investment, their technical prowess has evolved over the years and enabled them to resourcefully counter the ever- increasing input costs. Consequently, local expertise is now sought after internationally and two Sri Lankan engineering firms are already established in African countries.
29
Interview with Dr. Nishantha Nanayakkara, President, Grid Connected Small Power Developers
Association
35
S
E
C
T
I
O
N
T
H
R
E
E
Key Drivers of Development

The practice of capitalizing the services rendered by engineers has also acted as a compelling incentive to ensure a low cost, high quality outcome in the long term. The relationship between investors and contractors are thus fortified. Moreover, the benefit to the SHP industry is amplified by empowered engineers being pre-disposed to channel lucrative earnings from share ownership towards further project development30.
30
Interview with Mr. Sunil De Silva, Former Development Banker, DFCC Bank
S
E
C
T
I
O
N
T
H
R
E
E
36
Key Drivers of Development

2.3
Many industry experts claim that the remaining 300 MW or more of SHP projects are only marginally viable and the growth of the SHP industry is set to diminish in the coming years. On the other hand, 300 MW of indigenous renewable energy represent significant savings to the country, the consumer and CEB, given that the generation tariff remains relatively cheap. Many IPPs are of the optimistic view that the full optimal SHP potential can be achieved in the next five years. However, such a target can be met only if the key issues reviewed next are resolved without delay. i] Sustainable Tariff Methodology The calculation of the avoided cost based tariff continues to be a contentious issue between CEB and IPPs. The CEB contends that the published tariff is more than adequate to develop profitable SHP projects. However, for the past several years, the GCSPDA has continuously disputed the CEB‟s tariff calculation and calls for a tariff structure that is equitable and transparent, and therefore sustainable.
Various steps have been taken over the years to resolve this dispute:
In March 2000, the Capacity Credit Committee comprising representatives of CEB, GCSPDA and the Board of Infrastructure Investment concluded a study on providing a capacity credit in addition to an energy credit.
In June 2001, Dr. Tilak Siyambalapitiya completed a study for CEB on the existing method of tariff computation, recommending two alternative revisions.
SPPAs signed in 2002, carry an addendum assuring a bonus of 15% on the annual published tariff.
Since the published tariff for 2004 was in dispute, the 2003 rate was paid to IPPs in November and December of 2004.
A budget decision was taken to fix the tariff at the SLR equivalent of United States Dollars (USD) 0.06 per unit of SHP in 2005. The Treasury was instructed to bridge the difference over and above the avoided cost based tariff published by CEB.
Progressive Action
None of the above measures had any significant impact on the issue. Therefore, with a view to a conclusive resolution of this long drawn out debate, the Ministry of Power and Energy, with the assistance of the RERED Project, requested The Energy and Resources Institute (TERI) of India to review the tariff setting
37
S
E
C
T
I
O
N
T
H
R
E
E
Critical Success Factors

for grid-connected small power producers. This study is currently in progress and favours “technology specific cost based two tier tariffs”31. The recommendations are:
A cost based approach in two tiers – first tier for six years corresponding to the debt repayment period and the second tier for the period thereafter till the fifteenth year.
Tariff decisions, taken by PUCSL with stakeholder input, will be subject to review every three years.
After the fifteenth year, projects continuing to operate will be charged a royalty.
The difference between the actual avoided cost to CEB and the decided tariff will be borne by or reimbursed to GoSL. The avoided cost will be estimated jointly by PUCSL and CEB.
See Annexure for a comparison between the existing avoided cost and proposed cost plus approach. ii] Creative Project Financing Options The ESD Project and thereafter the RERED Project have been the main sources of medium to long term project finance for the SHP industry. These Projects addressed a market failure – lack of access to project financing with longer tenures. In September 2005, the RERED project declined new applications for debt finance since the allocation for grid-connected renewable energy projects were exhausted. However, only 75% of the allocated funds has been disbursed as at 30 September 2006. Because of limited RERED funds and high sector exposure, PCI lending has been curtailed and/or become selective32. Increasingly, IPPs lacking a successful SHP development experience or reliable business track record will face difficulty raising debt finance, despite the soundness of their project proposals. Additionally, in the absence of a suitable alternative to the RERED Project, PCIs will be prone to providing debt finance on commercial lending terms, which may adversely impact the financial viability of a large number of SHP proposals.
31
The Energy and Resources Institute, Draft Report on Deliverable 6: “Review of tariff setting
methodologies for grid-connected small power producers”, April 2006, p. 23 32
The Central Bank of Sri Lanka recommends a sector exposure limit of 10-15%. The exposure to the
energy sector is well below 10% of the loan portfolio for all PCIs. The limits for the renewable energy
sector imposed by the management from time to time are subjective.
S
E
C
T
I
O
N
T
H
R
E
E
38
Critical Success Factors

Progressive Action Due to limited availability of RERED Project funds, any delays in disbursements exceeding one year may now be liable for cancellation and these reserves will be released to finance other projects in the pipeline. Furthermore, the World Bank is considering an additional allocation of USD 40 Million to ease the financing difficulties faced by the SHP industry. This quantum will finance another 65-70 MW of SHP projects. To create a more competitive lending environment to benefit IPPs, the participation of financially sound public sector financing institutions in the RERED Project has also been recommended.
To address the shortage of development finance in Sri Lanka, GoSL has agreed in principle to guarantee a debenture issue to raise the required capital to establish a revolving fund for SHP and other renewable energy industries33. This proposal, drafted by the Administrative Unit of the RERED Project, is a pioneering effort to attract private investments under a sovereign guarantee for national infrastructure development programs. The revolving fund will be administered by the proposed SEA.
There exists a high demand for project financing, with medium to long-term tenures, in Sri Lanka. However, no effective measures have been taken to establish such a culture despite the long-felt need. The impact of this deficiency is far-reaching in a country that requires a dynamic development agenda. In terms of the NRE sector, the failure of the RERED Project to initiate/create a project financing mechanism to sustain the development that has been successfully achieved is cause for concern.
iii] Enhanced Planning, Absorption and Evacuation There are three main technical limitations impeding the development of NRE technologies, including SHP. They are: a] Planning Limitation The contribution from NRE technologies is ignored in generation planning. CEB states that generation from wind power and existing run-of-the-river SHP cannot be scheduled and dendro power, though conceptually dispatchable, is still in an experimental stage in Sri Lanka. SHP plants are must-run facilities. However, under the present SPPA, IPPs do not guarantee a minimum delivery amount. In light of these circumstances, CEB does not consider it prudent to include
33
Interview with Mr. Jayantha Nagendran, Administrative Unit, RERED Project
39
S
E
C
T
I
O
N
T
H
R
E
E
Critical Success Factors

renewable energy technologies as serious supply options in generation planning34. This effectively undermines the efficacy of NREs. Progressive Action The ELECTRIC module of Energy and Power Evaluation Program, previously known as the Wien Automatic System Planning Package (WASP IV), is used to determine the optimal generation expansion plan35. “The WASP IV generation planning model has limitations on the number of options per year, hence it does not allow the analysis of small generating units. Also it cannot incorporate generating options like wind plants which cannot be centrally dispatched. Hence use of other generation planning models having adequate scope for all types of generating options would be more appropriate for generation planning.” Thus concludes the Energy Forum (Guarantee) Limited in a recent study on “Incorporating Social and Environmental Concerns in Long Term Electricity Generation Expansion Planning in Sri Lanka” (33). The study also elaborates the importance of decentralized generation, because it avoids network losses and network investments costs. CEB and some industry experts beg to differ. However, this exercise, if positively viewed, can initiate the basis for a constructive discussion among stakeholders to determine the means to evaluate all available energy sources in a level playing field. NRE is an option that cannot be ignored by a system heavily burdened by rising oil prices. The time is ripe for MoPE, with the assistance of PUCSL, to collate different perspectives in a participatory approach to achieve optimal generation expansion planning in Sri Lanka. b] Absorption Limitation System stability is a primary concern for CEB. As such, CEB limits embedded generation to 15% of the average demand and 6% of peak demand. This position is supported by the Master Plan Study on the Development of Power Generation and Transmission System in Sri Lanka completed by CEB and Japan International Cooperation Agency in 2006. According to this study, during the day, the current system permits only 20 MW under (n-1) conditions and 100 MW under normal conditions and that too with generation control from dispatch centre. Part 1 of the Guide
34
Interview with Mr. Gemunu Abeysekera, Deputy General Manager, Transmission and Generation
Planning Branch, Ceylon Electricity Board 35
Ceylon Electricity Board, Long Term Generation and Expansion Plan 2006-2020, p. 6-2
S
E
C
T
I
O
N
T
H
R
E
E
40
Critical Success Factors

for Grid Interconnection of Embedded Generators states that the requirement for some central control will be reviewed when the total embedded generation capacity exceeds 10% of the total minimal grid load36. CEB maintains that embedded generation results in ancillary costs that occur because output is uncertain and volatile. There is no central control or dispatch of embedded generators, used in SHP and wind power plants. Generation plant power output is controlled by the operator and connection availability. The plant will usually be run at the maximum power available from the power source37. CEB estimates the peak demand for 2007 as 2019 MW38, 6% of which is equivalent to 121 MW of embedded generation. It is very likely that this limit will be breached by SHP projects in 2007. Meanwhile, 10% of a typical minimum load for the system, which is 600 MW, has already been exceeded. GCSPDA questions these limits and has appealed to GoSL to commission detailed studies to ascertain the current technical limitations and the appropriate solutions. Progressive Action As a response to GCSPDA concerns, the RERED Project requested Siemens Power Technologies International of United Kingdom (Siemens) to conduct a preliminary “Technical Assessment of Sri Lanka‟s Renewable Resource Based Electricity Generation”. According to this report, “studies suggest 140 MW of embedded generation connected at the 33kV voltage level, operating during normal peak load conditions is the limiting value of generation absorption allowable on the 2004 CEB network” (8:46). The absorption capacity would increase to 330 MW in 2008, 640 MW in 2012 and 690 MW in 2013, given that current network development plans are implemented (II).
The Siemens‟ Report strongly advises more detailed investigation on system limitations and recommends the upgrade of software and increase in the number of trained engineers in the transmission planning department at CEB (8:45-47). CEB has requested the RERED Project for financial assistance for resource improvements in the Transmission Planning
Department39. The RERED Project also awaits a proposal from CEB for a study on the impact of embedded generation on the
36
Ceylon Electricity Board, Guide for Grid Interconnection of Embedded Generators, Part 1:
Application, Evaluation and Interconnection Procedure, December 2000 37
Siemens Power Technologies International, Technical Assessment of Sri Lanka’s Renewable
Resource Based Electricity Generation, Overview of Technical Requirements, Connection and
Management of Embedded Generation, March 2005, V 38
Ceylon Electricity Board, LongTerm Generation Expansion Plan 2006-2020, Base Load Forecast –
2005, p. E-2 39
The World Bank, RERED Project, Implementation Review Mission Aide-Mémoire, April 2006, p. 3
41
S
E
C
T
I
O
N
T
H
R
E
E
Critical Success Factors

reverse flow of power through grid sub-stations, short circuit levels and n-1 reliability criteria. Additionally, with the assistance of the United States Agency for International Development (USAID) and in collaboration with Bonneville Power Company of the United States of America (USA), CEB is currently conducting a comprehensive analysis of the absorption capacity of Sri Lanka‟s power system. C] Evacuation Limitations A large number of projects in the pipeline are faced with grid sub-station capacity constraints, which has become a major reason for CEB to refrain from issuing additional LoIs for site applications. According to CEB‟s Annual Report for 2005, „all the grid sub-stations which are close to potential mini hydro power sites have exceeded allowable dispatch limit and hence new proposals are not entertained for connection to these grid sub-stations‟. As at 30 June 2006, Energy Purchase Branch of CEB had in hand 808 applications for grid-connected, small-scale NRE projects pending approval. 18.4 MW of capacity enhancements for existing projects has also been stalled, due to this reason. This is the most serious technical limitation faced by the SHP industry. Each grid-sub station has an absorption capacity of 25 MW. CEB claims that seven grid sub-stations in SHP resource potential areas will be in violation of the n-1 condition, if additional transformers are not installed in the near future. GCSPDA asserts that over 130 MW are in the pipeline for connection to Nuwara Eliya, Badulla, Wimalasurendra, Balangoda, Ratnapura and Seethawaka grid sub-stations, all of which require augmentation in the said order of priority, if the absorption capacity limit of 25 MW were to be maintained.
Table 3.8 Grid Sub-Station Capacity Augmentation
Location No. of 31.5 MVA Transformers
Ratnapura 1
Balangoda 2
Wimalasurendra 2
Badulla 1
Nuwara Eliya 1
Seethawaka 1
Deniyaya 1
Total 9 Source: The World Bank Implementation Review Mission,
April 2006
S
E
C
T
I
O
N
T
H
R
E
E
42
Critical Success Factors

In recent years, CEB‟s standard LoI issued to developers of SHP projects stipulates that the developer may have to build or bear the cost of some or all of the facilities required for the interconnection on the CEB side of the Point of Supply. Though the SPPA clearly states that the IPP is responsible for facilities required to supply the energy output only up to the interconnection point, the LoI terms have made provisions for CEB to request developers to construct or bear the cost of all or some facilities beyond this point. In recent years, CEB‟s standard LoI issued to developers of SHP projects stipulates that the developer may have to build or bear the cost of some or all of the facilities required for the interconnection on the CEB side of the Point of Supply. Though the SPPA clearly states that the IPP is responsible for facilities required to supply the energy output only up to the interconnection point, the LoI terms have made provisions for CEB to request developers to construct or bear the cost of all or some facilities beyond this point. CEB is unable to evacuate power from a significant number of SHP projects with the existing network. These projects cannot be commissioned without the additional investment for line augmentation beyond the point of supply. Thus, IPPs are therefore compelled to carry this added burden, especially if construction has already commenced. Previously profitable project forecasts are then rendered commercially unviable, with no recourse available to IPPs. The merits of a deep versus shallow connection charge is debatable. Developers may prefer the lower initial cost resulting from a shallow connection charge. If, however, a deep connection charge is levied, then the obligations of CEB to supply evacuation facilities quickly and reliably can be strengthened. Financial penalties are reasonable to compensate CEB‟s failure to evacuate power. Furthermore, the benefits of distributed generation too can be factored into connection agreements depending on the quality of CEB‟s capital expenditure planning systems. Progressive Action To resolve the grid sub-station capacity limitation, MoPE has obtained approval from the cabinet to equally share the cost of development with IPPs who will benefit from capacity augmentation. Development will be carried out in stages and three sub-stations will be targeted initially. However, the decision on priority locations for development requires further
43
S
E
C
T
I
O
N
T
H
R
E
E
Critical Success Factors

deliberation. The Rural Electrification and Network Expansion Project completed by Dr. Tilak Siyambalapitiya this year for the Asian Development Bank will prove a valuable guide for this purpose. According to GCSPDA, CEB estimates the development cost of the Badulla sub-station at SLR 348 Million and the Wimalasurendra sub-station at SLR 388 Million. The upgrade of these two sub-stations can be completed in approximately 2.5 years. Accordingly, LoIs are now being charged SLR 7 to 8 Million per MW, as a deposit against the cost of grid sub-station augmentation. Conversely, GCSPDA maintains that the installation of a single 31.5 MVA transformer can be completed in one year at an approximate cost of SLR 150 Million. Regrettably, as yet, no action has been taken to strengthen the transmission and distribution line networks to evacuate generation from SHP projects. GCSPDA has requested GoSL to seek donor assistance to develop supporting infrastructure as a measure to promote environmentally-friendly energy generation in Sri Lanka. iv] Streamlined Approval Process Almost all projects require an extension of the LoI once or twice (maximum period permitted by CEB), because of bureaucratic delays in obtaining the approvals required to qualify. According to CEB, 17 SHP LoIs have become invalid mainly due to difficulties in obtaining approval, as at 30 September 2006. Likewise, several SPPAs too have been cancelled. These delays are primarily due to difficulties in securing private and crown land. All in all the average gestation period for a SHP project is 5 years. (See „Analysis of the Project Life Cycle‟ in this section for a detailed performance review of SHP projects.) There are no firm guidelines or national mandate for granting approvals to SHP projects and thus the approval process is arbitrary and can be subject to abuse for private gain by both officials and
developers. The many bureaucratic layers have evolved into
an incoherent web of regulations imposed by various
institutions that at times override and conflict with one
another. Progressive Action MoPE has taken a vital step to ensure the progress of the NRE industry by formulating the SEA, after considering the views of all stakeholders. The SEA Bill is scheduled to be
S
E
C
T
I
O
N
T
H
R
E
E
44
Critical Success Factors

presented in parliament before the end of the year. SEA is empowered to act as the implementing agency to achieve national NRE targets and will be the key institution mandated to address the deficiencies in the approval process. Nevertheless, the level of priority accorded by GoSL and MoPE to the development of the NRE sector will have a direct bearing on the effectiveness of the SEA. For further information on SEA, see Section 1.1. Among the numerous suggestions from IPPs to improve the content and practice of approvals, the recommended changes to the SPPA are worthy of mention. The SPPA has room to evolve in terms of the following inadequacies, subject to careful study:
The SPPA must be technology specific to address the particular requirements of each industry. The current format provides a good starting point.
The bankruptcy, dissolution or liquidation of the buyer cannot be grounds for termination of the SPPA. Nationalisation, expropriation, or confiscation of the assets or authority of CEB by any authority of the GoSL cannot be considered a force majeure event. Though the SPPA does not have a sovereign guarantee, inability to honour the agreement due to state action is cause for concern.
The SPPA must address the consequences of restructuring or reorganization of CEB.
The SPPA must be protected from a change-in-law situation.
The mediation of a regulatory authority and/or facilitator should be considered to enforce the rights and obligations of the developer.
Issues with the tariff calculation methodology and its implementation should be resolved.
The justification for extending the contract period should be reviewed.
The SPPA must reflect the many policy changes that are in the offing. An inclusive process accommodating key stakeholder input is always prudent to ensure that the intent and purpose of the SPPA remains unsullied and its effectiveness remains intact. As evident from the above suggestions, the granting of approvals must evolve with time. The current public administrative system has seen little change since the colonial era. Streamlining approval procedures will not only benefit the NRE industry, but may also result in improving the overall performance of the respective agencies. The numerous beauracratic layers can be rationalized and made efficient through the intervention of the SEA with the required mandate and commitment of GoSL.
45
S
E
C
T
I
O
N
T
H
R
E
E
Critical Success Factors

v] Renewable Energy Strategy and Targets Implementation of the above four initiatives calls for a clear plan and a strong commitment. Justified by a comprehensive cost-benefit analysis, GoSL must have a long term vision to promote NRE and release the country from its heavy dependence on imported fossil based thermal energy sources. Progressive Action A draft national energy policy has been finalized. (See Section 2 for further details.) Its complement, a national renewable energy policy is currently being drafted. To be effective, these policies must establish specific targets that are dynamic, yet achievable. Dedicated institutions must be necessarily be held accountable for the timely and full implementation of these targets.
The five critical success factors that determine the future of the SHP industry have equal import for the development of wind and bio-power, which are now poised for growth40. The advantage for policy makers is that these derivatives of a mature industry, now known, can be planned for in advance for the emerging technologies to ensure their rapid progress. These shared issues detailed above will be alluded to in subsequent sections.
40
Absorption limitations are unique to embedded generation and hence, may not be applicable to bio-
power which can be scheduled.
Common Concerns
S
E
C
T
I
O
N
T
H
R
E
E
46
Critical Success Factors

Section Four
Exploiting Sri Lanka’s Wind Power Potential

According to CEB, “studies have revealed that wind is the most promising option of the available renewable energy resources, for grid connected power generation in Sri Lanka”41. Confirming this statement, the Wind Energy Resource Atlas (WER Atlas) of Sri Lanka established nearly 5,000 sq km with good-to-excellent wind resource potential. About 4,100 sq km of this area is land and the balance 700 sq km is lagoon. As indicated in Figure 4.1, these areas are largely concentrated in two regions: a] the northwestern coast from the Kalpitiya Peninsula north to Mannar Island and the Jaffna Peninsula and b] the central highlands, mainly the Central Province and parts of Sabaragamuwa and Uva Province. Other noteworthy regions include the southern part of the North Central Province and south eastern coastal belt of the Southern Province. Using a conservative assumption of 5 MW per sq km, WER Atlas supports a potential of 24,000 MW of installed capacity, bearing wind speeds of in excess of 7 m/s at 50 meter height above ground level, with wind power densities in excess of 400 W/m2. The resource area for good to excellent wind potential covers 6% of the total land area of Sri Lanka. If moderate wind areas too are considered, 15% of Sri Lanka can yield over 50,000 MW of installed capacity42.
41
Ceylon Electricity Board, Long Term Generation Expansion Plan 2006-2020, p.5-2 42
National Renewable Energy Laboratory, Sri Lanka Wind Farm Analysis and Site Selection
Assistance, August 2003, p. 4
47
S
E
C
T
I
O
N
F
O
U
R
Exploiting Sri Lanka’s Wind Power Potential

Figure 4.1
Wind Energy Resource Atlas of Sri Lanka
48
S
E
C
T
I
O
N
F
O
U
R
From 1988 to 1992, the Pre-Electrification Unit of the CEB carried out a resource assessment study of wind power potential in the southern lowlands that included nine 20 m meteorological towers. This study identified a potential of 200 MW in the south eastern regions of the island. This potential was established at 8 MW per sq km. In March 1999, with the assistance of ESD Project, a 3 MW pilot plant was commissioned by CEB in Hambantota and is currently in operation. From 2000 to 2005, the plant factor averaged at 11%. Encouraged by the outcome of the pilot project, the CEB conducted a second resource assessment on the west coast in the Puttalam area and in the central regions of Sri Lanka from 1999 to 200243. In February 2002, the CEB called for proposals from the private sector to develop a 20 MW wind plant each in Puttalam and Hambantota on a build, own and operate basis. Only one qualified applicant submitted a proposal for a plant in the Kalpitiya Peninsula. Other 13 prospective IPPs who submitted Expressions of Interest to CEB claimed that the bidding process was restrictive, in terms of conditions for qualifying and the proposed tariff calculation methodology44.
The National Renewable Energy Laboratory, in partnership with USAID, published a report on “Sri Lanka Wind Farm Analysis and Site Selection Assistance” in 2003. NREL‟s meso scale WER Atlas is qualified with a site screening process carried out by Global Energy Concepts LLC that focused on the central, western and southern regions of the country. The northern and eastern areas have been excluded from this study because of the prevailing civil conflict.
43
Ceylon Electricity Board, Long Term Generation Expansion Plan 2006-2020, p.5-2 44
National Renewable Energy Laboratory, Sri Lanka Wind Farm Analysis and Site Selection
Assistance, August 2003, p. 4
49
S
E
C
T
I
O
N
F
O
U
R
Resource Development Initiatives

Thereafter, CEB sought to develop a 30 MW wind farm in the Kalpitiya Peninsula with foreign funding assistance, which did not materialize. Recently, a decision has been taken by MoPE to issue 5 LoIs, 4 for a plant of less than 10 MW each and the other for 50 MW, to be sited in the same area. The SPPAs for these projects are now being prepared. An installed capacity of approximately 83.8 MW of wind power has been finalized, thus45. The ECF is in the process of establishing a national reference station (NRS) network islandwide for long-term wind data collection. Two NRS masts will be erected this year. ECF intends these data to assist developers to forecast plant performance with greater accuracy46.
45
Ceylon Electricity Board, Energy Purchase Branch 46
Interview with Mr. Harsha Fernando, General Manager, Energy Conservation Fund
Resource Development Initiatives
50
S
E
C
T
I
O
N
F
O
U
R

Though the estimated potential is significant, the successful development of wind power rests on a few key factors, some of which are concerns common to all grid-connected, small scale renewable energy generation. These common issues are addressed in detail in Section 3: Critical Success Factors and emphasize the need for a national renewable energy strategy, technology specific sustainable tariff methodology, enhanced planning, absorption and evacuation by the utility, creative financing options and a streamlined approval process.
Issues Specific to Wind Power The factors that influence the development of a wind power project in Sri Lanka as specified in the Sri Lanka Wind Farm Analysis and Site Selection Assistance Report are (5-14): 1] Site Selection Constraints a] Land Availability The estimated potential of 24,000 MW of good-to-excellent wind resources is limited by the availability of land. Areas that must be excluded are:
National parks, wildlife sanctuaries or other reservations
Migrations routes of birds and habitats of rare or endangered bird species
Urban areas with aviation and telecommunication infrastructure
Security zones
Culturally sensitive sites
b] Natural Terrain Conditions The orientation of the terrain relative to wind direction is a prime factor in site selection. Wind turbines are generally sited perpendicular to wind direction. When the wind blows consistently from one direction, perpendicular ridgelines are preferred and relatively, mast-to-mast spacing is less and row-to-row spacing is more to maximize the number of turbines used. When multiple directions are involved, the mast-to-mast and row-to-row spacings are similar.
51
S
E
C
T
I
O
N
F
O
U
R
Key Market Drivers
Generally, the most cost-effective designs have turbine foundations that run 10-15 metres deep. Excavation or grading must be possible. Also, complex terrain features can lead to sub-optimal turbine siting. Vegetation over 10 metres in height may cause turbulence and increase risk of damage to turbines. Adversely, clearing vegetation may harm the environment and increase project cost. c] Electricity Evacuation Capacity Sri Lanka Wind Farm Analysis and Site Selection Assistance Report reveals that in many areas, grid sub-station and transmission line capacity constraints limit electricity evacuation. For instance, at the time the study was completed in August 2003, only about 20 MW of additional capacity was available at sub-stations on the west coast and the southern region, while 30-50 MW could have been accommodated by sub-stations in the central hills. Even if grid interconnection is possible, transmission lines may have insufficient carrying capacity. New conductors can be used to upgrade existing capacity or alternative paths can be used to create space on the lines. Stability at the grid-interconnection point is another concern, which may have a considerable impact on plant performance if subject to frequent outages or voltage/frequency excursions.
Cost of interconnection and transmission particular to the plant must be factored into the project cost to ascertain commercial viability. If projects are concentrated, infrastructure costs can be shared by the developers and even the utility, as in the case of four 10 MW plants to be developed side by side on the Kalpitiya Peninsula. Ideally, detailed studies must “identify the most cost-effective plan for wind power development that balances system upgrade costs with utilizing sites with the highest wind resource potential.”
Key Market Drivers
52
S
E
C
T
I
O
N
F
O
U
R

d] Logistics Transportation of turbines and construction cranes will depend on weight and dimension limitations of roads. Coastal areas may escape these restrictions, with the additional advantage of access by sea. However, roads in Sri Lanka‟s central regions are less developed than those on the coast and tend to have many tight-radius turns and low-capacity culverts. Turbines of only 600 kW or less can be transported inland under current conditions. “Although construction logistics present some challenges and may limit turbine size, they do not preclude development of utility-scale wind energy project”.
5] Long Term Data Collection Wind patterns of identified areas for development must be monitored over a period of time. This data is vital for forecasting a plant‟s performance. Wind patterns in Sri Lanka are governed by the monsoons. The southwest monsoon is stronger and penetrates farther inland than the northeast monsoon. The ECF is planning to establish a NRS network covering strategic locations. The results of this exercise, combined with the WER Atlas, will prove invaluable to investors. 6] Absorption of Embedded Generation The CEB‟s primary issue with the development of wind power is ensuring system stability. In the absence of the necessary tools and training to determine the impact of wind power on the system, the CEB has little choice but to adopt a conservative approach. As such, in 2003, CEB‟s estimate of additional wind power capacity was limited to 7% of peak load, or approximately 100 MW (4).
This Report also recommends a detailed analysis to establish permissible wind power capacity, given system stability and power quality requirements at each candidate site and of the system as a
53
S
E
C
T
I
O
N
F
O
U
R
Key Market Drivers

whole. With USAID assistance, CEB is currently conducting this study, in collaboration with Bonneville Power Company, USA47. 7] Construction Capability Though Sri Lanka has adequate know-how in turnkey development of large scale infrastructure projects, utility-scale wind power experience is non-existent. Additional expertise and equipment are easily available in India, on of the largest wind power developers in the world. In 2003, the capital cost of a 20 MW project with 600 kW wind turbines ranges between USD 1,195 and 1,325 per kW. Plant factors can vary from 26% to 34%. In comparison, at large commercial wind farms in USA, 1 MW or larger turbines were being installed at USD 900 - 1,000 per kW48. Since then, capital costs and turbine performance have improved significantly49. Increase in project size and the appropriate selection of farm sites will reduce costs even further.
47
A similar study of the New York Power System established that at least 10% of the total generation
can be reliably supplied by wind power with only minor adjustments to system planning, operation and
reliability practices. 48
National Renewable Energy Laboratory, Sri Lanka Wind Farm Analysis and Site Selection
Assistance, August 2003, p. 32 49
The American Wind Energy Association states that the cost of electricity from utility scale wind
turbines has dropped by more than 80% over the last 20 years. Costs continue to decline as more and
larger plants are built and advanced technology is introduced.
Key Market Drivers
54
S
E
C
T
I
O
N
F
O
U
R
Resource Optimization Strategy
For the optimal exploitation of Sri Lanka‟s wind power potential, the initiatives required are:
With reference to empirical expert knowledge acquired from overseas operations, combined with a sound assessment of the local environment, forecast the quantum of wind energy that can be practically absorbed by the power system.
Conduct an economic analysis to assess the efficacy of electricity generation from wind power and to justify the implementation of national wind power generation targets.
Formulate and implement a medium to long term action plan for the development of wind power.
Supply adequate tools and training to CEB to manage system stability and power quality.
Establish a suitable tariff rate, which ensures economic viability for the country and commercial viability for the utility and the developer.
This tariff rate necessarily considers the cost of grid augmentation required to evacuate electricity.
Offer tax concessions and subsidies to developers with the objective of reducing the tariff burden on the electricity consumer.
Provide additional support for site screening and data collection to facilitate investment.
55
S
E
C
T
I
O
N
F
O
U
R
Key Market Drivers

Section Five
The Future of Bio-Power in Sri Lanka

This study identifies biomass as renewable organic plant and animal matter that can generate energy in the form of electricity and heat. Biomass that can be used for energy purposes include fast-growing trees and crops, leftover materials and residues from wood based industries, agriculture residues, agro-industrial by-products, animal manures and municipal solid waste. Evidently, the most economical forms of biomass for generating bio-power are residues. Generating energy from residues can recoup the energy value in the material and avoid the environmental and monetary costs of disposal or open burning. Residues are the organic by-products of food, fiber, and forest production such as sawdust, rice husks, wheat straw, corn stalks, and bagasse50 (the residue of sugar cane after juice extraction). As such, in Sri Lanka an immediate potential can be identified with wood-based industries, (e.g.: in Moratuwa) and the cultivation of paddy (e.g.: in Anuradhapura, Ampara and Kurunegala) and sugar-cane plantations (e.g.: in Pelawatte and Sevanagala). Worldwide, the most commonly used biomass fuel is wood and the most economical sources of wood fuel are wood residues. However, in the future, fast-growing energy crops may become the fuel of choice for bio-power. Of about 15 tree species tested and identified as suitable tree crops, Gliricidia Sepium (Gliricidia) is by far the most versatile51. Gliricidia is a drought resistant plant that can be found in all parts of the country. It is grown as an under-crop in coconut plantations, as shade-growth in tea plantations and a support plant in intercropping such as pepper. Widely used for perimeter fencing, Gliricidia can flourish in marginal and unutilized lands, as well. It has the capacity of absorbing moisture from the atmosphere and nourishing the soil with nitrogeon. This plant requires minimal attention. Its continuous yielding capacity lends itself for large-scale plantation. 1 MW fuel-wood or dendro power plant consumes 30-40 metric tonnes (MT) of raw material per day. 20-30 MT of fuel wood can be harvested per hectare (ha) in a year, so requiring approximately 400 ha, that will yield 10,000 MT per annum, to power a 1 MW plant. To operate a target 100 MW of dendro power plants, Table 5.2 shows that 100,000 ha of land have to be harvested.
50 United States Department of Energy, Biomass Program, www.eere.energy.gov 51
Report of the Inter-Ministerial Working Committee on Dendro Thermal Technology, June 2005, p.
29
56
S
E
C
T
I
O
N
F
I
V
E
The Future of Bio-Power in Sri Lanka

Table 5.1
Targets for Dendro Power
Phases Installed Capacity (MW)
Date of Commencement
Date of Commissioning
1 10 01.07.2005 31.12.2006
11 40 01.01.2007 31.12.2008
111 50 01.01.2009 31.12.2010
Source: Report of the Inter-Ministerial Working Committee on Dendro Thermal Technology June 2005
Table 5.2 Targets for Fuel-Wood Plantation
Phases Developer (20 MT/ha/annum)
Out grower (20 MT/ha/annum)
Home Gardens/Mixed
(5 MT/ha/annum) 1 1,600 1,600 6,800
11 6,400 6,400 27,200
111 8,000 8,000 34,000
Source: Report of the Inter-Ministerial Working Committee on Dendro Thermal Technology June 2005
The Report of the Inter-Ministerial Working Committee on Dendro Thermal Technology prepared in June 2005 recommends a target of installing 100 MW in three phases by 2010, as indicated in Table 5.1. To date, only 1 MW of dendro power has been commissioned. In total, 2.1 MW of bio-power have been connected to the national grid as at 30 June 2006. SPPAs for a further 12.3 MW and a LoI for a 0.95 MW plant have been issued as at that date.
Dendro based bio-power has received serious attention
lately as a result of the efforts of a dynamic group of
stakeholders. This technology holds much appeal in terms
of its employment generation capability in rural areas.
Additionally, the potential for other sources of bio-power,
such as industrial residues, can be large. More attention
must be accorded by SEA to identify and harness such
resources, with the assistance of private sector developers.
57
S
E
C
T
I
O
N
F
I
V
E
The Future of Bio-Power in Sri Lanka

Bio-power has several distinct features.
Bio-power can be generated on demand, and thus can be scheduled as a firm source of energy by a centralized system. The fuel is a product of human labour and resource quality and quantity can be controlled to a great extent. Bio-power differs from run-of-the-river hydro and wind plants, which are directly subject to the vagaries of Mother Nature.
Generating bio-power is a labour intensive operation. Procuring the resource requires a high level of management to ensure a smooth and profitable operation, whereas both SHP and wind power plants, once constructed properly, warrants little supervision as the resource is provided by nature.
The bio-power plant operation can provide a sizeable number of employment opportunities, if the biomass used is not a by-product of another industry and is cultivated specifically to fuel the plant. The Bio-Energy Association of Sri Lanka (BEASL) estimates that a 1 MW plant will provide an adequate livelihood for 1,200 villagers. Hence, such bio-power plants can have a continuous positive impact on the quality of life of the people providing the biomass resource.
In essence, “all biomass is local”, since resources in particular localities can be employed to power local plants, giving rise to distributed generation52. Furthermore, unlike SHP and wind power which have limited areas of resource potential, one or more forms of biomass are relatively freely available across the country.
Bio-power is regarded as carbon dioxide (CO2) neutral. During combustion, CO2 that was absorbed by the plants during growth is simply released back to the atmosphere. If the cycle of growth and harvest is maintained, all CO2 released during combustion will be sequestered. On the other hand, SHP and wind power plants have zero CO2 emissions and are net contributors to the environment.
Because of fewer emissions during combustion, replacing conventional fossil-fuel sources with bio-power will improve air-quality. Fossil fuel reserves are limited, whereas bio-power is a renewable resource.
Biomass, if cultivated for fuel, can carry the added benefits of improving soil quality and preventing soil erosion. Further, when by-products and residues of industries are used for energy generation, problems and costs of disposal disappear, and an additional source of revenue emerges, instead.
Hence, apart from the generation of energy, bio-power has the added advantages of securing rural economic growth, national energy security and environmental benefits for the country.
52
Michigan State University, Biomass Conversion Research Laboratory, Life Cycle Analysis,
www.everythingbiomass.org
58
S
E
C
T
I
O
N
F
I
V
E
Elements of Bio-Power Generation
According to the Energy Efficiency and Renewable Energy Information Centre of the United States Department of Energy, there are four primary classes of biomass power systems:
i] Direct Fired – These are the most commonly used systems. The plant burns biomass fuel in a boiler to produce the steam flow that causes a turbine to rotate and in turn spin the electric generator. Though steam generation is a proven technology, actual plant efficiencies are in the low 20% range for biomass power boilers that typically have a capacity of 20-50 MW. Higher efficiencies exceeding 40% can be achieved, but are costly.
ii] Co-firing – A portion of existing power plants, usually coal, are substituted with bio-energy. Co-firing is cost effective because much of the existing power plant infrastructure can be used without major modifications or loss in efficiency. The bio-mass boiler can be tuned for peak performance to achieve a high efficiency of 33-37%, which is similar to that of a modern coal-fired power plant.
iii] Gasification – Solid biomass is heated and broken down to a flammable gas. Biogas can be filtered and used in combined cycle systems that use both gas and steam turbines to generate electricity. The efficiency of these systems can reach 60%. Also, hydrogen fuel cells that convert hydrogen gas into heat, power and water vapour can be combined with gasification systems in future applications.
iv] Modular Systems – The above technologies are adapted to suit small-scale usage in villages, farms and industries. These systems are useful in remote areas where biomass is abundant, but electricity is scarce.
59
S
E
C
T
I
O
N
F
I
V
E
Types of Bio-Power Technology

In Sri Lanka, combined heat and power (CHP) solutions can be widely used for industrial applications in rubber processing, ceramics, tea drying, food processing, brass melting etc. End-user efficiency can be maximized through such co-generation technologies53. For instance, by using a micro gasifier, both electricity and thermal energy requirements can be met and the present total energy cost of the tea industry can be reduced by an estimated 40% to 50%. Another successful example is Haycarb Limited, an activated carbon manufacturing factory at Badalgama, which burns coconut shells to power a steam boiler and uses the resulting charcoal as raw material for the factory.
53
Report of the Inter-Ministerial Working Committee on Dendro Thermal Technology, June 2005,
p. 21
60
S
E
C
T
I
O
N
F
I
V
E
Types of Bio-Power Technology

The first and only dendro plant in Sri Lanka was commissioned in Walapone on 9 November 2004 by Lanka Transformers Limited (LTL), a subsidiary of CEB. In 2005, the plant contributed 2.2 GWh to the national grid, operating at an efficiency factor of 25%. LTL faced many teething problems, which have now been resolved to a great extent. However, the profitability of this venture has been called into question. Nevertheless, the Walapone operation is a realistic yardstick for future projects.
The three key experiences are54 :
i] Technical problems
Machinery and equipment sourced from India have not
proven reliable. Aside from an unforeseen cost over-run
during procurement beyond the control of the IPP, the plant
was not operational for most of 2005 because of turbine failure.
ii] Fuel-wood supply bottlenecks
LTL contracted with Ceylon Tobacco Company Limited (CTC) to obtain a steady supply of fuel-wood for the plant. This agency mobilized 150 families in 3 adjacent villages to grow Gliricidia as fuel-wood. The supply, however, has not been adequate. LTL now pays SLR 3 per kg (SLR 1 more than the initial contract price), so enabling CTC to secure the required quantity from farther a field. Approximately 4 kg of Gliricidia are required to generate 1 kWh of dendro power. (Moisture accounts for about 20% of Gliricidia‟s weight.) This means that LTL spends SLR 12 per kWh for fuel alone. Given the current tariff of SLR 8.50 per kWh, the cost of fuel-wood renders the project commercially unviable.
54
Interview with Mr. Ravindra Pitigallage, Lanka Transformers Limited
61
S
E
C
T
I
O
N
F
I
V
E
Lessons from Walapone
Thus, proven technology that can be modified to suit the
local environment must be employed.
Thus, the cost and reliability of the fuel-wood supply
must be ensured at the outset.

iii] Grid failure
The plant is connected to a highly unstable grid via a long
transmission line. Evacuation of generation is only available
for an insupportable 50% of the operational time, because of
grid failure. Once the boilers are shut down, it takes 4 hours to
recommence operations. Furthermore, combustion of fuel-
wood cannot be stopped instantaneously, which means that the
quantity fed to the boiler is consumed even if electricity is
generated or not.
62
S
E
C
T
I
O
N
F
I
V
E
Lessons from Walapone
Thus, a dendro power plant requires a consistent generation
evacuation system.

In August 2004, the cabinet decided on a series of proposals to promote electricity generation from bio-mass through dendro thermal technology. Key decisions are summarized below55:
The cabinet decision recommends special emphasis on facilitating financing mechanisms, development incentives and land allocation procedures for bio-power in the national renewable energy strategy.
This technology is promoted as the third source of firm power in Sri Lanka. To mobilize large-scale fuel wood farming, fuel wood plantations will be elevated to the level of other commercial crops.
To support the development of NRE, the Sri Lanka Energy Fund (SLEF) has been created to bridge tariff differences, promote off-grid projects and finance institutional expenditure, research and development activities and initial farming enterprises.
A two-tier tariff comprising SLR 8.50 per kWh for the first 7 years, followed by a uniform tariff of SLR 7.00 per kWh thereafter was approved. The difference over and above the avoided cost based power purchase tariff published by CEB will be borne by SLEF. A capacity charge for plants of 5 MW or more will be offered in the future.
A new SPPA specific to bio-power will also be established at the completion of the first 50 MW.
Many of these decisions address issues that are common to all NRE technologies. Section 3: Critical Success Factors describes in detail the recent developments pertaining to five key factors that impact the progress of the bio-power industry and other sectors.
55
Information provided by the Bio-Energy Association of Sri Lanka
63
S
E
C
T
I
O
N
F
I
V
E
Rapid Deployment of Bio-Power

The Report of the Inter-Ministerial Working Committee on Dendro Thermal Technology identifies 16 measures to overcome issues and promote the rapid deployment of the technology. Those specific to bio-power as recommended in the said Report and by other stakeholders are: I Research and Development
There are two aspects that require attention.
a] Technology: The development of technology for bio-power has been relatively slow after World War II, because of readily available oil resources56. Technology differs with the type, quantity and quality of bio-mass available in Sri Lanka. Continuous research is required to secure economical and efficient solutions.
b] Fuel-wood farming: This is a complex subject that involves identifying region-wise:
Various species that make good fuel-wood (i.e. some regional plant varieties are superior to Gliricidia which has a high water content, claims a few potential developers);
Farming methods that are sustainable and profitable (i.e. integrated with other farming practices – Gliricidia leaves make ideal fodder for goats and sheep);
Preparation of raw material for efficient combustion (i.e. machine developed by the University of Moratuwa to peel off cinnamon bark can also be used to rid Gliricidia of the moisture-high outer layers, according to ECF57);
Cost-effective logistics;
Resourceful storage procedures and waste reduction methods and
Techniques for management and administration of energy based farms and plantations
This necessitates the involvement of a variety of agencies such as the Coconut Cultivation Board, the Department of Export Agriculture, the Department of Animal Production and Health etc., who can benefit by introducing fuel-wood cultivation to farmers as a supplementary source of revenue.
56
Report of the Inter-Ministerial Working Committee on Dendro Thermal Technology, 2005, p. 55 57
Interview with Mr. Harsha Fernando, General Manager, Energy Conservation Fund
64
S
E
C
T
I
O
N
F
I
V
E
Rapid Deployment of Bio-Power
Issues Specific to Bio-Power

The Alternative Energy Division of the Ministry of Science and Technology has tested fuel-wood farming in different parts of the country to a limited degree. The Coconut Research Institute too has carried out large-scale planting in their trail farms. Similarly, under a common program, existing research institutions in agriculture, horticulture, livestock development etc. can explore best practices to introduce a sustainable farming culture for bio-energy generation in Sri Lanka.
A fund has been proposed for research and development. Potential sources of finances are the GoSL, specific programs funded by GoSL such as rural development and poverty alleviation schemes, and international donors such as the Global Environment Facility. II Resource Assessment Irrespective of present ownership patterns, the cultivation of dendro can be organized as58:
i] Large-scale dedicated plantations; ii] Large and medium scale under-crop plantations; iii] Medium scale village plantations with different
agronomic practices;
iv] Village perimeter fencing tree crop systems and
v] Home gardening systems
The availability of such land in areas friendly to the recommended plant species can be ascertained. Concentrations of agro industries with combustible by-products and residues can be located. These locations must then be matched with the availability of infrastructure such as access to grid sub-stations with available capacity, navigable roads and adequate water for cooling the plant59.
The SHP experience shows that once an industry is perceived as lucrative, IPPs themselves will carry out extensive resource assessments. Since the bio-power sector has not reached this stage as yet, any initiative taken by a dedicated organization will help speed up the development process while drawing attention to the existence of the vast potential as has been projected.
58
Report of the Inter-Ministerial Working Committee on Dendro Thermal Technology, 2005, p. 30 59
Interview with Mr. Parakrama Jayasinghe, President, Bio-Energy Association of Sri Lanka
65
S
E
C
T
I
O
N
F
I
V
E
Rapid Deployment of Bio-Power

For instance, BEASL estimates that 500,000 hectares of unused scrub and chena lands can yield 10 million tonnes of fuel-wood annually. This tonnage will be adequate to power 1,200 MW of small power stations across the country60.
Figure 5.1 Dendro Power Potential in Sri Lanka
Source: Bio-Energy Association of Sri Lanka
iii] Pilot Program All stakeholders interviewed were in favour of establishing a pilot program to prove the efficacy of dendro power technology. ECF has already earmarked Hambantota for this program. Both CEB and the RERED Project have confirmed their support for a viable proposal. The program is intended to commence with one project and if successful, more plants will be commissioned in allocated sites in the vicinity. Supply of raw material, uninterrupted evacuation of electricity generated and access to water will be the three primary concerns for a pilot project.
60
Energy Forum (Guarantee) Limited, Incorporating Social and Environmental Concerns in Long Term
Electricity Generation Expansion Planning in Sri Lanka, 2006, p.21
66
S
E
C
T
I
O
N
F
I
V
E
Rapid Deployment of Bio-Power

Before the pilot program is launched, the Walapone operation has to be carefully analyzed to determine the critical success factors for developing a commercially viable operation, advises the Director General of PUCSL. He also recommends simultaneously prioritizing the use of biomass by-products and residues for bio-power, since such raw materials are readily available in known quantities61.
iv] Integrated Approach Bio-power has the potential to be an excellent solution to poverty alleviation in marginalized areas. Bio-power plants can be erected anywhere in the country, theoretically, and can generate employment at the farm gate selling points, at the collector‟s premises, from chipping, packing and transporting fire-wood and finally, from selling chipped wood to power plants. Consequently, the 1 MW Walapone plant has created income opportunities to over 1,200 villages62. Further, energy crops can be grown as plantations or integrated in many ways with existing farming practices. Hence, to exploit its full potential, the bio-power industry must bring together and direct a diverse pool of experts, resources and institutions, from both the public and private sector. ECF has identified at least 9 ministries whose participation is vital for the development of the bio-power industry. Evidently, this herculean effort demands a dedicated co-coordinating agency. Therefore, SEA will be established with the mandate to fulfill this requirement. iv] Awareness Building Every new technology needs an awareness building exercise to encourage potential developers, financiers and suppliers, while educating the GoSL, the utility, relevant state sector institutions, the general and regional public, non-governmental organizations and other stakeholders. The collection, compilation and dissemination of information must be organized and effective.
61
Interview with Professor Priyantha Wijayatunga, Director General, Public Utilities Commission of
Sri Lanka 62
Report of the Inter-Ministerial Working Committee on Dendro Thermal Technology, June 2005, p.11
67
S
E
C
T
I
O
N
F
I
V
E
Rapid Deployment of Bio-Power

Incidentally, the most powerful incentive for rapid development would be publicizing the successful implementation of the proposed pilot program. The Walapone yardstick which has caused serious doubts among potential IPPs and the banking community must be replaced or restructured to yield a positive outcome.
68
S
E
C
T
I
O
N
F
I
V
E
Rapid Deployment of Bio-Power
Resource Optimization Strategy
For the optimal and rapid exploitation of Sri Lanka‟s bio-power potential, the initiatives required are:
Conduct a resource assessment to ascertain a] suitable areas for energy plantations, b] the availability of adequate agricultural by-products and residues and c] convenient sites for power plants.
Analyze the net economic benefit of allocating resources to exploit the country‟s bio-power potential.
Establish a pilot program to confirm the economic and commercial viability of such projects.
Implement a coordinated research and development effort that focuses on both technology and fuel-wood farming.
Formulate and execute a medium to long term action plan for the development of this technology.
Effect a sustainable tariff rate acceptable to the country, the consumer, the developer and the utility.
This tariff rate necessarily considers the cost of grid augmentation required to evacuate electricity.
Offer tax concessions and subsidies to developers with the objective of reducing the tariff burden on the electricity consumer.
Launch an awareness building campaign to garner the support of developers, financiers and other key stakeholders.
Provide continuous training and support services to pioneering IPPs.
Supply adequate tools and training to CEB to manage scheduling the generation from many small power plants.

Section Six
A Progress Review of the Past Decade

NRE and the Economy
In 2005, the SHP industry fulfilled 3.2% of the nation‟s demand by generating 277 GWh of environmentally friendly, indigenous energy, almost a decade after the first modern SHP plant was connected to the national grid63. A decade hence, the NRE industry must contribute 1,768 GWh to contribute 10% of the nation‟s electricity requirement by 2015, according to the national energy strategy64. This quantum of power from alternate energy sources improves energy security. Beyond this evident advantage, there lies a greater significance that must necessarily provide the basis for a true economic evaluation of NRE technologies in Sri Lanka. In summary:
Table 6.2
Quantifiable Benefits of NRE Power Generation65
* According to carbon finance experts the tonnage is calculated at 0.64 kg of CO2 per kWh.
Hence, the country stands to gain much from the displacement of imported and expensive fossil fuel based thermal power. Further, a preliminary economic analysis of the RERED project demonstrates positive economic rates of returns on investments, especially for mini hydro projects where the rate of return exceeds 20%66.
63
Central Bank of Sri Lanka, Annual Report 2005, Table 36: Energy Sector Performance, 64
Ceylon Electricity Board, Long Term Generation Expansion Plan, 2006-2020, Table 3.3: Base Load
Forecast -2005, p. 3-4 65
Bases for calculation: Resource Development Consultants, Monitoring and Evaluation of the
Renewable Energy for Rural Economic Development Project, Quarterly Progress Report, March 2006,
p. 9 66
Bases for calculation: Resource Development Consultants, Monitoring and Evaluation of the
Renewable Energy for Rural Economic Development Project, Quarterly Progress Report, March 2006,
p. 9
Benefit 2005 - SHP 2015 - NRE (in current terms)
Economic value generation (at avoided cost - SLR 6.06/kWh)
SLR 1,679 Billion
SLR 10,716 Billion
Foreign exchange saving (at USD 0.13/kWh)
USD 36 Billion USD 230
Billion
Carbon emission reduction (at 0.8 kg CO2/kWh*)
221,600 MT 1.4 Million MT
69
S
E
C
T
I
O
N
S
I
X
A Review of the Past Decade
NRE and the Environment All NRE technologies are green energy sources. Bio-power is considered CO2 neutral. SHP and wind power are net contributors to the environment. Nevertheless, any form of development has an environmental trade-off, which must be acknowledged and mitigated. All NRE projects require an approval from the Central Environmental Authority (CEA). The granting of this approval has become more stringent with time and the terms and conditions have evolved to address the issues that have adversely impacted the environment. For instance, an Environmental Impact Assessment has become the norm for SHP projects today, whereas in previous years such a detailed evaluation was the exception. The approval is granted after a site inspection by CEA officials. A final visit is conducted at the time of commissioning to ensure that the terms and conditions of the CEA approval have been adequately met by the developers. Though an annual visit is desirable the CEA does not have the necessary manpower or resources to do so67. Such visits take place only if complaints about a particular project are received from the general public. Even with this limitation, the CEA has, on the whole, carried out its functions successfully in terms of the SHP industry. The experience with this sector will no doubt benefit the assessment of other NRE sectors in the future. The RERED Project too simultaneously pays heed to environmental and social concerns. Firm guidelines are laid down in the „Environmental Social Assessment and Management Framework‟. Qualified consultants are employed to ensure that sub-projects are compliant with the requirements of both the CEA and the RERED Project. Loan disbursements are approved and released only on the recommendation of these environmentalists. Some are of the view that developers must be made aware of the importance of conserving the surrounding environment, else they reap the repercussions which can be drastic. Special attention should be paid to mitigate soil erosion. Also, cultivating ground cover in the vicinity will improve water retention, while reducing the incidence of earth slips in high risk areas. According to the consultants, the SHP industry has proven relatively benign in terms of its effect on the environment. The recent escalation of legal action by concerned environmental organizations such as the Green Movement of Sri Lanka compels SHP IPPs to reasonably address environmental issues resulting from their development activities. For instance, they are of the view that the SHP industry must take genuine measures to curb soil erosion
67
Interview with the Director General, Central Environmental Authority
70
S
E
C
T
I
O
N
S
I
X
A Review of the Past Decade
and flooding, conserve regional flora and fauna and ensure a continuous supply of water required for the community‟s livelihood68. This position does mirror the opinion of the consultants employed by the RERED Project. However, many IPPs believe that while the NGOs have a vital role to play as environmental watch-dogs, the behaviour of certain NGOs is detrimental to the progress of the industry. They assert that, first and foremost, NGOs must act on the premise that NRE is inherently environmentally friendly and as such provides a superior alternative to thermal energy. An immediate remedy to this growing rift can be the commencement of a constructive dialogue between NGOs and other key stakeholders. Therefore, as a first step, their representation at the REC is recommended. With the advent of the Kyoto Protocol, NRE projects qualify for carbon credits, which is an additional, yet modest, source of revenue for IPPs69. It is estimated that carbon finance could improve the Financial Investment Rate of Return by 2% and, therefore, this could prove especially important for biomass power projects where investment risks are higher and rates of return lower70. Currently, four local NRE projects are registered with the executive board of the Clean Development Mechanism. Most local SHP IPPs are now in the process of applying for this benefit. NRE and Rural Development The Mid Term Review Report (1 September 2004 – 30 September 2006) of the RERED Project examines the impact of five SHP projects on villages in the vicinity. The consultants conclude: “Although these projects do not supply electricity direct to the communities where they are located, the developers have attempted to ensure that these communities benefit by providing them various village improvements in the form of infrastructure development… The main benefit was the building or repair of roads and bridges. The communities agree that this has not only improved access to facilities in nearby service centres but also improved access to the villages. This has increased the farm-gate prices of what is produced in the villages, especially tea green leaf. In some of the villages people have benefited from supply of water, housing and school facilities, building community centres and improving facilities at religious places of worship.”
68
Interview with Mr. Suranjan Kodituwakku, Green Movement of Sri Lanka 69
At best, a typical 1 MW SHP project in Sri Lanka can expect a revenue equivalent to the increase in
tariff by less than US Cents 1. 70
The World Bank, RERED Project, Aide-Mémoire, Supervision Mission 5-16 September 2005, p. 6
71
S
E
C
T
I
O
N
S
I
X
A Review of the Past Decade

Interviews with developers and visits to 15 SHP sites for the purpose of this study have confirmed RERED Project‟s survey results. However, the Mid Term Review notes that while most communities were pleased with benefits they have gained from developers, a few complained that the developers had failed to honour their promises 250 skilled and unskilled labourers are employed during the construction of a typical SHP project. A permanent staff of at least 10 is required for the operation and administration of a SHP plant. Wind power and bio-power projects (generated from residues and by-products) have a similar human resource requirement. Dendro power, on the other hand, is labour intensive. The income generation potential for rural communities from dendro based bio-power is substantial. A 100 MW plant is estimated to increase annual earnings by SLR 2,772 billion71. Conclusion A bona fide economic evaluation of each NRE technology must take into account its quantitative and qualitative impact on the economy, society and environment of the country. More importantly, GoSL, in consultation with the main stakeholders, must set the agenda and clearly establish the boundaries of sustainable development. Such an exercise is vital to justify the costs involved to implement the measures suggested in this report. This is the first rational step towards realizing the indigenous energy potential of private sector, grid-connected, small-scale generation. Finally, motivating the private sector to participate in planned infrastructure development is a noteworthy achievement, with positive ramifications. Within a regulated, yet enabling framework, the SHP industry is ample proof that the private sector can contribute responsibly towards achieving development targets. So justified, the possibility of a successful public-private partnership in the development of larger scale renewable energy projects has become more realistic to policy makers. As such, the construction and operation of four medium scale hydro projects are now being considered for public tender. The diversion of state owned resources to priority areas, while inviting the private sector to participate in identified lower-tier development programs may become a resulting trend, as will the translation of successful working models in the power sector to other essential infrastructure development.
71
Report of the Inter-Ministerial Working Committee on Dendro Thermal Technology, June 2005, p.42
72
S
E
C
T
I
O
N
S
I
X
A Review of the Past Decade

AWDR Weighted Average Deposit Rate BEASL Bio-Energy Association of Sri Lanka CEA Central Environmental Authority CEB Ceylon Electricity Board CHP Combined Heat and Power ECF Energy Conservation Fund ESD Energy Services Delivery GCSPDA Grid Connected Small Power Developers Association GoSL Government of Sri Lanka LoI Letter of Intent LTL Lanka Transformers Limited MoPE Ministry of Power and Energy NCED National Council for Economic Development NRE Non-Conventional Renewable Energy NRS National Reference Station PCI Participating Credit Institution PUCSL Public Utilities Commission of Sri Lanka REC Renewable Energy Cluster RERED Renewable Energy for Rural Economic Development SEA Sustainable Energy Authority SHP Small Hydro Power SLEF Sri Lanka Energy Fund SLR Sri Lankan Rupee SPPA Standardised Power Purchase Agreement TERI The Energy and Resources Institute USA United States of America USAID United States Agency for International Development USD United States Dollar VAT Value Added Tax WER Wind Energy Resource WASP Wien Automatic System Planning Package
73
Acronyms

Sri Lanka Sustainable Energy Authority Bill, May 2007 Ceylon Electricity Board, Long Term Generation and Expansion Plan 2006-2020
Energy Forum (Guarantee) Limited, Incorporating Social and Environmental Concerns in Long Term Electricity Generation Expansion Planning in Sri Lanka, October 2006 Resource Development Consultants for DFCC Bank Administrative Unit, Monitoring and Evaluation of the Renewable Energy for Rural Economic Development Project, Mid Term Review Report, 1 September 2004 – 30 September 2006 The Energy and Resources Institute, Draft Report on Deliverable 6: “Review of tariff setting methodologies for grid-connected small power producers”, April 2006 The World Bank, RERED Project, Implementation Review Mission Aide-Mémoire, April 2006 Resource Development Consultants for DFCC Bank Administrative Unit, Monitoring and Evaluation of the Renewable Energy for Rural Economic Development Project, Quarterly Progress Report, March 2006 Board of Investment of Sri Lanka, Industry-wise Incentives at a Glance, February 2006 National Energy Policies and Strategies of Sri Lanka, Final Draft, February 2006 Central Bank of Sri Lanka, Annual Report, 2005 National Council for Economic Development, NCED – A Participatory Approach towards Development, 2005 The World Bank, RERED Project, Supervision Mission Aide-Mémoire, September 2005 The Energy and Resources Institute, Draft Report on Deliverable 7: Legal and Regulatory Approach for Renewable Resource Based Electricity Generation, July 2005 Report of the Inter-Ministerial Working Committee on Dendro Thermal Technology, June 2005 Siemens Power Technologies International, Technical Assessment of Sri Lanka‟s Renewable Resource Based Electricity Generation, Overview of Technical Requirements, Connection and Management of Embedded Generation, March 2005 Central Bank of Sri Lanka, Annual Report, 2005 Sri Lanka Energy Services Delivery Project, Second Power Distribution and Transmission Project, Project Performance Assessment Report, June 2004 The World Bank, Sri Lanka Energy Services Delivery Project, Project Performance Assessment Report, June 2004 National Renewable Energy Laboratory, Sri Lanka Wind Farm Analysis and Site Selection Assistance, August 2003
74
References

The World Bank, Implementation Completion Report (IDA-29380, TF-28955), Energy Services Delivery Project, June 2003 Sri Lanka Energy Managers Association, Seminar on Investment Opportunities in Renewable Energy in Sri Lanka, February 2003 Public Utilities Commission of Sri Lanka Act, No 35 of 2002 Ceylon Electricity Board, Standardised Power Purchase Agreement Dr. Romesh Dias Bandaranaike, Grid Connected Small Hydro Power in Sri Lanka: The Experience of Private Developers, 2000 Ceylon Electricity Board, Guide for Grid Interconnection of Embedded Generators, December 2000 Energy Conservation Fund Act, No.2 of 1985 Ceylon Electricity Board, Guidelines on Private Sector Participation in Small Hydro Power Development, www.ceb.lk Michigan State University, Biomass Conversion Research Laboratory, Life Cycle Analysis, www.everythingbiomass.org United States Department of Energy, Biomass Program, www.eere.energy.gov
75
References

Our sincere thanks to:
Administrative Unit, Renewable Energy for Rural Economic Development Program
Bio Energy Association of Sri Lanka
Central Bank of Sri Lanka
Central Environmental Authority
Ceylon Electricity Board
Commercial Bank
DFCC Bank
Energy Conservation Fund
Energy Forum Guarantee Limited
Green Movement of Sri Lanka
Grid Connected Small Power Developers Association
Hatton National Bank
Hayleys Industrial Solutions
Land Reform Commission
Lanka Transformers Limited
Public Utilities Commission of Sri Lanka
Ministry of Finance and Planning
Ministry of Power and Energy
Ministry of Science and Technology
NDB Bank
Resource Development Consultants
Sampath Bank
United States Agency for International Development
… and to all who generously shared their valuable time, expertise and views with us.
74
Acknowledgements

Annexure
NRE Tariff Setting Methodologies

Avoided Cost Based Tariff Methodology
“Avoided cost of energy represents the maximum value of generation avoided by CEB as a result of any purchase of energy from sources outside the CEB system. Ideally, this value should be the value of one unit of energy (kWh) displaced at the margin by a unit of energy purchased from such sources… this is generally the cost of the most expensive unit being generated at that instant, since it is implied that different generators are dispatched in their merit order of costs, subject to availability.”
- Ceylon Electricity Board, Standardised Power Purchase Agreement, Appendix A, Rates for Delivery of Energy Output
The calculation methodology currently adopted by CEB is detailed thus in the Report on Deliverable 6: “Review of tariff setting methodologies for grid-connected small power producers” prepared by The Energy and Resources Institute of India (TERI) (10):
“The present method estimates the avoided marginal cost as a result of small power projects added to in the national grid. In this method, the variable cost of operation of CEB thermal plants and IPPs are calculated (after adjusting for losses at the 33kV level). Thereafter, on the basis of projected load duration curve, the (monthly) fraction of time that a particular thermal plant operates in the margin is estimated. The fraction of time for which the particular power plant operates in the margin is then used as weighting factor to the respective variable costs of operation of each thermal plant in order to obtain the monthly „weighted marginal energy cost‟, also called as the monthly avoided energy cost‟. The avoided cost is then computed separately for the dry season (February to April) and the wet season (May to January). The seasonal tariff that is announced by CEB every year is a 3-year moving average of the last 3 years avoided energy costs. If the announced tariff for a particular year falls below 90% of the tariff during the year in which the SPPA was signed for a given SPP, the tariff applicable will be the tariff of the previous year, as per the standard‟.
The tariff is based on forecasts, without an adjustment factor to reflect the actual data. This is the primary cause for contention between CEB and the developers. Were the true avoided cost used, the tariffs offered would be based on the economic efficiency principles of marginal cost pricing. CEB would be technology neutral in the choice of NRE and the utility will neither gain nor lose by this choice. However, the forecasted method does not carry the same impact. GCSPDA‟s claim that every year the forecasted tariff is less than the actual avoided cost warrants attention. The actual avoided cost cannot be calculated by the consultant since the required data is not made public. Forecasts should be adjusted annually to reflect reality. The transparency and accuracy of the tariff calculation can be improved with the involvement of PUCSL and SEA in the tariff setting process. CEB argues that there is no net gain by encouraging NRE technologies based on the avoided cost principle. Nonetheless, the concept of offering a tariff that is a certain percentage less than the actual avoided cost is acceptable to CEB. This may provide a vital middle-ground in future tariff setting negotiations. One of the key advantages of the SPPA is the guaranteed floor price. Thus, if in the future technological advances drastically bring down or nullify the avoided cost based on thermal power generation at the margin, the developers are still ensured with a minimum fixed rate. Knowledge of this rate at the outset also assists developers to carry out their long-term financial forecasts with some degree of certainty.

Cost Based Tariff Methodology TERI in their Report on Deliverable 6: “Review of tariff setting methodologies for grid-connected small power producers” recommended a cost based approach to replace the avoided cost based methodology. The three-tiered, cost based, technology specific tariff is effective from 2007 onwards. TERI explains this approach thus (2):
“The tariff that is computed using this method allows a project developer to cover its operating and capital costs. Besides, it ensures an assured return on capital. This method analyses the cash flows as a result of the project activity with return on equity as one of the components of cash outflow and estimates annual cost of generation… the cost escalations, the O&M escalation, fuel cost escalation and incentives in terms of subsidy or other fiscal incentives can also be included while estimating tariffs by this method. The tariff calculated by this method varies from technology to technology depending upon the performance and costs. Moreover, the tariff estimation by this method solely depends on the cost and performance of the project/technology. In the cost based approach, ideally tariff should be estimated for each project. However, due to resources and time constraints, technology benchmarking is commonly used wherein the average parameters such as the plant factor and capital costs are used for estimation of tariff.”
The main concern raised by GCSPDA is the issue of subjectivity embedded in this methodology. The process of industry benchmarking is not an easy task. The outcome is that the development of those projects that cost over and above the averages used will be curtailed. While the avoided cost principle uses market realities to decide this threshold, the cost based approach relies on the arbitrary decision of the tariff setting committee to encourage (or stall) development of NRE projects. Though in principle the GCSPDA is agreeable to the cost based approach, they strongly object to the industry benchmarks used. A key weakness in the entire exercise is the failure to establish an equitable and objective method to decide how the benchmarks should be derived. In addition, given a situation of economic instability at home, compounded by escalating international oil prices, the data used for the tariff calculation has fast become obsolete in the time it took for the cost based tariff to be made public. The SHP and wind power developers have declined to accept this new tariff system, while the BEASL finds these tariff rates acceptable. Another issue pointed out by the GCSPDA, which the consultant also confirms, is regarding the accuracy of the calculation methodology. GCSPDA claims that while certain costs have been ignored, the method of deriving the tariff could also be faulty. A case in point is the calculation of the profit element. A pre-tax return on equity has been used, whereas financial forecasting in Sri Lanka is mainly based on post-tax Internal Rates of Return and the Discounted Pay Back Period. It must be noted that genuine stakeholder participation in the cost based tariff setting process is a necessity to understand and assess the actual financing of NRE projects. The consultant also recommends an annual adjustment factor to capture market changes and keep the „real effective‟ tariff rates static. The justification for this adjustment is that the cost based approach, unlike the avoided cost based methodology, is removed from market realities and has no embedded mechanism to correct for such significant changes. The CEB only pays 90% of the forecasted avoided cost, which will continue to be published annually. The balance is met by the Treasury through the Sri Lanka Energy Fund (SLEF). In the event the cost based tariff falls below CEB‟s tariff commitment for NRE technologies, the utility must reimburse the difference to the SLEF. „Thus if tariff provided for a particular technology is higher than the avoided cost, the additional costs will come from government. Similarly in the case of technologies with tariffs lower than the avoided cost the benefit will go to the government account‟, explains TERI (25). If the sustainability of SLEF is expected to rest on this reimbursement, a bias is created towards maximizing the revenue to SLEF, as a result of which certain technologies may develop at the cost of others.

Conclusion Using either of the above approaches, an equitable tariff acceptable to all stakeholders, including CEB, can be determined. Since long-term forecasts risk the exclusion of unknown and unanticipated factors, an adjustment mechanism can be established to reflect future market conditions. The core deficiency has been and continues to be the implementation methodology. The consultant recommends an impartial and comprehensive evaluation based on recent experiences with tariff setting. A noteworthy derivative of this process is the positive attitude towards change expressed by key stakeholders. An economic cost benefit analysis of all energy options must be conducted to assess the impact of each technology on the country as a whole. Aspects such as foreign exchange savings, rural development, environmental conservation etc. must be treated at a macro level and GoSL should establish the policy and the means to provide „adders‟ such as tax concessions, price premiums etc. to encourage the development of energy alternatives that carry added benefits to the country. This is beyond the function of the utility. CEB must be permitted to objectively choose the best alternatives that serve their primary role as the provider of high quality power to Sri Lanka‟s consumer base, cheaply and reliably. The role of PUCSL, with the mandate of MoPE, then becomes vital to ensure that the country develops the energy sources that provide the highest net benefit. SEA must derive their direction from the NRE policy that has been so guided by PUCSL.