A Review of Lake Austin Sediment Quality, 1987-2009
30
A Review of Lake Austin Sediment Quality, 1987-2009 Mary Gilroy and Martha Turner Environmental Resource Management, Watershed Protection Department City of Austin SR-10-14. September 2010 Sediment samples were collected on Lake Austin from 1987 through 2009, with site location and frequency varying considerably until 2001, when four sites were sampled annually through 2009. The only lake-wide temporal trend seen in this more recent period of record (2001-2009) was a decreasing trend for chlordane, although there was limited detected chlordane data (21%, or 6 out of 29 samples). Site specific trends include increasing trends in copper and zinc at Tom Miller, the most downstream site, but data was all well below the TEC (Threshold Effects Concentration). Spatial analyses indicated that only Tom Miller was significantly different(always higher) from other sites for any parameter, except for total PAHs, where Bull Creek was higher and significantly different from all others. Only four parameters, arsenic, DDD, DDE and TPAH had values exceeding the TEC, and only DDE, with four exceedances, had more than one exceedance since 2001. Future monitoring should include only the most downstream site, and parameters with no detected data should be dropped from the analysis list. Introduction In addition to causing increased turbidity, smothering of benthic habitat and eventually volume reduction in reservoirs, sediments are an important storage mechanism for many chemicals in surface water. Because of their ability to sequester toxic compounds, sediments can reflect and record the effects of anthropogenic influences on water bodies. Brought into the water from both point and non-point sources, toxins can move throughout the water column, adhering to sediments where long term exposure to aquatic organisms is possible, from both suspended and benthic particles. Lake Austin is a 1600 acre run-of-the-river reservoir on the Colorado River just upstream of the urban center of the City of Austin in Travis County, Texas. While less intensely developed than the downstream reservoir, Lady Bird Lake, increasing urbanization of the Lake Austin watershed can be expected to impact sediment quality. This report reviews spatial and temporal trends to establish a baseline of current conditions for future comparisons as well as to direct future sampling efforts. Methods The period of record for this report is 1987- 2009. Through 1995, site location and sampling frequency varied from year to year. No sediment was collected from 1996 to 2001, when sampling was initiated at four sites intended to characterize the condition of sediment throughout the lake, and this has continued annually through 2009. Samples were collected by City of Austin, Lower Colorado River Authority and USGS in different years, but labs used by all agencies were accredited by the EPA National Environmental Laboratory Accreditation Program. Site location and sampling frequency All but two data points were collected at four sites, distributed from upstream to downstream (Figure 1, Table 1). These two data points were from single sampling events at two sites, #512, the most upstream site and #218, a SR-10-14 Page 1 of 30 September 2010
Transcript of A Review of Lake Austin Sediment Quality, 1987-2009
A Review of Lake Austin Sediment Quality, 1987-2009 Mary Gilroy and Martha Turner Environmental Resource Management, Watershed Protection Department City of Austin SR-10-14. September 2010 Sediment samples were collected on Lake Austin from 1987 through 2009, with site location and frequency varying considerably until 2001, when four sites were sampled annually through 2009. The only lake-wide temporal trend seen in this more recent period of record (2001-2009) was a decreasing trend for chlordane, although there was limited detected chlordane data (21%, or 6 out of 29 samples). Site specific trends include increasing trends in copper and zinc at Tom Miller, the most downstream site, but data was all well below the TEC (Threshold Effects Concentration). Spatial analyses indicated that only Tom Miller was significantly different(always higher) from other sites for any parameter, except for total PAHs, where Bull Creek was higher and significantly different from all others. Only four parameters, arsenic, DDD, DDE and TPAH had values exceeding the TEC, and only DDE, with four exceedances, had more than one exceedance since 2001. Future monitoring should include only the most downstream site, and parameters with no detected data should be dropped from the analysis list. Introduction In addition to causing increased turbidity, smothering of benthic habitat and eventually volume reduction in reservoirs, sediments are an important storage mechanism for many chemicals in surface water. Because of their ability to sequester toxic compounds, sediments can reflect and record the effects of anthropogenic influences on water bodies. Brought into the water from both point and non-point sources, toxins can move throughout the water column, adhering to sediments where long term exposure to aquatic organisms is possible, from both suspended and benthic particles. Lake Austin is a 1600 acre run-of-the-river reservoir on the Colorado River just upstream of the urban center of the City of Austin in Travis County, Texas. While less intensely developed than the downstream reservoir, Lady Bird Lake, increasing urbanization of the Lake Austin watershed can be expected to impact sediment quality. This report reviews spatial and temporal trends to establish a baseline of current conditions for future comparisons as well as to direct future sampling efforts. Methods The period of record for this report is 1987- 2009. Through 1995, site location and sampling frequency varied from year to year. No sediment was collected from 1996 to 2001, when sampling was initiated at four sites intended to characterize the condition of sediment throughout the lake, and this has continued annually through 2009. Samples were collected by City of Austin, Lower Colorado River Authority and USGS in different years, but labs used by all agencies were accredited by the EPA National Environmental Laboratory Accreditation Program. Site location and sampling frequency All but two data points were collected at four sites, distributed from upstream to downstream (Figure 1, Table 1). These two data points were from single sampling events at two sites, #512, the most upstream site and #218, a
SR-10-14 Page 1 of 30 September 2010
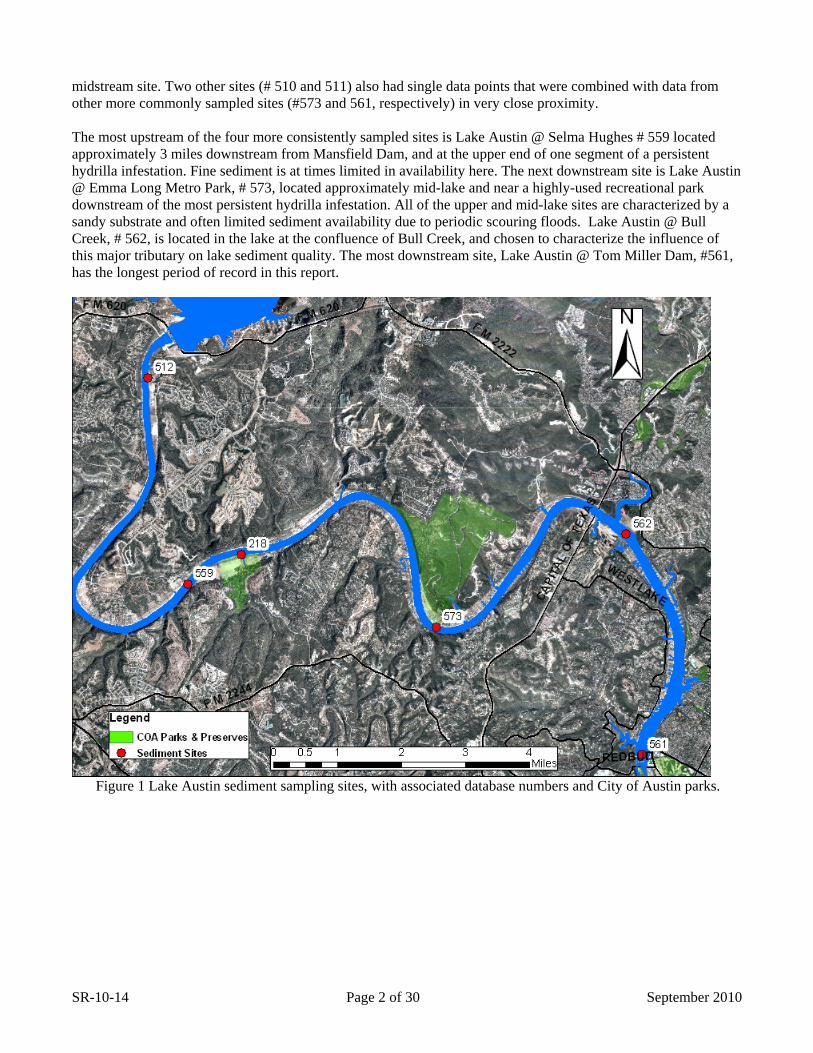
midstream site. Two other sites (# 510 and 511) also had single data points that were combined with data from other more commonly sampled sites (#573 and 561, respectively) in very close proximity. The most upstream of the four more consistently sampled sites is Lake Austin @ Selma Hughes # 559 located approximately 3 miles downstream from Mansfield Dam, and at the upper end of one segment of a persistent hydrilla infestation. Fine sediment is at times limited in availability here. The next downstream site is Lake Austin @ Emma Long Metro Park, # 573, located approximately mid-lake and near a highly-used recreational park downstream of the most persistent hydrilla infestation. All of the upper and mid-lake sites are characterized by a sandy substrate and often limited sediment availability due to periodic scouring floods. Lake Austin @ Bull Creek, # 562, is located in the lake at the confluence of Bull Creek, and chosen to characterize the influence of this major tributary on lake sediment quality. The most downstream site, Lake Austin @ Tom Miller Dam, #561, has the longest period of record in this report.
Figure 1 Lake Austin sediment sampling sites, with associated database numbers and City of Austin parks.
SR-10-14 Page 2 of 30 September 2010
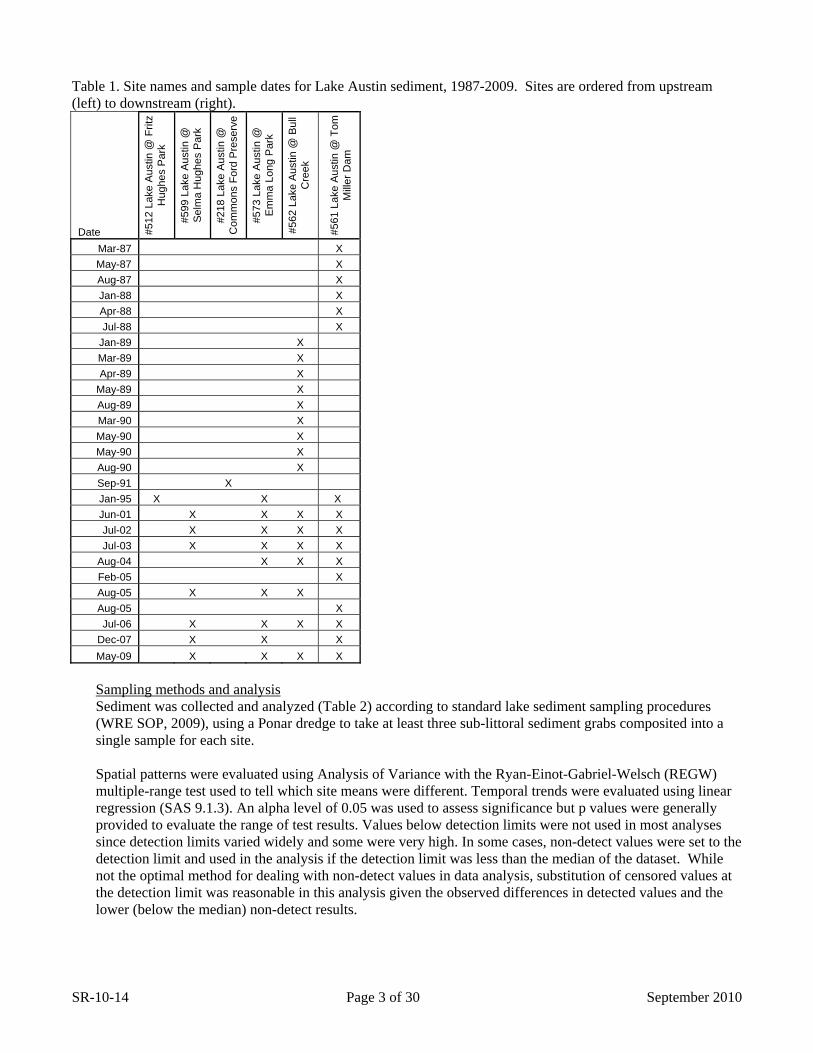
Table 1. Site names and sample dates for Lake Austin sediment, 1987-2009. Sites are ordered from upstream (left) to downstream (right).
Date #512
Lak
e A
ustin
@ F
ritz
Hug
hes
Par
k
#599
Lak
e A
ustin
@
Sel
ma
Hug
hes
Par
k
#218
Lak
e A
ustin
@
Com
mon
s Fo
rd P
rese
rve
#573
Lak
e A
ustin
@
Em
ma
Long
Par
k
#562
Lak
e A
ustin
@ B
ull
Cre
ek
#561
Lak
e A
ustin
@ T
om
Mill
er D
am
Mar-87 X May-87 X Aug-87 X Jan-88 X Apr-88 X Jul-88 X
Jan-89 X Mar-89 X Apr-89 X
May-89 X Aug-89 X Mar-90 X May-90 X May-90 X Aug-90 X Sep-91 X Jan-95 X X X Jun-01 X X X X Jul-02 X X X X Jul-03 X X X X
Aug-04 X X X Feb-05 X Aug-05 X X X Aug-05 X Jul-06 X X X X
Dec-07 X X X May-09 X X X X
Sampling methods and analysis Sediment was collected and analyzed (Table 2) according to standard lake sediment sampling procedures (WRE SOP, 2009), using a Ponar dredge to take at least three sub-littoral sediment grabs composited into a single sample for each site. Spatial patterns were evaluated using Analysis of Variance with the Ryan-Einot-Gabriel-Welsch (REGW) multiple-range test used to tell which site means were different. Temporal trends were evaluated using linear regression (SAS 9.1.3). An alpha level of 0.05 was used to assess significance but p values were generally provided to evaluate the range of test results. Values below detection limits were not used in most analyses since detection limits varied widely and some were very high. In some cases, non-detect values were set to the detection limit and used in the analysis if the detection limit was less than the median of the dataset. While not the optimal method for dealing with non-detect values in data analysis, substitution of censored values at the detection limit was reasonable in this analysis given the observed differences in detected values and the lower (below the median) non-detect results.
SR-10-14 Page 3 of 30 September 2010
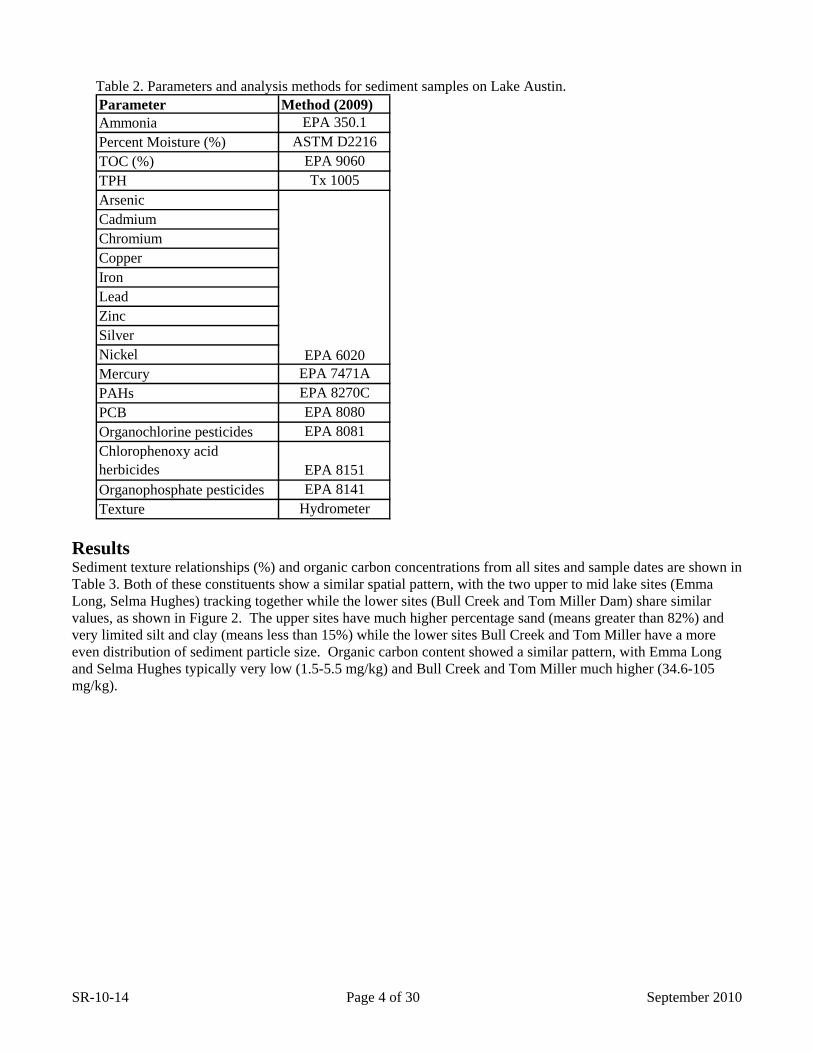
Table 2. Parameters and analysis methods for sediment samples on Lake Austin. Parameter Method (2009)Ammonia EPA 350.1Percent Moisture (%) ASTM D2216TOC (%) EPA 9060TPH Tx 1005ArsenicCadmiumChromiumCopperIronLeadZincSilverNickelMercury EPA 7471APAHs EPA 8270CPCB EPA 8080Organochlorine pesticides EPA 8081Chlorophenoxy acid herbicides EPA 8151Organophosphate pesticides EPA 8141Texture Hydrometer
EPA 6020
Results Sediment texture relationships (%) and organic carbon concentrations from all sites and sample dates are shown in Table 3. Both of these constituents show a similar spatial pattern, with the two upper to mid lake sites (Emma Long, Selma Hughes) tracking together while the lower sites (Bull Creek and Tom Miller Dam) share similar values, as shown in Figure 2. The upper sites have much higher percentage sand (means greater than 82%) and very limited silt and clay (means less than 15%) while the lower sites Bull Creek and Tom Miller have a more even distribution of sediment particle size. Organic carbon content showed a similar pattern, with Emma Long and Selma Hughes typically very low (1.5-5.5 mg/kg) and Bull Creek and Tom Miller much higher (34.6-105 mg/kg).
SR-10-14 Page 4 of 30 September 2010
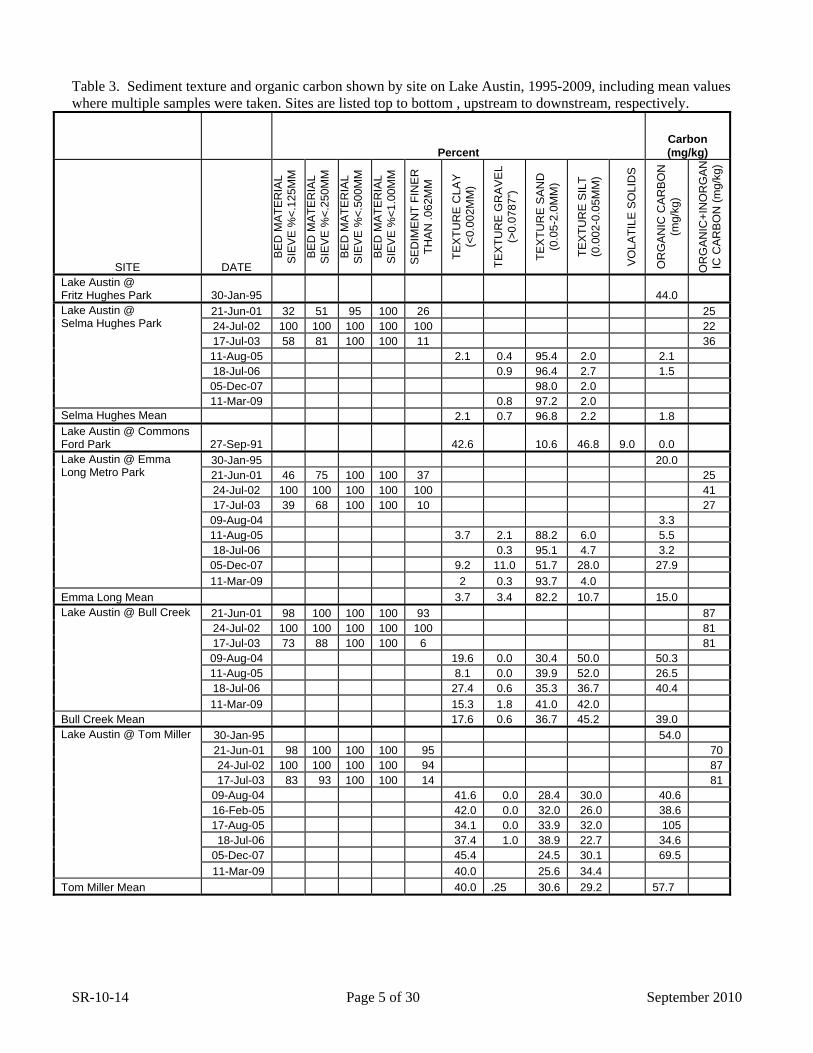
Table 3. Sediment texture and organic carbon shown by site on Lake Austin, 1995-2009, including mean values where multiple samples were taken. Sites are listed top to bottom , upstream to downstream, respectively.
Percent Carbon (mg/kg)
SITE DATE B
ED
MA
TER
IAL
SIE
VE
%<.
125M
M
BE
D M
ATE
RIA
L S
IEV
E %
<.25
0MM
BE
D M
ATE
RIA
L S
IEV
E %
<.50
0MM
BE
D M
ATE
RIA
L S
IEV
E %
<1.0
0MM
SE
DIM
EN
T FI
NE
R
THA
N .0
62M
M
TEX
TUR
E C
LAY
(<
0.00
2MM
)
TEX
TUR
E G
RA
VE
L (>
0.07
87”)
TEX
TUR
E S
AN
D
(0.0
5-2.
0MM
)
TEX
TUR
E S
ILT
(0.0
02-0
.05M
M)
VO
LATI
LE S
OLI
DS
OR
GA
NIC
CA
RB
ON
(m
g/kg
)
OR
GA
NIC
+IN
OR
GA
NIC
CA
RB
ON
(mg/
kg)
Lake Austin @ Fritz Hughes Park 30-Jan-95 44.0
21-Jun-01 32 51 95 100 26 25 24-Jul-02 100 100 100 100 100 22 17-Jul-03 58 81 100 100 11 36 11-Aug-05 2.1 0.4 95.4 2.0 2.1 18-Jul-06 0.9 96.4 2.7 1.5 05-Dec-07 98.0 2.0
Lake Austin @ Selma Hughes Park
11-Mar-09 0.8 97.2 2.0 Selma Hughes Mean 2.1 0.7 96.8 2.2 1.8 Lake Austin @ Commons Ford Park 27-Sep-91 42.6 10.6 46.8 9.0 0.0
30-Jan-95 20.0 21-Jun-01 46 75 100 100 37 25 24-Jul-02 100 100 100 100 100 41 17-Jul-03 39 68 100 100 10 27 09-Aug-04 3.3 11-Aug-05 3.7 2.1 88.2 6.0 5.5 18-Jul-06 0.3 95.1 4.7 3.2 05-Dec-07 9.2 11.0 51.7 28.0 27.9
Lake Austin @ Emma Long Metro Park
11-Mar-09 2 0.3 93.7 4.0 Emma Long Mean 3.7 3.4 82.2 10.7 15.0
21-Jun-01 98 100 100 100 93 87 24-Jul-02 100 100 100 100 100 81 17-Jul-03 73 88 100 100 6 81 09-Aug-04 19.6 0.0 30.4 50.0 50.3 11-Aug-05 8.1 0.0 39.9 52.0 26.5 18-Jul-06 27.4 0.6 35.3 36.7 40.4
Lake Austin @ Bull Creek
11-Mar-09 15.3 1.8 41.0 42.0 Bull Creek Mean 17.6 0.6 36.7 45.2 39.0
30-Jan-95 54.0 21-Jun-01 98 100 100 100 95 7024-Jul-02 100 100 100 100 94 8717-Jul-03 83 93 100 100 14 81
09-Aug-04 41.6 0.0 28.4 30.0 40.6 16-Feb-05 42.0 0.0 32.0 26.0 38.6 17-Aug-05 34.1 0.0 33.9 32.0 105 18-Jul-06 37.4 1.0 38.9 22.7 34.6
05-Dec-07 45.4 24.5 30.1 69.5
Lake Austin @ Tom Miller
11-Mar-09 40.0 25.6 34.4 Tom Miller Mean 40.0 .25 30.6 29.2 57.7
SR-10-14 Page 5 of 30 September 2010

Figure 2. Percent texture and organic carbon in sediment on the four most consistently sampled sites on Lake
Austin, 1995-2009
0
10
20
30
40
50
60
70
80
90
100
CLA
Y
GR
AVEL
SAN
D
SILT
OR
GAN
ICC
ARBO
N
perc
ent t
extu
re, m
g/kg
org
anic
car
bon
Selma Hughes
Emma Long
Bull Creek
Tom Miller
Table 4 provides summary statistics for detection limits and detected values for all analysis parameters for the period of record. Constituents with no detected values throughout the study period include silver, aldrin, three species of chlordane and diazinon. Most metals had a fairly high percentage of detected values, with mercury having the least (48%) and nickel being the only parameter with 100% detected values. Additional data is presented in Appendix A, with detected values for all pesticides and herbicides in Table 5, semi-volatile and polychlorinated biphenyls (PCBs) in Table 6 and 7, respectively, and the sum of polycyclic aromatic hydrocarbons (TPAH) values (both detects and non-detects) in Table 8. TPAH data includes non-detects, as one laboratory had particularly high detection limits, and only one detected value (1650 µg/kg) which was the maximum value recorded for that parameter in the study. Temporal Trends When data from all sites are combined, sediment quality on Lake Austin generally shows improvement over the entire period of record, with only decreasing temporal trends in seven parameters shown in Table 9. For six of the seven parameters, there was no trend when the analysis was limited to more recent data from 2001-2009. Chlordane was not analyzed for samples prior to 2001, and is the only parameter showing any significant trend with this more recent data set. Three of the seven (chromium, mercury, chlordane) parameters had detection limits that were less than the median of the detected values, so all non-detect data was set to the detection limit and included in the analyses. Substitution is not the optimal method for dealing with censored observations, but since all non-detect values were less than the median of the dataset the application in temporal trend analysis may affect magnitude but not the direction of the predicted slope. Detection limits for the other parameters did not meet this criteria, so non-detect values were not included. Temporal graphs of each parameter are presented in Appendix C, with only detected values. Table 4. Percent detection of sediment parameters, associated detection limits, and range of detected values among all study sites on Lake Austin, 1987-2009. Gray cells indicate no data, either because no sample values
SR-10-14 Page 6 of 30 September 2010
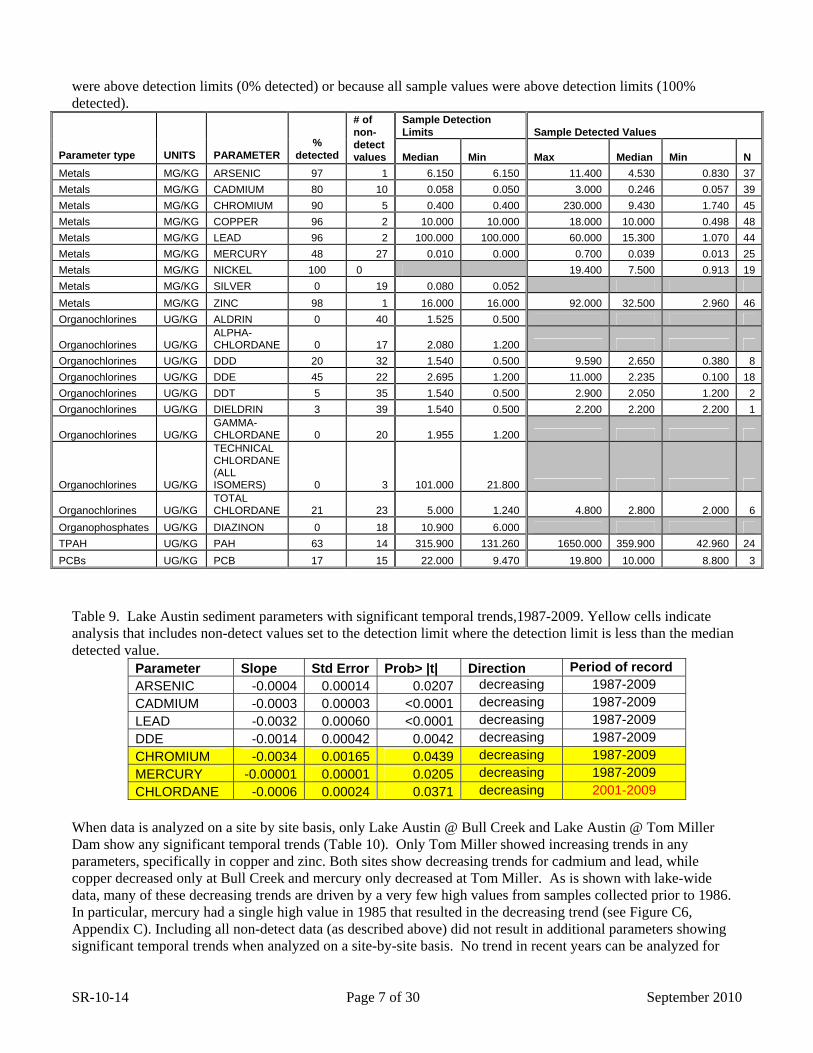
were above detection limits (0% detected) or because all sample values were above detection limits (100% detected).
Sample Detection Limits Sample Detected Values
Parameter type UNITS PARAMETER %
detected
# of non-detect values Median Min Max Median Min N
Metals MG/KG ARSENIC 97 1 6.150 6.150 11.400 4.530 0.830 37 Metals MG/KG CADMIUM 80 10 0.058 0.050 3.000 0.246 0.057 39 Metals MG/KG CHROMIUM 90 5 0.400 0.400 230.000 9.430 1.740 45 Metals MG/KG COPPER 96 2 10.000 10.000 18.000 10.000 0.498 48 Metals MG/KG LEAD 96 2 100.000 100.000 60.000 15.300 1.070 44 Metals MG/KG MERCURY 48 27 0.010 0.000 0.700 0.039 0.013 25 Metals MG/KG NICKEL 100 0 19.400 7.500 0.913 19 Metals MG/KG SILVER 0 19 0.080 0.052 Metals MG/KG ZINC 98 1 16.000 16.000 92.000 32.500 2.960 46 Organochlorines UG/KG ALDRIN 0 40 1.525 0.500
Organochlorines UG/KG ALPHA-CHLORDANE 0 17 2.080 1.200
Organochlorines UG/KG DDD 20 32 1.540 0.500 9.590 2.650 0.380 8 Organochlorines UG/KG DDE 45 22 2.695 1.200 11.000 2.235 0.100 18 Organochlorines UG/KG DDT 5 35 1.540 0.500 2.900 2.050 1.200 2 Organochlorines UG/KG DIELDRIN 3 39 1.540 0.500 2.200 2.200 2.200 1
Organochlorines UG/KG GAMMA-CHLORDANE 0 20 1.955 1.200
Organochlorines UG/KG
TECHNICAL CHLORDANE (ALL ISOMERS) 0 3 101.000 21.800
Organochlorines UG/KG TOTAL CHLORDANE 21 23 5.000 1.240 4.800 2.800 2.000 6
Organophosphates UG/KG DIAZINON 0 18 10.900 6.000 TPAH UG/KG PAH 63 14 315.900 131.260 1650.000 359.900 42.960 24 PCBs UG/KG PCB 17 15 22.000 9.470 19.800 10.000 8.800 3
Table 9. Lake Austin sediment parameters with significant temporal trends,1987-2009. Yellow cells indicate analysis that includes non-detect values set to the detection limit where the detection limit is less than the median detected value.
Parameter Slope Std Error Prob> |t| Direction Period of record ARSENIC -0.0004 0.00014 0.0207 decreasing 1987-2009 CADMIUM -0.0003 0.00003 <0.0001 decreasing 1987-2009 LEAD -0.0032 0.00060 <0.0001 decreasing 1987-2009 DDE -0.0014 0.00042 0.0042 decreasing 1987-2009 CHROMIUM -0.0034 0.00165 0.0439 decreasing 1987-2009 MERCURY -0.00001 0.00001 0.0205 decreasing 1987-2009 CHLORDANE -0.0006 0.00024 0.0371 decreasing 2001-2009
When data is analyzed on a site by site basis, only Lake Austin @ Bull Creek and Lake Austin @ Tom Miller Dam show any significant temporal trends (Table 10). Only Tom Miller showed increasing trends in any parameters, specifically in copper and zinc. Both sites show decreasing trends for cadmium and lead, while copper decreased only at Bull Creek and mercury only decreased at Tom Miller. As is shown with lake-wide data, many of these decreasing trends are driven by a very few high values from samples collected prior to 1986. In particular, mercury had a single high value in 1985 that resulted in the decreasing trend (see Figure C6, Appendix C). Including all non-detect data (as described above) did not result in additional parameters showing significant temporal trends when analyzed on a site-by-site basis. No trend in recent years can be analyzed for
SR-10-14 Page 7 of 30 September 2010
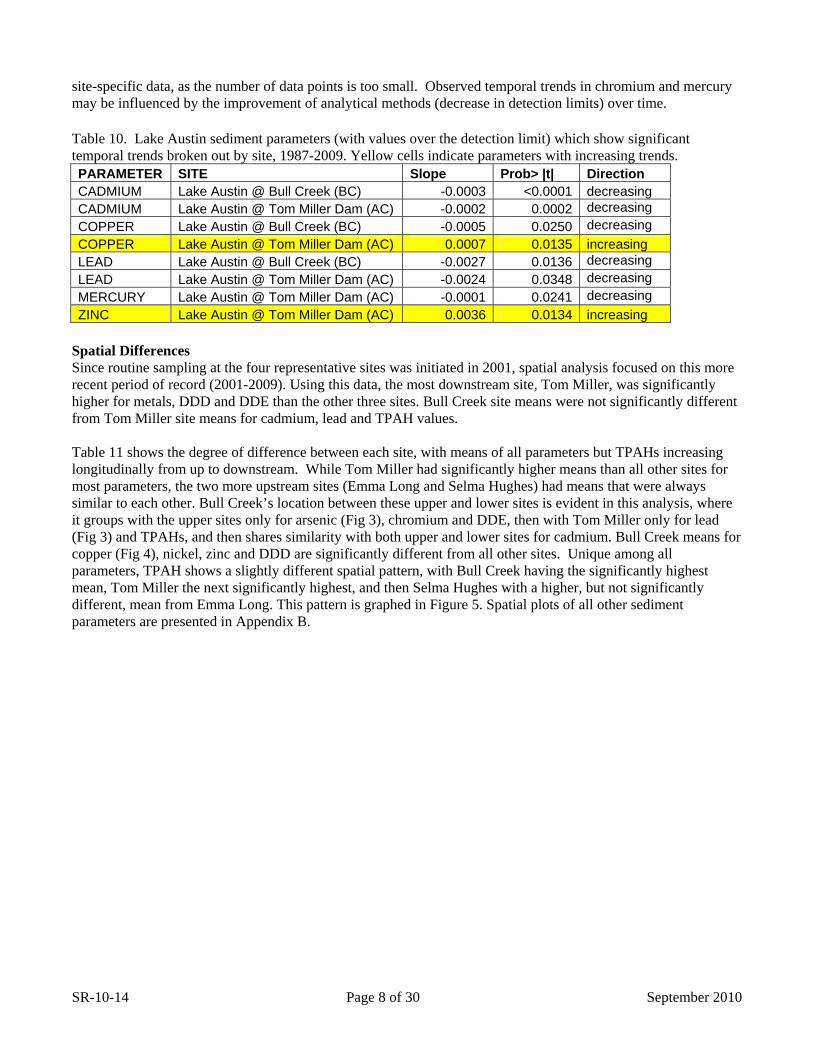
site-specific data, as the number of data points is too small. Observed temporal trends in chromium and mercury may be influenced by the improvement of analytical methods (decrease in detection limits) over time. Table 10. Lake Austin sediment parameters (with values over the detection limit) which show significant temporal trends broken out by site, 1987-2009. Yellow cells indicate parameters with increasing trends. PARAMETER SITE Slope Prob> |t| Direction CADMIUM Lake Austin @ Bull Creek (BC) -0.0003 <0.0001 decreasing CADMIUM Lake Austin @ Tom Miller Dam (AC) -0.0002 0.0002 decreasing COPPER Lake Austin @ Bull Creek (BC) -0.0005 0.0250 decreasing COPPER Lake Austin @ Tom Miller Dam (AC) 0.0007 0.0135 increasing LEAD Lake Austin @ Bull Creek (BC) -0.0027 0.0136 decreasing LEAD Lake Austin @ Tom Miller Dam (AC) -0.0024 0.0348 decreasing MERCURY Lake Austin @ Tom Miller Dam (AC) -0.0001 0.0241 decreasing ZINC Lake Austin @ Tom Miller Dam (AC) 0.0036 0.0134 increasing
Spatial Differences Since routine sampling at the four representative sites was initiated in 2001, spatial analysis focused on this more recent period of record (2001-2009). Using this data, the most downstream site, Tom Miller, was significantly higher for metals, DDD and DDE than the other three sites. Bull Creek site means were not significantly different from Tom Miller site means for cadmium, lead and TPAH values. Table 11 shows the degree of difference between each site, with means of all parameters but TPAHs increasing longitudinally from up to downstream. While Tom Miller had significantly higher means than all other sites for most parameters, the two more upstream sites (Emma Long and Selma Hughes) had means that were always similar to each other. Bull Creek’s location between these upper and lower sites is evident in this analysis, where it groups with the upper sites only for arsenic (Fig 3), chromium and DDE, then with Tom Miller only for lead (Fig 3) and TPAHs, and then shares similarity with both upper and lower sites for cadmium. Bull Creek means for copper (Fig 4), nickel, zinc and DDD are significantly different from all other sites. Unique among all parameters, TPAH shows a slightly different spatial pattern, with Bull Creek having the significantly highest mean, Tom Miller the next significantly highest, and then Selma Hughes with a higher, but not significantly different, mean from Emma Long. This pattern is graphed in Figure 5. Spatial plots of all other sediment parameters are presented in Appendix B.
SR-10-14 Page 8 of 30 September 2010
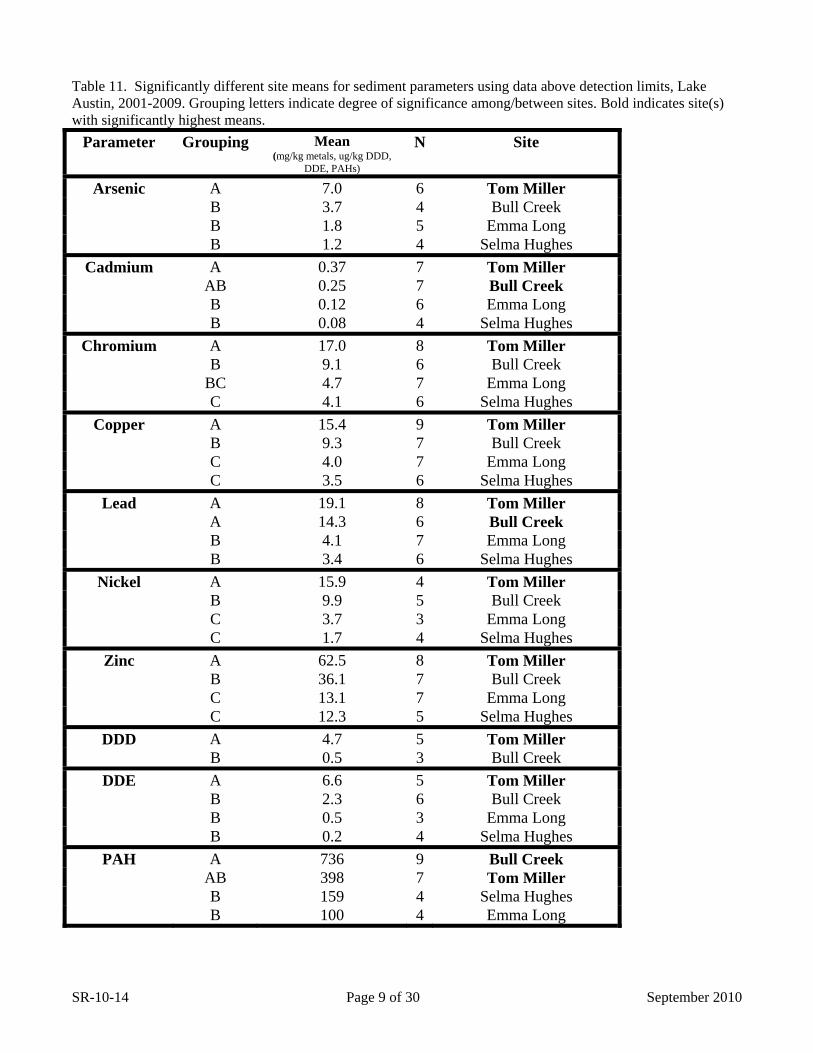
Table 11. Significantly different site means for sediment parameters using data above detection limits, Lake Austin, 2001-2009. Grouping letters indicate degree of significance among/between sites. Bold indicates site(s) with significantly highest means.
Parameter Grouping Mean (mg/kg metals, ug/kg DDD,
DDE, PAHs)
N Site
Arsenic A 7.0 6 Tom Miller B 3.7 4 Bull Creek B 1.8 5 Emma Long B 1.2 4 Selma Hughes
Cadmium A 0.37 7 Tom Miller AB 0.25 7 Bull Creek B 0.12 6 Emma Long B 0.08 4 Selma Hughes
Chromium A 17.0 8 Tom Miller B 9.1 6 Bull Creek BC 4.7 7 Emma Long C 4.1 6 Selma Hughes
Copper A 15.4 9 Tom Miller B 9.3 7 Bull Creek C 4.0 7 Emma Long C 3.5 6 Selma Hughes
Lead A 19.1 8 Tom Miller A 14.3 6 Bull Creek B 4.1 7 Emma Long B 3.4 6 Selma Hughes
Nickel A 15.9 4 Tom Miller B 9.9 5 Bull Creek C 3.7 3 Emma Long C 1.7 4 Selma Hughes
Zinc A 62.5 8 Tom Miller B 36.1 7 Bull Creek C 13.1 7 Emma Long C 12.3 5 Selma Hughes
DDD A 4.7 5 Tom Miller B 0.5 3 Bull Creek
DDE A 6.6 5 Tom Miller B 2.3 6 Bull Creek B 0.5 3 Emma Long B 0.2 4 Selma Hughes
PAH A 736 9 Bull Creek AB 398 7 Tom Miller B 159 4 Selma Hughes B 100 4 Emma Long
SR-10-14 Page 9 of 30 September 2010
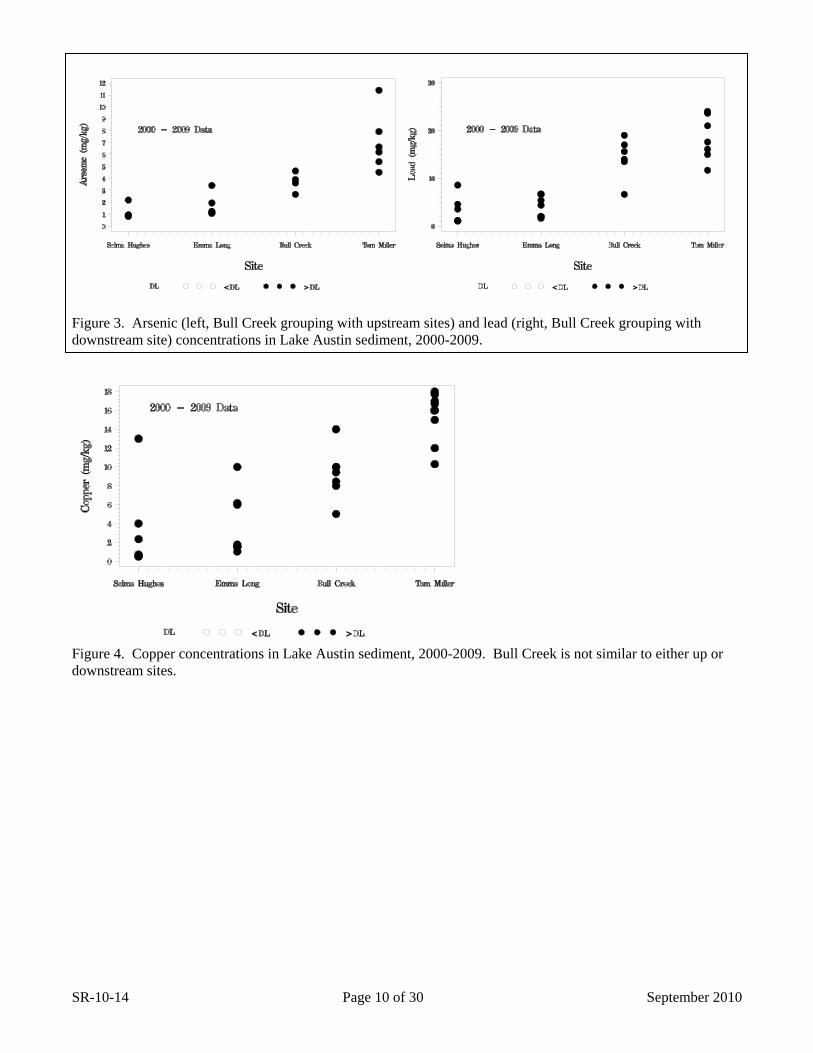
Figure 3. Arsenic (left, Bull Creek grouping with upstream sites) and lead (right, Bull Creek grouping with downstream site) concentrations in Lake Austin sediment, 2000-2009.
Figure 4. Copper concentrations in Lake Austin sediment, 2000-2009. Bull Creek is not similar to either up or downstream sites.
SR-10-14 Page 10 of 30 September 2010

Exceeds the TEC of 1610 ug/kg
Figure 5. Total PAH concentrations in Lake Austin sediment, 2000-2009. PAH has a TEC of 1610 ug/kg. Sediment Toxicity In order to focus on the most recent conditions, assessment of sediment toxicity was performed using data since 2001, when sampling was initiated at the four most representative sites. The standard used to define toxicity in this analysis is the Threshold Effects Concentration (TEC), below which adverse effects to aquatic life are not expected to occur (MacDonald et. al., 2000). During this period, Lake Austin sediment was not characterized by highly toxic components, as there were only four parameters (and seven values) exceeding any TEC, shown in Table 13. Three of those four (arsenic, DDD, DDE) occurred at Tom Miller, while the fourth, TPAH, was at Bull Creek, where the July 2004 TPAH value was only slightly above the TEC of 1610 ug/kg. Table 13. Lake Austin sediment parameters with values over the TEC from 2001-2009.
Parameter # exceedances Location TEC Arsenic 1 Tom Miller 9.79 mg/kg DDD 1 Tom Miller 4.88 ug/kg DDE 4 Tom Miller 3.16 ug/kg TPAH 1 Bull Creek 1610 ug/kg Chlordane 1 Tom Miller 3.24 ug/kg
Graphs of these four parameters are shown in Figures 6-9 (arsenic, DDD, DDE, TPAH respectively) with all data since 1985 included for historic comparison purposes. Additional temporal graphs of all parameters are provided in Appendix C, where TEC values are also included for all parameters.
SR-10-14 Page 11 of 30 September 2010

Figure 6. Arsenic concentrations in Lake Austin sediment, 1987-2009. Horizontal line represents TEC value for arsenic of 9.79 mg/kg.
Figure 7. DDD concentrations in Lake Austin sediment, 1987-2009. Horizontal line represents TEC value for DDD of 4.88 ug/kg.
SR-10-14 Page 12 of 30 September 2010

Figure 8. DDE concentrations in Lake Austin sediment, 1985-2009. Horizontal line represents TEC value for DDE of 3.16 ug/kg.
Figure 9. Total PAH concentrations in Lake Austin sediment, 1985-2009. Horizontal line represents TEC value for PAH of 1610 µg/kg. Conclusions The following conclusions were derived from the analyses of Lake Austin sediment data:
• Sediment quality on Lake Austin does not show significant degradation over the entire period of record, with many parameters showing no change, and some metals and herbicides significantly decreasing over time. While many pesticides, herbicides, and PCBs had detectable values during the study, only seven parameters showed any lake-wide significant temporal trend. All lake-wide trends were decreasing, and all but chlordane produced this trend as a result of data collected prior to 1990. At least in the case of chromium and mercury, this may indicate an improvement in analysis techniques in the past 20 years, as
SR-10-14 Page 13 of 30 September 2010

non-detects were set to one-half the detection limit, and detection limits have improved (decreased) over time.
• Since 2001, no parameters have shown any lake-wide change except for chlordane. Chlordane was detected in 2003 and 2004 and has been below detection from 2005-2009. This most recent period of non-detects may be due to scouring floods (two significant floods have occurred since 2001) removing sediment from the lake.
• Site specific analysis shows a similar pattern, with only five metals showing any temporal trend. Of these, only copper and zinc trends are a result of more recent data, other trends appear to be from data collected prior to 1990. Copper and zinc are both increasing over time, and only at Tom Miller. The reasons for this increase are not clear, although copper could be a result of a possible (but not documented) increase in copper-based herbicide use since 1999, when hydrilla was first documented in the lake. It is important to note that even with this increase the maximum value reported is well below the TEC for both parameters.
• Spatially, concentrations of parameters generally increased with downstream location, as the most downstream site, Tom Miller had the significantly highest mean for most parameters showing spatial differences. This is to be expected, as there is increasing, and more long-established, residential development towards the downstream end of the lake. In addition, sediment (and associated contaminants) is transported downstream during high flow events and deposited in deeper, slower water near the dam, so the most downstream site becomes the repository for contaminants.
• The Bull Creek site, located between the upper and the lower sites, was often a ‘transition’ site, either sharing significant means with the upper sites or with Tom Miller, except for PAHs. This fits with the pattern of longitudinal increase noted above.
• The upper sites, Selma Hughes and Emma Long, were not significantly different from each other, and always had means well below the other two more downstream sites. This could be in part due to their location in the upper, less developed portion of the watershed, but also a function of the sediment characteristics. Both these sites were dominated by sand, with very little clay or silt, providing little substrate for contaminant adherence. In addition, the upper end of the watershed typically experiences more scouring flows during flood events, as extremely high velocity water moves in from the upstream dam, and less sediment was available at these sites during many sampling events.
• PAHs show a unique pattern from other parameters, with Bull Creek having a significantly higher mean than all other sites, and a single exceedance of the TEC. The site is located at the confluence with the lake’s only major tributary (Bull Creek), which has a large drainage area with ongoing urban development, possibly a contributing factor in these higher PAH values.
• Sediment toxicity is generally low on Lake Austin, with only four parameters (arsenic, DDD, DDE, and PAH) showing any exceedences of TEC. None of these parameters were shown to be increasing over time.
Recommendations
• Drop parameters that have no detectable data during the study: o All data from silver, aldrin, alpha-chlordane, gamma chlordane and technical chlordane and
diazinon were below detection limits during the period of record, and should be considered for deletion from future parameter lists, unless detection limits improve or conditions change that may increase these parameters.
o Consider dropping other parameters with detected, but very low values (i.e., DDT, PCBs) • Drop sites that show no significant trends or provide limited information
o Upper sites (Selma Hughes, Emma Long) show no significant difference from each other and were always lower in value than the lower end sites. Bull Creek only showed a significant difference from all other sites for PAHs, while Tom Miller Dam consistently showed higher levels of detected constituents, and was significantly different from all other sites. It is recommended that only Tom Miller Dam be included in future monitoring efforts. Any changes in Bull Creek sediment quality can be addressed by the Environmental Integrity Index creek
SR-10-14 Page 14 of 30 September 2010
sampling program, which includes sediment sampling at a creek mouth site that has also shown significantly high levels of PAHs.
• Continue annual sampling at Tom Miller Dam, with a limited parameter set, based on need to maintain continuity with long history of sampling even with non-detects and very low values for some detected parameters.
References MacDonald, D. D., and C.G. Ingersoll, T. A. Berger. 2000. Development and Evaluation of Consensus-Based Sediment Quality Guidelines for Freshwater Ecosystems. Archives of Environmental Contamination and Toxicology 39: 20-31.
SR-10-14 Page 15 of 30 September 2010
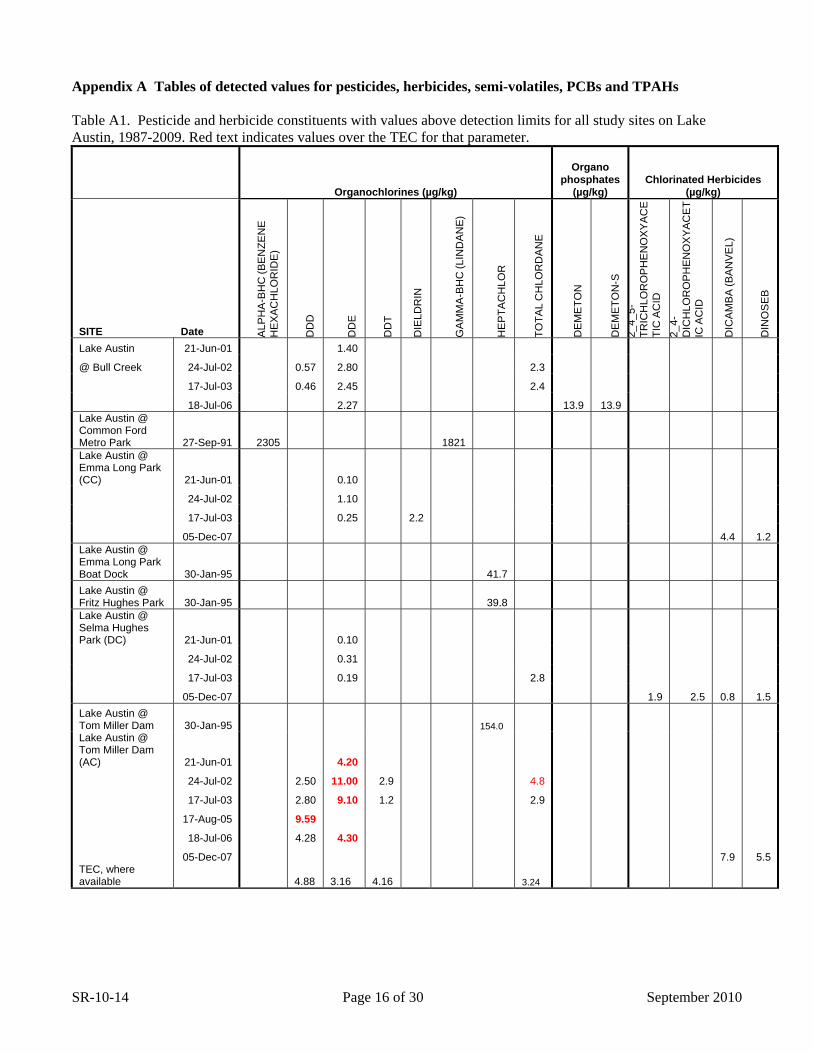
Appendix A Tables of detected values for pesticides, herbicides, semi-volatiles, PCBs and TPAHs Table A1. Pesticide and herbicide constituents with values above detection limits for all study sites on Lake Austin, 1987-2009. Red text indicates values over the TEC for that parameter.
Organochlorines (µg/kg)
Organo phosphates
(µg/kg) Chlorinated Herbicides
(µg/kg)
SITE Date ALP
HA
-BH
C (B
EN
ZEN
E
HE
XA
CH
LOR
IDE
)
DD
D
DD
E
DD
T
DIE
LDR
IN
GA
MM
A-B
HC
(LIN
DA
NE
)
HE
PTA
CH
LOR
TOTA
L C
HLO
RD
AN
E
DE
ME
TON
DE
ME
TON
-S
2_4_
5-TR
ICH
LOR
OP
HE
NO
XY
AC
ETI
C A
CID
2_
4-D
ICH
LOR
OP
HE
NO
XY
AC
ET
IC A
CID
DIC
AM
BA
(BA
NV
EL)
DIN
OS
EB
Lake Austin 21-Jun-01 1.40
@ Bull Creek 24-Jul-02 0.57 2.80 2.3
17-Jul-03 0.46 2.45 2.4
18-Jul-06 2.27 13.9 13.9 Lake Austin @ Common Ford Metro Park 27-Sep-91 2305 1821 Lake Austin @ Emma Long Park (CC) 21-Jun-01 0.10
24-Jul-02 1.10
17-Jul-03 0.25 2.2
05-Dec-07 4.4 1.2 Lake Austin @ Emma Long Park Boat Dock 30-Jan-95 41.7 Lake Austin @ Fritz Hughes Park 30-Jan-95 39.8 Lake Austin @ Selma Hughes Park (DC) 21-Jun-01 0.10
24-Jul-02 0.31
17-Jul-03 0.19 2.8
05-Dec-07 1.9 2.5 0.8 1.5 Lake Austin @ Tom Miller Dam 30-Jan-95 154.0 Lake Austin @ Tom Miller Dam (AC) 21-Jun-01 4.20
24-Jul-02 2.50 11.00 2.9 4.8
17-Jul-03 2.80 9.10 1.2 2.9
17-Aug-05 9.59
18-Jul-06 4.28 4.30
05-Dec-07 7.9 5.5 TEC, where available 4.88 3.16 4.16 3.24
SR-10-14 Page 16 of 30 September 2010

Table A2 Semi-Volatiles with values above detection limit for all study sites, Lake Austin, 1987-2009.
Semi-Volatiles (µg/Kg)
SITE DATE 1_2-
DIM
ETH
YL
NA
PH
THA
LEN
E
1_6-
DIM
ETH
YL
NA
PH
THA
LEN
E
2_3_
6-TR
IME
THY
L N
AP
HTH
ALE
NE
2-E
THY
L N
AP
HTH
ALE
NE
4-M
ETH
YL
PH
EN
OL
(P-C
RE
SO
L)
PE
NTA
CH
LOR
OP
HE
NO
L
PH
EN
OL
Lake Austin @ Bull Creek (BC) 21-Jun-01 2.4 40.0 7.2
24-Jul-02 2.9 1.2 0.7 20.7 5.9
17-Jul-03 6.3 1.6
Lake Austin @ Emma Long Park (CC) 21-Jun-01 1.5 19.0 3.7
24-Jul-02 2.2 1.0 0.6 5.9 2.2
17-Jul-03 4.2 1.0 Lake Austin @ Selma Hughes Park (DC) 21-Jun-01 3.1 4.8 183.0 11.6
24-Jul-02 4.6 22.4 6.1
17-Jul-03 6.6 1.3
05-Dec-07 5.1
Lake Austin @ Tom Miller Dam (AC) 21-Jun-01 2.2 2.6 0.7 11.2 3.8
24-Jul-02 1.7 16.2 5.4
17-Jul-03 11.7 2.2
Table A3 Polychlorinated biphenyls (PCBs) with values above detection limit on all study sites, Lake Austin. 1987-2009.
SITE DATE AR
OC
LOR
125
4
AR
OC
LOR
126
0
PO
LYC
HLO
RIN
ATE
D
BIP
HE
NY
L (P
CB
)
Lake Austin @ Bull Creek (BC) 21-Jun-01 7.0 1.8 8.8
24-Jul-02 16.0 3.8 19.8
17-Jul-03 5.8
Lake Austin @ Emma Long Park (CC) 21-Jun-01 10.0
SR-10-14 Page 17 of 30 September 2010

SR-10-14 Page 18 of 30 September 2010
Table A4 TPAH (COA method combining 16 parent PAHs), including data below detection limits, all study sites, Lake Austin, 1991-2009. Yellow shaded results indicate high detection limits of LCRA laboratory, with only one value above detection limit. (in red, Bull Creek, 8/9/2004)
Site # Site Name Lab Qual Result Units Date Sampled
512 Lake Austin @ Fritz Hughes Park LCRA < 41600 UG/KG 1/30/1995 559 Lake Austin @ Selma Hughes Park (DC) USGS 190 UG/KG 6/21/2001 559 Lake Austin @ Selma Hughes Park (DC) USGS 198 UG/KG 7/24/2002 559 Lake Austin @ Selma Hughes Park (DC) USGS 148 UG/KG 7/24/2002 559 Lake Austin @ Selma Hughes Park (DC) USGS 100 UG/KG 7/17/2003 559 Lake Austin @ Selma Hughes Park (DC) DHL < 162 UG/KG 8/11/2005 559 Lake Austin @ Selma Hughes Park (DC) DHL < 133 UG/KG 7/18/2006 559 Lake Austin @ Selma Hughes Park (DC) DHL < 162 UG/KG 12/5/2007 559 Lake Austin @ Selma Hughes Park (DC) DHL < 319 UG/KG 5/11/2009 218 Lake Austin @ Common Ford Metro Park LCRA < 73600 UG/KG 9/27/1991 573 Lake Austin @ Emma Long Park (CC) LCRA < 16240 UG/KG 1/30/1995 573 Lake Austin @ Emma Long Park (CC) USGS 50 UG/KG 6/21/2001 573 Lake Austin @ Emma Long Park (CC) USGS 156 UG/KG 7/24/2002 573 Lake Austin @ Emma Long Park (CC) USGS 125 UG/KG 7/17/2003 573 Lake Austin @ Emma Long Park (CC) LCRA < 3488 UG/KG 8/9/2004 573 Lake Austin @ Emma Long Park (CC) DHL < 165 UG/KG 8/11/2005 573 Lake Austin @ Emma Long Park (CC) DHL < 131 UG/KG 7/18/2006 573 Lake Austin @ Emma Long Park (CC) DHL 70 UG/KG 12/5/2007 573 Lake Austin @ Emma Long Park (CC) DHL < 313 UG/KG 5/11/2009 562 Lake Austin @ Bull Creek (BC) USGS 755 UG/KG 6/21/2001 562 Lake Austin @ Bull Creek (BC) USGS 563 UG/KG 7/24/2002 562 Lake Austin @ Bull Creek (BC) USGS 667 UG/KG 7/17/2003 562 Lake Austin @ Bull Creek (BC) USGS 747 UG/KG 7/17/2003 562 Lake Austin @ Bull Creek (BC) LCRA 1650 UG/KG 8/9/2004 562 Lake Austin @ Bull Creek (BC) DHL 411 UG/KG 8/11/2005 562 Lake Austin @ Bull Creek (BC) DHL 529 UG/KG 7/18/2006 562 Lake Austin @ Bull Creek (BC) DHL 775 UG/KG 5/11/2009 561 Lake Austin @ Tom Miller Dam LCRA < 18640 UG/KG 1/30/1995 561 Lake Austin @ Tom Miller Dam (AC) USGS 352 UG/KG 6/21/2001 561 Lake Austin @ Tom Miller Dam (AC) USGS 846 UG/KG 7/24/2002 561 Lake Austin @ Tom Miller Dam (AC) USGS 896 UG/KG 7/17/2003 561 Lake Austin @ Tom Miller Dam (AC) LCRA < 8528 UG/KG 8/9/2004 561 Lake Austin @ Tom Miller Dam (AC) DHL 43 UG/KG 7/18/2006 561 Lake Austin @ Tom Miller Dam (AC) DHL 237 UG/KG 12/5/2007 561 Lake Austin @ Tom Miller Dam (AC) DHL 368 UG/KG 5/11/2009
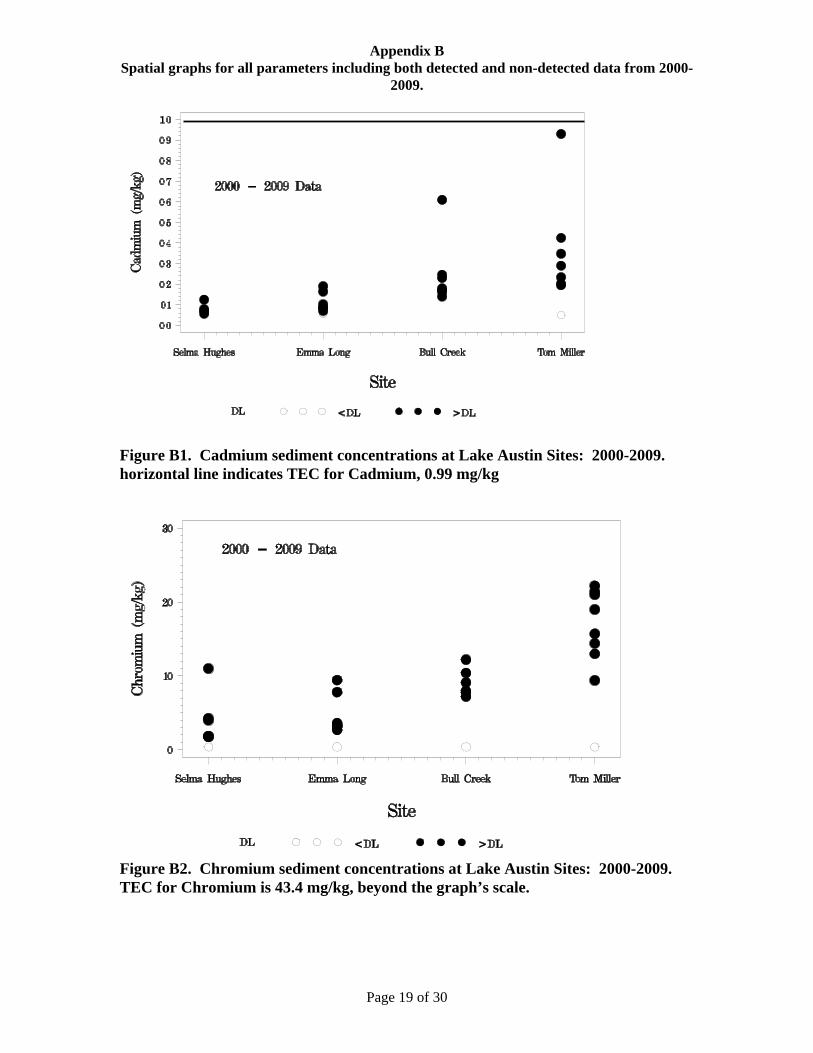
Appendix B Spatial graphs for all parameters including both detected and non-detected data from 2000-
2009.
Figure B1. Cadmium sediment concentrations at Lake Austin Sites: 2000-2009. horizontal line indicates TEC for Cadmium, 0.99 mg/kg
Figure B2. Chromium sediment concentrations at Lake Austin Sites: 2000-2009. TEC for Chromium is 43.4 mg/kg, beyond the graph’s scale.
Page 19 of 30
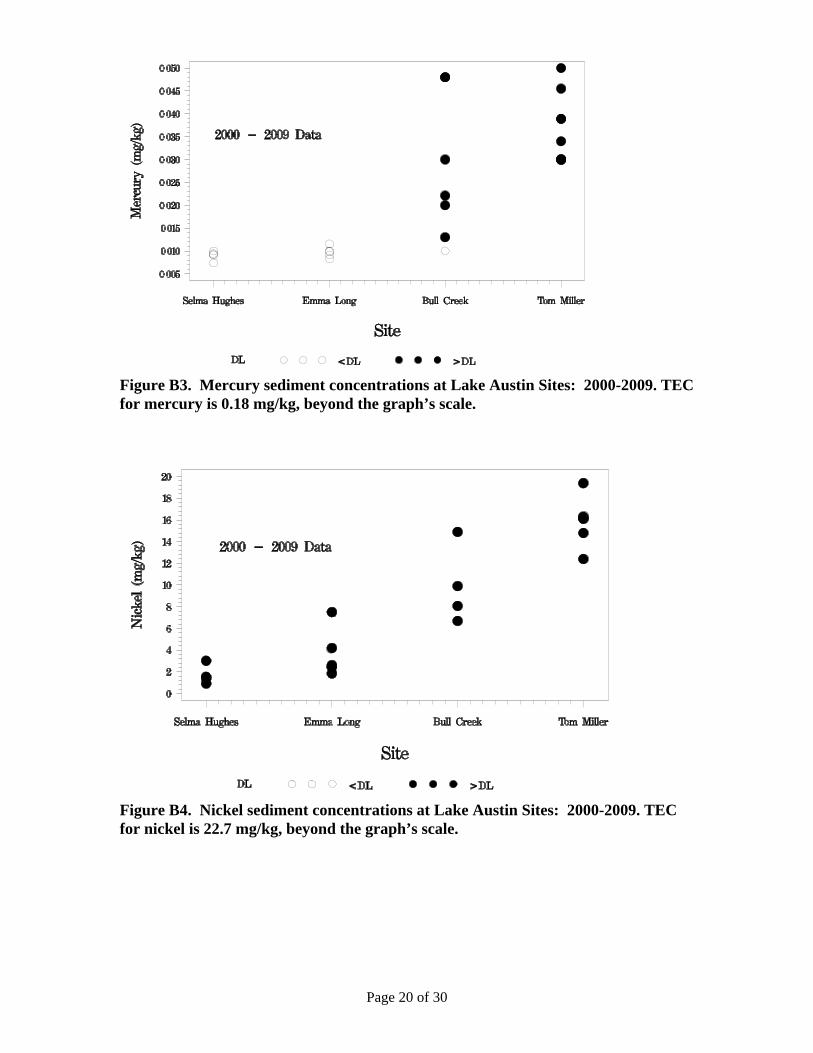
Figure B3. Mercury sediment concentrations at Lake Austin Sites: 2000-2009. TEC for mercury is 0.18 mg/kg, beyond the graph’s scale.
Figure B4. Nickel sediment concentrations at Lake Austin Sites: 2000-2009. TEC for nickel is 22.7 mg/kg, beyond the graph’s scale.
Page 20 of 30
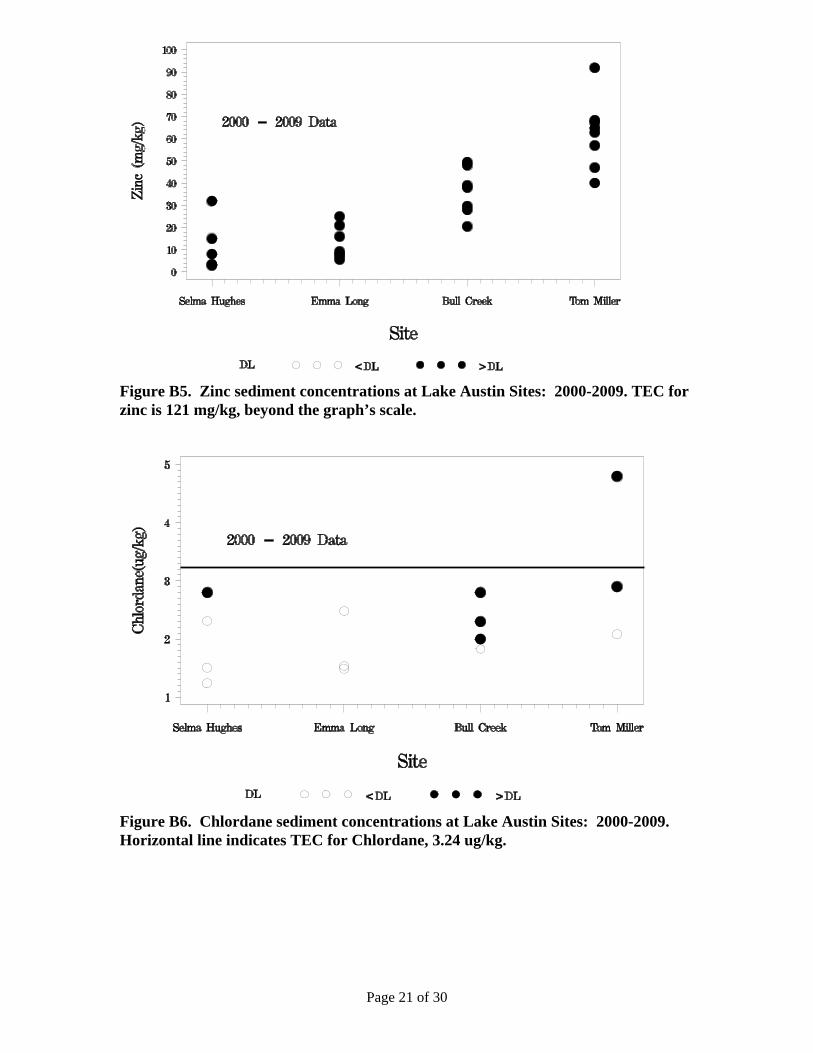
Figure B5. Zinc sediment concentrations at Lake Austin Sites: 2000-2009. TEC for zinc is 121 mg/kg, beyond the graph’s scale.
Figure B6. Chlordane sediment concentrations at Lake Austin Sites: 2000-2009. Horizontal line indicates TEC for Chlordane, 3.24 ug/kg.
Page 21 of 30

Figure B6. DDD sediment concentrations at Lake Austin Sites: 2000-2009. The horizontal line indicates the TEC for DDD, 4.88 ug/kg.
Figure B6. DDE sediment concentrations at Lake Austin Sites: 2000-2009. The horizontal line indicates the TEC for DDE, 3.16 ug/kg.
Page 22 of 30
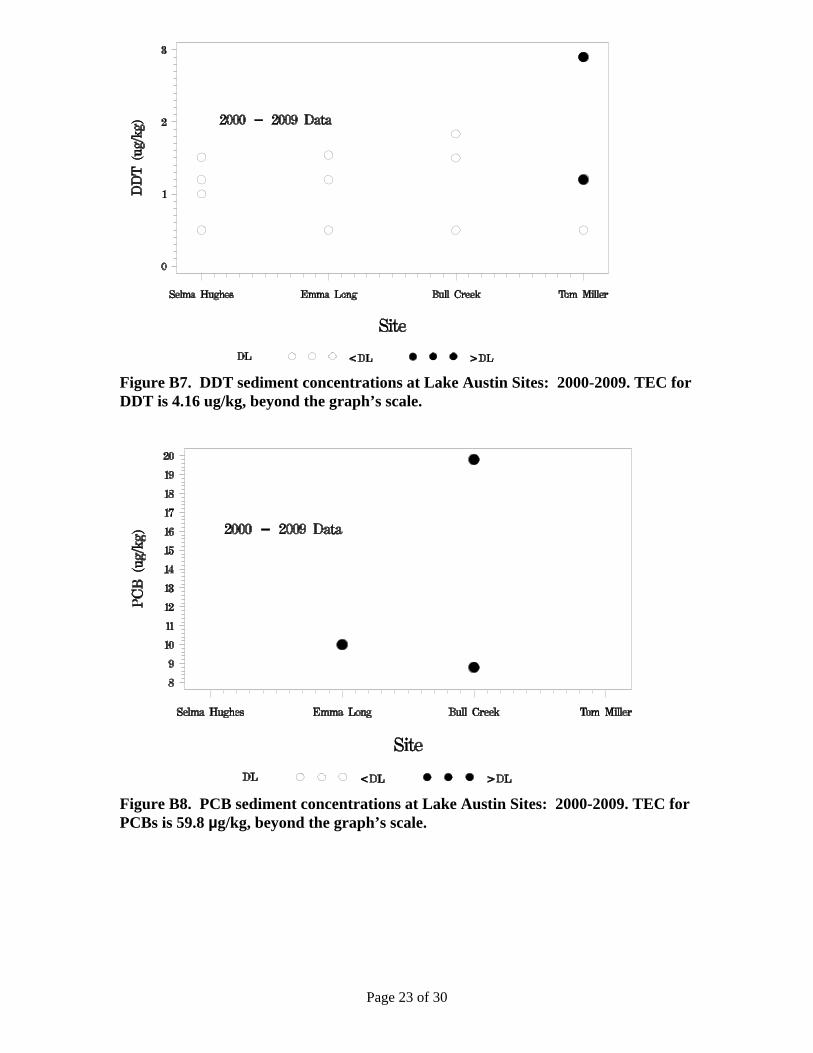
Figure B7. DDT sediment concentrations at Lake Austin Sites: 2000-2009. TEC for DDT is 4.16 ug/kg, beyond the graph’s scale.
Figure B8. PCB sediment concentrations at Lake Austin Sites: 2000-2009. TEC for PCBs is 59.8 µg/kg, beyond the graph’s scale.
Page 23 of 30

Appendix C Temporal graphs by parameter, detected values only
Figure C1. Arsenic sediment concentrations in Lake Austin. Horizontal line indicates TEC value.
Figure C2. Cadmium sediment concentrations in Lake Austin. Horizontal line indicates TEC value.
Page 24 of 30

Figure C3. Chromium sediment concentrations in Lake Austin. Horizontal line indicates TEC value.
Page 25 of 30

Figure C4. Copper sediment concentrations in Lake Austin. TEC for copper is 31.6 mg/kg, beyond scale of graph.
Figure C5. Lead sediment concentrations in Lake Austin. Horizontal line indicates TEC value.
Figure C6. Mercury sediment concentrations in Lake Austin. Horizontal line indicates TEC for mercury, 0.18 mg/kg.
Page 26 of 30

Figure C7. Nickel sediment concentrations in Lake Austin. TEC for nickel is 22.7 mg/kg, beyond the scale of the graph.
Figure C8. Zinc sediment concentrations in Lake Austin. TEC for zinc is 121 mg/kg, beyond the scale of the graph.
Page 27 of 30
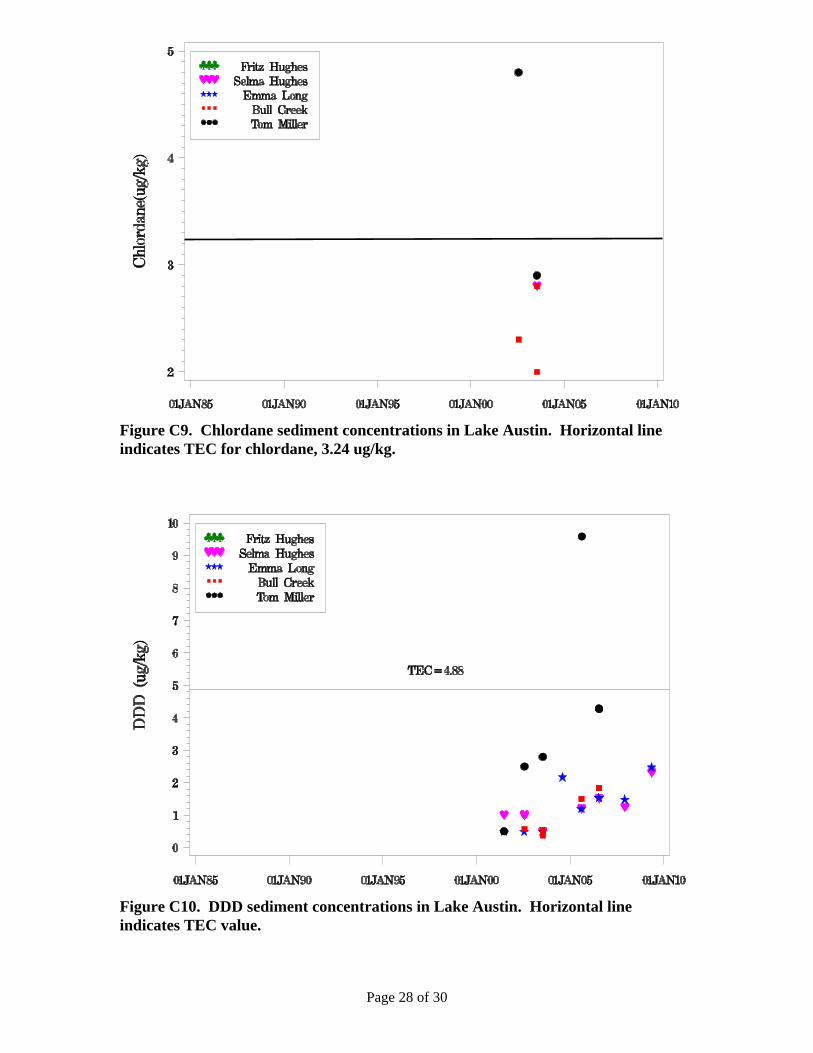
Figure C9. Chlordane sediment concentrations in Lake Austin. Horizontal line indicates TEC for chlordane, 3.24 ug/kg.
Figure C10. DDD sediment concentrations in Lake Austin. Horizontal line indicates TEC value.
Page 28 of 30

Figure C11. DDE sediment concentrations in Lake Austin. Horizontal line indicates TEC value.
Figure C12. DDT sediment concentrations in Lake Austin. TEC value for DDT is 4.18 ug/kg, beyond the scale of the graph.
Page 29 of 30

Figure C13. Total PAH sediment concentrations in Lake Austin. The horizontal line indicates TEC value.
Figure C14. PCB sediment concentrations in Lake Austin. The TEC value for PCBs is 59.8 ug/kg, beyond the scale of the graph.
Page 30 of 30