
A Review of International Shared Service Centre/BPO Locations (Based on information from the...
21
A Review of International Shared Service Centre/BPO Locations (Based on information from the Financial Times fDi Benchmark tool, April 2012)
-
Upload
august-lester -
Category
Documents
-
view
216 -
download
0
Transcript of A Review of International Shared Service Centre/BPO Locations (Based on information from the...

A Review of International Shared Service Centre/BPO Locations(Based on information from the Financial Times fDi Benchmark tool, April 2012)
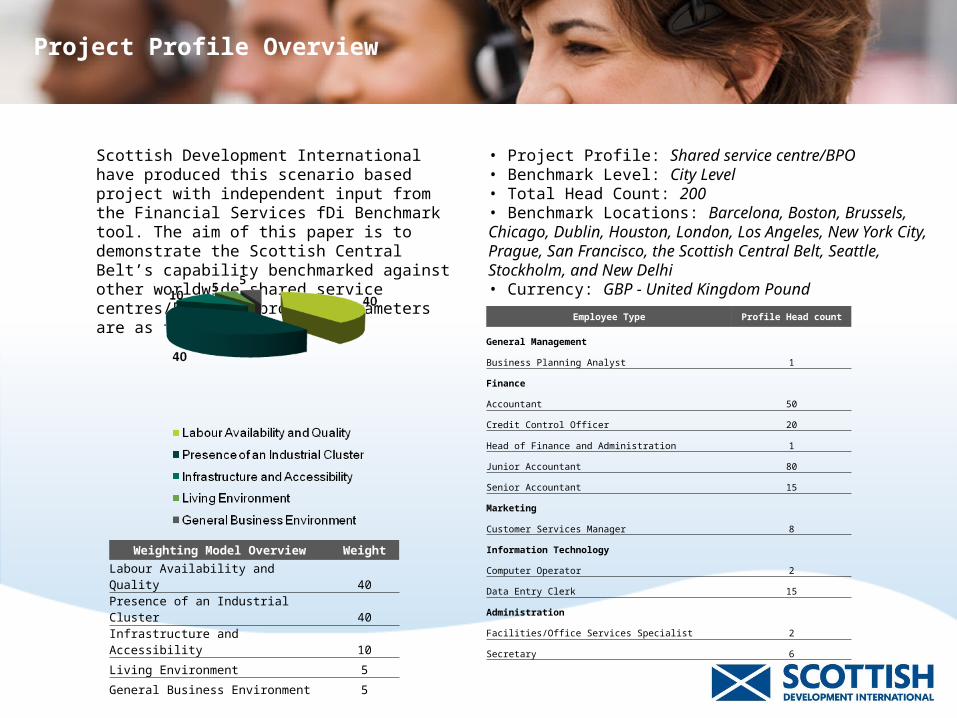
Project Profile Overview
Employee Type Profile Head count
General Management
Business Planning Analyst 1
Finance
Accountant 50
Credit Control Officer 20
Head of Finance and Administration 1
Junior Accountant 80
Senior Accountant 15
Marketing
Customer Services Manager 8
Information Technology
Computer Operator 2
Data Entry Clerk 15
Administration
Facilities/Office Services Specialist 2
Secretary 6
Weighting Model Overview Weight
Labour Availability and Quality 40
Presence of an Industrial Cluster 40
Infrastructure and Accessibility 10
Living Environment 5
General Business Environment 5
• Project Profile: Shared service centre/BPO• Benchmark Level: City Level • Total Head Count: 200• Benchmark Locations: Barcelona, Boston, Brussels, Chicago, Dublin, Houston, London, Los Angeles, New York City, Prague, San Francisco, the Scottish Central Belt, Seattle, Stockholm, and New Delhi• Currency: GBP - United Kingdom Pound
Scottish Development International have produced this scenario based project with independent input from the Financial Services fDi Benchmark tool. The aim of this paper is to demonstrate the Scottish Central Belt’s capability benchmarked against other worldwide shared service centres/BPO. The project parameters are as follows:
fDi Benchmark Matrix
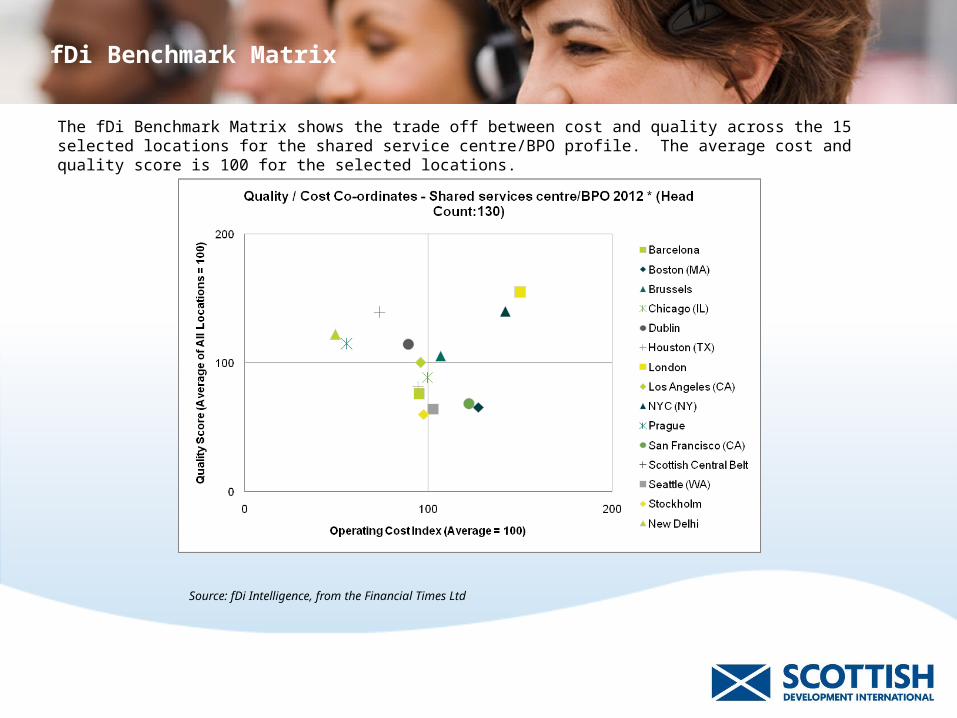
The fDi Benchmark Matrix shows the trade off between cost and quality across the 15 selected locations for the shared service centre/BPO profile. The average cost and quality score is 100 for the selected locations.
Source: fDi Intelligence, from the Financial Times Ltd
fDi Benchmark Matrix
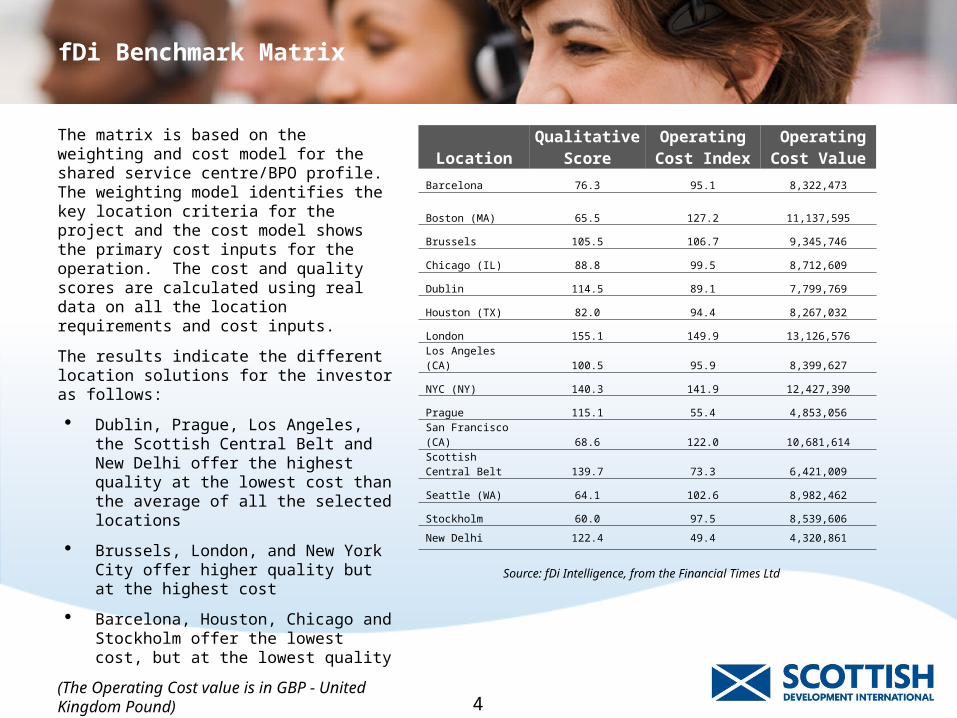
The matrix is based on the weighting and cost model for the shared service centre/BPO profile. The weighting model identifies the key location criteria for the project and the cost model shows the primary cost inputs for the operation. The cost and quality scores are calculated using real data on all the location requirements and cost inputs.
The results indicate the different location solutions for the investor as follows:
· Dublin, Prague, Los Angeles, the Scottish Central Belt and New Delhi offer the highest quality at the lowest cost than the average of all the selected locations
· Brussels, London, and New York City offer higher quality but at the highest cost
· Barcelona, Houston, Chicago and Stockholm offer the lowest cost, but at the lowest quality
(The Operating Cost value is in GBP - United Kingdom Pound)
LocationQualitative
ScoreOperating Cost Index
Operating Cost Value
Barcelona 76.3 95.1 8,322,473
Boston (MA) 65.5 127.2 11,137,595
Brussels 105.5 106.7 9,345,746
Chicago (IL) 88.8 99.5 8,712,609
Dublin 114.5 89.1 7,799,769
Houston (TX) 82.0 94.4 8,267,032
London 155.1 149.9 13,126,576
Los Angeles (CA) 100.5 95.9 8,399,627
NYC (NY) 140.3 141.9 12,427,390
Prague 115.1 55.4 4,853,056
San Francisco (CA) 68.6 122.0 10,681,614Scottish Central Belt 139.7 73.3 6,421,009
Seattle (WA) 64.1 102.6 8,982,462
Stockholm 60.0 97.5 8,539,606
New Delhi 122.4 49.4 4,320,861
4
Source: fDi Intelligence, from the Financial Times Ltd
Location Attractiveness Index
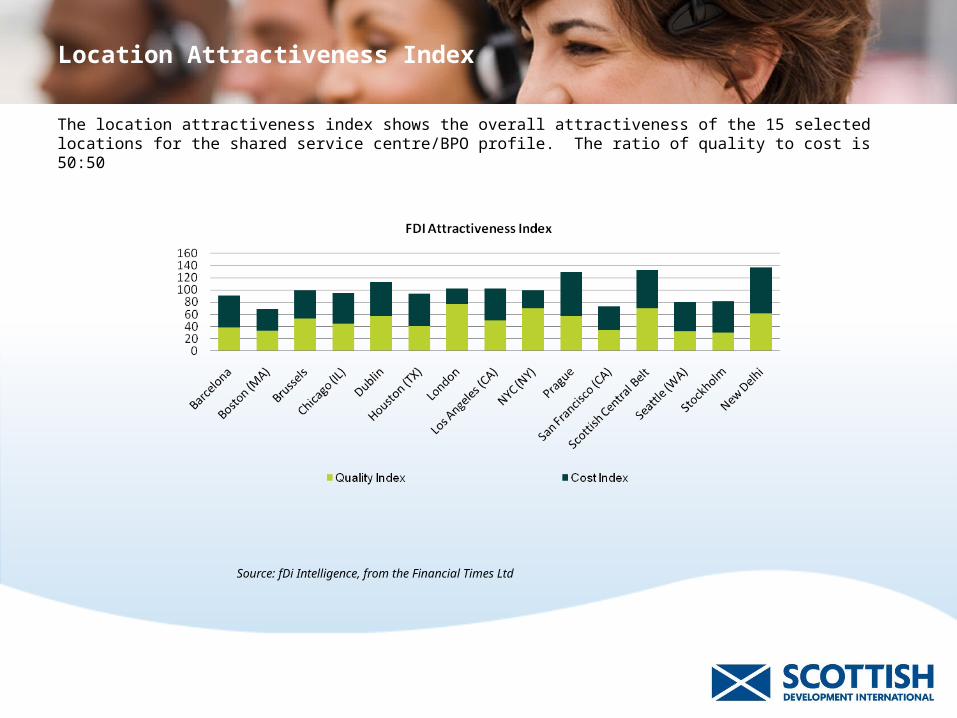
The location attractiveness index shows the overall attractiveness of the 15 selected locations for the shared service centre/BPO profile. The ratio of quality to cost is 50:50
Source: fDi Intelligence, from the Financial Times Ltd
Cost Quality Competitiveness
Source: fDi Intelligence, from the Financial Times Ltd
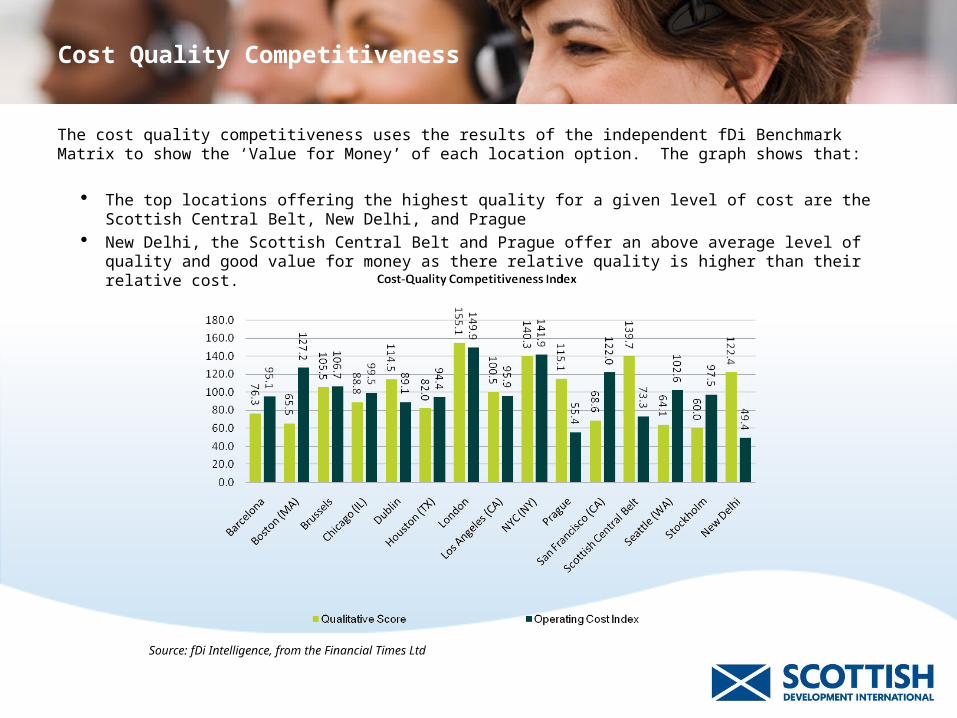
The cost quality competitiveness uses the results of the independent fDi Benchmark Matrix to show the ‘Value for Money’ of each location option. The graph shows that:
· The top locations offering the highest quality for a given level of cost are the Scottish Central Belt, New Delhi, and Prague
· New Delhi, the Scottish Central Belt and Prague offer an above average level of quality and good value for money as there relative quality is higher than their relative cost.
Cost Competitiveness
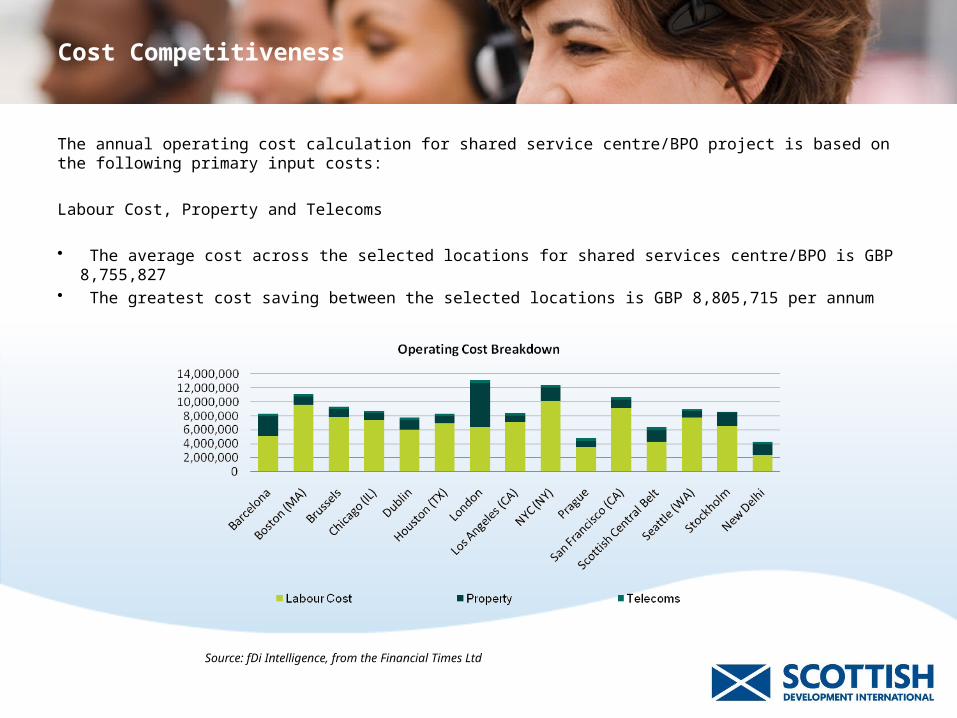
The annual operating cost calculation for shared service centre/BPO project is based on the following primary input costs:
Labour Cost, Property and Telecoms
• The average cost across the selected locations for shared services centre/BPO is GBP 8,755,827• The greatest cost saving between the selected locations is GBP 8,805,715 per annum
Source: fDi Intelligence, from the Financial Times Ltd
Cost Competitiveness
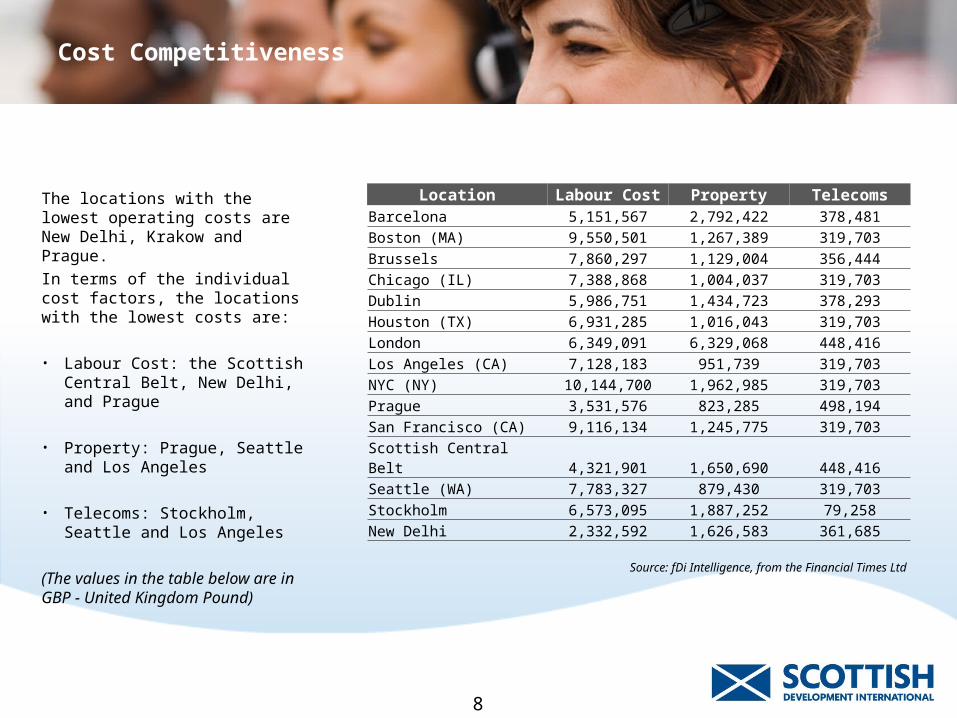
Location Labour Cost Property TelecomsBarcelona 5,151,567 2,792,422 378,481Boston (MA) 9,550,501 1,267,389 319,703Brussels 7,860,297 1,129,004 356,444Chicago (IL) 7,388,868 1,004,037 319,703Dublin 5,986,751 1,434,723 378,293Houston (TX) 6,931,285 1,016,043 319,703London 6,349,091 6,329,068 448,416Los Angeles (CA) 7,128,183 951,739 319,703NYC (NY) 10,144,700 1,962,985 319,703Prague 3,531,576 823,285 498,194San Francisco (CA) 9,116,134 1,245,775 319,703Scottish Central Belt 4,321,901 1,650,690 448,416Seattle (WA) 7,783,327 879,430 319,703Stockholm 6,573,095 1,887,252 79,258New Delhi 2,332,592 1,626,583 361,685
8
The locations with the lowest operating costs are New Delhi, Krakow and Prague.
In terms of the individual cost factors, the locations with the lowest costs are:
• Labour Cost: the Scottish Central Belt, New Delhi, and Prague
• Property: Prague, Seattle and Los Angeles
• Telecoms: Stockholm, Seattle and Los Angeles
(The values in the table below are in GBP - United Kingdom Pound)
Source: fDi Intelligence, from the Financial Times Ltd
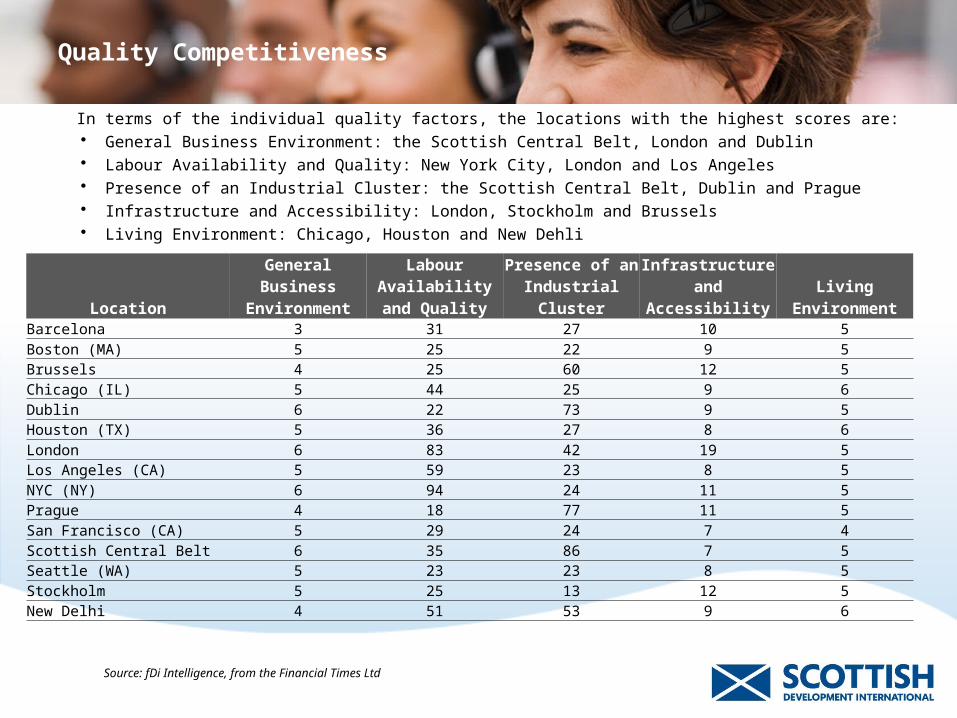
Quality Competitiveness
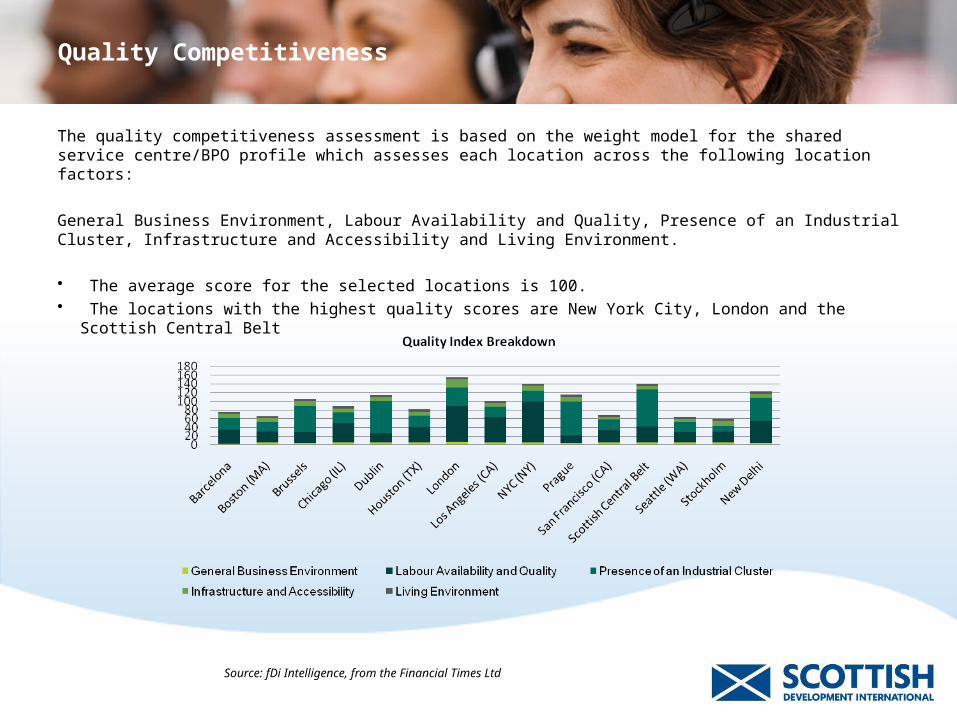
The quality competitiveness assessment is based on the weight model for the shared service centre/BPO profile which assesses each location across the following location factors:
General Business Environment, Labour Availability and Quality, Presence of an Industrial Cluster, Infrastructure and Accessibility and Living Environment.
• The average score for the selected locations is 100.• The locations with the highest quality scores are New York City, London and the Scottish Central Belt
Source: fDi Intelligence, from the Financial Times Ltd
Quality Competitiveness
LocationGeneral Business
Environment
Labour Availability and
QualityPresence of an
Industrial ClusterInfrastructure
and AccessibilityLiving
EnvironmentBarcelona 3 31 27 10 5Boston (MA) 5 25 22 9 5Brussels 4 25 60 12 5Chicago (IL) 5 44 25 9 6Dublin 6 22 73 9 5Houston (TX) 5 36 27 8 6London 6 83 42 19 5Los Angeles (CA) 5 59 23 8 5NYC (NY) 6 94 24 11 5Prague 4 18 77 11 5San Francisco (CA) 5 29 24 7 4Scottish Central Belt 6 35 86 7 5Seattle (WA) 5 23 23 8 5Stockholm 5 25 13 12 5New Delhi 4 51 53 9 6
In terms of the individual quality factors, the locations with the highest scores are:· General Business Environment: the Scottish Central Belt, London and Dublin· Labour Availability and Quality: New York City, London and Los Angeles· Presence of an Industrial Cluster: the Scottish Central Belt, Dublin and Prague· Infrastructure and Accessibility: London, Stockholm and Brussels· Living Environment: Chicago, Houston and New Dehli
Source: fDi Intelligence, from the Financial Times Ltd
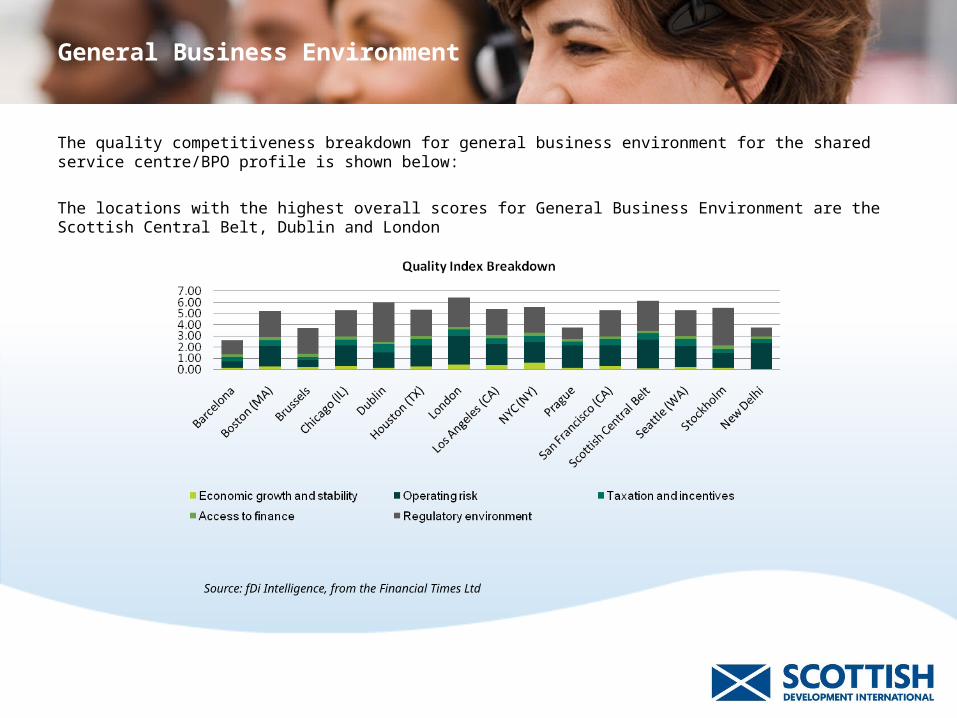
General Business Environment
The quality competitiveness breakdown for general business environment for the shared service centre/BPO profile is shown below:
The locations with the highest overall scores for General Business Environment are the Scottish Central Belt, Dublin and London
Source: fDi Intelligence, from the Financial Times Ltd
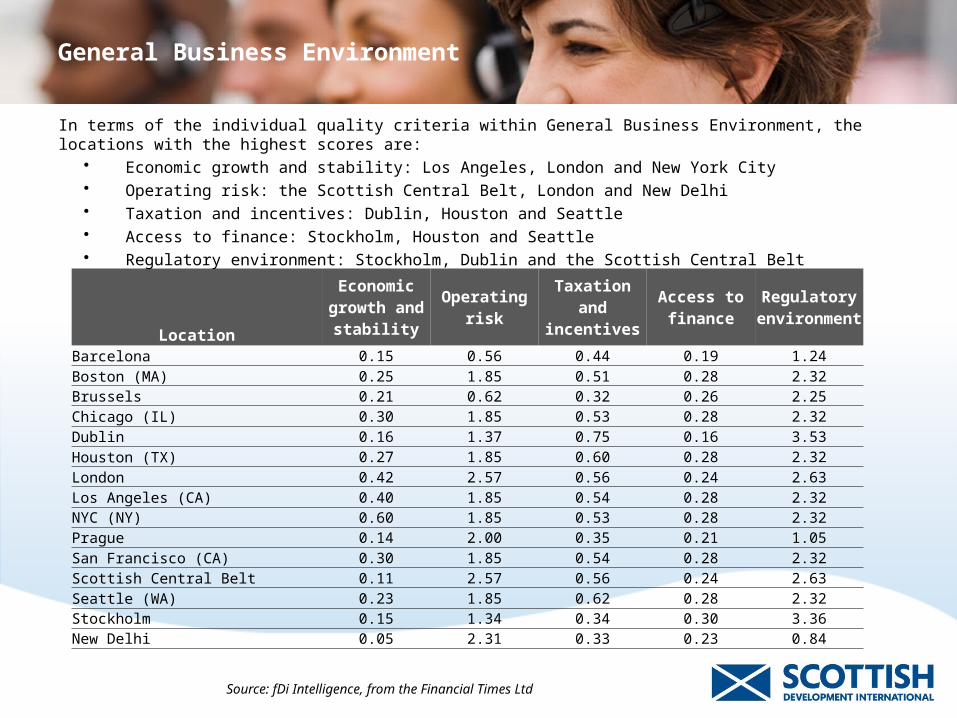
General Business Environment
Location
Economic growth and
stability
Operating risk
Taxation and incentives
Access to finance
Regulatory environment
Barcelona 0.15 0.56 0.44 0.19 1.24
Boston (MA) 0.25 1.85 0.51 0.28 2.32Brussels 0.21 0.62 0.32 0.26 2.25Chicago (IL) 0.30 1.85 0.53 0.28 2.32
Dublin 0.16 1.37 0.75 0.16 3.53
Houston (TX) 0.27 1.85 0.60 0.28 2.32
London 0.42 2.57 0.56 0.24 2.63
Los Angeles (CA) 0.40 1.85 0.54 0.28 2.32NYC (NY) 0.60 1.85 0.53 0.28 2.32Prague 0.14 2.00 0.35 0.21 1.05
San Francisco (CA) 0.30 1.85 0.54 0.28 2.32
Scottish Central Belt 0.11 2.57 0.56 0.24 2.63
Seattle (WA) 0.23 1.85 0.62 0.28 2.32Stockholm 0.15 1.34 0.34 0.30 3.36New Delhi 0.05 2.31 0.33 0.23 0.84
In terms of the individual quality criteria within General Business Environment, the locations with the highest scores are:
• Economic growth and stability: Los Angeles, London and New York City• Operating risk: the Scottish Central Belt, London and New Delhi• Taxation and incentives: Dublin, Houston and Seattle• Access to finance: Stockholm, Houston and Seattle• Regulatory environment: Stockholm, Dublin and the Scottish Central Belt
Source: fDi Intelligence, from the Financial Times Ltd
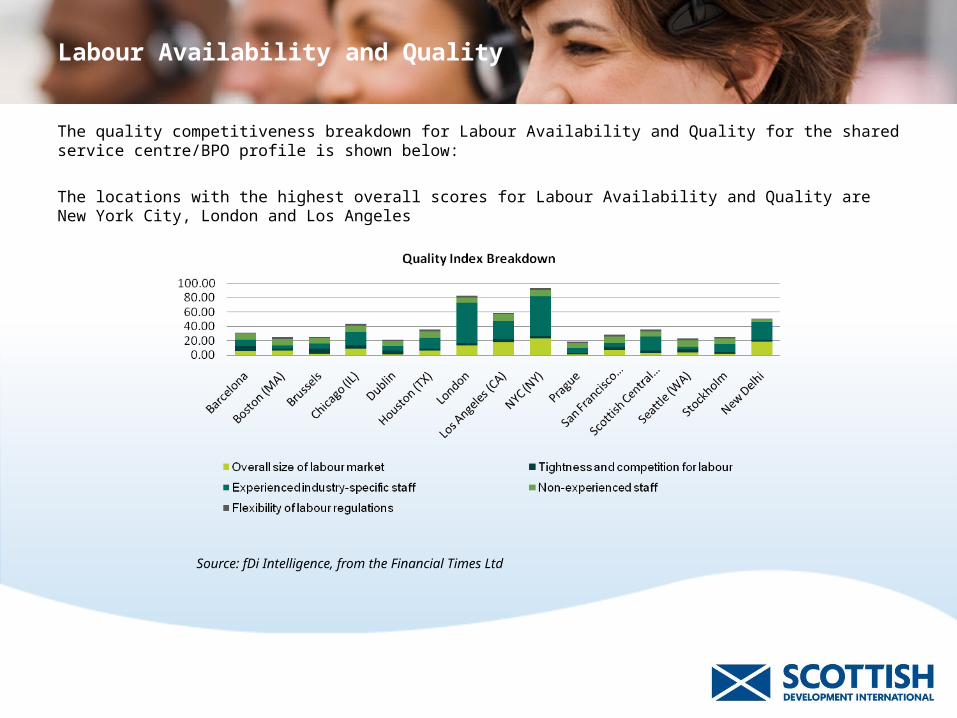
Labour Availability and Quality
The quality competitiveness breakdown for Labour Availability and Quality for the shared service centre/BPO profile is shown below:
The locations with the highest overall scores for Labour Availability and Quality are New York City, London and Los Angeles
Source: fDi Intelligence, from the Financial Times Ltd
Labour Availability and Quality
Location
Overall size of labour market
Tightness and competition for
labour
Experienced industry-
specific staff
Non-experienced
staff
Flexibility of labour
regulations
Barcelona 4.94 7.37 9.44 8.70 1.03
Boston (MA) 6.08 3.05 4.16 9.01 2.51
Brussels 2.24 7.03 6.55 8.04 1.55
Chicago (IL) 9.27 3.74 19.02 9.01 2.51
Dublin 1.22 5.16 5.77 7.94 1.73
Houston (TX) 5.84 3.41 14.88 9.01 2.51
London 13.36 4.03 56.14 7.17 1.94
Los Angeles (CA) 17.71 4.67 25.27 9.01 2.51
NYC (NY) 23.05 3.74 55.53 9.01 2.51
Prague 1.33 1.38 7.13 6.94 1.59
San Francisco (CA) 7.58 4.02 5.50 9.01 2.51
Scottish Central Belt 2.54 3.76 19.97 7.17 1.94
Seattle (WA) 4.00 3.78 4.02 9.01 2.51
Stockholm 1.75 2.80 11.06 7.93 1.14
New Delhi 19.07 2.07 25.56 3.03 1.51
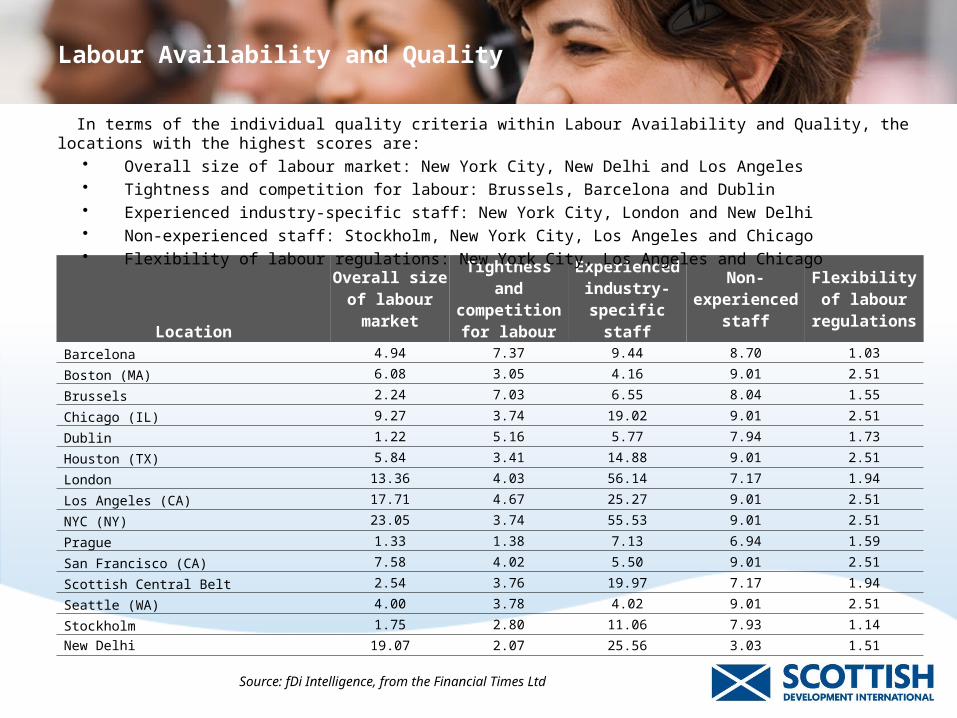
In terms of the individual quality criteria within Labour Availability and Quality, the locations with the highest scores are:• Overall size of labour market: New York City, New Delhi and Los Angeles• Tightness and competition for labour: Brussels, Barcelona and Dublin• Experienced industry-specific staff: New York City, London and New Delhi• Non-experienced staff: Stockholm, New York City, Los Angeles and Chicago• Flexibility of labour regulations: New York City, Los Angeles and Chicago
Source: fDi Intelligence, from the Financial Times Ltd
Presence of an Industrial Cluster
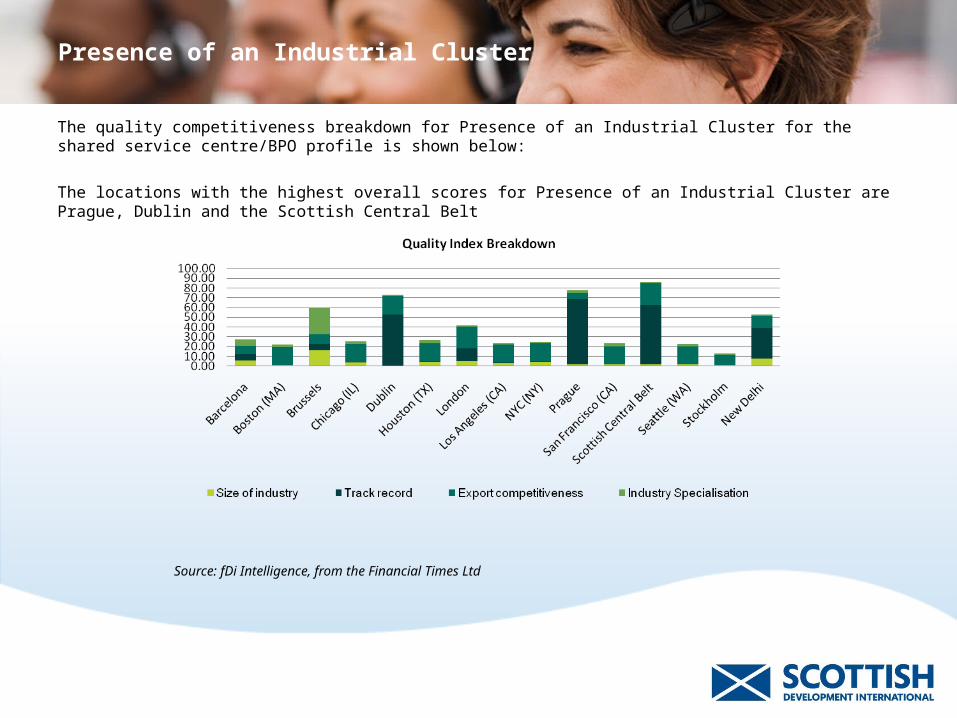
The quality competitiveness breakdown for Presence of an Industrial Cluster for the shared service centre/BPO profile is shown below:
The locations with the highest overall scores for Presence of an Industrial Cluster are Prague, Dublin and the Scottish Central Belt
Source: fDi Intelligence, from the Financial Times Ltd
Presence of an Industrial Cluster
LocationIndustry
SpecialisationSize of industry Track record
Export competitiveness
Barcelona 5.45 7.09 8.24 6.41Boston (MA) 1.41 0.00 18.32 2.56Brussels 16.08 6.55 10.23 27.09Chicago (IL) 4.03 0.27 18.32 2.61Dublin 0.53 52.09 19.47 1.09Houston (TX) 4.15 0.82 18.32 3.33London 4.84 13.64 22.17 1.33Los Angeles (CA) 3.32 0.27 18.32 1.54NYC (NY) 4.43 0.55 18.32 1.08Prague 1.70 67.09 5.98 2.70San Francisco (CA) 1.98 0.00 18.32 3.33Scottish Central Belt 1.89 60.55 22.17 1.47Seattle (WA) 1.58 0.00 18.32 3.10Stockholm 0.88 0.00 10.69 1.06New Delhi 7.73 31.09 12.84 1.30
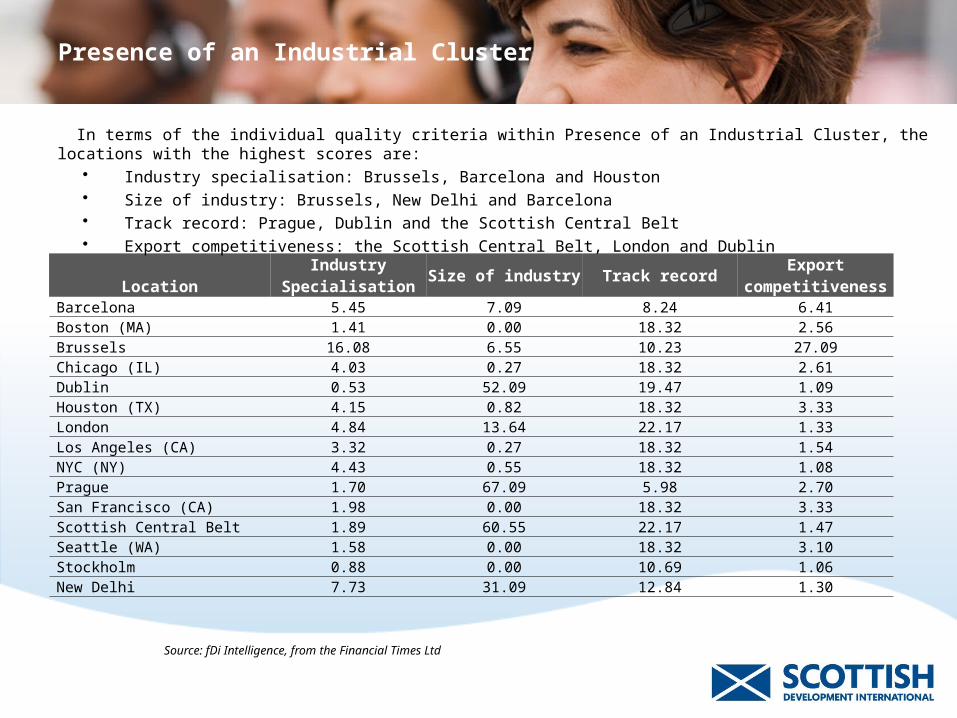
In terms of the individual quality criteria within Presence of an Industrial Cluster, the locations with the highest scores are:• Industry specialisation: Brussels, Barcelona and Houston• Size of industry: Brussels, New Delhi and Barcelona• Track record: Prague, Dublin and the Scottish Central Belt• Export competitiveness: the Scottish Central Belt, London and Dublin
Source: fDi Intelligence, from the Financial Times Ltd
Infrastructure and Accessibility
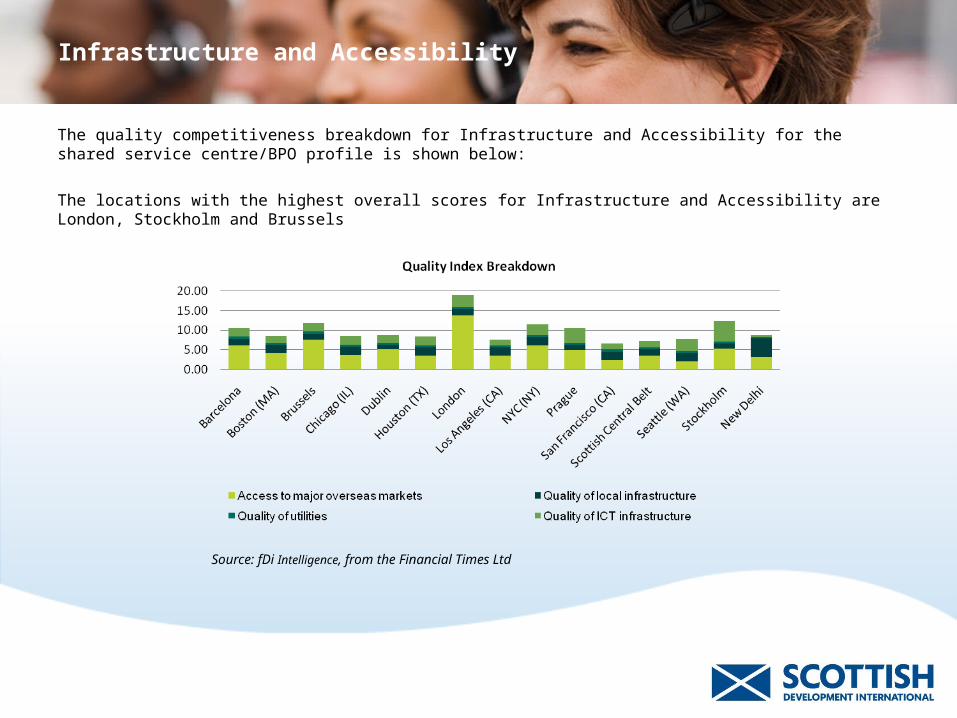
The quality competitiveness breakdown for Infrastructure and Accessibility for the shared service centre/BPO profile is shown below:
The locations with the highest overall scores for Infrastructure and Accessibility are London, Stockholm and Brussels
Source: fDi Intelligence, from the Financial Times Ltd
Infrastructure and Accessibility
LocationAccess to major
overseas marketsQuality of local infrastructure
Quality of utilitiesQuality of ICT infrastructure
Barcelona 6.14 1.62 0.70 2.02
Boston (MA) 4.13 2.14 0.50 1.77
Brussels 7.67 1.44 0.62 2.18
Chicago (IL) 3.64 2.14 0.50 2.37
Dublin 5.11 1.26 0.47 1.92
Houston (TX) 3.52 2.14 0.50 2.30
London 13.73 1.67 0.49 3.03
Los Angeles (CA) 3.54 2.14 0.50 1.45
NYC (NY) 6.10 2.14 0.50 2.69
Prague 5.00 1.28 0.55 3.67
San Francisco (CA) 2.44 2.14 0.50 1.62
Scottish Central Belt 3.45 1.67 0.49 1.73
Seattle (WA) 2.05 2.14 0.50 3.09
Stockholm 5.25 1.31 0.49 5.20
New Delhi 3.21 4.78 0.19 0.57
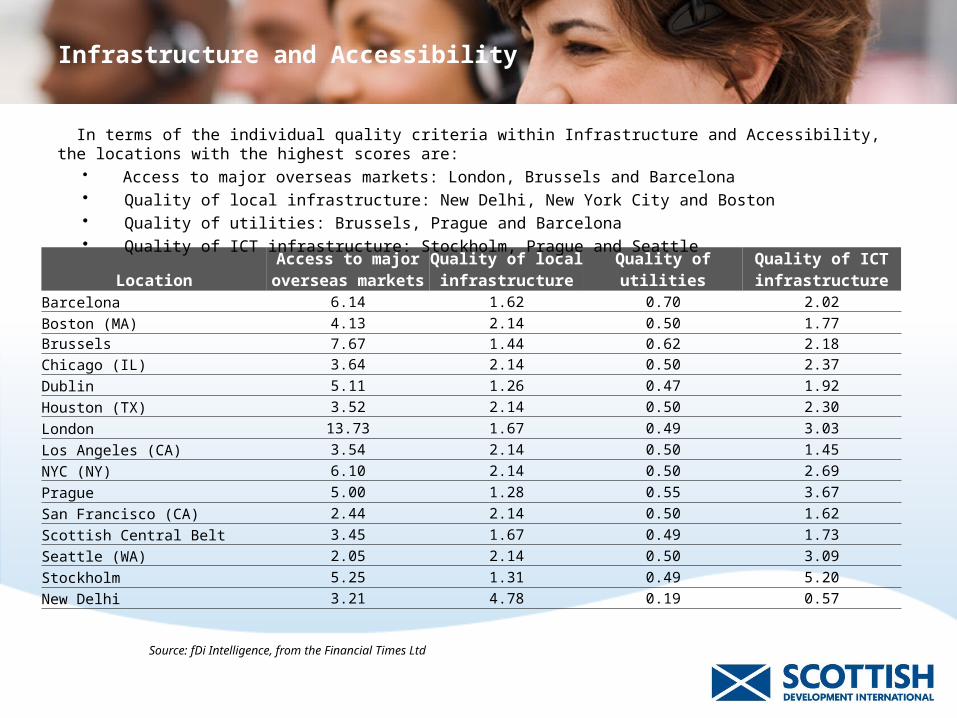
In terms of the individual quality criteria within Infrastructure and Accessibility, the locations with the highest scores are:• Access to major overseas markets: London, Brussels and Barcelona• Quality of local infrastructure: New Delhi, New York City and Boston• Quality of utilities: Brussels, Prague and Barcelona• Quality of ICT infrastructure: Stockholm, Prague and Seattle
Source: fDi Intelligence, from the Financial Times Ltd
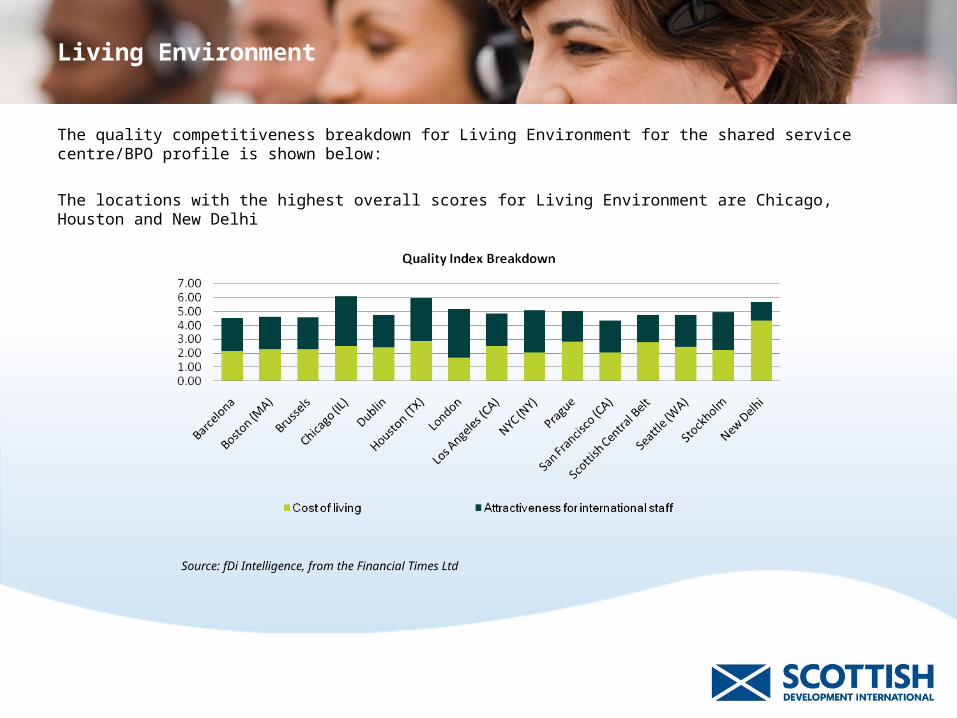
Living Environment
The quality competitiveness breakdown for Living Environment for the shared service centre/BPO profile is shown below:
The locations with the highest overall scores for Living Environment are Chicago, Houston and New Delhi
Source: fDi Intelligence, from the Financial Times Ltd
Living Environment
LocationCost of living
Attractiveness for international staff
Barcelona 2.12 2.41Boston (MA) 2.30 2.32Brussels 2.30 2.29Chicago (IL) 2.53 3.56Dublin 2.40 2.35Houston (TX) 2.87 3.06London 1.68 3.49Los Angeles (CA) 2.50 2.33NYC (NY) 2.06 2.99Prague 2.83 2.20San Francisco (CA) 2.07 2.27Scottish Central Belt 2.79 1.97Seattle (WA) 2.48 2.27Stockholm 2.23 2.70New Delhi 4.36 1.29
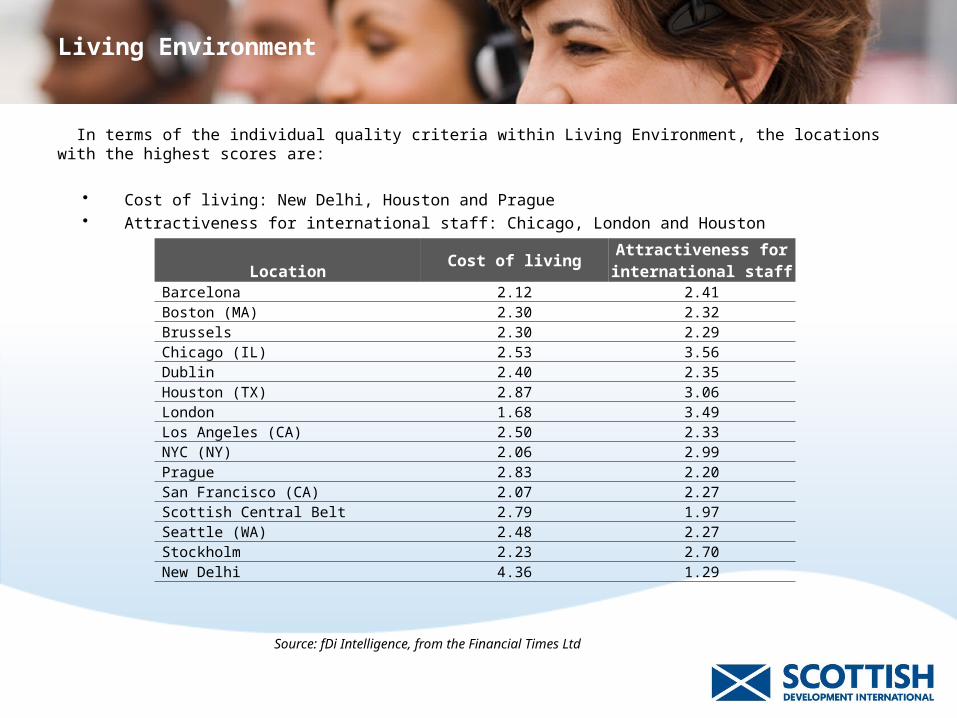
In terms of the individual quality criteria within Living Environment, the locations with the highest scores are:
• Cost of living: New Delhi, Houston and Prague• Attractiveness for international staff: Chicago, London and Houston
Source: fDi Intelligence, from the Financial Times Ltd

To realise the potential,please contact:
Scottish Development International150 Broomielaw, Atlantic Quay Glasgow G2 8LU Scotland, UK T +44 141 228 2828F +44 141 228 2089www.sdi.co.uk
Worldwide offices in: Americas, Europe, Middle East, Africa and Asia Pacific