Solutions for Flaring & Venting CNG Marine Transportation Paul BRITTON.
Scottish Carbon Capture & Storage
Murchison House, West Mains Road Edinburgh EH9 3LA
Telephone +44 (0)131 650 0270 www.sccs.org.uk
A Review of Flaring and Venting at UK Offshore Oilfields
An analogue for offshore Carbon Dioxide Enhanced Oil Recovery Projects?
November 2014
R Jamie Stewart, University of Edinburgh
www.sccs.org.uk 1 of 19
Executive Summary
Given the limited number of global offshore CO2EOR projects, it is difficult to predict operational conditions that may arise at proposed developments. One of these unknown operational parameters is the rate at which produced gases will be flared or vented. Using real field data from over 200 UK offshore oil fields, this study has extensively reviewed flaring and venting rates of produced AG, as a possible analogue for offshore CO2EOR developments.
This study has found that 3% of produced AG was flared or vented at UK offshore fields between January 2004 and October 2009. This value drops to 2% when only fields developed after 1998 are included. Of the 99 fields developed after 1998 a large range of mean flaring/venting percentages (0-90%) exists at individual fields, indicating that a number of fields flare high fractions of the AG produced. Although high flaring rates do occur at a small number of fields, giving a mean percentage of 17%, the most common flaring range of the 99 fields developed after 1998 is 0-1%. This indicates that it is technically feasible to flare/vent very small fractions of produced AG. Interestingly the study has found that overall flaring rates have not decreased between 2004 and 2013, with the four highest flaring percentages seen between 2010 and 2013. The study also concludes that the size of oil development appears to have little control on the percentage of produced AG that is flared or vented.
A detailed study of fields with gas injection facilities, thought to be a good analogue for CO2EOR developments, highlights that flaring rates do not appear to be significantly reduced at these fields, in relation to fields with no injection facilities.
Further data, that was not found to be publicly available for the majority of fields developed after 1998, would also be required to explore the control of parameters such as GOR, oil gravity and depth on the rate of faring/venting.
This study has shown that greatly different apparent average flaring rates exist depending on whether the total volumes of gas are analysed at a large number of fields or mean flaring rates at individual fields are analysed. Caution must therefore be taken when selecting a representative rate of flaring/venting when modelling a proposed CO2EOR development.

www.sccs.org.uk 2 of 19
Contents
Aims of this study ................................................................................................................... 4
Introduction ............................................................................................................................ 4
The Flaring and Venting of Gas Alongside Oil Production ................................................. 4
Flaring and Venting in the UK ............................................................................................ 5
UK Flaring/Venting Data Acquisition .................................................................................. 6
Results ................................................................................................................................... 6
Analysis of UK Associated Gas Flaring and Venting between 2004 and 2013 ................. 6
Year by Year Variability of Flaring and Venting Rates ....................................................... 6
Field by Field Variability of Flaring and Venting ................................................................. 6
Control of Oil Production Rate on Flaring/Venting ........................................................... 11
Flaring and Venting at Fields with Associated Gas Injection ........................................... 13
Case Study ........................................................................................................................... 15
The Magnus Field ............................................................................................................. 15
Flaring and Venting at the Magnus Field ......................................................................... 16
Conclusions .......................................................................................................................... 18
References ........................................................................................................................... 19

www.sccs.org.uk 3 of 19
List of Figures
Figure 1: UKCS Associated Gas Production, Flaring and Venting at All Offshore Oil Fields
Figure 2: Flaring and Venting of AG between 2004 and 2013 at UKCS Oil Fields Developed 1998 Onwards
Figure 3 – Geographical Distribution of Flaring/Venting Rates at UK offshore Oil Fields developed after 1998
Figure 4: Histogram of % AG Fared or Vented from UKCS Oil Fields between 2004-2013 for fields developed 1998 onwards
Figure 5: Oil Production vs Flaring/Venting between 2004-2103 at UKCS Offshore Oil fields developed after 1998
Figure 6: Flaring and Venting of AG between 2004 and 2013 at UKCS Oil Fields with AG Injection
Figure 7: Histogram of % AG Fared or Vented from UKCS Oil Fields between 2004-2013 for fields with AG injection
Figure 8: Summary map of the Magnus Gas Injection Project and associated facilities
Figure 9: Magnus Field Associated Gas Production, Injection, Flaring & Venting
www.sccs.org.uk 4 of 19
Aims of this study
This study aims to re-address the issue of flaring and venting of reproduced gases in carbon dioxide enhanced oil recovery (CO2EOR) projects. Whilst a number of studies have not recognised the impact of flaring/venting in CO2EOR developments, a study completed at Scottish Carbon Capture and Storage (SCCS) “Carbon Accounting for Carbon Dioxide Enhanced Oil Recovery” highlighted the significant control that flaring/venting of reproduced gases may have on a projects life cycle greenhouse gas emissions. This study utilises operational data from offshore UK oil fields to analyse the rates of current flaring and venting in oil operations in these established fields.
Although no CO2EOR developments are currently operating in the United Kingdom Continental Shelf (UKCS), it is thought that these offshore fields may provide an analogue for flaring and venting rates at future offshore CO2EOR fields. An even better analogue may exist in the form of non-CO2 offshore EOR projects of which there a number operating in the UKCS (Awan et al. 2008). Given that some of these EOR projects utilise gas injection, much like the proposed CO2EOR projects, flaring/venting rates at these fields in particular will be analysed further.
Introduction
The Flaring and Venting of Gas Alongside Oil Production
The production of associated natural gas (AG) occurs alongside all crude oil production. Depending on the gas to oil ratio (GOR) low or high volumes of this natural gas will be produced. AG is comprised predominantly of methane but will likely have components of ethane, propane, butanes and pentanes, alongside water vapour, carbon dioxide and hydrogen sulphide (H2S) (Baker Institute , 2010). Whilst this natural gas is a clean source of fossil fuel, with a composition similar to that of natural gas, it has in the past often been regarded as an issue to oil producers who saw no market for this oil ‘by-product.’ When no market existed to transport and sell the produced gas or a developments location was too far away to make the construction of gas infrastructure economic, gas produced alongside the oil must be flared, vented or re-injected.
Flaring was initially designed as a safety measure to allow the release of the gas without explosion. When the methane rich gas is flared mainly CO2 and water vapour is produced, alongside carbon monoxide and a variety of other pollutants such as H2S. Although flare design has been improved over the years, the flare efficiency is never 100%. Well designed and operated flares may however have combustion efficiencies of greater than 90% (OGP, 2000 and refs there in). Combustion efficiencies are controlled by the energy density of the flare gas stream, composition of the gas stream, design of the flare system and environmental conditions such as wind speed, ambient temperature and wind direction.(Baker Institute, 2010 and references therein).
The controlled release of gases from oil installations is known as venting. The venting of AG generally results in the release of methane, H2S and volatile organic carbons (VOC’s) into the atmosphere and is generally a secondary option to flaring due to the larger greenhouse gas impact factor of methane. However when high concentrations of inert gas, that may come from the process system, are present in the AG the gas stream may not be combustible (OGP, 2000). If re-injection is not an option it it may be possible to add more hydrocarbon to the gas stream to make it combustible and reduce the volume of gas vented.
Although it is now recognised by oil companies and governments that the flaring and venting of AG is both a waste of resource and a potential environmental issue, flaring and venting still occurs under a number of circumstances. Process upsets, equipment changeover, maintenance and production shutdown may all lead to the increased flaring and venting of AG produced or delivered to a facility to keep the development running safely (OGP, 2000). In these situations the flare is operated temporarily until the issue is resolved. In the UK four types of flares and vents are recognised by the Department of Energy and Climate Change (DECC, 2014) These are noted below:
www.sccs.org.uk 5 of 19
Type 1 - base load flare
This includes all the gas used for safe and efficient operation of the process facility and flare system under normal operating conditions. This also includes any gas that has to be discarded as part of the installation processes and is discharged to flare. Typical examples are all process purges and pilots, the off-gas from the glycol regeneration plants and acid gas discharged from gas treatment plants, where these are fed to the flare system for combustion. This category also includes flaring from installations with no gas export facilities.
Type 2 – flaring from operational or mode changes
This includes gas flaring resulting from the start up and planned shutdown of equipment during production, and will also include gas not meeting export specification, maintenance of equipment and equipment outages. This type also includes flaring that is caused by the temporary lack of access to a third-party gas export pipeline or similar.
Type 3 – emergency shutdown/process trip
This includes any gas flared during an emergency shutdown / process trip of equipment or the installation, including shut-in of the wells.
Type 4 – Unignited vents
This covers inert gases and hydrocarbons gases that may be discharged to an atmospheric vent. The Gas Act requires both the inert and hydrocarbon gases obtained from the licensed area that are vented to be covered by the consent.
This should also include venting of gases from onboard crude oil storage tanks eg for FPSOs during crude oil filling operations. However, this excludes inert gases that are generated onboard the installation for the purpose of providing an inert blanket for onboard oil storage tanks etc.
Flaring and Venting in the UK
It is thought that emissions from flaring and venting account for around 20% of the total greenhouse gas emissions from the UK oil and gas industry (World Bank, 2004b). This occurs even though a number of regulations have been put in place that attempt to reduce the volumes of gas flared. Before the construction of an oil development, regulation requires that the production facilities have the capability to conserve all gas processed on them, through such measures as export or gas re-injection. When flaring does occur due to previously mentioned reasons, a consent must have first been gathered from DECC. This consenting is required by law under the Petroleum Act (1998) that states that all production facilities must have the objective to conserve gas, a finite energy resource, by avoiding unnecessary wastage during the production of hydrocarbons. These consents only permit the long term (3 year) flaring of less than 40 tonnes per day.
In the UK a number of schemes have been enforced to try and reduce the volumes of gas that is flared. One of these schemes known as the Flare Transfer Pilot Trading Scheme provides a framework for participating operators to “trade” flaring volumes. This scheme which allows operators to sell unused flare volumes below their consent, has seen a reduction of flaring of 11% below their collective consent (World bank, 2006). Another scheme that has attempted to reduce the emissions from all European oil operators is the European Emission Trading Scheme (EUETS, 2008). Again operators are given emission allowances that if breached, will result in the purchase of more CO2 allowances. The inclusion of emissions from flaring and venting were included in the EUETS in 2008.

www.sccs.org.uk 6 of 19
UK Flaring/Venting Data Acquisition
In the literature a number of different values are given to the percentage of AG flared at UK Oil fields. The Baker Institute (2010) state that a very large percentage of AG (more than 95%) is utilised in countries such as Norway, Canada, the UK and the United States. The World Bank (2006) show that 3% of associated gas was flared in 2005 at UKCS oil fields. Beyond these figures very little historical or current flaring data appears to be publicly available. On request however, the Department of Energy and Climate Change (DECC) can provide such data. For this study flaring and venting data was requested and provided for 212 UKCS (offshore) oil fields. Monthly values were available from January 2004 to October 2013 for:
- Oil Production (m3)
- Condensate Production (m3)
- Associated Gas Production (Ksm3),
- Gas Flared (Ksm3),
- Gas Vented (Ksm3)
- Gas Injected (Ksm3)
This data not only allows for calculations to be made of the total percentage of AG flared or vented at UKCS oil fields, but also allows the examination of flaring/venting rates at individual fields. The discrepancy between flaring percentages at individual fields compared to total values of gas flared/vented will be discussed later in this report.
Results
Analysis of UK Associated Gas Flaring and Venting between 2004 and 2013
For all 212 offshore oil fields the total volume of associated gas produced between January 2004 and October 2013 was 452,925,820 Ksm
3, with 12,595,106 Ksm
3 of gas being flared
and 379,350 Ksm3 vented. This equates to 3% of all produced AG at UK oil fields being flared
or vented over that 9 year period. When fields that were developed before 1998, when the Petroleum Act required the conservation of gas by reducing any gas wastage, are removed the percentage drops to 2%.
Year by Year Variability of Flaring and Venting Rates
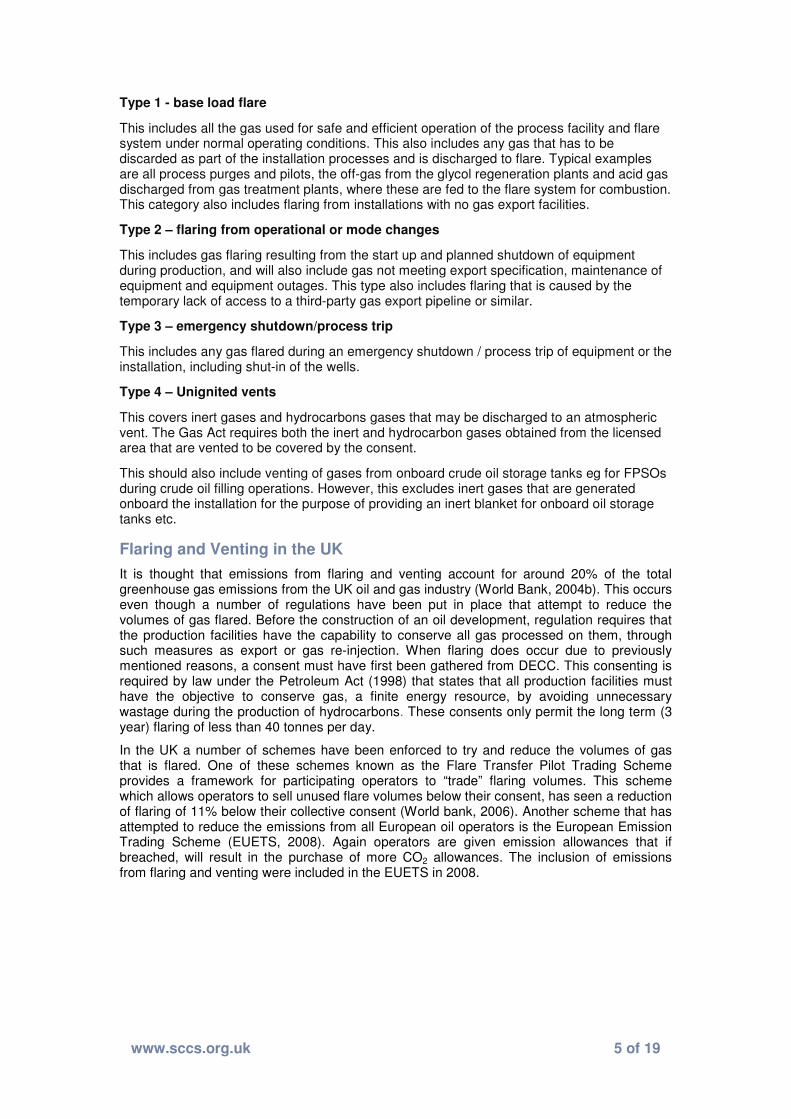
Figure 1 shows the annual volumes of produced AG, AG vented and AG flared for all UKCS offshore oil fields. Plotted alongside these volumes is the percentage of total produced AG that is flared or vented on an annual basis. The lowest flaring/venting rate was in 2004 when 2.2% of all of the AG produced at offshore oil fields was flared or vented. The highest rate was in 2013 with 4.5% of AG being flared or vented. This interestingly shows that although drastic reductions in flaring rates were seen from 1980 (63% flared) to 1995 (5% flared) (World Bank, 2006), flaring/venting rates in the last decade have not reduced at UK offshore oil fields, with the highest flaring/venting rates of the period seen in 2010-2013.
Field by Field Variability of Flaring and Venting
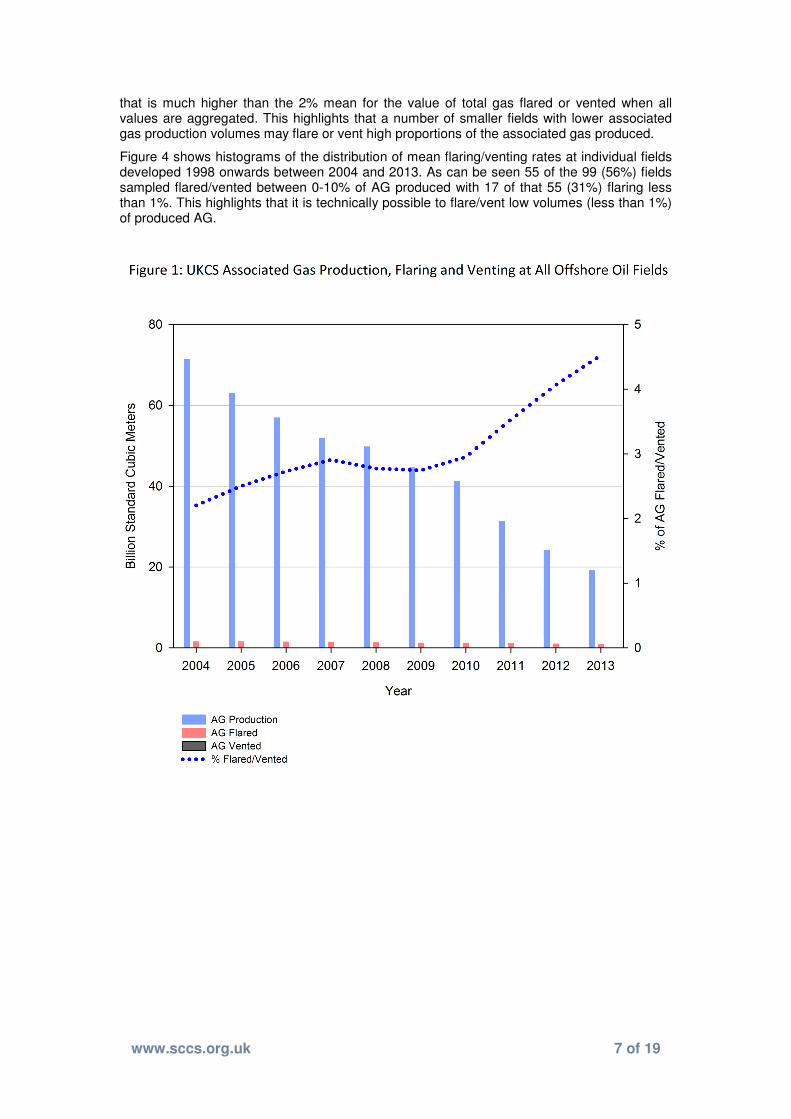
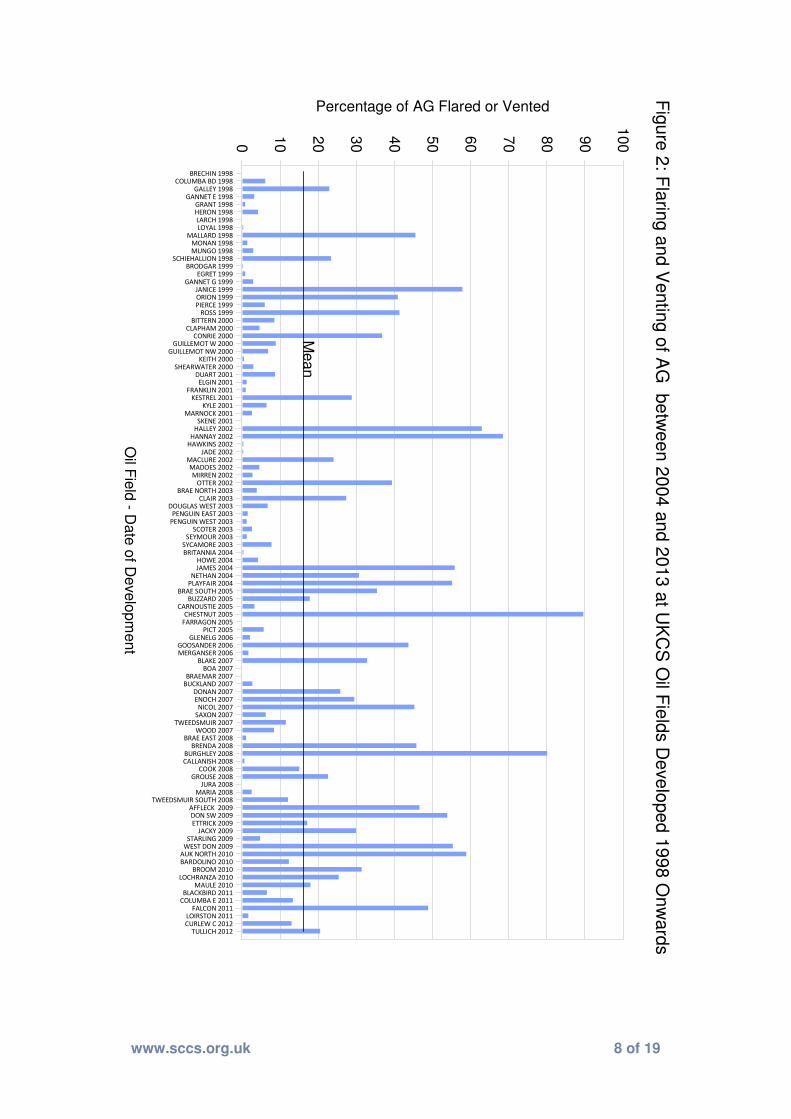
Although the means of total AG flared or vented at UKCS offshore oil fields are relatively low when compared to flaring volumes in other countries (World Bank, 2004), when individual fields are inspected it can be seen that a large range of 0-90% flared/vented associated gas exists for individual oil fields (Figure 2). Figure 2 also portrays that the date of development of an oil field developed after 1998 does not have a control on the rate of flaring/venting of AG. Figure 3 shows the same data on flaring rates at oil fields developed after 1998 on a GIS map. As can be seen on the map, there appears to be no geographic control on flaring rates.
The mean flaring rate for all fields developed after 1998 is 18% (black line on chart), a value
www.sccs.org.uk 7 of 19
that is much higher than the 2% mean for the value of total gas flared or vented when all values are aggregated. This highlights that a number of smaller fields with lower associated gas production volumes may flare or vent high proportions of the associated gas produced.
Figure 4 shows histograms of the distribution of mean flaring/venting rates at individual fields developed 1998 onwards between 2004 and 2013. As can be seen 55 of the 99 (56%) fields sampled flared/vented between 0-10% of AG produced with 17 of that 55 (31%) flaring less than 1%. This highlights that it is technically possible to flare/vent low volumes (less than 1%) of produced AG.
www.sccs.org.uk 8 of 19
Fig
ure
2: F
larin
g a
nd V
entin
g o
f AG
be
twe
en 2
004
and
201
3 a
t UK
CS
Oil F
ield
s D
eve
lope
d 1
99
8 O
nw
ard
s
Oil F
ield
- Date
of D
evelo
pm
ent
BRECHIN 1998
COLUMBA BD 1998
GALLEY 1998
GANNET E 1998
GRANT 1998
HERON 1998
LARCH 1998
LOYAL 1998
MALLARD 1998
MONAN 1998
MUNGO 1998
SCHIEHALLION 1998
BRODGAR 1999
EGRET 1999
GANNET G 1999
JANICE 1999
ORION 1999
PIERCE 1999
ROSS 1999
BITTERN 2000
CLAPHAM 2000
CONRIE 2000
GUILLEMOT W 2000
GUILLEMOT NW 2000
KEITH 2000
SHEARWATER 2000
DUART 2001
ELGIN 2001
FRANKLIN 2001
KESTREL 2001
KYLE 2001
MARNOCK 2001
SKENE 2001
HALLEY 2002
HANNAY 2002
HAWKINS 2002
JADE 2002
MACLURE 2002
MADOES 2002
MIRREN 2002
OTTER 2002
BRAE NORTH 2003
CLAIR 2003
DOUGLAS WEST 2003
PENGUIN EAST 2003
PENGUIN WEST 2003
SCOTER 2003
SEYMOUR 2003
SYCAMORE 2003
BRITANNIA 2004
HOWE 2004
JAMES 2004
NETHAN 2004
PLAYFAIR 2004
BRAE SOUTH 2005
BUZZARD 2005
CARNOUSTIE 2005
CHESTNUT 2005
FARRAGON 2005
PICT 2005
GLENELG 2006
GOOSANDER 2006
MERGANSER 2006
BLAKE 2007
BOA 2007
BRAEMAR 2007
BUCKLAND 2007
DONAN 2007
ENOCH 2007
NICOL 2007
SAXON 2007
TWEEDSMUIR 2007
WOOD 2007
BRAE EAST 2008
BRENDA 2008
BURGHLEY 2008
CALLANISH 2008
COOK 2008
GROUSE 2008
JURA 2008
MARIA 2008
TWEEDSMUIR SOUTH 2008
AFFLECK 2009
DON SW 2009
ETTRICK 2009
JACKY 2009
STARLING 2009
WEST DON 2009
AUK NORTH 2010
BARDOLINO 2010
BROOM 2010
LOCHRANZA 2010
MAULE 2010
BLACKBIRD 2011
COLUMBA E 2011
FALCON 2011
LOIRSTON 2011
CURLEW C 2012
TULLICH 2012
Percentage of AG Flared or Vented
0
10
20
30
40
50
60
70
80
90
100
Mean
www.sccs.org.uk 9 of 19
Figure 3 – Geographical Distribution of Flaring/Venting Rates at UK offshore Oil Fields developed after 1998

www.sccs.org.uk 10 of 19
Figure 4: Histogram of % AG Fared or Vented from UKCS Oil Fields between 2004-2013 for fields developed 1998 onwards
% AG flared or vented
0 10 20 30 40 50 60 70 80 90 100
Cou
nt
0
10
20
30
40
50
60
% of AG flared or vented
0 1 2 3 4 5 6 7 8 9 10
Cou
nt
0
2
4
6
8
10
12
14
16
18

www.sccs.org.uk 11 of 19
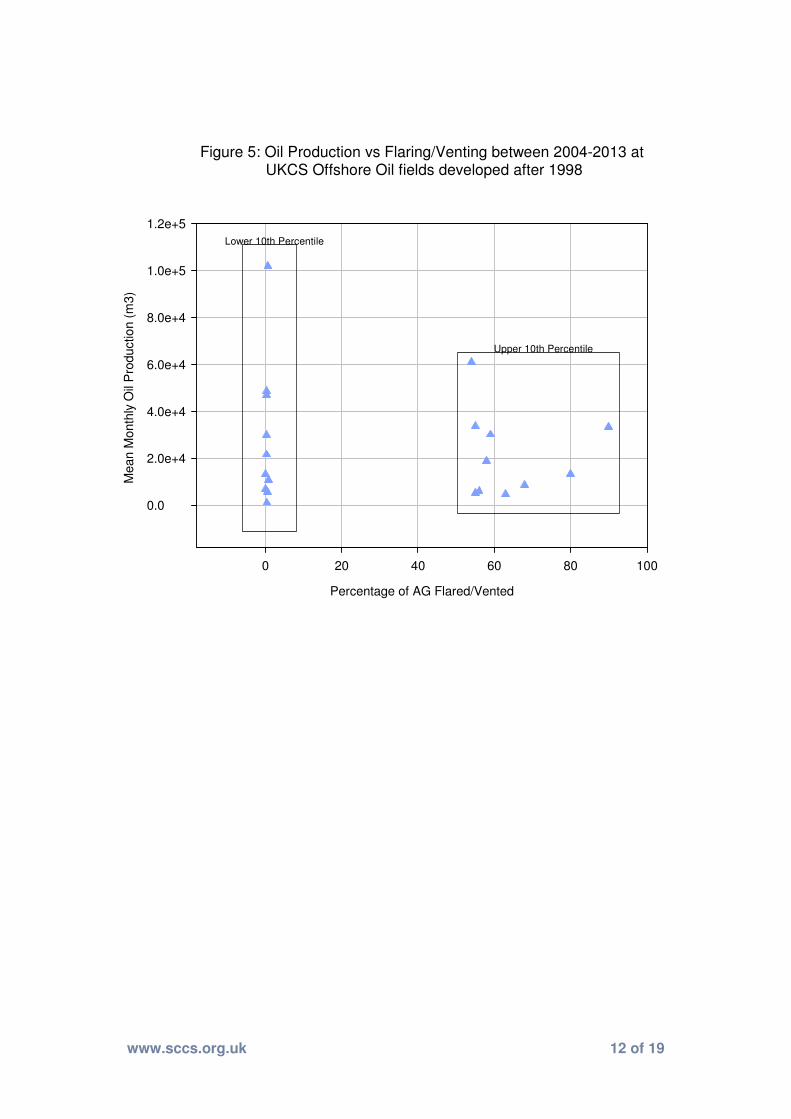
Control of Oil Production Rate on Flaring/Venting
Table 1 displays the lower 10th
and upper 10th percentile of oil fields developed after 1998
based on their flaring/venting rates over the 2004-2013 period. 5 fields with 0.0% flaring and venting have been removed as it is thought that their oil is processed at other platforms. An example of this is the Brechin field. The Brechin field reports 0% flaring or venting over the period, but contributes to 14% of the gas flared at the Montrose field, where the oil is piped to be processed (Paladin Expro, 2004). As can be seen in Figure 5 the size of an oil field development appears to have little control on the rates of flaring and venting. This may be due to the overriding control of infrastructure connectivity which may allow small developments to pipe hydrocarbons to larger platforms with connection to better processing facilities or export markets.
UKCS Offshore OiI Fields –Date of
Development
% AG Flared
or Vented
Mean Oil Production
m3/month
JURA 2008 0.03 13234
SKENE 2001 0.07 6917
BRODGAR 1999 0.31 29896
JADE 2002 0.36 47003
BRITANNIA 2004 0.38 48646
HAWKINS 2002 0.4 1250
KEITH 2000 0.55 5870
CALLANISH 2008 0.68 102126
EGRET 1999 0.86 10958
GRANT 1998 0.89 7573
DON SW 2009 54 61094
PLAYFAIR 2004 55 5420
WEST DON 2009 55 33672
JAMES 2004 56 6127
JANICE 1999 58 19025
AUK NORTH 2010 59 30222
HALLEY 2002 63 4734
HANNAY 2002 68 8673
BURGHLEY 2008 80 13463
CHESTNUT 2005 90 33535
LOWER* 10th PERCENTILE OIL FIELDS
*- 5 fields with 0% flaring/venting removed
Table 1 – Flaring, Venting and Oil Production Rates between 2004 and 2013 at fields developed after 1998.
UPPER 10th PERCENTILE OIL FIELDS
www.sccs.org.uk 12 of 19
Figure 5: Oil Production vs Flaring/Venting between 2004-2013 at UKCS Offshore Oil fields developed after 1998
Percentage of AG Flared/Vented
0 20 40 60 80 100
Mean M
onth
ly O
il P
roductio
n (
m3)
0.0
2.0e+4
4.0e+4
6.0e+4
8.0e+4
1.0e+5
1.2e+5
Upper 10th Percentile
Lower 10th Percentile
www.sccs.org.uk 13 of 19
Flaring and Venting at Fields with Associated Gas Injection
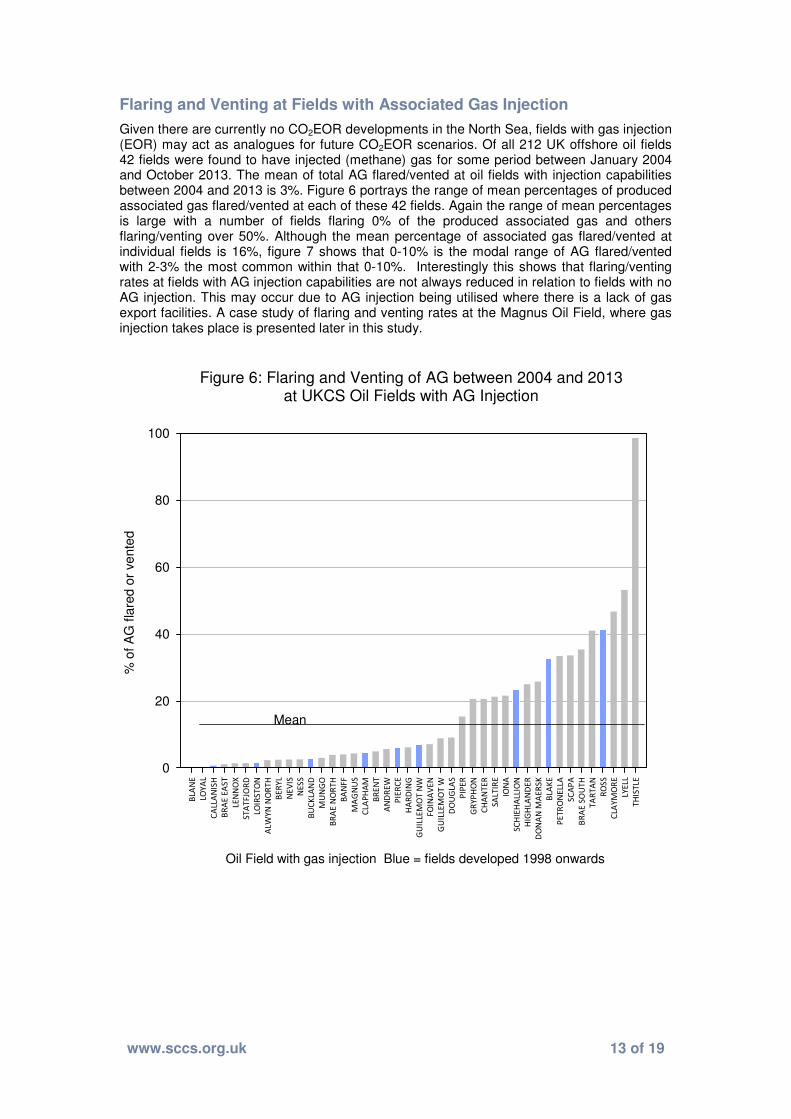
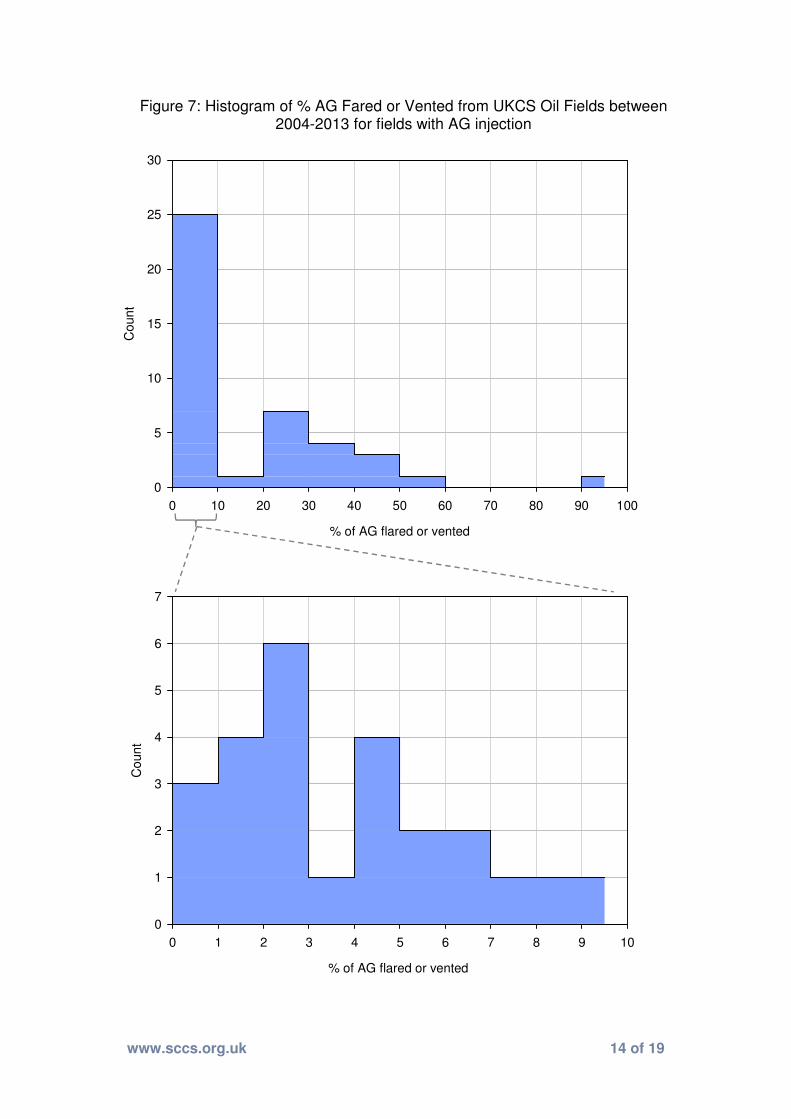
Given there are currently no CO2EOR developments in the North Sea, fields with gas injection (EOR) may act as analogues for future CO2EOR scenarios. Of all 212 UK offshore oil fields 42 fields were found to have injected (methane) gas for some period between January 2004 and October 2013. The mean of total AG flared/vented at oil fields with injection capabilities between 2004 and 2013 is 3%. Figure 6 portrays the range of mean percentages of produced associated gas flared/vented at each of these 42 fields. Again the range of mean percentages is large with a number of fields flaring 0% of the produced associated gas and others flaring/venting over 50%. Although the mean percentage of associated gas flared/vented at individual fields is 16%, figure 7 shows that 0-10% is the modal range of AG flared/vented with 2-3% the most common within that 0-10%. Interestingly this shows that flaring/venting rates at fields with AG injection capabilities are not always reduced in relation to fields with no AG injection. This may occur due to AG injection being utilised where there is a lack of gas export facilities. A case study of flaring and venting rates at the Magnus Oil Field, where gas injection takes place is presented later in this study.
Figure 6: Flaring and Venting of AG between 2004 and 2013 at UKCS Oil Fields with AG Injection
Oil Field with gas injection Blue = fields developed 1998 onwards
BLA
NE
LO
YA
L
CA
LLA
NIS
H
BR
AE
EA
ST
LE
NN
OX
ST
AT
FJO
RD
LO
IRS
TO
N
ALW
YN
NO
RT
H
BE
RY
L
NE
VIS
NE
SS
BU
CK
LA
ND
MU
NG
O
BR
AE
NO
RT
H
BA
NF
F
MA
GN
US
CLA
PH
AM
BR
EN
T
AN
DR
EW
PIE
RC
E
HA
RD
ING
GU
ILLE
MO
T N
W
FO
INA
VE
N
GU
ILLE
MO
T W
DO
UG
LA
S
PIP
ER
GR
YP
HO
N
CH
AN
TE
R
SA
LT
IRE
ION
A
SC
HIE
HA
LLIO
N
HIG
HLA
ND
ER
DO
NA
N M
AE
RS
K
BLA
KE
PE
TR
ON
ELLA
SC
AP
A
BR
AE
SO
UT
H
TA
RT
AN
RO
SS
CLA
YM
OR
E
LY
ELL
TH
IST
LE
% o
f A
G f
lare
d o
r ve
nte
d
0
20
40
60
80
100
Mean
www.sccs.org.uk 14 of 19
Figure 7: Histogram of % AG Fared or Vented from UKCS Oil Fields between 2004-2013 for fields with AG injection
% of AG flared or vented
0 10 20 30 40 50 60 70 80 90 100
Co
un
t
0
5
10
15
20
25
30
% of AG flared or vented
0 1 2 3 4 5 6 7 8 9 10
Co
un
t
0
1
2
3
4
5
6
7

www.sccs.org.uk 15 of 19
Case Study
The Magnus Field
The Magnus Field is located in the Northern North Sea and is operated by BP (85%) and is co-owned by JX Nippon Exploration & Production (7.5%), Eni Uk Ltd (5%) and Marubeni North Sea Ltd (2.5%). First oil was produced in 1983 using a peripheral water drive. Plateau production was maintained until 1995 when sea water broke through at the crestal wells and sever barium sulphate scaling problems were encountered (Moulds et al 2005, 2010). At this stage residual oil saturation in the reservoir was relatively low (Sorw = 25%), but due to the large original oil in place (OOIP) of 1.5 billion stb the field was still considered for a tertiary recovery scheme.
Along with the large OOIP, the geology of the reservoir also favored a miscible gas flood. The reservoir consists of Late Jurassic stacked turbidites which result in un-swept oil being trapped under shales which form at the top of each sequence. This concentrated volume of oil, beneath these shale baffles provides a target for tertiary recovery (Moulds et al. 2010).
Gas injection in the field commenced in 2002, when a source of gas was made available through a 400Km pipeline from the Schehallion Field, West of Shetland. Due to the lack of export availability at the Schehallion field, the otherwise stranded gas produced here, was transported by pipeline to the Magnus Field via the Sullom Voe Oil Terminal in Shetland. The initial intention was to enrich the produced lean gas (90% methane) with additional propane and butane at Sullom Voe before transporting it to the Magnus Field, where the enriched gas would mitigate the effect of field scale dispersion on the development of miscibility (Figure 8). However in practice it was discovered that the additional oil recovered due to the gas enrichment did not compensate for the cost of enriching the gas. The MMP of lean gas in the light (39⁰ API) oil falls at around the reservoir pressure of the reservoir at 5000psia. Recovery
Figure 8 – Summary map of the Magnus Gas Injection Project and associated facilities

www.sccs.org.uk 16 of 19
in the reservoir is thought to be primarily driven by miscible recovery (Moulds et al. 2010). However if reservoir pressure drops below 5000psia immiscible processes are still thought to help mobilise water flood residual oil due to oil swelling and viscosity reduction (Moulds et al. 2010).
Since injection commenced in 2002 a WAG displacement scheme has been used to limit injected gas fingering through the mobilised residual oil and poorly sweeping the reservoir. In a WAG scheme the role of the injected gas is to mobilise the residual and by-passed oil, whilst the subsequent injected water improves the mobility ratio and ensures that the mobilised oil is driven effectively towards the production wells. The injection rate through the 5 injection wells is kept as high as possible to limit the effect of gravity segregation of injected gas and water, but is ultimately controlled by the limited supply of injection gas (Moulds et al. 2010).
At the Magnus field fluids are processed via two parallel trains of oil gas and water separation, each with a high and low pressure stage. In the gas processing stage gas is dehydrated and conditioned to remove H2S and CO2 to allow its use as a fuel gas. Spare gas not being used for power generation is injected to enhance oil recovery. Facilities also exist for the crossover and metering of import gas for export (BP, 2014).
Flaring and Venting at the Magnus Field
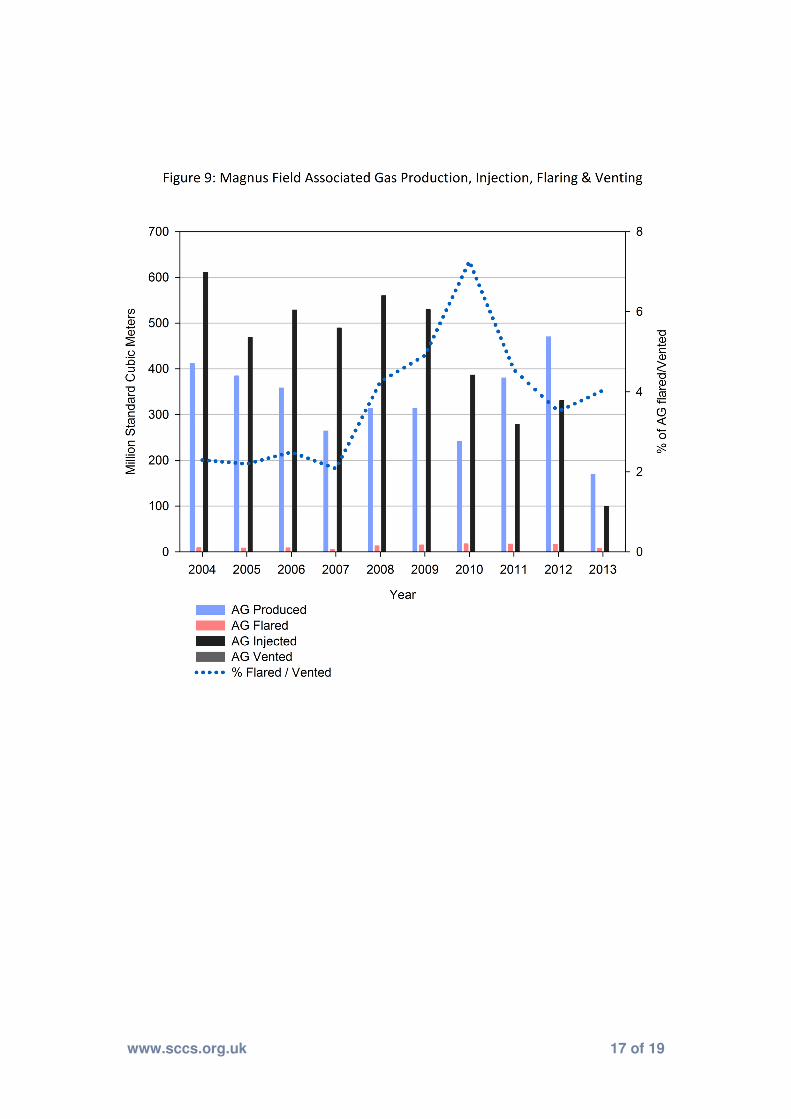
Even though the Magnus Field is optimised to reduce the flaring/venting of produced or imported AG with both gas injection and LPG export capabilities, substantial volumes of gas are still flared or vented on an annual basis. Figure 9 shows the volumes of AG produced, injected, flared and vented at the Magnus Field between January 2004 and November 2013. The percentage of produced AG that was flared or vented is also shown in Figure 9. The data shows that there was no gas vented during the period. The mean percentage of flared AG over the 2004-2013 period is 4%. As can be seen however there is a significant spike in the percentage of gas flared in 2010. With this data point removed the mean falls to 3%. The spike in 2010 can be seen to be caused by a reduction in AG production with relatively constant AG flaring in relation to previous years. This AG production reduction in 2010 was caused by planned shutdowns to allow maintenance work to be carried out (BP, 2010). The fact that flaring volumes were stable during this period highlights that stable flares were still alight during maintenance work. It must be noted that although the volume of imported gas flared will likely be small, as import rates can be controlled, its contribution to flaring percentages is not included in this work.
Another aspect that may be considered at the Magnus field is if gas injection has caused an increase of flaring rates due to the increased fraction of gas in the production stream. When gas is injected into the reservoir the gross usage is 9.8 mscf/stb of oil produced. However the net usage is only 3.5mscf/stb (Moulds et al. 2010).This means that large volumes of gas will be reproduced alongside the oil. Further flaring data that pre-dates the gas injection project at Magnus would be needed to confirm whether this is true or not. It must be recognised however that the injection of gas will likely always reduce greenhouse gas emissions when compared to flaring all stranded gas.
www.sccs.org.uk 17 of 19

www.sccs.org.uk 18 of 19
Conclusions
Using real field data from over 200 UK offshore oil fields, this study has extensively reviewed flaring and venting rates of produced AG. It has been found that 3% of produced AG was flared or vented at UK offshore fields between January 2004 and October 2009. This value drops to 2% when only fields developed after 1998 are included. Of the 99 fields developed after 1998 a large range of mean flaring/venting percentages (0-90%) exists at individual fields, indicating that a number of fields flare high fractions of the AG produced. Although high flaring rates do occur at a small number of fields, giving a mean rate of 17% the most common flaring range of the 99 fields developed after 1998 is 0-1%. This indicates that it is technically feasible to flare/vent very small amounts of produced AG. Interestingly the study has found that overall flaring rates have not decreased between 2004 and 2013, with the four highest flaring percentages seen between 2010 and 2013. The study also concludes that the size of oil development appears to have little control on the percentage of produced AG that is flared or vented.
A detailed study of fields with gas injection facilities, highlights that flaring rates do not appear to be significantly reduced in relation to fields with no injection facilities. This may be due to the high gas recycle rates seen at fields with gas injection. Further data and investigation would however be needed to test this theory.
Further data, that was not found to be publicly available for the majority of fields developed after 1998 would also be required to explore the control of parameters such as GOR, oil weight and depth on the rate of flaring/venting.
One key point that has arisen is the importance of the measuring metric utilised when analysing a large dataset. This study has shown that greatly different apparent average flaring rates exist depending on whether the total volumes of gas are analysed at a large number of fields or mean flaring rates at individual fields are analysed. Caution must therefore be taken when selecting a representative rate of flaring/venting when modelling a proposed CO2EOR development.
Gathering data on flaring and venting in operating onshore CO2 EOR projects would provide valuable additional insight to the levels of flaring and venting that might be encountered in an offshore CO2 EOR project.

www.sccs.org.uk 19 of 19
References
Awan, A.R., Teigland, R., Kleppe, J. 2008. A Survey of North Sea Enhanced-Oil_Recovery Projects Initiated During the Years 1975 to 2005. Society of Petroleum Engineers Reservoir Evaluation and Engineering.
Baker Institute, 2010. Gas Flaring and Ventin g: Extent Impacts and Remedies. The James Baker Institute for Public Policy. http://bakerinstitute.org/media/files/Research/8f765caa/CARBONFlaring_paper_Birnur_FINALwith_cover_secured.pdf (accessed May 2014)
BP, 2010. BP North Sea Region Environmental Statement 2010 http://www.bp.com/content/dam/bp/pdf/sustainability/countryreports/North_Sea_Environmental_Statement2010.pdf(accessed May 2014)
BP, 2014. Magnus Field Fact Sheet- online resource. http://www.bp.com/en/global/north-sea-infrastructure/Infrastructure/Platforms/Magnus.html (accessed May 2014)
DECC, 2014. Oil and Gas Guidance. Oil and Gas: fields and field development. https://www.gov.uk/oil-and-gas-fields-and-field-development (accessed May 2014)
EUETS, 2008. European Union Greenhouse Gas Emission Trading Scheme, Directive 2008/87/EC
OGP, 2000. Flaring and venting in the oil and gas exploration and production industry. International Association of Oil and Gas Producers. http://www.ogp.org.uk/pubs/288.pdf (accessed May 2014)
Moulds, T.P., Trussell, P., Haseldonckx, S.A., Carruthers, R.A. 2005. Magnus Field: Reservoir Management in a Mature Field Combining Waterflood, EOR and New Area Developments. Society of Petroleum Engineers. SPE 96292.
Moulds, T.P., Trussell, P., Erbas, D., Cox, D., Laws, E.D., Davies, C. 2010. Post-Plateau Reservoir Management in the Magnus Field. Society of Petroleum Engineers. SPE 134953.
Paladin Expro, 2004. Environmental Statement for the Brechin Field Development, Paladin Expro Limited, D/2267/2004, August 2004. https://itportal.decc.gov.uk/environment/permits/PaladinBrechin.doc (accessed May 2014)
Petroleum Act, 1998. Petroleum Act 1998, Chapter 17. http://www.legislation.gov.uk/ukpga/1998/17/pdfs/ukpga_19980017_en.pdf?view=extent (accessed May 2014)
World Bank, 2004. Global Gas Flaring Reduction- Regulation of Associated Gas Flaring and Venting. World Bank Group. Report Number 3. http://www-wds.worldbank.org/external/default/WDSContentServer/WDSP/IB/2004/07/16/000012009_20040716133951/Rendered/PDF/295540Regulati1aring0no10301public1.pdf (accessed May 2014)
World Bank, 2004b. Overview of Onshore and Offshore Gas Flaring and Venting in the United Kingdom. The World Bank. http://siteresources.worldbank.org/INTGGFR/Resources/unitedkingdom.pdf (accessed May 2014)
World Bank, 2006. UK Flaring Policy. http://siteresources.worldbank.org/EXTGGFR/Resources/5780681258067586081/UK_Flaring_Policy.pdf (accessed May 2014)