A REPORT ON LEGISLATIVE HEARINGS - … · CRT Criterion-referenced tests ... ELL English Language...
79
DRAFT A REPORT ON LEGISLATIVE HEARINGS FOR THE 2010 INTERIM STUDY ON EDUCATIONAL ADEQUACY (ACT 57 OF THE SECOND EXTRAORDINARY SESSION OF 2003 AND ACT 1204 OF 2007) VOLUME I RECOMMENDATIONS OF THE JOINT ADEQUACY EVALUATION OVERSIGHT SUBCOMMITTEE OF THE HOUSE AND SENATE INTERIM COMMITTEES ON EDUCATION
Transcript of A REPORT ON LEGISLATIVE HEARINGS - … · CRT Criterion-referenced tests ... ELL English Language...
DRAFT
A REPORT ON LEGISLATIVE HEARINGS FOR THE 2010 INTERIM STUDY ON EDUCATIONAL
ADEQUACY (ACT 57 OF THE SECOND EXTRAORDINARY SESSION OF 2003
AND ACT 1204 OF 2007)
VOLUME I
RECOMMENDATIONS
OF THE
JOINT ADEQUACY EVALUATION OVERSIGHT SUBCOMMITTEE OF THE HOUSE AND SENATE
INTERIM COMMITTEES ON EDUCATION

Bureau of Legislative Research Project Number: 09-205
TABLE OF CONTENTS
ACRONYMS ............................................................................................................................. IV
SECTION 1: INTRODUCTION .................................................................................................... 1
PURPOSE OF THIS REPORT ....................................................................................................... 1 THE STATUTORY REQUIREMENTS .............................................................................................. 1 HOW THE 2010 STUDY WAS CONDUCTED .................................................................................. 2
SECTION 2: LEGAL LANDSCAPE ............................................................................................ 4
SECTION 3: EDUCATIONAL ADEQUACY ................................................................................ 5
DEFINITION .............................................................................................................................. 5 ARKANSAS PUBLIC SCHOOL FUNDING OVERVIEW ....................................................................... 5
SECTION 4: STATE STUDENT ACHIEVEMENT STATISTICS ................................................. 8
NATIONAL ASSESSMENT OF EDUCATIONAL PROGRESS (NAEP) SCORES ..................................... 8 ARKANSAS BENCHMARK EXAMS ................................................................................................ 9 COLLEGE ENTRANCE EXAM SCORES ........................................................................................10 GRADUATION RATE ..................................................................................................................11 REMEDIATION RATE .................................................................................................................11 ACHIEVEMENT GAP ..................................................................................................................12 QUALITY COUNTS RANKING ......................................................................................................12
SECTION 5: STATEWIDE SCHOOL MONITORING PROGRAMS .......................................... 13
ARKANSAS COMPREHENSIVE TESTING, ASSESSMENT, AND ACCOUNTABILITY PROGRAM (ACTAAP) ..............................................................................................................................................13 ARKANSAS COMPREHENSIVE SCHOOL IMPROVEMENT PLAN (ACSIP) .........................................14 CURRICULUM FRAMEWORKS: NATIONAL STANDARDS.................................................................14 DISTRESS PROGRAMS .............................................................................................................15
Academic Distress ..............................................................................................................15 Fiscal Distress ....................................................................................................................15 Facilities Distress ................................................................................................................16
LONGITUDINAL TRACKING SYSTEM FOR STATE EDUCATION DATA ...............................................17 NO CHILD LEFT BEHIND ...........................................................................................................18 SCHOOL SUPPORT PROGRAMS ................................................................................................19 SCHOLASTIC AUDIT CONTRACTS ..............................................................................................20
SECTION 6: ACADEMIC FACILITIES ..................................................................................... 21
SECTION 7: STATE DISBURSEMENTS .................................................................................. 23
AUTHORIZED FUNDING FOR ALL EDUCATION FUNDS ..................................................................23 STATE DISBURSEMENTS OF SELECTED STATE FUNDING ............................................................24
Foundation Funding ............................................................................................................24 Enhanced Funding .............................................................................................................24 URT Actual Collection Adjustment ......................................................................................24 National School Lunch Act ..................................................................................................25 Alternative Learning Environment .......................................................................................25

ii
English Language Learners ................................................................................................25 Professional Development ..................................................................................................26 Isolated Funding .................................................................................................................26 Student Growth Funding .....................................................................................................27 Declining Enrollment Funding .............................................................................................27
OTHER STATE FUNDING DISBURSED TO SCHOOL DISTRICTS ......................................................28 FEDERAL FUNDING: AMERICAN RECOVERY AND REINVESTMENT ACT ..........................................28 RACE TO THE TOP ...................................................................................................................30 MEDIAN PER-PUPIL EXPENDITURES ..........................................................................................31
SECTION 8: DISTRICT USE OF FOUNDATION FUNDING ..................................................... 32
FOUNDATION FUNDING ............................................................................................................32 SCHOOL-LEVEL SALARIES ........................................................................................................33
School-Level Non-Administrative Staff ................................................................................33 School-Level Administrative Staff .......................................................................................38
SCHOOL-LEVEL RESOURCES ....................................................................................................39 Technology .........................................................................................................................39 Instructional Materials .........................................................................................................39 Extra Duty Funds ................................................................................................................40 Supervisory Aides ...............................................................................................................41 Substitutes ..........................................................................................................................41
DISTRICT-LEVEL RESOURCES ..................................................................................................42 Operations and Maintenance ..............................................................................................42 Central Office and Other District-Level Expenditures ..........................................................42 Transportation ....................................................................................................................43
SUMMARY OF FOUNDATION FUNDING ........................................................................................44 Staffing ...............................................................................................................................44 Expenditures ......................................................................................................................44 Adequacy Subcommittee's Foundation Funding Analysis ...................................................45
MEASURES OF INFLATION AND DEFLATION ................................................................................45 TEACHER SALARIES .................................................................................................................45 TECHNOLOGY ..........................................................................................................................48
SECTION 9: DISTRICT USE OF CATEGORICAL FUNDING .................................................. 50
NATIONAL SCHOOL LUNCH ACT ................................................................................................50 NSLA Funding Used For Teacher Salaries .........................................................................52
ALTERNATIVE LEARNING ENVIRONMENTS ..................................................................................52 ENGLISH LANGUAGE LEARNERS ...............................................................................................54 PROFESSIONAL DEVELOPMENT ................................................................................................56 SUMMARY OF CATEGORICAL FUNDING ......................................................................................58
SECTION 10: EDUCATIONAL EQUITY ................................................................................... 59
ACADEMIC EQUITY ...................................................................................................................59 District Funding...................................................................................................................59 District Spending ................................................................................................................59
ANALYSIS OF DISTRICT FUNDING AND EXPENDITURES ...............................................................59 Funding ..............................................................................................................................59 Expenditures ......................................................................................................................60 Fund Balances ...................................................................................................................61
SECTION 11: PUBLIC COMMENT .......................................................................................... 63
iii
ARKANSAS ASSOCIATION OF EDUCATIONAL ADMINISTRATORS (AAEA) .......................................63 ARKANSAS EDUCATION ASSOCIATION (AEA) .............................................................................63 ARKANSAS SCHOOL BOARDS ASSOCIATION (ASBA) ..................................................................64 ARKANSAS RURAL EDUCATION ASSOCIATION (AREA) ...............................................................65
SECTION 12: RECOMMENDATIONS ...................................................................................... 66
APPENDIX A ............................................................................................................................ 67
APPENDIX B ............................................................................................................................ 69
APPENDIX C ............................................................................................................................ 70
APPENDIX D ............................................................................................................................ 71
APPENDIX E: GLOSSARY ...................................................................................................... 73

iv
Acronyms
AAEA Arkansas Association of Educational Administrators
ACSIP Arkansas Comprehensive School Improvement Plan
ACTAAP Arkansas Comprehensive Testing, Assessment, and Accountability Program
ADE Arkansas Department of Education
ADM Average Daily Membership
AEA Arkansas Education Association
AETN Arkansas Educational Television Network
AIP Academic Improvement Plan
ALE Alternative Learning Environment
AMAO Annual Measurable Achievement Objectives
APSCN Arkansas Public School Computer Network
AREA Arkansas Rural Education Association
ARRA American Recovery and Reinvestment Act
ASBA Arkansas School Boards Association
AYP Adequate Yearly Progress
BLR Bureau of Legislative Research
CCSSO Council of Chief State School Officers
CIV Compressed Interactive Video
COLA Cost of Living Adjustment
CPEP College Preparatory Enrichment Program
CRT Criterion-referenced tests
EAST Environmental and Spatial Technology Initiative
ELDA English Language Development Assessment
ELL English Language Learners
EOC End-of-course exam
ESL English as a Second Language
FTE Full-Time Equivalent
IDEA Individuals with Disabilities Education Act
IES U.S. Department of Education's Institute of Education Sciences
ISP Interim Study Proposal
LEP Limited English Proficiency
NCES National Center for Education Statistics
NORMES National Office for Research on Measurement and Evaluation Systems
NRT Norm-referenced tests
NSLA National School Lunch Act
PAM P.E., art and music
PD Professional Development
PLC Professional Learning Community
SAM Salary above the minimum salary on the salary schedule
SETDA State Educational Technology Directors Association
SFSF State Fiscal Stabilization Funds
SRSCA Secure Rural Schools & Community Self-Determination Act
SREB Southern Regional Education Board
STEM Science, technology, engineering and mathematics
URT Uniform Rate of Tax
U.S. DOE U.S. Department of Education

Page 1
Section 1: Introduction
Purpose of This Report During the 2003 regular legislative session, the General Assembly enacted Act 94 of 2003 to create the Joint Committee on Educational Adequacy, overseen by the House and Senate Interim Committees on Education. The committee's charge was to study the state's educational system and determine how it could offer an adequate education to all Arkansas public school students. A year later the General Assembly made that responsibility ongoing with Act 57 of the Second Extraordinary Session of 2003 (Act 57), which requires the Education Committees to study the entire educational system and report their findings and recommendations in September before every regular session. During the 2007 legislative session, the General Assembly refined the Act 57 requirements, passing Act 1204 of 2007 (Act 1204). (Acts 57 and 1204 are codified at A.C.A. § 10-3-2101 et seq. See Appendix A.) This report has been written to document the Legislature's compliance with those requirements. The adequacy study is a key element in the continued constitutionality of the state's system of funding public education. The Statutory Requirements Act 57 establishes eight broad areas the Education Committees must review each biennium. These include examining "the entire spectrum of public education" in Arkansas, reviewing the components of an adequate education and evaluating the costs of an adequate education. Act 1204 establishes that these broad reviews will be accomplished by:
Reviewing a report prepared by the Division of Legislative Audit compiling all funding received by public schools for each program
Reviewing the curriculum frameworks developed by the Department of Education
Reviewing the Arkansas Comprehensive Testing, Assessment, and Accountability Program
Reviewing fiscal, academic, and facilities distress programs
Reviewing the state's standing under the No Child Left Behind Act of 2001
Reviewing the Arkansas Comprehensive School Improvement Plan process
Comparing the average teacher salary in Arkansas with surrounding states and Southern Regional Education Board member states, including:
Comparing teacher salaries as adjusted by a cost-of-living index or a comparative wage index
Reviewing the minimum teacher compensation salary schedule
Reviewing expenditures from:
Isolated school funding
National school lunch state funding
Declining enrollment funding
Student growth funding
Special education funding
Reviewing disparities in teacher salaries
Completing an expenditure analysis and resource allocation review
Using evidence-based research as the basis for recalibrating as necessary the state's system of funding public education
Adjusting for the inflation or deflation of any appropriate component of the system of funding public education

Page 2
Act 1204 also established that the Education Committees would review any other program or topic identified for further study. This report is presented to document the Education Committees' compliance with those statutory mandates. For readability and coherence, this report is organized by topic, rather than by the order of the law's requirements. For a guide linking specific requirements of Acts 57 and 1204 to sections of this report, see Appendix B. This guide also indicates which sections respond to reviews required by interim study proposal (ISP). How the 2010 Study Was Conducted
During an Oct. 6, 2009, meeting of the House and Senate Interim Committees on Education, Rep. Eddie Cheatham made a motion to authorize the committee chairs to create a Joint Adequacy Evaluation Oversight Subcommittee (Adequacy Subcommittee). The Committee members approved the motion without objection. The Adequacy Subcommittee was charged with overseeing the completion of the 2010 adequacy evaluation. Rep. Bill Abernathy, Chair of the House Interim Committee on Education, and Sen. Jimmy Jeffress, Chair of the Senate Interim Committee on Education, served as the co-chairs of the Adequacy Subcommittee. The seven other House members selected by Rep. Abernathy to serve on the Subcommittee were:
Rep. Monty Betts Rep. Toni Bradford Rep. Les Carnine Rep. Eddie Cheatham Rep. David Rainey Rep. Rick Saunders Rep. Charolette Wagner
The seven other Senate members selected by Sen. J. Jeffress to serve on the Subcommittee were:
Sen. Shane Broadway Sen. Steve Bryles Sen. Joyce Elliott Sen. Kim Hendren Sen. Gene Jeffress Sen. Johnny Key Sen. Mary Anne Salmon
In October 2009, the Adequacy Subcommittee began hearing testimony on the topics established in Acts 57 and 1204. The Adequacy Subcommittee met 14 times, and presenters included representatives from the Arkansas Department of Education (ADE), school districts, the Division of Legislative Audit, and the Bureau of Legislative Research (BLR). (A list of all presenters can be found in Appendix C.) This report represents a summary of all testimony presented to the Adequacy Subcommittee and some of the testimony presented to the Education Committees. BLR staff also conducted extensive surveys of all 244 school district superintendents and a representative sample of 74 school principals. The surveys requested information on a wide spectrum of issues, including teacher salaries and incentive pay, the day-to-day responsibilities of school administrators, the types of technology schools use, district utility costs, and how districts use their categorical funds. BLR staff used the data collected to prepare a number of reports presented to the Adequacy Subcommittee. The BLR review also included site visits to each of the 74 schools to collect additional information on school and district needs.

Page 3
BLR staff examined each district's per-student expenditures and compared these expenditures by districts' racial make-up, student test scores, property taxes, and percentage of students in poverty. It also examined how much each district spent on instruction compared with administration. The testimony presented to the Adequacy Subcommittee, the school and district surveys, and the expenditure analysis drew from a wide variety of sources, including audits, surveys of other states, and data from national and regional authorities, such as the National Education Association and the Southern Regional Education Board. Arkansas teacher salaries were compared with other states using a cost of living adjustment. Inflation factors were determined by using projections from Moody's Economy and Global Insight, producers of national economic forecasting services. The Adequacy Subcommittee also solicited comment from educational associations. Volume II of this report, which is available online, contains copies of all materials presented to the Adequacy Subcommittee and the Education Committees for this adequacy review. Citations to the research mentioned in this report can be found with the original materials presented to the committees. The Adequacy Subcommittee carefully considered all of the information presented and has proposed a number of recommendations to the Education Committees concerning educational policy and funding. The recommendations are listed in Section 12 of this report. After reviewing the 2008-09 expenditure data, the Adequacy Subcommittee determined that school districts should receive an increase in funding, even though statewide they spent, on average, $70.75 less foundation funding than they received. The Adequacy Subcommittee noted that while some districts' needs were adequately met through foundation funding, the state aid was insufficient to meet the educational adequacy needs of nearly half of the districts. A total of 118 districts spent more than $5,789 per student on items meant to be covered by foundation funding. And by and large, the districts that spent less of their foundation funding tended to be districts that could afford to use other types of unrestricted funding. On average, the 127 districts that spent less than $5,789 collected $289.14 per student more in property taxes than those that spent more than the foundation funding provided.

Page 4
Section 2: Legal Landscape
The Arkansas Constitution provides that the state "shall ever maintain a general, suitable and efficient system of free public schools and shall adopt all suitable means to secure to the people the advantages and opportunities of education." Ark. Const. art.14, § 1. The primary Arkansas Supreme Court decisions interpreting this constitutional provision are Dupree v. Alma Sch. Dist. No. 30 of Crawford County, 279 Ark. 340, 651 S.W.2d 90 (1983) and Lake View Sch. Dist. No. 25 of Phillips County v. Huckabee, 370 Ark. 139, 257 S.W.3d 879 (2007). The Dupree court held that the state's constitutional responsibility included providing "equal educational opportunity" to the state's public school children. The court further interpreted the state's constitutional obligations through 15 years of litigation in the Lake View case. The court held (1) that an adequate education must be provided to all school children on a substantially equal basis with regard to curricula, facilities, and equipment, and (2) that it is the state's responsibility to: (a) define adequacy; (b) assess, evaluate, and monitor the entire spectrum of public education to determine whether equal educational opportunity is being substantially afforded to Arkansas's school children; and (c) know how state revenues are spent and whether true equality in education is being achieved. Lake View Sch. Dist. No. 25 of Phillips County v. Huckabee, 370 Ark. 139, 257 S.W.3d 879 (2007); see also Lake View Sch. Dist. No. 25 of Phillips County v. Huckabee, 358 Ark. 137, 156, 189 S.W.3d 1, 13 (2004). In both decisions, the court held that the ultimate responsibility for maintaining constitutionality rests with the state, even if local government fails to use state funding resources to provide an adequate education. Lake View, 351 Ark. at 79, 91 S.W.3d at 500 (citing Dupree, 279 Ark. at 349, 651 S.W.2d at 95). As stated earlier, the biennial adequacy study required by Act 57 is a key component of continued constitutionality. As a result, the General Assembly's efforts in recent years to define and fund an adequate education have been driven largely by the Lake View decisions. (A summary of the Lake View history and legislative response is provided in Appendix D.) In May 2007, the Arkansas Supreme Court declared the Arkansas public school funding system constitutional. This report is an important part of the state's efforts to maintain its focus on the condition of the public education system and take appropriate actions to keep the system in constitutional compliance.

Page 5
Section 3: Educational Adequacy
Definition The Adequacy Subcommittee used the following working definition of "educational adequacy" to serve as a basis for identifying the resources required for adequate funding:
(1) The standards included in the state's curriculum frameworks, which define what all Arkansas students are to be taught, including specific grade level curriculum and a mandatory thirty-eight (38) Carnegie units defined by the Arkansas Standards of Accreditation to be taught at the high school level;
(2) The standards included in the state's testing system. The goal is to have all, or all but
the most severely disabled, students perform at or above proficiency on these tests; and
(3) Sufficient funding to provide adequate resources as identified by the General
Assembly. Arkansas Public School Funding Overview The state's system for funding public schools is made up of a base per-student amount, known as foundation funding (A.C.A. § 6-20-2301 et seq.). Each district receives the foundation funding amount multiplied by its student count, or average daily membership (ADM). The foundation funding was set at $5,789 per student for 2008-09 and $5,905 for 2009-10. This funding is considered unrestricted, meaning school districts may spend the funding in the manner that best suits their schools' needs. The formula for calculating the foundation funding amount is known as the matrix. The matrix is made up of individual items considered necessary for the operation of schools, including teachers, principals, and instructional materials. The matrix establishes a funding value for each. For example, the line item for teacher salaries was set at $3,767.40 for FY2008-09. This value is one component of the total $5,789 per student for foundation funding that year. The General Assembly calculated the dollar amount of each line item based on the money needed to adequately fund the educational needs of a district with 500 students. Because the foundation funding is unrestricted, districts are allowed to spend more than $3,767.40 per student on teacher salaries and less on another line item or they may spend less on teacher salaries and more in a different area. The chart on the following page shows the proportion of each matrix line item in the total per-student foundation funding amount for FY2008-09 and FY2009-10. Foundation funding is discussed in greater detail in Sections 7 and 8 of this report.

Page 6
Per-Student Foundation Funding: 2008-09
Principal Salaries +
Benefits, $175.70
School-Level
Secretaries, $70.80
Technology, $201.00
Instructional
Materials, $163.20
Teacher Salaries +
Benefits, $3,767.40
Extra Duty Funds,
$51.00
Supervisory Aides,
$50.35
Substitutes, $59.00
Central Office, $383.50
Transportation,
$286.00
Operations and
Maintenance, $581.00
School districts also receive four other types of funding, known as categorical funding. The categorical funds are used to promote funding equity among school districts. Three of the four categorical funds are designed to help schools educate students with special needs. The fourth categorical fund is designed to pay districts for providing staff professional development. See Sections 7 and 9 for a more detailed discussion of categorical funding.
Categorical Funding Type
Description Amount in 2008-09 and 2009-10
English Language Learners (ELL)
Funding designed to help school districts educate students with limited English language proficiency.
$293 per ELL student
Alternative Learning Environment (ALE)
Funding designed to help school districts educate students who need different learning environments due to social or behavioral factors that make learning difficult in the traditional classroom.
$4,063 per ALE student
National School Lunch Act (NSLA)
Funding designed to help school districts with high percentages of poor students. This state funding should not be confused with the federal National School Lunch Act. The state money is called NSLA funding only because it uses the federal act's eligibility criteria for free and reduced price lunches.
>90%: $1,488 per NSLA student 70%-90%: $992 per NSLA student <70%: $496 per NSLA student
Professional Development (PD)
Funding designed to pay for professional development for teachers and staff. Most of the PD funding goes to districts, but up to $4 million (about $8.50 to $9 per student) supports a statewide online PD program.
$50 per student (Districts received $41.33 in FY2009, while ADE's online PD program received $8.67 per student)

Page 7
Unlike foundation funding, categorical funds are considered restricted, meaning that districts can only use these funds for their intended purpose. In addition to foundation and categorical funding, school districts also receive other special funding, including money to help with declining or growing enrollment and money to help isolated schools. This Arkansas adequacy study was conducted to determine whether the money provided by the state's funding formula provides public school districts with the resources needed to provide all public school students with a substantially equal opportunity for an adequate education.

Page 8
Section 4: State Student Achievement Statistics
The progress made by Arkansas’s public schools can be measured in part by student test scores, graduation rates and other education statistics. The statewide student test scores show that Arkansas is making significant improvements, but still lags behind the national average. National Assessment of Educational Progress (NAEP) Scores Students in the 4th and 8th grades take the NAEP assessment, a national exam used to compare the progress made by Arkansas students with the progress made by students in other states. Arkansas students' scores, on average, lag behind student scores nationally.
NAEP: 4th Grade Math
220
225
230
235
240
2003 2005 2007 2009
Av
era
ge
sc
ale
sc
ore
Arkansas
Nation
NAEP: 4th Grade Reading
210
212
214
216
218
220
222
2003 2005 2007 2009
Av
era
ge
sc
ale
sc
ore
Arkansas
Nation
NAEP: 8th Grade Math
255
260
265
270
275
280
285
2003 2005 2007 2009
Av
era
ge
sc
ale
sc
ore
Arkansas
Nation
NAEP: 8th Grade Reading
256
258
260
262
264
2003 2005 2007 2009
Av
era
ge
sc
ale
sc
ore
Arkansas
Nation

Page 9
Arkansas Benchmark Exams Student scores from the augmented benchmark exams are used to measure how well students are learning the Arkansas curriculum. Collectively, Arkansas students' scores are improving, with greater percentages of students scoring proficient or advanced each year.
Literacy Benchmarks: Elementary
0
20
40
60
80
2005
2007
2009
% P
rofi
cie
nt
or
Ad
va
nc
ed
3rd Grade
4th Grade
5th Grade
Math Benchmarks: Elementary
0
20
40
60
80
100
2005
2007
2009
% P
rofi
cie
nt
or
Ad
va
nc
ed
3rd Grade
4th Grade
5th Grade
Literacy Benchmarks: Middle Grades
0
20
40
60
80
2005
2007
2009
% P
rofi
cie
nt
or
Ad
va
nc
ed
6th Grade
7th Grade
8th Grade
Math Benchmarks: Middle Grades
0
20
40
60
80
100
2005
2007
2009
% P
rofi
cie
nt
or
Ad
va
nc
ed
6th Grade
7th Grade
8th Grade
End of Course Exams-Spring Scores
0
20
40
60
80
2007 2008 2009 2010% P
rofi
cie
nt
or
Ad
va
nc
ed
Grade 11
Literacy
Algebra
Geometry
Science: Benchmarks & End of Course
0
10
20
30
40
50
60
2008 2009 2010
% P
rofi
cie
nt
or
Ad
va
nc
ed
5th Grade
7th Grade
Biology-
Spring
Scores
Source: ADE

Page 10
College Entrance Exam Scores Arkansas students who took the ACT scored, on average, below the national average, but a far greater percentage of Arkansas graduates take the ACT than graduates nationally.
Average Composite ACT Score
19.5
20
20.5
21
21.5
2005
2006
2007
2008
2009
2010
Arkansas
Nation
Percent of Graduates
Who Took the ACT
0%
20%
40%
60%
80%
100%
2005
2006
2007
2008
2009
2010
Arkansas
Nation
Source: ACT, Inc.
Arkansas students who take the SAT typically score, on average, higher on that test than students nationally.
SAT: Critical Reading
460
480
500
520
540
560
580
600
2005 2006 2007 2008 2009
Arkansas
U.S.
SAT: Mathematics
480
500
520
540
560
580
2005 2006 2007 2008 2009
Arkansas
Nation
Source: The College Board
Page 11
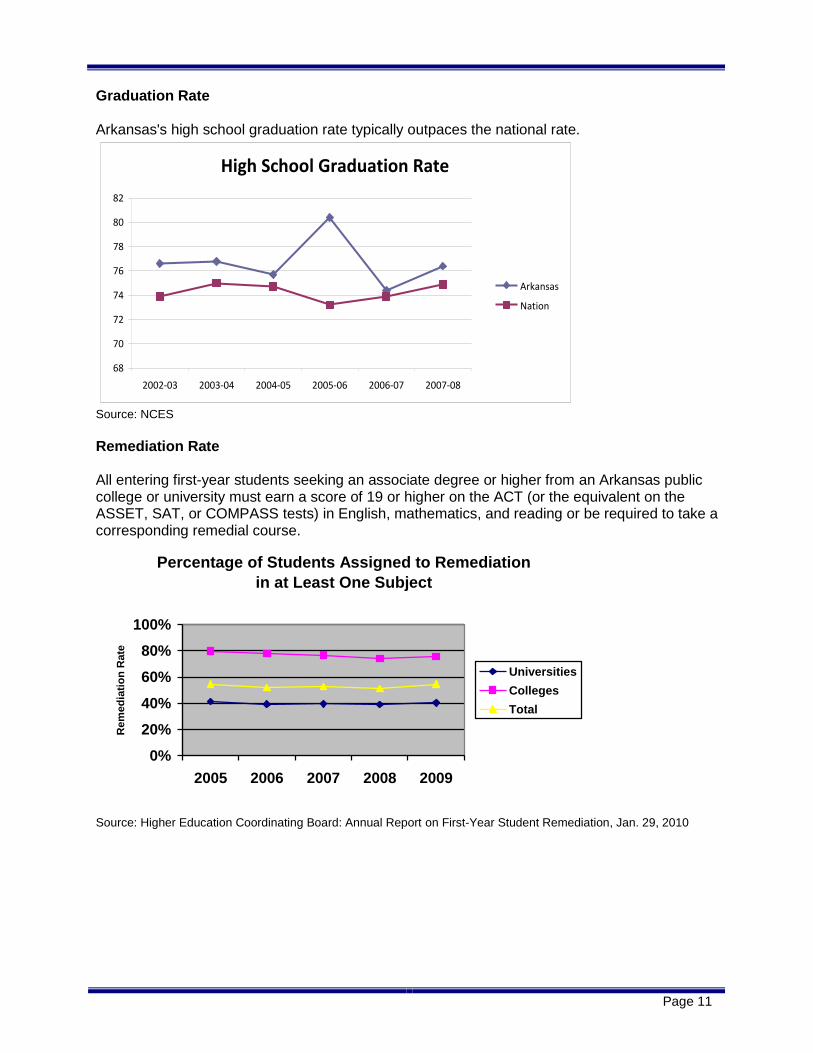
Graduation Rate Arkansas's high school graduation rate typically outpaces the national rate.
High School Graduation Rate
68
70
72
74
76
78
80
82
2002-03 2003-04 2004-05 2005-06 2006-07 2007-08
Arkansas
Nation
Source: NCES
Remediation Rate All entering first-year students seeking an associate degree or higher from an Arkansas public college or university must earn a score of 19 or higher on the ACT (or the equivalent on the ASSET, SAT, or COMPASS tests) in English, mathematics, and reading or be required to take a corresponding remedial course.
Percentage of Students Assigned to Remediation
in at Least One Subject
0%
20%
40%
60%
80%
100%
2005 2006 2007 2008 2009
Rem
ed
iati
on
Rate
Universities
Colleges
Total
Source: Higher Education Coordinating Board: Annual Report on First-Year Student Remediation, Jan. 29, 2010

Page 12
Achievement Gap While the test scores of African American and Hispanic students lags behind those of white students, the gap between them is generally narrowing. For example, in 2007, 38% of African American 4th graders scored proficient or advanced on the benchmark exams, compared with 68% of white 4th graders — a difference of 30 points. By 2009, that gap had reduced to 26 points. Similar gap reductions occurred with Hispanic students and low income students and across other grade levels.
4th Grade Literacy
0
20
40
60
80
100
2007 2008 2009
% P
rofi
cie
nt
or
Ad
van
ced
African
American
Hispanic
Caucasion
Low
Income
4th Grade Math
0
20
40
60
80
100
2007 2008 2009%
Pro
fic
ien
t o
r A
dv
an
ced
African
American
Hispanic
Caucasion
Low
Income
8th Grade Literacy
0
20
40
60
80
100
2007 2008 2009
% P
rofi
cie
nt
or
Ad
van
ced African
American
Hispanic
Caucasion
Low
Income
8th Grade Math
0
20
40
60
80
2007 2008 2009
% P
rofi
cie
nt
or
Ad
van
ced
African
American
Hispanic
Caucasion
Low
Income
Source: National Office for Research on Measurement and Evaluation Systems
Quality Counts Ranking Each year Education Week publishes a ranking of state education systems called Quality Counts. While Arkansas usually ranks relatively high in the overall scores, the state typically earns a D grade in the area of student achievement. The Student Achievement grade is awarded based on improvements in NAEP test scores, the state's graduation rate and AP test scores.
Student Achievement Grade Overall Grade Overall Rank
2008 D B- 8th
2009 D B- 10th
2010 D B- 10th

Page 13
Section 5: Statewide School Monitoring Programs
Arkansas Comprehensive Testing, Assessment, and Accountability Program (ACTAAP) ACTAAP is the state's student testing system in which every student and every public school is required to participate (A.C.A. § 6-15-401 et seq.) ACTAAP tests students to gauge their understanding of the state curriculum and uses the collective test scores to measure the quality of the education that schools provide. Dr. Gayle Potter, ADE's Associate Director of Curriculum, Assessment and Research, provided an overview of ACTAAP for the Adequacy Subcommittee. In 2009-10 students took five types of state tests:
Augmented benchmark exams (grades 3-8)
End-of-course (EOC) exams (Algebra I, Algebra II, Geometry, and Biology)
Grade 11 literacy exams
Alternate portfolio assessments (for students with disabilities)
Norm-referenced tests (MAT8 for kindergarten students and SAT10 for grades 1, 2, and 9)
Students in the 4th and 8th grades also take the National Assessment of Educational Progress (NAEP), a national exam used to compare the progress made by Arkansas students with the progress made by students in other states. However, NAEP is not considered part of the testing system established under state law. The state's augmented benchmark exam includes criterion-referenced test (CRT) questions customized to the Arkansas education standards, and it provides an norm-referenced test (NRT) score, comparing Arkansas students to other students nationally. NRTs are national standardized exams used to compare students' performance with one another and make state-to-state comparisons. CRTs, on the other hand, are state-developed exams designed to test a student's mastery of a particular topic. Student scores from the augmented benchmark exams are used to measure how well schools are educating students as required by Arkansas's curriculum standards and by the No Child Left Behind Act. Arkansas began benchmark testing in reading, writing, and math in March 2005 and began administering science tests in April 2008. All students enrolled in Algebra I, Geometry, and Biology for high school graduation credit must take the end-of-course exam. (Every Algebra II student takes an Algebra II end-of-course exam, but that test is not required under the ACTAAP statute.) All grade 11 students must take the grade 11 literacy exam or participate in the alternate assessment. Students who do not score at a proficient level must have an Academic Improvement Plan (AIP) and complete remediation to receive credit for the course. Act 1307 of 2009 establishes two types of EOC tests: general and high stakes. High stakes tests are those that students must pass to graduate. Students must take general EOCs, but their diplomas are not withheld if they do not pass. Biology and Geometry are considered general EOCs, and Algebra I and English II are now considered high stakes EOCs. Ninth grade students enrolled in Algebra I in 2009-10 will be the first group of students who will have to pass the Algebra I exam to graduate from high school. The 10th grade students in 2013-14 will be the first group of students who will be required to pass the English II exam to graduate.

Page 14
Arkansas Comprehensive School Improvement Plan (ACSIP) As part of the state's school accountability system, all Arkansas public schools and school districts are required to develop an Arkansas Comprehensive School Improvement Plan (ACSIP) (A.C.A. § 6-15-426 et seq.). An ACSIP is an annual planning and fund distribution document guiding the schools' and districts' strategies for improving student achievement. The plan is also used as the school's application for all federal programs administered by ADE, under the No Child Left Behind Act. The plan must include activities based on the school's greatest needs and document the performance of student subgroups if the subgroups did not make AYP. The General Assembly passed Act 807 of 2007, which requires ADE to monitor each school's and district's compliance regarding its ACSIP, including the use of funding for instructional facilitators, categorical funding programs, educational strategies, tutors, teachers' aides, counselors, social workers and nurses. As part of its monitoring process, ADE also was required to evaluate the research districts cited as support for their chosen strategies. ADE originally assigned the responsibility for monitoring district and school use of ACSIP to the Division of Learning Services: School Improvement Section. However, in March 2010, the staff monitoring ACSIP was separated from the School Improvement staff. The ACSIP monitoring process is now managed under new leadership. ADE reported that since February 2010, the department has conducted systematic on-site monitoring visits to ensure that schools and districts are adequately implementing the strategies documented in their ACSIP plans. Curriculum Frameworks: National Standards The Arkansas student testing and school accountability system is built around the state curriculum frameworks, the roadmap defining what students should learn in each grade and the skills they must exhibit to demonstrate that they've learned it. Dr. Gene Wilhoit, Council of Chief State School Officers (CCSSO), presented to the Education Committees information on the Common Core State Standards Initiative, a national effort to achieve common education standards all states can adopt. States currently have widely varying standards in terms of content and quality, and the country as a whole has slipped behind most industrialized nations in numbers of high school graduates and in performance. The central goal of Common Core is to achieve standards that are higher, clearer, and more streamlined than has been the case historically. Forty-eight states, including Arkansas, currently have signed on to the initiative agreeing with the need to develop these standards. (Texas and Alaska are the only states that have not signed on.) CCSSO has developed standards that ensure high school graduates will be college-ready, defined as being able to get a grade of "C" or better in a regular course (not a remedial course). The criteria for achievement that would warrant a grade of "C" was developed by college professors. The federal government encouraged states to adopt the Common Core standards by granting states points on their Race to the Top funding applications if they adopt the standards by Aug. 2, 2010. (For more information about Race to the Top, see pages 29 and 30.) In a June 2, 2010, press release, Gayle Potter, ADE's director of curriculum and assessment, said the standards will encourage "a deeper level of learning of important concepts." The Arkansas Board of Education approved the Common Core standards for K-12 English/language arts and math in July 2010.

Page 15
Distress Programs The state distress programs are designed to identify school districts that are unable to adequately educate students, are struggling financially, or are unable to adequately maintain their school buildings. The programs provide a graduated level of state assistance and impose sanctions if the school districts are still unable to meet standards. The state has three distress programs: academic distress, fiscal distress, and facilities distress. Academic Distress Academic distress is the state designation for districts that have demonstrated for a sustained period of time a lack of student achievement on the state-mandated, norm-referenced or criterion-referenced tests. Dr. Alice Barnes Rose, then ADE's Assistant Commissioner, Learning Services, presented information on academic distress to the Adequacy Subcommittee. She said the legislative mandate for this program was established by Act 1467 of 2003 and Act 35 of the Second Extraordinary Session of 2003 (A.C.A. § 6-15-431). ADE rules allow districts to be placed in academic distress if 75% or more of their students score below basic on criterion-referenced tests (Rule 10.04 of the Emergency Rules Governing the Arkansas Comprehensive Testing, Assessment, and Accountability Program and the Academic Distress Program). ADE has not yet identified any school as being in academic distress. (The state's school improvement process, a function of federal requirements under ESEA, is another academic accountability program. For more information about school improvement, see page 19.) Fiscal Distress A district in fiscal distress can be identified by a variety of financial problems including a declining balance that jeopardizes the district’s fiscal integrity; material failure to properly maintain facilities; and insufficient funds to cover payroll, benefits, and/or tax obligations. The state's fiscal distress program was designed to provide interventions to school districts to improve their financial status before a crisis exists (A.C.A. § 6-20-1901 et seq.). The process of identifying a district in fiscal distress starts with an annual financial review. Districts with a three-year declining balance are asked to respond to a financial questionnaire and provide additional financial information. ADE has a conference with those districts to collect more information, conducts a thorough financial analysis of the current status of the districts, and reports the findings to the Commissioner of Education. After districts receive notification and an opportunity to appeal, the state Board of Education decides whether to classify the district as being in fiscal distress. Once determined to be in fiscal distress, a district is prohibited from incurring any additional debt without ADE approval and must file an improvement plan with ADE. With recommendations and technical assistance from ADE, the district has two years to improve its fiscal status. ADE recommendations may include consolidation. Any district that fails to make adequate improvements within two years can be consolidated or reconstituted. To address the needs of such districts, ADE can replace the superintendent, appoint a new superintendent, suspend the local board or require fiscal training for the district staff or board, among other options.

Page 16
In September 2009, Mr. Bill Goff, ADE's Assistant Commissioner for Fiscal and Administrative Services, reported to the Joint Education Committees that there were 12 districts on the fiscal distress list. Those districts were:
Districts in First Year of Fiscal Distress
Districts in Second Year of Fiscal Distress
Districts in State Takeover
Mammoth Spring Concord Decatur
Mansfield Gentry Greenland
Osceola Hartford
Hermitage
Mineral Springs
Murfreesboro
Westside Consolidated
In October 2009, eight districts were removed from the fiscal distress list: Mammoth Spring, Concord, Gentry, Hartford, Hermitage, Mineral Springs, Murfreesboro and Westside Consolidated. Greenland and Decatur were removed from the fiscal distress list in January 2010. In May, the state Board of Education placed the Armorel School District on the list, joining six other districts.
Districts Currently in Fiscal Distress
Date Placed on List
Mansfield April 2009
Osceola April 2009
Yellville-Summit December 2009
Wickes December 2009
Forest City December 2009
McGhee April 2010
Armorel May 2010
In February, Goff gave another presentation on fiscal distress before the Adequacy Subcommittee. He noted that the most recent changes in the fiscal distress program were made by Act 1289 of 2009, which included education service cooperatives in the program, and Act 798 of 2009, which established an early intervention program for efforts to head off fiscal distress. Facilities Distress The facilities distress program was designed to provide state oversight and assistance to those school districts that fail to properly maintain their academic facilities in accordance with state laws (A.C.A. § 6-21-811) and related rules. Under the law, the Arkansas Commission for Arkansas Public School Academic Facilities and Transportation (Facilities Commission) may place a district in facilities distress for any of the following:
Material failure to properly maintain academic facilities
Material violation of local, state, or federal fire, health, or safety code provisions or laws
Material violation of building code provisions or laws
Material failure to provide timely and accurate facilities master plans to the Public School Academic Facilities and Transportation Division (Facilities Division)

Page 17
Material failure to comply with state laws regarding purchasing, bid requirements or school construction
Material default on any district debt obligation
Material failure to plan and progress satisfactorily toward accomplishing priorities set by the Facilities Division and the district's master plan
Mr. Doug Eaton, then Director of the Facilities Division, presented the Adequacy Subcommittee with information about facilities distress. He noted that only one district, the Hermitage School District, has been placed in facilities distress under the Academic Facilities Distress Program. Hermitage's designation was the result of building code and procurement law violations associated with a recent renovation project. The district was placed on facilities distress in July 2008, and the Facilities Commission removed it from the list in September 2009. For additional information about the state's facilities funding program, see page 21. Longitudinal Tracking System for State Education Data Mr. James Boardman, ADE's Assistant Commissioner for Research and Technology presented the Adequacy Subcommittee with information on the state's longitudinal tracking system, a data system that allows student enrollment data and test scores to be linked to teachers, programs and school finance data. The system will help determine which teachers and programs are most effective and which school expenditures have the most impact on student achievement. The system is part of the Arkansas Public School Computer Network (APSCN), which was created in 1992 as a statewide computer system connecting the administrative computing services of all public schools, including charter schools. Several years ago, electronic student transcripts were added to the system, allowing academic transcripts to be passed electronically from one school in the state to another as well as to universities and colleges. The Triand electronic transcript system also allows for more accuracy in student enrollment and consequently state savings in per-student funding (since transferring students were no longer being counted at more than one school). Now, when a student transfers from one district to another, the student's former school automatically receives an email reminding school officials to remove the student from their rolls. Additionally the student's new teachers have access to his/her test scores and grades from the previous school — important information for schools to have to support the academic achievement of transferring students. Additionally the APSCN system can be used as a teacher accountability tool by linking progress in student test scores with individual teachers to identify effective and ineffective educators. Ultimately it could be used to determine which programs are producing the greatest improvements. Arkansas is one of 27 states currently receiving funding through the U.S. Department of Education's Institute of Education Sciences (IES) Statewide Longitudinal Data Systems Grant Program. The program was designed to help states build capacity and the political will to develop and enhance student longitudinal data systems. The state has received three competitive IES grants and will receive nearly $18 million from 2005 through 2013. APSCN and the longitudinal tracking system have received national recognition from the Data Quality Campaign, a group of 50 organizations working to help improve education data. Arkansas is one of 12 states whose data systems include all 10 components that campaign considers "Essential Elements" of a state longitudinal system.

Page 18
ADE is able to break down the student achievement data by race, gender, poverty status, English language learners, students in alternative learning environments, etc. APSCN has about six years of student test score data on the system now that can be linked to and analyzed with demographic data. ADE's system will soon be able to help policy makers know which programs are effective in improving student performance. The last IES grant has allowed the ADE, in conjunction with UCA, to develop an educational research center. ADE has the ability to link student test scores to individual teachers, a capability that has attracted the attention of The Bill and Melinda Gates Foundation. The foundation has agreed to provide ADE $300,000 to improve the system so that it allows for exceptions to the current linkage system. ADE makes student achievement data available for use in teacher evaluations, but Boardman knew of no specific school that is using the data for that purpose. Some schools are participating in pilot programs that examine the use of student achievement data to determine teacher bonuses. Boardman cautioned, when using the data to examine teacher performance, it is important to remember the data will show statistical correlations between teachers and student performance, not necessarily cause and effect. For the last two years, ADE has published and sent back to the school districts a CD that includes how their high school graduates did during their first year in college. The CD provides information on whether the graduates went to college, the number of courses they took and their grade point averages. ADE also has developed a system, known as HIVE, which is designed to allow teachers to analyze student data and for the public to compare school districts. The new website that allows educators to see the student achievement data visually through charts, rather than simply as numbers on a page. The website, http://hive.arkansas.gov, gives the public access to six years' worth of student test scores (without student names or other identifying information) that users can manipulate and analyze themselves. No Child Left Behind The federal legislation known as the No Child Left Behind Act (NCLB), also called ESEA1, requires states to develop rigorous and challenging academic standards in language arts, math, and sciences (No Child Left Behind Act of 2001, Pub. L. 107-110, 115 Stat. 1425). NCLB requires states to test students in reading, writing, and math in grades 3-8; in high school starting with the 2005-06 school year; and in science beginning in 2007-08. NCLB requires schools to improve student test scores each year at a pace known as Adequate Yearly Progress (AYP). AYP is the target amount of progress schools need to make to ensure that all of their students are testing at grade level in literacy and math by the statutorily set deadline of 2013-14. AYP is based on procedures established in federal law. Schools must meet AYP for both their total population and for each of the subgroups (e.g., African-American, Hispanic, economically disadvantaged, limited English proficiency, etc.). Dr. Alice Barnes Rose, ADE's Assistant Commissioner for Learning Services, provided the Adequacy Subcommittee with an update on the state's progress under NCLB. The ADE receives data on schools' school improvement status in the fall, and after the appeals process, the statuses remain for a year until the next year’s test scores are processed.
1 The No Child Left Behind Act is the name given to the 2001 federal reauthorization of the Elementary
and Secondary Education Act. The terms NCLB and ESEA are often used interchangeably.

Page 19
A BLR report, described in more detail below (School Support Programs), documented 404 schools on the 2009 school improvement list and another 173 on alert. (It takes two consecutive years of not making AYP to get on the school improvement list, so the first year a school fails to make AYP, it is considered on alert). Of the state's nearly 1,100 schools, 503 — fewer than half — met standards for 2009. School Support Programs For ISP 2009-198, the BLR reviewed three state-funded programs that identify and help struggling schools in Arkansas: America's Choice, scholastic audit and the School Support Program.
America's Choice is a Washington D.C.-based company offering turnaround services for schools not meeting AYP. From 2006-07 to 2009-10, ADE contracted with the company to provide professional development training and on-site technical assistance, including facilitating teacher and leadership meetings for the school, demonstrating teaching strategies in the classroom and coaching the school's academic coaches.
Scholastic Audit: A scholastic audit is a detailed review of a school's learning environment, efficiency, and academic performance. ADE contracts with individual educators and sends them to selected schools to perform the audits. The audit teams analyze the strengths and limitations of the schools' instructional and organizational effectiveness and make recommendations to improve teaching and learning. Schools are measured against nine general standards, and the scholastic audit provides three to five recommendations for making improvements on each standard.
School Support Program: Act 1229 of 2005 created the School Support Program, a state-funded initiative of the Arkansas Leadership Academy (A.C.A. § 6-15-440). Program staff work with selected schools in school improvement to build the schools' leadership capacity, train the leadership team and work with school and district staff to improve student achievement. The School Support Program provides experienced academic coaches to work with the selected schools on a regular basis and develops incentive programs for institutions and program participants.
The BLR’s report examined year-over-year changes in the school improvement status of schools that received services from these programs.
Of the 22 schools that received America's Choice services for three years (2006-07 through 2008-09), two (9%) got off the school improvement list by 2008-09. One of the nine schools (11%) that worked with America’s Choice for two years was removed from the school improvement list.
Of the 34 schools that received a scholastic audit in 2006-07, two (6%) were removed from the school improvement list by 2008-09. One of the 30 schools audited in 2007-08 and one of the 32 schools audited in 2008-09 were also removed from the school improvement list.
Of the four schools in the School Support Program, one school (25%) was removed from the school improvement list.
While this report did not detect widespread improvement in the school improvement statuses of schools that received extra support, the BLR's report noted that the programs' full impact on student achievement may not be revealed through changes in school improvement status alone.

Page 20
While a school's status may have worsened, its student test scores may have actually improved. Measuring the success of these programs by the changes in school improvement status should be considered only the first step in evaluating the programs’ effectiveness. In a follow-up meeting on this issue, Dr. Denise Airola of the National Office for Research on Measurement and Evaluation Systems (NORMES) presented data on improvements in student test scores in the schools that received a scholastic audit and/or received services from America's Choice or the School Support program. Her report compared the student achievement increases made by the schools that received services and those made in all other schools. Her analysis found that "Schools participating in state programs made slightly more gains, on average, than other schools," but their improvement targets for making AYP and getting off school improvement were three to six times larger than the targets for other schools.
Schools that participated in America's Choice, School
Support or Scholastic Audit All Other Schools
Literacy - Change in % of students proficient 2004 to 2009
11.3% 9.2%
Math - Change in % of students proficient 2004 to 2009
23.4% 20.2%
ADE also reported that the state funding shown in the following table had been spent on each program. (The funding used to pay the state contract with America's Choice comes from federal Title I funding, not state general revenue.)
2006 2007 2008 2009
School Support Program $300,000 $300,000 $300,000 $300,000
America's Choice $6,095,000 $6,243,034 $6,203,242
Scholastic Audits $839,417 $906,317 $929,261
Scholastic Audit Contracts To address concerns regarding the funding and effectiveness of ADE's scholastic audit program, Dr. Tom Kimbrell, Commissioner; Dr. Diana Julian, then Deputy Commissioner; and Ms. Estelle Matthis, Director of Education Renewal Zones and Scholastic Audit provided information to the Joint Education Committees. The ADE testimony noted that interviews and observations suggest that audited schools have:
Improved the quality and quantity of curriculum documents aligned with state standards.
More students who can articulate what they are learning.
More focus on instructional process and better evaluation and assessment strategies.
More continuity in professional development.
More collaborative environment. However, ADE acknowledged that currently there are no systematic efforts in place to assess the effectiveness of scholastic audits in schools or school districts. ADE does not have the fiscal and human resources to successfully evaluate the effectiveness of all programs and interventions, but the department said it will continue to publish status and gain results in the annual performance reports, so that school performance can be evaluated.

Page 21
Section 6: Academic Facilities Ensuring the integrity and suitability of academic school buildings is part of the state's obligation to provide an adequate education. The General Assembly adopted legislation (Act 20 of the First Extraordinary Session of 2006) to protect the Educational Facilities Partnership Fund Account from funding cuts caused by the statute known as the doomsday clause (A.C.A. § 19-5-1227[d]). The doomsday clause is a state statute that calls for funding cuts to other state agencies if there is ever insufficient funding for the state to provide an adequate education. The General Assembly also adopted a prioritization system that designated construction projects aimed at keeping school buildings "warm, safe, and dry" as the state's highest facilities priority. The state has managed four main funding programs designed to help schools build and pay for school buildings and renovations: Immediate Repair, Transitional, Catastrophic and Partnership. Immediate Repair and Transitional were created as temporary programs, and both have expired. The state's main facilities funding program is the Partnership Program. Between the program's 2006 inception and March 2010, a total of 1,787 projects had been approved for funding. Of those, 612 (34.2%) had been cancelled either due to a statutory sunset provision or because the school rescinded the project. Another 489 (27.4%) were in progress, 613 (34.3%) had been completed, and 73 (4.1%) had not started. Since the Partnership Program's start in 2005, the Division has received (and is anticipated to receive through 2011) $799.7 million for all of the programs. As of June 21, the Facilities Commission has obligated to $755.36 million to projects through FY2011. That leaves about $44.35 million that the Division is expected to receive through FY2011, but has not committed to any project. The Facilities Division has funded all projects that applied for funding and met the program's criteria in the 2009-11 funding cycle. The Division will apply the $44.35 funding to projects approved in the 2011-13 cycle and keep a small reserve of funding for unexpected expenses in the Catastrophic Program. The Partnership Program account, which holds funding for all of the state facilities funding programs, had a fund balance of $291,808,191 at the end of FY2010, although, as mentioned above, most of that funding had been obligated to facilities projects. Another important facilities issue is failed millage elections. Because the state's funding program for school construction is a partnership between the state and local school districts, districts that are unable to raise their share of the project funding due to a millage failure may have a difficult time providing an adequate and equitable education. Between 2007 and mid-2009, 27 school districts had millage failures that affected their master plans. Five of those districts were able to successfully pass millage increases in subsequent elections. Mr. Doug Eaton, then Facilities Division director, reported that the other districts with failed millages have worked to find funding alternatives or have scaled back projects to successfully avoid further state interference. No school districts have been placed in facilities distress because of failed millages. Many school districts have been able to pay for needed facilities projects through the American Recovery and Reinvestment Act of 2009 (ARRA). ARRA provided money for school construction, renovation, and repair through the education portion of the State Fiscal Stabilization Funds. According to data provided by the Arkansas Division of Public School Academic Facilities and Transportation, school districts reported plans for spending ARRA funding on 194 new construction projects, 462 modernization projects, 352 renovation projects, and 122 repair projects.

Page 22
Some districts are using ARRA funds to cover their local share of a project already approved for Partnership funding. Other districts are using the money to pay for facility projects that the state Partnership Program does not cover. Districts are also using the stimulus funding for projects that that they believe cannot wait another year and a half when the next cycle of Partnership Program projects are approved.

Page 23
Section 7: State Disbursements
Authorized Funding For All Education Funds This section of the report describes the selected funding disbursed from state accounts to school districts and other entities. It provides a broad overview of the funding impact that the enactments of the General Assembly have had beginning with the Second Extraordinary Session of 2003. The following table provides the actual funding levels authorized for K-12 education for FY2004-05 through FY2008-09 and the projected funding levels for FY2009-10 through FY2010-11 that have been allocated to the following funds:
Public School Fund
Department of Education Fund Account
Educational Excellence Trust Fund
Educational Adequacy Fund
Educational Facilities Partnership Fund Account
Division of Public School Academic Facilities and Transportation Fund Account
Fiscal Year
Department of Education
Public School Fund Acct
General Education
Fund - Department of
Education Fund Acct
Educational Excellence Trust ADE -
Public School Fund
Educational Excellence
Trust - Dept of Education
Fund Acct
Educational Facilities
Partnership Fund Acct
and DPSAF&T Fund Acct
Educational Adequacy
Fund
Total All Selected Funds
2005 $1,587,868,208 $11,841,192 $165,146,201 $809,075 $20,439,774 $442,872,886 $2,228,977,336
2006 $1,664,928,944 $13,536,267 $178,219,239 $873,122 $54,214,982 $426,505,888 $2,338,278,442
2007 $1,722,737,993 $13,433,942 $191,219,957 $936,815 $90,976,326 $448,450,030 $2,467,755,062
2008 $1,830,265,989 $15,799,231 $200,422,877 $981,901 $502,643,494 $438,730,903 $2,988,844,395
2009 $1,843,274,503 $14,769,806 $193,587,342 $948,413 $51,250,656 $433,090,041 $2,536,920,761
2010 Est. $1,765,612,264 $17,281,209 $190,786,665 $934,692 $36,405,154 $405,100,000 $2,416,119,984
2011 Est. $1,831,159,072 $15,167,661 $179,182,166 $877,840 $55,812,531 $449,300,000 $2,510,499,270

Page 24
State Disbursements of Selected State Funding The following tables show the total state-level expenditures for each type of funding. The expenditures include both the funding provided to the school districts and funding provided to public charter schools. The expenditures discussed in other sections of this report exclude the funding of and spending by charter schools. Foundation Funding The state's system for funding public schools is made up of a base per-student amount, known as foundation funding (A.C.A. § 6-20-2301 et seq.). Each district receives the foundation funding amount multiplied by its ADM.
State Expenditures: Foundation Funding
2007-08 2008-09 2009-10 2010-11
Per student $5,719 $5,789 $5,905 $6,023
Total $1,830,406,323 $1,831,305,419 $1,788,683,790 $1,813,597,668
Budgeted *Total expenditures include enhanced funding, but do not include state funding generated by the uniform rate of tax.
Enhanced Funding The General Assembly provided enhanced educational funding in the amount of $35 per student for FY2009-10 and did not provide any enhanced funding in FY2010-11. The General Assembly made clear in A.C.A. § 6-20-2305(a)(2)(c)(ii)(b) that this enhanced funding was in excess of the amount required to provide an adequate education and "cannot be ensured and may not be relied on beyond the 2007-2009 biennium."
State Expenditures: Enhanced Funding
2007-08 2008-09 2009-10 2010-11
Per student $51 $87 $35 $0
Total $23,510,862 $40,306,155 $16,166,269 $0
Budgeted
URT Actual Collection Adjustment The General Assembly also provided appropriation and funding for a URT actual collection adjustment. That funding is designed to ensure that each district receives state foundation funding aid based on the full 98 percent of URT collections, which is the percent of tax collections that the state foundation formula assumes each district will collect. If a district collects more than 98 percent of its URT, it must return the excess to the state.
State Expenditures: URT Actual Collection Adjustment
2007-08 2008-09 2009-10 2010-11
$23,446,227 $28,937,808 $34,191,012 $34,500,000
Budgeted
Page 25
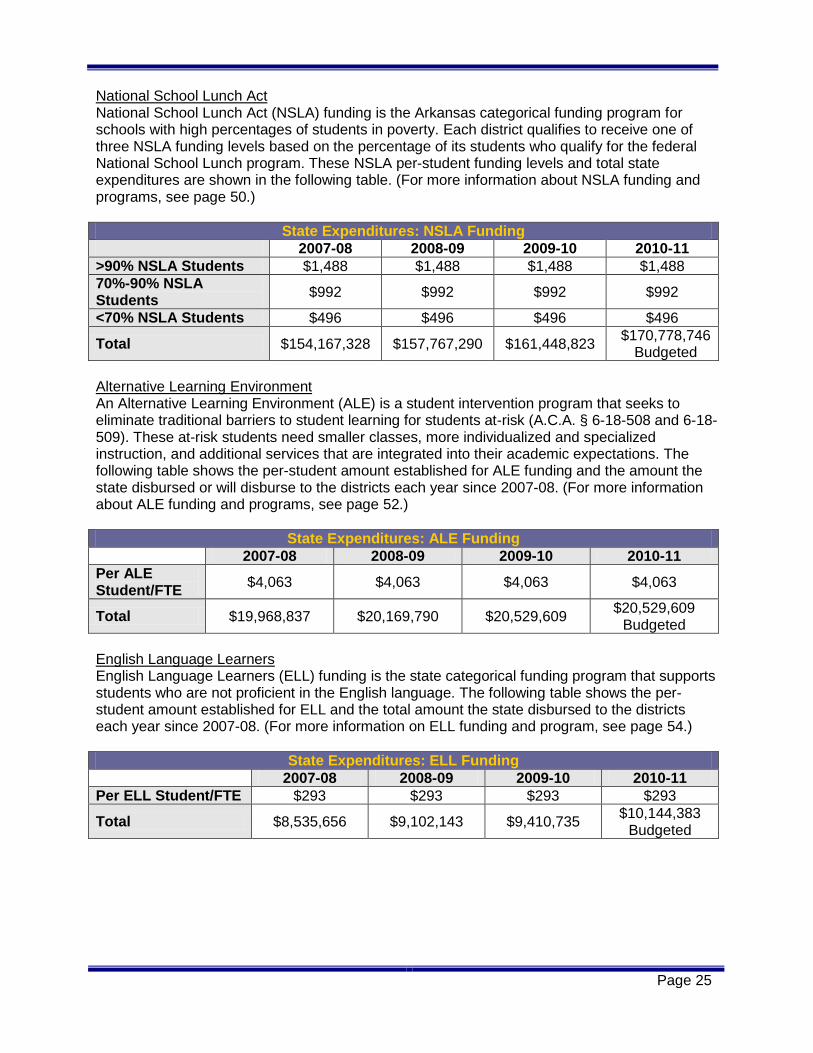
National School Lunch Act National School Lunch Act (NSLA) funding is the Arkansas categorical funding program for schools with high percentages of students in poverty. Each district qualifies to receive one of three NSLA funding levels based on the percentage of its students who qualify for the federal National School Lunch program. These NSLA per-student funding levels and total state expenditures are shown in the following table. (For more information about NSLA funding and programs, see page 50.)
State Expenditures: NSLA Funding
2007-08 2008-09 2009-10 2010-11
>90% NSLA Students $1,488 $1,488 $1,488 $1,488
70%-90% NSLA Students
$992 $992 $992 $992
<70% NSLA Students $496 $496 $496 $496
Total $154,167,328 $157,767,290 $161,448,823 $170,778,746
Budgeted
Alternative Learning Environment An Alternative Learning Environment (ALE) is a student intervention program that seeks to eliminate traditional barriers to student learning for students at-risk (A.C.A. § 6-18-508 and 6-18-509). These at-risk students need smaller classes, more individualized and specialized instruction, and additional services that are integrated into their academic expectations. The following table shows the per-student amount established for ALE funding and the amount the state disbursed or will disburse to the districts each year since 2007-08. (For more information about ALE funding and programs, see page 52.)
State Expenditures: ALE Funding
2007-08 2008-09 2009-10 2010-11
Per ALE Student/FTE
$4,063 $4,063 $4,063 $4,063
Total $19,968,837 $20,169,790 $20,529,609 $20,529,609
Budgeted
English Language Learners English Language Learners (ELL) funding is the state categorical funding program that supports students who are not proficient in the English language. The following table shows the per-student amount established for ELL and the total amount the state disbursed to the districts each year since 2007-08. (For more information on ELL funding and program, see page 54.)
State Expenditures: ELL Funding
2007-08 2008-09 2009-10 2010-11
Per ELL Student/FTE $293 $293 $293 $293
Total $8,535,656 $9,102,143 $9,410,735 $10,144,383
Budgeted

Page 26
Professional Development Professional development (PD) for educators is a critical factor in the effort to improve student performance and ensure highly qualified teachers in the classroom. The Arkansas Accreditation Standard 10.01.3 requires that all teachers have 60 hours of professional development each school year. The following table shows the per-student amount established for PD and the amount the state disbursed to the districts each year since 2007-08. (For more information about PD funding and programs, see page 56.)
State Expenditures: PD Funding
2007-08 2008-09 2009-10 2010-11
Per Student $50 $50 $50 $50
Total $22,957,219 $23,130,913 $23,052,341 $23,171,500
Budgeted
Isolated Funding There are two types of isolated funding: Isolated Funding and Special Needs Isolated Funding.
Isolated Funding
The isolated funding program was created by Act 1318 of 1997 (A.C.A. § 6-20-601). It was designed to provide additional funding to school districts with geographic challenges, such as a rugged road system or low student density, which made expenses, such as bus transportation, more expensive. One of the funding criteria under the 1997 statute was that a school district have fewer than 350 students. Then during the Second Extraordinary Session of 2003, legislation called for the consolidation of any school district with fewer than 350 students. To ensure that the isolated districts that were consolidated continued to receive isolated funding, Act 60 and 65 of the Second Extraordinary Session of 2003 created the definition for isolated schools and provided continued isolated funding for the annexed isolated districts. A.C.A. § 6-20-603 lists 56 isolated areas and specifies the per-student funding amount provided to the school districts containing them. The highest per-student funding amount, $2,219, goes to the Alread isolated school area, which was annexed by the Clinton School District in 2006. The smallest amount, $1 per student, goes to the Stephens School District in Ouachita County.
State Expenditures: Isolated Funding
2007-08 2008-09 2009-10 2010-11
$7,895,996 $7,156,657 $3,485,235 $7,896,000 Budgeted
Special Needs Isolated Funding
Act 1452 of 2005 created the Special Needs Isolated Funding Program to provide additional funding to another group of isolated districts, defined under separate, but related criteria: Districts must have been part of a consolidation or annexation.
Page 27
The local school board must have determined that combining the isolated school to one district campus would be "impractical or unwise."
The State Board of Education must verify that the school or district meets the requirements established under the isolated funding program (A.C.A. § 6-20-601). However, unlike the original isolated funding program, districts with more than 350 students can qualify for special needs isolated funding.
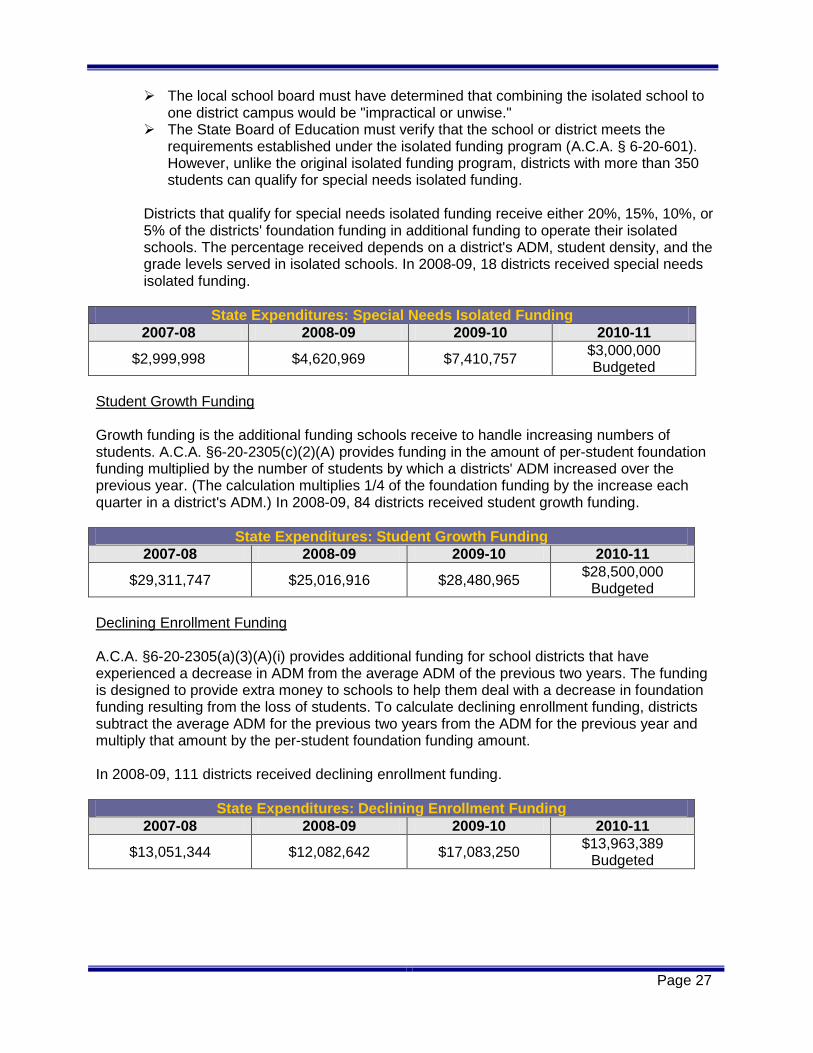
Districts that qualify for special needs isolated funding receive either 20%, 15%, 10%, or 5% of the districts' foundation funding in additional funding to operate their isolated schools. The percentage received depends on a district's ADM, student density, and the grade levels served in isolated schools. In 2008-09, 18 districts received special needs isolated funding.
State Expenditures: Special Needs Isolated Funding
2007-08 2008-09 2009-10 2010-11
$2,999,998 $4,620,969 $7,410,757 $3,000,000 Budgeted
Student Growth Funding Growth funding is the additional funding schools receive to handle increasing numbers of students. A.C.A. §6-20-2305(c)(2)(A) provides funding in the amount of per-student foundation funding multiplied by the number of students by which a districts' ADM increased over the previous year. (The calculation multiplies 1/4 of the foundation funding by the increase each quarter in a district's ADM.) In 2008-09, 84 districts received student growth funding.
State Expenditures: Student Growth Funding
2007-08 2008-09 2009-10 2010-11
$29,311,747 $25,016,916 $28,480,965 $28,500,000
Budgeted
Declining Enrollment Funding A.C.A. §6-20-2305(a)(3)(A)(i) provides additional funding for school districts that have experienced a decrease in ADM from the average ADM of the previous two years. The funding is designed to provide extra money to schools to help them deal with a decrease in foundation funding resulting from the loss of students. To calculate declining enrollment funding, districts subtract the average ADM for the previous two years from the ADM for the previous year and multiply that amount by the per-student foundation funding amount. In 2008-09, 111 districts received declining enrollment funding.
State Expenditures: Declining Enrollment Funding
2007-08 2008-09 2009-10 2010-11
$13,051,344 $12,082,642 $17,083,250 $13,963,389
Budgeted

Page 28
Other State Funding Disbursed to School Districts The Division of Legislative Audit staff presented a report to the Adequacy Subcommittee entitled, Department of Education Grants Summarized by the Division of Legislative Audit For the Year Ended June 30, 2009, which detailed education funding disbursed by the state to each school district, charter school, education service cooperative, and other organization. The funding is disbursed from the Public School Fund, the Department of Education Fund, the Education Facilities Partnership Fund, the Division of Public School Academic Facilities and Transportation Fund, the Property Tax Relief Trust Fund, federal funds, and cash funds. The report detailed 32 types of funding distributed to districts through the Public School Fund, in addition to foundation funding and categorical funding. The report also recorded 26 types of federal funds disbursed to districts. The report documented more than $2 billion provided to the districts through foundation and categorical funding in FY2008-09. (Not included in these disbursements is the URT funding that all districts have as part of the per-student foundation funding.) Districts also received $274,698.695 from the Public School Fund in other types of funding. And they received $434,374,565 in federal funds. Federal Funding: American Recovery and Reinvestment Act The districts have begun receiving new, one-time federal money made available through the American Recovery and Reinvestment Act of 2009 (ARRA). In separate presentations, the BLR and ADE presented information for the Adequacy Subcommittee and the Education Committees regarding the federal funding provided for education programs through ARRA. The ARRA education programs will contribute at least $619 million in federal funds to Arkansas’s elementary and secondary schools (including $5.6 million for pre-K). The legislation has provided funding to the state of Arkansas for the following education programs:
Program Arkansas’s Allocation
Title I-A Grants to Local Education Agencies are targeted toward schools with high concentrations of pupils from low-income families. These funds support programs such as extra instruction in reading and mathematics, as well as special preschool, after-school, and summer programs to extend and reinforce the regular school curriculum.
$111,092,138
Title I School Improvement Grants are used to improve student achievement in Title I schools identified for improvement, corrective action, or restructuring to enable those schools to make AYP and get out of school improvement.
$40,196,637
Grants for Education Technology are provided to increase access to educational technology, support the integration of technology into instruction and enhance technological literacy, and support technology-related professional development of teachers.
$7,125,783

Page 29
Program Arkansas’s Allocation
Individuals with Disabilities Education Act (IDEA) Grants provide additional support for special education and related services for students with disabilities, such as purchasing assistive technology devices and providing professional development for special education teachers.
$112,177,900 (and $5,565,646 for Pre-K)
Education for Homeless Children and Youth Program provides funding to purchase supplies, clothing, and other school-related necessities for homeless children.
$644,553
School Lunch Equipment Program provides assistance to schools for the purchase of lunch room equipment through the federal National School Lunch Program
$1,249,361
Teacher Incentive Fund Grants supports efforts to develop and implement performance-based teacher and principal compensation systems in high-need schools.
$0 The Augusta School District was the only Arkansas school district to apply for funding, but it was not awarded a grant.
Investing in Innovation Grants provides funding to applicants with a record of improving student achievement to help them expand their innovative practices.
$0 Two Arkansas Educational Service Cooperatives and 24 Arkansas school districts applied for innovation grants. No Arkansas school districts were listed among the highest-rated applications for funding [making the list is the first step toward receiving funding], but at least two organizations that did make the list have operations in Arkansas: the KIPP Foundation (requesting $50 million) and Teach for America (requesting $50 million).
Race to the Top is a competitive grant program designed to encourage and reward states that are creating the conditions for education innovation and reform. These grants are targeted toward states that are achieving significant improvements in student outcomes, closing achievement gaps, improving high school graduation rates, and ensuring student preparation for success in college and careers. For more information on Race to the Top, see page 30.
$0 Arkansas has not been selected in either the first or the second rounds of competition for this grant.
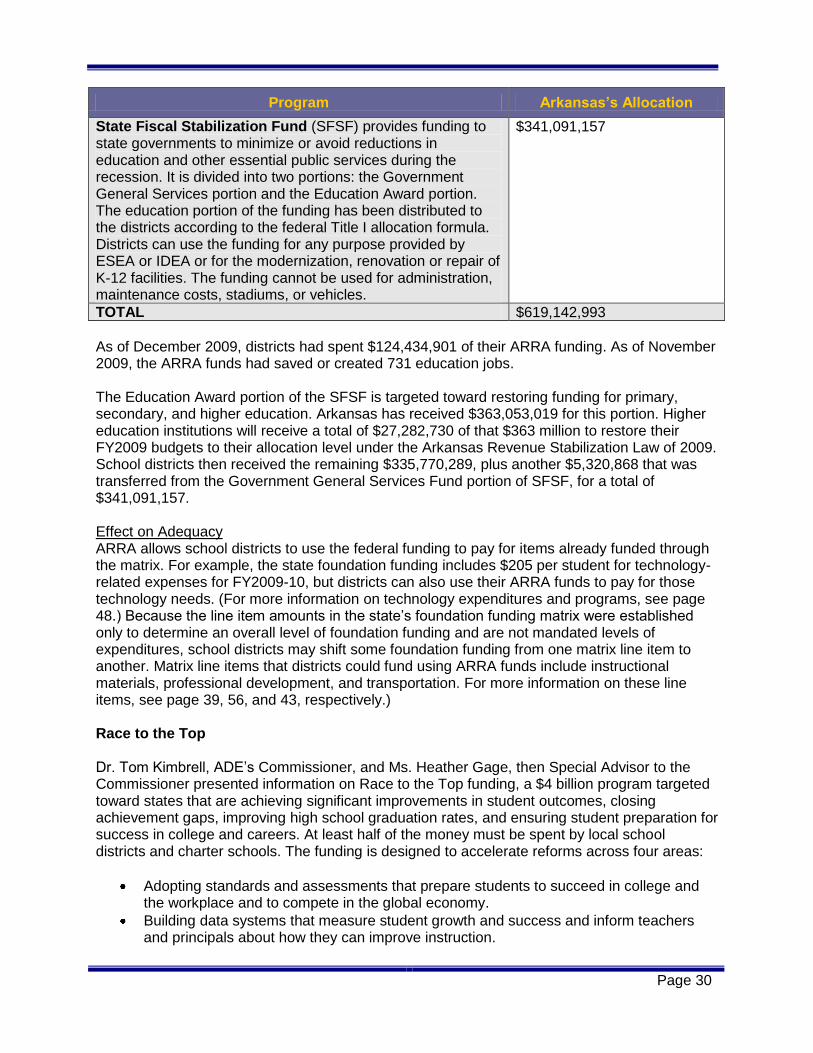
Page 30
Program Arkansas’s Allocation
State Fiscal Stabilization Fund (SFSF) provides funding to state governments to minimize or avoid reductions in education and other essential public services during the recession. It is divided into two portions: the Government General Services portion and the Education Award portion. The education portion of the funding has been distributed to the districts according to the federal Title I allocation formula. Districts can use the funding for any purpose provided by ESEA or IDEA or for the modernization, renovation or repair of K-12 facilities. The funding cannot be used for administration, maintenance costs, stadiums, or vehicles.
$341,091,157
TOTAL $619,142,993
As of December 2009, districts had spent $124,434,901 of their ARRA funding. As of November 2009, the ARRA funds had saved or created 731 education jobs. The Education Award portion of the SFSF is targeted toward restoring funding for primary, secondary, and higher education. Arkansas has received $363,053,019 for this portion. Higher education institutions will receive a total of $27,282,730 of that $363 million to restore their FY2009 budgets to their allocation level under the Arkansas Revenue Stabilization Law of 2009. School districts then received the remaining $335,770,289, plus another $5,320,868 that was transferred from the Government General Services Fund portion of SFSF, for a total of $341,091,157. Effect on Adequacy ARRA allows school districts to use the federal funding to pay for items already funded through the matrix. For example, the state foundation funding includes $205 per student for technology-related expenses for FY2009-10, but districts can also use their ARRA funds to pay for those technology needs. (For more information on technology expenditures and programs, see page 48.) Because the line item amounts in the state’s foundation funding matrix were established only to determine an overall level of foundation funding and are not mandated levels of expenditures, school districts may shift some foundation funding from one matrix line item to another. Matrix line items that districts could fund using ARRA funds include instructional materials, professional development, and transportation. For more information on these line items, see page 39, 56, and 43, respectively.) Race to the Top Dr. Tom Kimbrell, ADE’s Commissioner, and Ms. Heather Gage, then Special Advisor to the Commissioner presented information on Race to the Top funding, a $4 billion program targeted toward states that are achieving significant improvements in student outcomes, closing achievement gaps, improving high school graduation rates, and ensuring student preparation for success in college and careers. At least half of the money must be spent by local school districts and charter schools. The funding is designed to accelerate reforms across four areas:
Adopting standards and assessments that prepare students to succeed in college and the workplace and to compete in the global economy.
Building data systems that measure student growth and success and inform teachers and principals about how they can improve instruction.

Page 31
Recruiting, developing, rewarding, and retaining effective teachers and principals, especially where they are needed most.
Turning around the lowest achieving schools. In the first round of the Race to the Top competition Arkansas sought $374 million, but the state’s application was unsuccessful. The state was not among the 16 finalists — 15 states and Washington D.C. — chosen. Arkansas’s application was ranked 17th. Ultimately Delaware and Tennessee were chosen as funding recipients in the first round. Arkansas applied in the second round of funding, this time seeking $171,377,367 million, but again, the state was not named among the 18 finalists. Median Per-Pupil Expenditures Arkansas's median per-pupil expenditure from all funding sources is below the U.S. median and has grown at a slower pace. In 2004-05, nine states spent less on education, but by 2006-07 (the latest year for which median per-pupil expenditures are available), just five states spent less.
Median Per-Pupil Expenditures
U.S. % Increase Arkansas % Increase Arkansas State Rank
2004-05 $8,061 $7,127 10th lowest
2005-06 $8,587 6.5% $7,547 5.9% 8th lowest
2006-07 $9,056 5.5% $7,859 4.1% 6th lowest Source: National Center for Education Statistics

Page 32
Section 8: District Use of Foundation Funding
This section examines district use of foundation funding. It summarizes a report the BLR provided to the Adequacy Subcommittee that examined district expenditures compared with funding provided through the matrix. This section also included information on measures of inflation and deflation, followed by two summaries of BLR reports on teachers salaries and technology. Foundation Funding The state's system for funding public schools is made up of a base per-student amount, known as foundation funding (A.C.A. § 6-20-2301 et seq.). Each district receives the foundation funding amount multiplied by its ADM. Foundation funding makes up 55% of districts' total revenue. To examine a full year of funding and expenditures, the BLR examined districts' use of their 2008-09 foundation funding, which was set at $5,789 that year.
Foundation Funding
2006-07 2007-08 2008-09 2009-10 2010-11
Per student $5,662 $5,719 $5,789 $5,905 $6,023
The formula for arriving at the per-student funding amount is known as the matrix. The matrix calculates the per-student funding based on the cost of personnel and other resources for operating a prototypical school of 500 students. In general the matrix is divided into three parts:
School-level salaries of 33.665 teachers and other pupil support staff, a principal and a secretary. The matrix also determines how many of which type of teachers and other personnel are needed.
School-level resources including instructional materials and technology-related expenses.
District-level resources, which includes funding for operations & maintenance, districts' central office and transportation expenses.
2008-09 Matrix
School-Level Salaries
Positions Average Salary and Benefits
Per-Pupil Amount For a School With
500 Students
Non-Administrative Staff 33.665 $55,954 $3,767.40
Classroom Teachers 24.94 $2,790.99
Special Education Teachers 2.9 $324.53
Instructional Facilitators o 2 FTEs for instructional
facilitators, including .5 FTEs for an instructional facilitator with technology expertise
o .5 FTEs for an assistant principal
2.5 $279.77
Librarian/Media Specialist .825 $92.32
Guidance Counselor & Nurse 2.5 $279.77

Page 33
2008-09 Matrix
o 1.11 FTE for a counselor o 0.67 FTE for a nurse o 0.72 FTE for additional
student services personnel
Administrative Staff 2
Principal 1 $87,860 $175.70
Secretary 1 $35,415 $70.80
School-Level Resources
Technology $201
Instructional Materials $163.20
Extra Duty Funds $51
Supervisory Aides $50.35
Substitutes $59
District-Level Resources
Operations and Maintenance $581
Central Office $383.50
Transportation $286
TOTAL $5,789
School-Level Salaries The category of school-level salaries includes those for traditional classroom teachers, special education teachers, instructional facilitators, librarians, counselors, nurses, principals, and other health and clerical support. Funding for the total school-level personnel group constitutes 69.3% of the per-pupil funding contained in the FY08-09 matrix. School-Level Non-Administrative Staff The district average for non-administrative school-level positions was lower than the positions provided for with matrix funds. The following table compares the matrix number for all non-administrative school-level staff with the average number for all districts.
2008-09 Non-Administrative Staff
Staff Matrix Number District Average Per 500
Students Difference
Non-administrative
school-level total 33.665 29.97 -3.695
The average teacher salary in the matrix is used to compute costs for the standards-based 33.665 school-level positions in the matrix. Since the base average salary was set at $39,000 for 2005, it has been increased incrementally each year. To that annual base average salary, another 22% of that amount has been added for benefits, as well as a flat rate of $1,572 for health insurance. The average teacher salary with benefits in the matrix for 2008-09 is $55,954. However the actual average teacher salary with benefits was $57,407.91. Of the 244 districts surveyed, 180 (73.8%) had averages plus benefits below the average teacher salary and benefits in the matrix. Higher salaries in larger districts appear to be driving the statewide average salary higher. The 25 districts (10.2%) with the highest teacher salary

Page 34
averages employ over one-third (37%) of the FTE teachers in the state. In other words, the funding for the average teacher salary and benefits in the matrix meets or exceeds the average teacher salary in 73.8% of the districts in the state. (For more information on teacher salaries, see page 45.) The following pages examine each of the line items making up the 33.665 positions. Classroom Teachers Many studies consider the quality of the classroom teacher to be the most important factor in student achievement. In 2009, schools statewide spent $1,191 million on classroom teachers. This equates to approximately $2,596.40 per student. The matrix funded $2,790.99 per student for classroom teachers for FY2008-09.
2008-09 Classroom Teachers Funding and Expenditures
Matrix Amount Expenditures Per Student Difference Expenditures
$2,790.99 $2,596.40 -$194.59 $1,191 million
The average number of classroom teachers is slightly lower than the staffing level established in the matrix. The following table compares the matrix number for classroom teachers with the average number for all districts.
2008-09 Classroom Teachers
Staff
Matrix Number
District Average per 500 Students
Difference
Classroom Teachers 24.94 23.32 -1.62
The matrix separates classroom teachers into two groups. The first group, referred to in this report as core teachers, includes teachers whose primary responsibility in lower grades is to serve as the primary classroom teacher and in higher grades is to teach in one or more of four academic areas: literacy, math, science, and social studies. The second group, referred to as non-core teachers, includes educators who teach physical education, art, or music (PAM), or other electives. The matrix sets the number of core teachers needed at 20.8 and the number of non-core teachers needed at 20% of that number. Twenty percent of 20.8 core teachers is 4.16 (or 4.14, the number in the matrix, when rounding of 20.8 is removed) non-core teachers per 500 students.

Page 35
The following table shows how schools of each level and size compared with the matrix in their average number of core and non core teachers. It shows that high schools, particularly large high schools, have fewer of the core teachers called for by the matrix and more non-core teachers.
Special Education Special education students are those defined as having an individual education plan (IEP). Special education students constitute approximately 11.2% or 52,174 students statewide. In 2009, schools statewide spent $151.6 million on special education teachers. This equates to approximately $330.38 per student. The matrix funded $324.53 per student for special education teachers for FY2008-09. The expenditures per student for all students equates to 5.78% of the overall matrix, rather than 5.61% of the matrix provided funding.
2008-09 Special Education Teachers Funding and Expenditures
Matrix Amount Expenditures Per
Student Difference Expenditures
$324.53 $330.38 $5.85 $151.6 million
3.64
-3.44
-2.53
-4.04-3.40
-4.41
-8.03
-1.58
1.16
4.16
2.20
6.716.16
4.18
-1.36-0.88 -1.34-1.15
-10.00
-8.00
-6.00
-4.00
-2.00
0.00
2.00
4.00
6.00
8.00
Core Teacher Difference From Matrix
Non-Core Teacher Difference From Matrix
Elementary 1-300 (*9)
Elementary 301-500 (*22)
Elementary 501+ (*9)
Middle 1-300 (*3)
Middle 301-500 (*5)
Middle 501+ (*5)
High 1-300 (*10)
High 301-500 (*5)
High 501+ (*6)

Page 36
The average number of special education teachers is slightly lower than the staffing level established in the matrix. The following table compares the matrix number for special education teachers with the average number for all districts.
2008-09 Special Education Teachers
Staff
Matrix Number
District Average per 500 Students
Difference
Special Education Teachers 2.9 2.86 -0.04
Instructional Facilitators and Assistant Principals An instructional facilitator, according to ADE, is responsible for helping teachers improve classroom instruction by providing instructional support in the elements of research-based instruction and by demonstrating the alignment of instruction with curriculum standards and assessment tools. This matrix item established a staffing level of 2.5 instructional facilitators, which includes a .5 FTE assistant principal and two instructional facilitators, including a .5 FTE instructional facilitator with technology expertise. In 2009, schools statewide spent $51.1 million on instructional facilitators. This equates to approximately $111.38 per student. The matrix funded $279.77 per student for instructional facilitators for FY2008-09.
2008-09 Instructional Facilitators Funding and Expenditures
Matrix Amount Expenditures Per Student Difference Expenditures
$279.77 $111.38 -$168.39 $51.1million
The staffing level established in the matrix for instructional facilitators/assistant principals is more than three times the average number of instructional facilitators/assistant principals in districts. The following table compares the matrix number for instructional facilitators/assistant principals with the average number for all districts.
2008-09 Instructional Facilitators/Assistant Principals
Staff
Matrix Number
District Average Per 500 Students
Difference
Instructional Facilitators
2.5 0.72 -1.78
Librarians and Media Specialists State Standards for Accreditation (16.02.3) for library media specialists require schools with fewer than 300 students to have a 1/2 time library media specialist (0.5 per 300 is 0.83 per 500); schools with 300 to 1,499 students must have a full-time library media specialist (1.0); and schools with 1,500 or more students must have two library media specialist (two per 1,500 is 0.67 per 500).

Page 37
In 2009, schools statewide spent $55.2 million on librarians and media specialists. This equates to approximately $120.25 per student. The matrix funded $92.32 per student for librarians for FY2008-09.
2008-09 Librarians Funding and Expenditures
Matrix Amount Expenditures Per Student Difference Expenditures
$92.32 $120.25 $27.93 $55.2 million
The average number of librarians is more than one per 500 students, while the staffing level established in the matrix is less than one. The following table compares the matrix number for librarians with the average number for all districts.
2008-09 Librarians
Staff Matrix Number District Average per 500
Students Difference
Librarians 0.825 1.10 0.275
Counselors and Nurses The matrix established a staffing level for counselors and nurses of 2.5 positions. These positions may also include speech therapists, social workers, psychologists, and family outreach workers. The 2.5 positions are divided as follows:
1.11 positions for a counselor 0.67 positions for a nurse 0.72 positions for additional student services personnel 2.50
In 2009, schools statewide spent $99 million on counselors and nurses. This equates to approximately $215.61 per student. The matrix funded $279.77 per student for counselors and nurses for FY2008-09.
2008-09 Counselors and Nurses Funding and Expenditures
Matrix Amount Expenditures Per Student Difference Expenditures
$279.77 $215.61 -$64.16 $99 million
The average number of counselor and nurse positions is one-fifth less than the staffing level established in the matrix. The following table compares the matrix number for counselors and nurses with the average number for all districts.
2008-09 Counselors and Nurses
Staff
Matrix Number
District Average Per 500 Students
Difference
Counselors and Nurses 2.5 1.97 -0.53

Page 38
School-Level Administrative Staff The school-level administration line item includes funding for principals and school-level secretaries. Principals must provide the operational management and instructional leadership to make schools run smoothly and to improve student achievement. The duties completed by school clerical personnel are too numerous to list completely, but they include record-keeping, answering phones, managing the office, and serving as a liaison to parents. Principals The matrix established staffing for principals at a level of one per 500 students. Standards require that every school employ at least a half-time principal, and schools with 300 or more students must have a full-time principal. Schools of 500 students or more must have a full-time principal and a half-time assistant principal, instructional supervisor, or curriculum specialist. In 2009, schools statewide spent $83.2 million on principals. This equates to approximately $181.24 per student. The matrix funded $175.70 per student for principals for FY2008-09.
2008-09 Principals Funding and Expenditures
Matrix Amount Expenditures Per Student Difference Expenditures
$175.70 $181.24 $5.54 $83.2 million
The average number of actual principal positions is slightly lower than the staffing level established in the matrix. The following table compares the matrix number for principals with the average number for all districts.
2008-09 Principals
Staff
Matrix Number
District Average Per 500 Students
Difference
Principals 1 .97 -0.03
School-Level Secretaries Clerical support is not required by state standards. However, the legislature believed that, as a practical matter, there is a clear need for clerical support. Therefore the matrix established staffing for clerical support at a level of one secretary position per 500 students. In 2009, schools statewide spent $41.5 million on school secretaries. This equates to approximately $90.45 per student. The matrix funded $70.80 per student for school secretaries for FY2008-09.
2008-09 School Secretaries Funding and Expenditures
Matrix Amount Expenditures Per Student Difference Expenditures
$70.80 $90.45 $19.65 $41.5 million
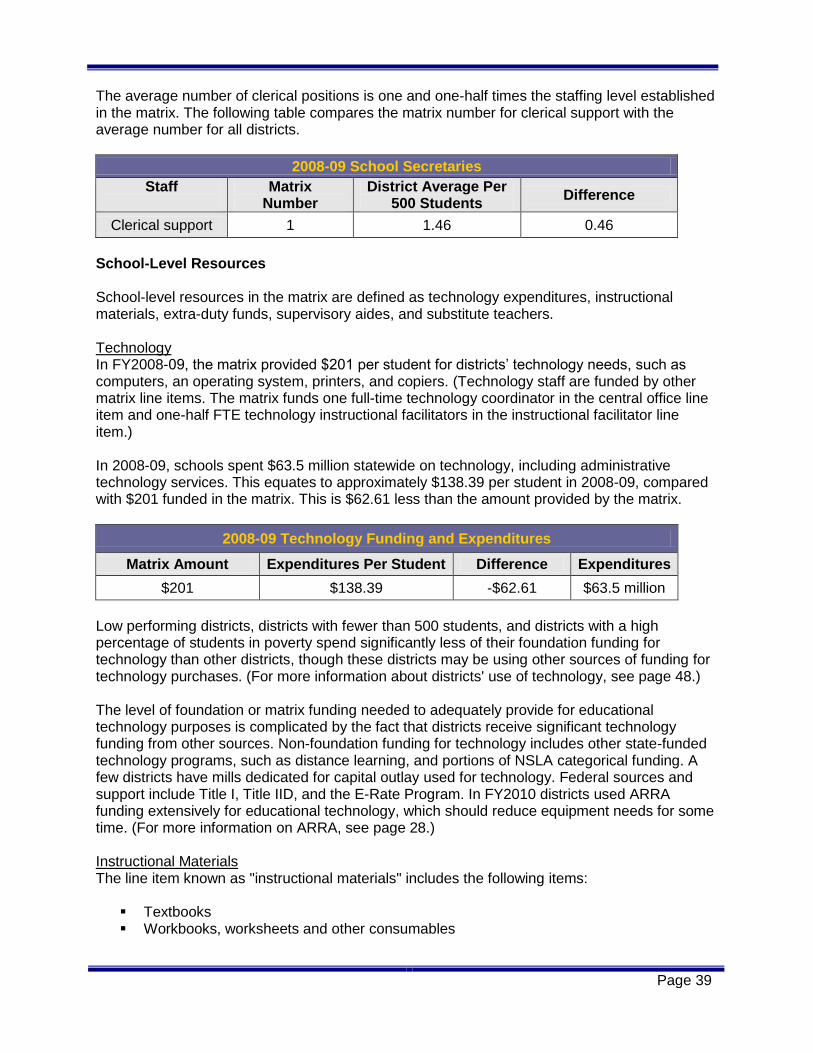
Page 39
The average number of clerical positions is one and one-half times the staffing level established in the matrix. The following table compares the matrix number for clerical support with the average number for all districts.
2008-09 School Secretaries
Staff
Matrix Number
District Average Per 500 Students
Difference
Clerical support 1 1.46 0.46
School-Level Resources School-level resources in the matrix are defined as technology expenditures, instructional materials, extra-duty funds, supervisory aides, and substitute teachers. Technology In FY2008-09, the matrix provided $201 per student for districts’ technology needs, such as computers, an operating system, printers, and copiers. (Technology staff are funded by other matrix line items. The matrix funds one full-time technology coordinator in the central office line item and one-half FTE technology instructional facilitators in the instructional facilitator line item.) In 2008-09, schools spent $63.5 million statewide on technology, including administrative technology services. This equates to approximately $138.39 per student in 2008-09, compared with $201 funded in the matrix. This is $62.61 less than the amount provided by the matrix.
2008-09 Technology Funding and Expenditures
Matrix Amount Expenditures Per Student Difference Expenditures
$201 $138.39 -$62.61 $63.5 million
Low performing districts, districts with fewer than 500 students, and districts with a high percentage of students in poverty spend significantly less of their foundation funding for technology than other districts, though these districts may be using other sources of funding for technology purchases. (For more information about districts' use of technology, see page 48.) The level of foundation or matrix funding needed to adequately provide for educational technology purposes is complicated by the fact that districts receive significant technology funding from other sources. Non-foundation funding for technology includes other state-funded technology programs, such as distance learning, and portions of NSLA categorical funding. A few districts have mills dedicated for capital outlay used for technology. Federal sources and support include Title I, Title IID, and the E-Rate Program. In FY2010 districts used ARRA funding extensively for educational technology, which should reduce equipment needs for some time. (For more information on ARRA, see page 28.) Instructional Materials The line item known as "instructional materials" includes the following items:
Textbooks Workbooks, worksheets and other consumables
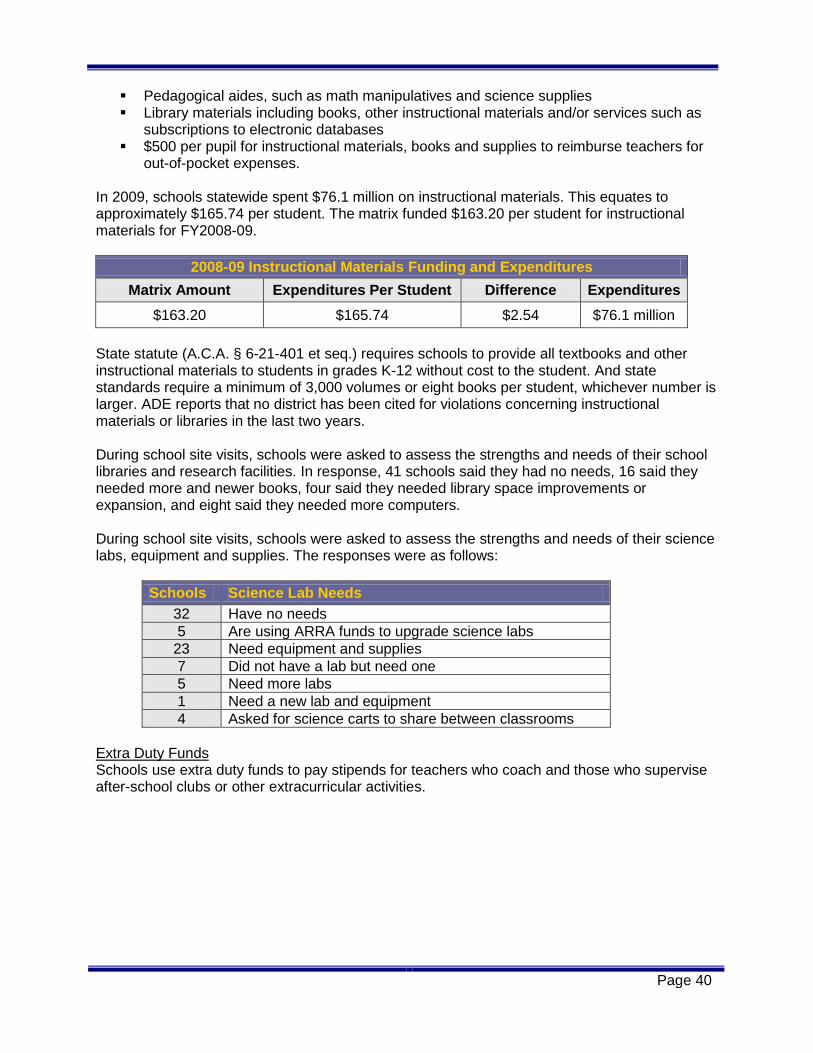
Page 40
Pedagogical aides, such as math manipulatives and science supplies Library materials including books, other instructional materials and/or services such as
subscriptions to electronic databases $500 per pupil for instructional materials, books and supplies to reimburse teachers for
out-of-pocket expenses. In 2009, schools statewide spent $76.1 million on instructional materials. This equates to approximately $165.74 per student. The matrix funded $163.20 per student for instructional materials for FY2008-09.
2008-09 Instructional Materials Funding and Expenditures
Matrix Amount Expenditures Per Student Difference Expenditures
$163.20 $165.74 $2.54 $76.1 million
State statute (A.C.A. § 6-21-401 et seq.) requires schools to provide all textbooks and other instructional materials to students in grades K-12 without cost to the student. And state standards require a minimum of 3,000 volumes or eight books per student, whichever number is larger. ADE reports that no district has been cited for violations concerning instructional materials or libraries in the last two years. During school site visits, schools were asked to assess the strengths and needs of their school libraries and research facilities. In response, 41 schools said they had no needs, 16 said they needed more and newer books, four said they needed library space improvements or expansion, and eight said they needed more computers. During school site visits, schools were asked to assess the strengths and needs of their science labs, equipment and supplies. The responses were as follows:
Schools Science Lab Needs
32 Have no needs
5 Are using ARRA funds to upgrade science labs
23 Need equipment and supplies
7 Did not have a lab but need one
5 Need more labs
1 Need a new lab and equipment
4 Asked for science carts to share between classrooms
Extra Duty Funds Schools use extra duty funds to pay stipends for teachers who coach and those who supervise after-school clubs or other extracurricular activities.
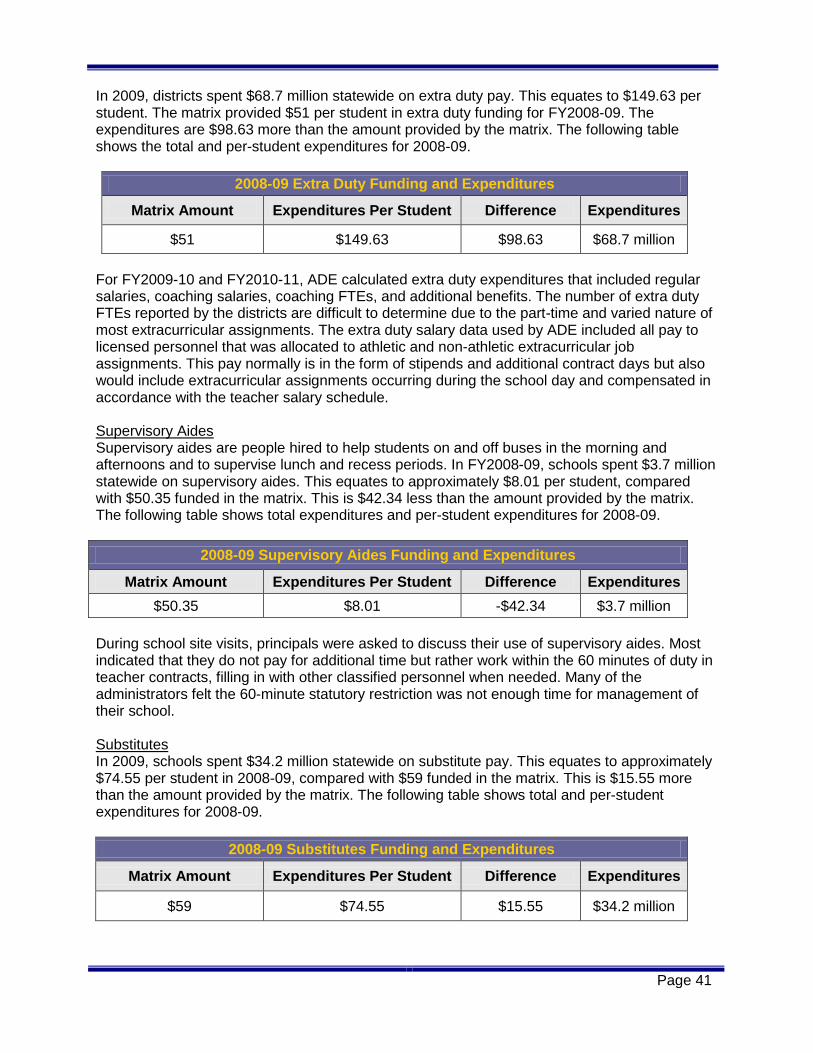
Page 41
In 2009, districts spent $68.7 million statewide on extra duty pay. This equates to $149.63 per student. The matrix provided $51 per student in extra duty funding for FY2008-09. The expenditures are $98.63 more than the amount provided by the matrix. The following table shows the total and per-student expenditures for 2008-09.
2008-09 Extra Duty Funding and Expenditures
Matrix Amount Expenditures Per Student Difference Expenditures
$51 $149.63 $98.63 $68.7 million
For FY2009-10 and FY2010-11, ADE calculated extra duty expenditures that included regular salaries, coaching salaries, coaching FTEs, and additional benefits. The number of extra duty FTEs reported by the districts are difficult to determine due to the part-time and varied nature of most extracurricular assignments. The extra duty salary data used by ADE included all pay to licensed personnel that was allocated to athletic and non-athletic extracurricular job assignments. This pay normally is in the form of stipends and additional contract days but also would include extracurricular assignments occurring during the school day and compensated in accordance with the teacher salary schedule. Supervisory Aides Supervisory aides are people hired to help students on and off buses in the morning and afternoons and to supervise lunch and recess periods. In FY2008-09, schools spent $3.7 million statewide on supervisory aides. This equates to approximately $8.01 per student, compared with $50.35 funded in the matrix. This is $42.34 less than the amount provided by the matrix. The following table shows total expenditures and per-student expenditures for 2008-09.
2008-09 Supervisory Aides Funding and Expenditures
Matrix Amount Expenditures Per Student Difference Expenditures
$50.35 $8.01 -$42.34 $3.7 million
During school site visits, principals were asked to discuss their use of supervisory aides. Most indicated that they do not pay for additional time but rather work within the 60 minutes of duty in teacher contracts, filling in with other classified personnel when needed. Many of the administrators felt the 60-minute statutory restriction was not enough time for management of their school. Substitutes In 2009, schools spent $34.2 million statewide on substitute pay. This equates to approximately $74.55 per student in 2008-09, compared with $59 funded in the matrix. This is $15.55 more than the amount provided by the matrix. The following table shows total and per-student expenditures for 2008-09.
2008-09 Substitutes Funding and Expenditures
Matrix Amount Expenditures Per Student Difference Expenditures
$59 $74.55 $15.55 $34.2 million

Page 42
District-Level Resources District-level resource expenditures include operations and maintenance, central office expenses, and district transportation expenses. Expenses that are not covered explicitly in other matrix line items are grouped together and combined with central office expenses in the central office line item. Examples of these types of expenses paid from foundation funding include certain athletic expenditures and expenditures for instructional aides. Operations and Maintenance Act 1426 of 2005 known as the Arkansas Public School Academic Facilities Program Act established within the state's foundation funding a dedicated 9% of foundation funding for the purposes of paying utilities, custodial, maintenance, repair, and renovation activities and related personnel costs. In FY2008-09, schools spent $312.8 million statewide on operations and maintenance. This equates to approximately $681.60 per student, compared with $581 funded in the matrix. This is $100.60 more than the amount provided by the matrix.
2008-09 Operations and Maintenance Funding and Expenditures
Matrix Amount Expenditures Per Student Difference Expenditures
$581 $681.60 $100.60 $312.8 million
With current procedures, it is not possible to tell from the data maintained in the state data warehouse if the increased costs are due to additional consumption of utilities or higher utility costs. To enable a study of the need for adjustments in this line item, the school districts could be required to add one or two fields to the accounting records that indicate the fuel or water consumption level and the rate so that the information is not difficult to retrieve when needed. Some districts already track this information through software used for management of district facilities and related expenses. Central Office and Other District-Level Expenditures The central office and other district-level expenditures component of the matrix includes items that might be widely considered as central office administration and other district- and school-level expenditures that are not otherwise accounted for in a matrix line item. One portion of district-level administrative expenses includes classified and clerical salaries and benefits coded as central office, excluding expenses coded as principal's office. In 2008-09, schools spent $274.9 million statewide on expenses that have been attributed to the central office and other district-level expenditures matrix line item. This equates to approximately $598.89 per student, compared with $383.50 funded in the matrix. This is $215.39 more than the amount provided by the matrix.
2008-09 Central Office Funding and Expenditures
Matrix Amount Expenditures Per Student Difference Expenditures
$383.50 $598.89 $215.39 $274.9 million
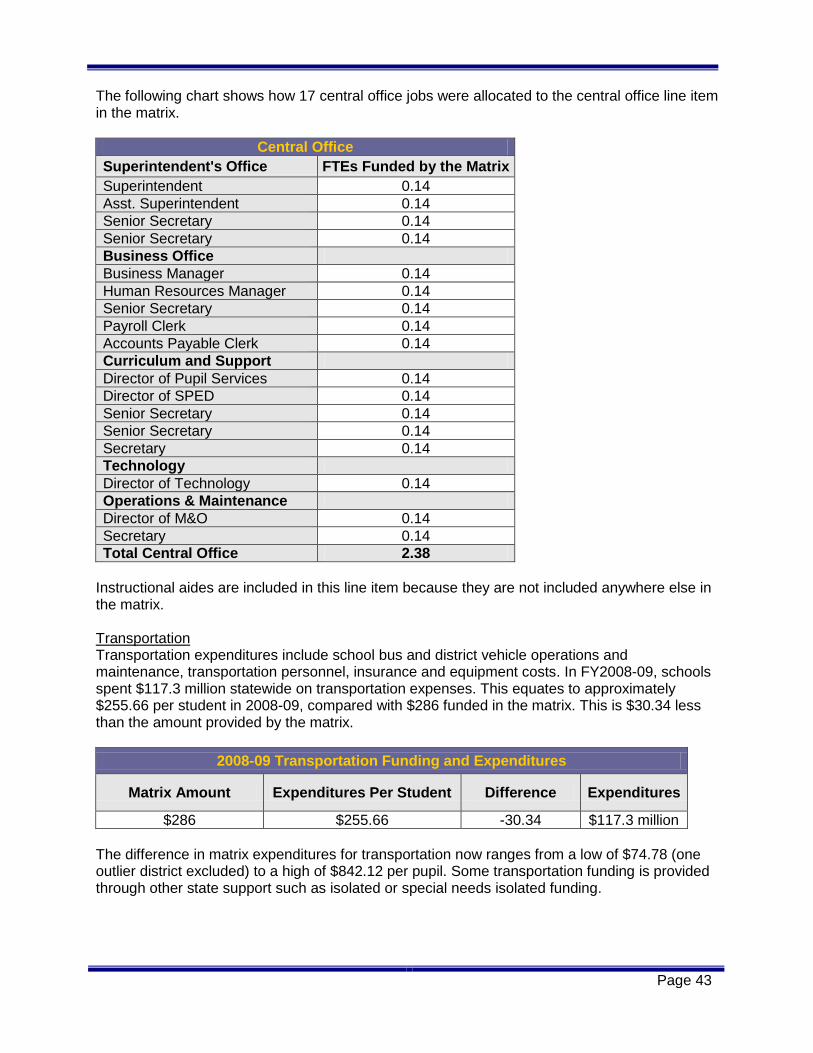
Page 43
The following chart shows how 17 central office jobs were allocated to the central office line item in the matrix.
Central Office
Superintendent's Office FTEs Funded by the Matrix
Superintendent 0.14
Asst. Superintendent 0.14
Senior Secretary 0.14
Senior Secretary 0.14
Business Office
Business Manager 0.14
Human Resources Manager 0.14
Senior Secretary 0.14
Payroll Clerk 0.14
Accounts Payable Clerk 0.14
Curriculum and Support
Director of Pupil Services 0.14
Director of SPED 0.14
Senior Secretary 0.14
Senior Secretary 0.14
Secretary 0.14
Technology
Director of Technology 0.14
Operations & Maintenance
Director of M&O 0.14
Secretary 0.14
Total Central Office 2.38
Instructional aides are included in this line item because they are not included anywhere else in the matrix. Transportation Transportation expenditures include school bus and district vehicle operations and maintenance, transportation personnel, insurance and equipment costs. In FY2008-09, schools spent $117.3 million statewide on transportation expenses. This equates to approximately $255.66 per student in 2008-09, compared with $286 funded in the matrix. This is $30.34 less than the amount provided by the matrix.
2008-09 Transportation Funding and Expenditures
Matrix Amount Expenditures Per Student Difference Expenditures
$286 $255.66 -30.34 $117.3 million
The difference in matrix expenditures for transportation now ranges from a low of $74.78 (one outlier district excluded) to a high of $842.12 per pupil. Some transportation funding is provided through other state support such as isolated or special needs isolated funding.

Page 44
Summary of Foundation Funding
The tables in this section show how districts' staffing and spending in 2008-09 compared with the matrix structure. Red numbers in the "Difference" column indicate line items in which districts spent less foundation funding or had fewer positions funded by foundation funds than the funding and staffing provided by the matrix. Blue numbers indicate where districts' spending and staffing exceeded the matrix.
Staffing
2008-09 School-Level Staffing
Staff Matrix
Number
District Average per 500 Students
Difference
Non-administrative school-level total 33.665 29.97 -3.695
Classroom Teachers 24.94 23.32 -1.62
Special Education Teachers 2.9 2.86 -0.04
Instructional Facilitators 2.5 0.72 -1.78
Librarians and Media Specialists 0.825 1.10 0.275
Counselors and Nurses 2.5 1.97 -0.53
Administrative school-level total 2 2.43 .43
Principals 1 .97 -0.03
Clerical support 1 1.46 0.46
Total 35.665 32.4 -3.265
Expenditures
2008-09 Expenditures
Matrix Amount
Districts' Actual Expenditures Per Student
Difference
Classroom Teachers $2,790.99 $2,596.40 -$194.59
Special Education Teachers $324.53 $330.38 $5.85
Instructional Facilitators $279.77 $111.38 -$168.39
Librarians and Media Specialists $92.32 $120.25 $27.93
Counselors and Nurses $279.77 $215.61 -$64.16
Principals $175.70 $181.24 $5.54
School Secretary $70.80 $90.45 $19.65
Technology $201 $138.39 -$62.61
Instructional Materials $163.20 $165.74 $2.54
Extra Duty $51 $149.63 $98.63
Supervisory Aides $50.35 $8.01 -$42.34
Substitutes $59 $74.55 $15.55
Operations and Maintenance $581 $681.60 $100.60
Central Office $383.50 $598.89 $215.39
Transportation $286 $255.66 -30.34
Total $5,789 $5,718.18 -70.75 Expenditures from foundation funds presented in this report are an estimate based upon an allocation methodology. The method used allocates expenditures to foundation funding based upon the ratio of foundation funding to unrestricted funds and assumes that expenditures are made in equal proportions from foundation funds and other unrestricted funds. Different assumptions on these points would result in a different estimate for the amount of expenditures from foundation funds.

Page 45
Adequacy Subcommittee's Foundation Funding Analysis After considering the expenditure data, the Adequacy Subcommittee determined that school districts should receive an increase in funding even though statewide they spent, on average, $70.75 less foundation funding than they received. The Adequacy Subcommittee noted that while some districts' needs were adequately met through foundation funding, the state aid was insufficient to meet the educational adequacy needs of nearly half of the districts. A total of 118 districts spent more than $5,789 per student on items meant to be covered by foundation funding. And by and large, the districts that spent less of their foundation funding tended to be districts that could afford to use other types of unrestricted funding. On average, the 127 districts that spent less than $5,789 collected $289.14 per student more in property taxes than those that spent more than the foundation funding provided. Measures of Inflation and Deflation The BLR subscribes to the economic data and the associated forecasting of Moody’s Analytics and IHS Global Insight, both of which are recognized throughout academic and business communities as the top two providers of economic information. On August 24, 2010, the Adequacy Subcommittee reviewed the most recent estimates of relevant economic variables from both subscription providers, which were then appropriately applied to the matrix line-items as inflationary adjustments. The results of those adjustments are reflected in Section 12. Teacher Salaries To comply with A.C.A. §10-3-2102, the BLR presented a report to the Adequacy Subcommittee on Arkansas teacher salaries. With an average teacher salary of $47,472 in 2008-09 and a minimum teacher salary of $29,244, Arkansas ranks second among the states surrounding it and had the fourth highest minimum teacher salary. (The BLR used NEA salary data for classroom teachers to compare Arkansas to other states. Salary data provided elsewhere in this report comes from ADE.) Among the 16 SREB states, Arkansas ranks 11th on average teacher salary and 11th on minimum teacher salary. When the cost of living is considered, Arkansas ranks 5th in average teacher salary, with only Georgia, Delaware, Kentucky, and Alabama ranking higher.
2008-09 Teacher Salaries: Arkansas and Surrounding States
Average Minimum
1. Louisiana $49,284 1. Tennessee $32,315
2. Arkansas $47,472 2. Oklahoma $31,600
3. Tennessee $46,278 3. Mississippi $30,900
4. Texas $46,179 4. Arkansas $29,244
5. Oklahoma $45,702 5. Texas $27,320
6. Missouri $44,712 6. Louisiana $27,102
7. Mississippi $44,498 7. Missouri $24,000
2008-09 Teacher Salaries: Arkansas and SREB States
Average Minimum
1. Maryland $60,844 1. Maryland $37,831
2. Delaware $55,994 2. Florida $37,051
3. Georgia $53,270 3. Alabama $36,144
4. Kentucky $49,539 4. Tennessee $32,315

Page 46
5. Louisiana $49,284 5. Oklahoma $31,600
6. Alabama $48,906 6. Georgia $31,586
7. North Carolina $48,603 7. South Carolina $31,548
8. Virginia $48,554 8. Mississippi $30,900
9. Florida $48,126 9. North Carolina $30,430
10. South Carolina $47,704 10. Virginia $29,700
11. Arkansas $47,472 11. Arkansas $29,244
12. Tennessee $46,278 12. Kentucky $28,930
13. Texas $46,179 13. Texas $27,320
14. Oklahoma $45,702 14. Louisiana $27,102
15. West Virginia $44,625 15. Delaware $26,967
16. Mississippi $44,498 16. West Virginia $25,651 *Sources: Average teacher salaries come from the National Education Association's Rankings and Estimates: Rankings of the States 2008 and Estimates of School Statistics 2009, December 2008, Summary Table G, Column 9. Minimum salary data was collected from the various states' education agencies websites or key contacts.
Arkansas's Average Teacher Salary
$44,000
$45,000
$46,000
$47,000
$48,000
$49,000
$50,000
2008 2009 2010
Arkansas's Average
Teacher Salary
Year State Rank on Average Teacher Salary (includes
Washington D.C.)
2008 35th of 51
2009 36th of 51
2010 30th of 51 Source: National Education Association's Rankings and Estimates: Rankings of the States 2008 and Estimates of School Statistics 2009, December 2008, Summary Table G and Rankings of the States 2009 and Estimates of School Statistics 2010, December 2009, Summary Table G
The lowest salary that an Arkansas school district can offer teachers is defined in A.C.A. §6-17-2403(c), but many districts set their salary schedules with a minimum salary above the one defined by law. The highest minimum salary offered in an Arkansas district has increased from $41,132 in 2007-08 to $42,230 in 2008-09. The lowest minimum salary paid by a district in Arkansas increased from $28,897 in 2007-08 to $29,244 in 2008-09 The lowest minimum salary for 2008-09 was slightly higher at $29,244. Twenty-nine districts paid $29,244 as their minimum hiring salary in 2008-09. The minimum teacher salary for 2009-10 was not increased during the 2009 legislative session.

Page 47
Minimum District Salary 2007-08
2007-08 District Disparity 2008-09
2008-09 District Disparity
Low $28,897 $29,244
High $41,132
The high is 42.3% higher than the low
$42,230 The high is 44.4% higher than the low
Source: ADE's Teacher Salary Schedule Analysis, 2007-08 and 2008-09
The following chart shows the average teacher salary for the state. It also uses ADE's calculation of the average teacher salary in each district to determine the lowest district average and the highest district average.
Average Salary 2007-08 2007-08 District
Disparity 2008-09 2008-09 District
Disparity
Lowest Average District Salary
$31,940
$34,437
Highest Average District Salary
$59,776 The high is 87.2% higher than the low
$60,663 The high is 76.2% higher than the low
Average State Salary
$45,237
$45,737
Source: ADE's Average Teacher Salaries 2007-08 and 2008-09, Classroom Teachers Only
Since the 2005-06 school year, average teacher salaries in Arkansas have grown by 11%. Oklahoma, Louisiana, Alabama, West Virginia, and Florida have exceeded 11% growth, and Texas, Mississippi, North Carolina, and South Carolina share the same growth rate as Arkansas. All remaining states had 10% or less in average teacher salary growth, but all states showed an increase, with Virginia having the smallest growth at 3%.
Average Teacher Salary
2008-09 2005-06 Percent Change
Arkansas $47,472 $42,931 11%
Surrounding States:
Texas $46,179 $41,501 11%
Tennessee $46,278 $42,537 9%
Louisiana $49,284 $39,872 24%
Oklahoma $45,702 $36,681 25%
Missouri $44,712 $42,083 6%
Mississippi $44,498 $40,096 11%
SREB States:
Maryland $60,844 $54,333 12%
Delaware $55,994 $51,249 9%
Georgia $53,270 $48,246 10%
North Carolina $48,603 $43,913 11%
South Carolina $47,704 $43,123 11%
Virginia $48,554 $47,310 3%
West Virginia $44,625 $39,583 13%
Florida $48,126 $42,702 13%
Kentucky $49,539 $46,095 7%
Alabama $48,906 $40,347 21% Source: Average teacher salaries come from the National Education Association's Rankings and Estimates of the States 2006 and 2008 reports.

Page 48
Technology To provide more detail on the districts' use of technology, the BLR presented to the Adequacy Subcommittee a report on technology in schools. The state provides non-foundation funding for districts' technology needs. Other state-funded technology programs include distance learning, and districts can use portions of National School Lunch Act (NSLA) categorical funding for technology. A few districts have mills dedicated for capital outlay that are used for technology. Federal sources and support include Title I and Title IID of the Elementary and Secondary Education Act, and the E-Rate Program. In FY2009-10 districts used American Recovery and Reinvestment Act funding extensively for educational technology. Districts have some freedom to determine what technology to purchase for their schools. There are limited technology requirements in the state Standards for Accreditation and in the curriculum frameworks. The state's Facilities Manual, which provides the guidance for school building construction, requires certain technology infrastructure as part of school construction. Finally, ADE Rules require individual school districts to develop technology plans that contain specific components be included, along with professional development outcomes. During the school site visits, BLR staff observed new technology, including digital microscopes, simulations, surround sound, wireless equipment, and text readers. Most of the 74 schools visited noted that stimulus funding in the current fiscal year was the funding source for the increased equipment. Many schools reported having enough interactive whiteboards, document cameras, and other instructional technology. Ten of the 74 schools reported that they didn't have any technology needs. One technology-based program observed throughout the state was the Environmental and Spatial Technology Initiative (EAST) program. The EAST program is offered in 179 K-12 public schools in the state. An increasing use of Web 2.0 applications was noted. Site visits revealed some variation in schools' use of student test score data to individualize instruction. Some schools shared formative assessment data in teaching teams or Professional Learning Communities (PLCs), while others created school-wide data reports or profiles for every student. Officials at several schools visited expressed a need for more teacher professional development in technology. Principals and teachers indicated a need for embedded training for an extended period of time to ensure that new skills were adequately re-enforced as teachers put them into practice back in the classroom. Data from the district survey concerning distance learning shows that 1,079 sections of distance learning were provided to 9,688 students. According to the survey, 49 districts do not use distance learning. Those not offering distance learning include some of the largest districts in the state as well as some of the smallest. Technology is increasingly serving as the primary vehicle for supporting parent involvement, which many researchers indicate is a critical strategy for reducing the achievement gap. During site visits, schools reported several online tools for communicating with parents. All districts have websites where notices to parents can be posted along with district information required by law to be posted. Schools reported communicating with parents by email when information is specific to certain students. Software packages such as Edline, Parent Link, and Grade Quick are being used to varying degrees to post grades and homework assignments.

Page 49
During site visit interviews, many schools indicated a need for building- or school-level technology support. The greatly increased use of technology in the classroom made real-time support essential. A significant component of educational technology infrastructure that will need to be re-structured as technology permeates the educational environment is bandwidth for the schools. The State Educational Technology Directors Association (SETDA) established recommendations in 2008 for external bandwidth of 10 Mbps per 1,000 students. Arkansas is typically 3 Mbps per district at this time. All schools have at least one T-1 (1.54 Mbps) line provided through the Arkansas Public School Computer Network (APSCN). For most districts, ADE also provides a line for Compressed Interactive Video (CIV) for distance learning. Several areas of national education policy have the potential for impacting the direction of Arkansas educational practice and the resulting state funding. The "Blueprint for Reform: The Reauthorization of the Elementary and Secondary Education Act," a U.S. Department of Education (U.S. DOE) report, proposes an increased emphasis on technology as an educational resource. The Blueprint also calls for stronger instruction in literacy and in science, technology, engineering, and mathematics (STEM), aligned with improved standards that build toward college- and career-readiness. The U.S. DOE's draft "National Educational Technology Plan 2010," released March 10, 2010, urges an increased and more imaginative use of educational technology. The plan calls for leveraging "the power of technology to provide personalized learning instead of a one-size-fits-all curriculum." The Federal Communications Commission's "National Broadband Plan" contains recommendations to improve online learning opportunities, both inside and outside the classroom; gather and provide information that fosters innovation; and change the E-rate program.

Page 50
Section 9: District Use of Categorical Funding
In addition to foundation funding, districts may receive four types of categorical funding. Three of the four categorical funds are intended for student populations with higher needs than the majority of students. These special needs groups include:
1.) Students in poverty 2.) Students who are not proficient in the English language 3.) Students who need the additional assistance of an alternative learning environment.
The fourth categorical fund type benefits students through the provision of professional development training for teachers and other educators. National School Lunch Act National School Lunch Act (NSLA) funding is the Arkansas categorical funding program for schools with high percentages of students in poverty. A.C.A. § 6-20-2301 defines NSLA students as students from low socio-economic backgrounds as indicated by their eligibility for free or reduced-priced meals under the National School Lunch Act. This state poverty funding program should not be confused with the federal school lunch program. The National School Lunch program is used only as the measure of poverty for the Arkansas categorical funding program. Each district qualifies to receive one of three NSLA funding levels based on the percentage of its students who qualify for the federal School Lunch program. These funding levels are shown in the following table.
NSLA Per-Student Funding
2006-07 2007-08 2008-09 2009-10 2010-11
>90% NSLA Students $1,440 $1,488 $1,488 $1,488 $1,488
70%-90% NSLA Students $960 $992 $992 $992 $992
<70% NSLA Students $480 $496 $496 $496 $496
Districts receive their designated funding amount for each NSLA-eligible student. For example, a district in which 89% of its student population was in poverty in 2008-09 would receive $992 for each NSLA-eligible student in its district. This funding is in addition to the foundation funding districts receive for each student. In 2009, districts' NSLA expenditures totaled $144,987,178.30, compared with 157,767,290. (For more information on state NSLA expenditures, see page 25) The funding formula law and related ADE rules specify how NSLA funding can be used in the schools. Some examples of appropriate uses include:
To pay the salaries of class-size reduction teachers
To fund research-based programs that are aligned with the Arkansas Content Standards
To hire academic coaches and/or instructional facilitators
To hire highly qualified classroom teachers
To provide before and after-school academic program, including transportation
To provide pre-K programs
To hire tutors, teacher's aides, certified counselors, licensed social workers, and/or nurses

Page 51
Most districts allocate NSLA funding to both district-wide programs and individual schools. The majority of districts said they target NSLA funding to certain grade levels for additional support and provide different NSLA programs to different schools to target specific academic needs. Much of the research on improving student achievement points to the necessity of providing additional learning time. The Arkansas General Assembly created NSLA funding in part to provide those types of opportunities through tutoring, extended day, and summer programs. The following table shows a breakdown of how districts spent NSLA funding.
Student Academic Support
Additional Personnel
General Programs: PD &
Parent Education Miscellaneous Pre-K
Salaries Above
Minimum
Statewide Expenditures Per Student
9.2% 57.4% 2.1% 23.1% 3.1% 5.1%
In addition to the regular NSLA categorical funding, there are two other related state funding programs: NSLA growth funding and NSLA transitional adjustments.
1.) NSLA Growth Funding — Because NSLA funding is based on the prior year's enrollment data, a provision was made to provide NSLA Growth Funding for growing districts. Districts that have grown at least one percent for each of the three previous years, qualify for NSLA Growth Funding. A total of $934,375 in NSLA growth funding was distributed to 34 districts in FY2008-09.
2.) NSLA Transitional Adjustments — NSLA transitional adjustments are made to help a
district move from one level of NSLA funding to another. Using a transitional formula, NSLA funding provides a "smoothing" mechanism to ease the funding changes between established break points in the levels of eligibility for the funding. The transitioning formula triggers an increase or decrease in state categorical funding. Adjustments are made over a period of up to three years with districts either gaining or losing funding until the new level is reached. While five districts gained funding totaling $1,530,837, 14 districts lost $2,298,842 in funding as a result of moving to a new level.
There are two additional sources of state funds that are targeted to school districts for purposes similar to those eligible with NSLA funding.
1.) High priority teacher recruitment and retention funding, which provides salary incentives to teachers that agree to teach in districts with special challenges recruiting and retaining teachers.
2.) College Preparatory Enrichment Program (CPEP), which is part of a funding program known as “At-Risk.” CPEP funds courses and testing to prepare students for college entrance exams.
Three federal programs provide funding to school districts based on levels of poverty or the number of disadvantaged students:
1.) Title I of the Elementary and Secondary Education Act 2.) 21st Century Community Learning Centers 3.) Education for Homeless Children and Youth program

Page 52
NSLA Funding Used For Teacher Salaries Mr. Bill Goff, ADE's Assistant Commissioner, provided information to the Adequacy Subcommittee on the use of NSLA funding to pay teacher salaries and bonuses. He noted that Act 31 of the First Extraordinary Session of 2006 defined how excess NSLA funds could be used to supplement teacher salaries above the minimum (SAM) salary schedule or provide bonuses. The district must first use NSLA funds to meet the needs of students. Once the district has met students' needs, if it still has NSLA funds, the district may request approval to use those funds to enhance teachers' salaries or provide a bonus. The district must have met the adequate educational needs of students and managed its resources prudently. The district may only use current year NSLA funds. It also must include the salaries and bonuses in its ACSIP and provide a statement of assurance to ADE. A district requesting permission to use the funding to supplement salaries must reduce incrementally the amount of NSLA funds used to supplement salaries to 20%. If the percent of excess NSLA funds used to supplement salaries is more than 20% of the district's total NSLA funds, the district must reduce by 20% of the amount of the previous year's NSLA funds used to supplement teacher salaries above the minimum. When a district requests permission to use NSLA funding to provide bonuses, ADE's Commissioner will review the district's student achievement indicators. According to pending rules, the Commissioner will evaluate the district's test scores against the state averages as one indicator of how well the district has met the educational needs of students.
Salaries Above the Minimum (SAM) BONUS
Districts using NSLA
funds for SAM
Total NSLA funds used
for SAM
SAM as a % of NSLA for districts that used NSLA to supplement
salaries
Districts that used NSLA to provide bonuses
Total NSLA funds used
for bonuses
2006-07 26 $10,632,039 41%
2007-08 26 $7,389,484 28% 7 $379,660
2008-09 26 $6,244,591 24% 1 $15,820
2009-10 18 $4,873,925 21% 7 $1,423,522
Alternative Learning Environments An Alternative Learning Environment (ALE) is a student intervention program that seeks to eliminate traditional barriers to student learning for students at risk (A.C.A. § 6-18-508 and 6-18-509). Alternative education in Arkansas is based on the premise that all students can learn if they are provided with an environment conducive to their particular learning needs. These at-risk students need smaller classes, more individualized and specialized instruction, and additional services that are integrated into their academic expectations (Lange & Sletten, 2002; Lehr & Lange, 2003). A.C.A. § 6-18-508 requires every school district to establish an ALE program, which may be a cooperative program with one or more other districts. Ten percent of superintendents reported in the BLR’s superintendent survey that they contracted with their Educational Cooperative to

Page 53
provide ALE for elementary students, whereas 17% and 25%, respectively, have such contracts for middle and high school students. Arkansas law also requires districts to submit an assurance statement that it is in compliance with the mandate that they establish an ALE program. Act 272 of 2007 set the categorical funding provided to districts for each ALE student at $4,063. There was no increase in ALE funding in FY2009-10 or FY2010-11. The following table shows the per-student amount established for ALE each year since 2006-07. For more information on ALE funding, see page 25.)
ALE Per-Student Funding
2006-07 2007-08 2008-09 2009-10 2010-11
Per ALE Student/FTE $3,250 $4,063 $4,063 $4,063 $4,063
In FY2008-09 every ALE full-time equivalent (FTE) student generated $5,789 in foundation funding in addition to the ALE funding for a total of $9,852 per student. District expenditures for ALE in FY2008-09 totaled $31,750,663.41, or $6,395.85 per ALE student. Six school districts had an ALE FTE of 3% or more of three-quarter quarter ADM, whereas 34 districts were not funded at all in 2008-09 because they reported having no ALE students. Student placements in ALE are funded based on the previous year's number of FTEs in the program. A student in ALE must be in the program for at least 20 days for the district to be eligible for funding. Current law does not have an adjustment for growth in the number of students in ALE during a school year. The BLR survey of all 244 school district superintendents found that districts refer students to ALE for many different reasons.
Reason For Referral # of Districts Referring Students to ALE For This Reason
Academic problems 222
Truancy 190
Disruptive behavior 155
Fights 137
Encounters with the justice system 126
Drugs 115
Pregnancy 106
Mental illness 96
Abuse 61
Homelessness 52
Research has identified specific ALE program characteristics that are associated with positive outcomes, such as increased student achievement, behavioral control, and graduation (e.g., Kochhar-Bryant & Lacey, 2005; Lehr & Lange, 2003). These characteristics include closer and more supportive interpersonal relations with educators, counseling and other social services, individualized teaching and expectations, and an emphasis on vocational and more general life skills (see review, Lehr & Lange, 2003). The greatest influence in any classroom is the teacher, and evidence shows that teachers in ALE need specific training to work with the multitude of problems presented by students in these programs (Lehr & Lange, 2003).

Page 54
Successful ALE programs are not short-term interventions designed to remedy an immediate classroom disturbance, such as "timeout" periods used to restore order in a class. In the BLR superintendent survey 48 districts, or 20%, reported that they place students in ALE programs for brief periods or timeouts during the day. Additionally ADE Rules Governing the Distribution of Student Special Needs Funding support this practice by allowing funding even for students who are placed only sporadically in an ALE program. No evidence is available that this practice has any benefit other than to temporally remove a disturbance problem for the teacher. Staffing is a major problem for ALE programs in Arkansas. Since ALE programs often have low enrollments — especially in rural areas — districts do not hire teachers specifically for these programs. This results in the need for teachers who are certified to teach more than one subject and in both regular and special education. The operating assumption that any certified teacher can teach in these programs is not supported by research (Lehr & Lange, 2003). Teachers need to be able to deal professionally with complex and overlapping problems such as disabilities, emotional disorders, and use of illegal substances. Generally, ALE programs do not have sufficient funding to provide quality facilities and instructional resources. This is more of a problem in small rural school districts, in part, because these programs never received "start-up" funds to buy equipment and supplies and build or repair facilities. However, school districts do not always use the unrestricted foundation funding they receive for each ALE student to pay for their ALE programs. Another issue is that despite evidence that certain "at risk" students perform better in an alternative learning setting (Bureau of Legislative Research, 2006; Lange & Sletten, 2002; Yearwood & Abdum-Muhaymin, 2007), some principals still do not believe in separating students for any reason, including placement in an ALE program. Thirty-four districts reported having no ALE students in 2008-09 and therefore no functional ALE program. Some principals interviewed during the BLR’s school visits indicated that they use instructional aides and student service staff instead to address the unique needs of "hard-to-reach" students. A final problem is that ALE programs often are not held accountable by state accountability systems. No sanctions are imposed on districts that do not provide ALE programs, and no independent verification is conducted to ensure districts actually offer the programs listed on annual assurance forms. English Language Learners English Language Learners (ELL) funding is the state categorical funding program that supports students who are not proficient in the English language. These students face the challenge of learning a new language in addition to the challenge of mastering the academic subject matter being taught in that language. Students qualify for ELL services based on how they score on approved English proficiency assessments. The tests measure oral, reading, and writing proficiency and are administered in the fall of the current school year. Districts received $293 per ELL student in FY2008-09. The following table shows the per-student amount established for ELL since 2006-07.
ELL Per-Student Funding
2006-07 2007-08 2008-09 2009-10 2010-11
Per ELL Student/FTE $195 $293 $293 $293 $293

Page 55
In 2008-09 district ELL expenditures totaled $12.5 million. That year 132 districts received funding for a total of 27,589 ELL students in the state. On average, those districts spent $453 per ELL student, significantly more than the $293 per ELL student they received in ELL funding. For the 87.6% of ELL students who also are eligible for free and reduced priced lunch, districts received $6,665, $7,161, or $7,657, depending on the concentration of students in poverty (see pages 25 and 50 for more information about NSLA categorical funding). In FY2008-09, 87 school districts did not have any ELL students. In most of the 74 schools surveyed by the BLR, 80% or more ELL students spoke Spanish as their native language. Arkansas's Hispanic population grew 3.7% between 1998 and 2008, according to the Southern Regional Education Board (SREB). That percentage increase was the 6th highest among the 16 SREB states. By comparison, Texas' Hispanic population increased 7.1%, while West Virginia's Hispanic population increased only 0.9% for the same time period. Twenty districts in Arkansas concentrate ELL students in one school to more efficiently offer resources and support. For example, the Springdale School District, which has the largest percentage of ELL students in the state — more than 40% of the district’s student population — and the largest overall number of ELL students, offers an intensive program called the Language Academy for high school level ELL students. Four times as many districts reported teaching Level 1 ELL students in separate classrooms as Level 2 students. Level 1 is least proficient and Level 5 is the most proficient. Two areas of state-level requirements impact the manner and quality of ELL instruction in the classroom: teacher certification and the state statute on Arkansas’s official language. According to Dr. Andre Guerrero, State Director of Programs for ELLs, Arkansas, unlike other states, has no full English as a Second Language (ESL) Certification for teachers. Instead Arkansas offers an ELL endorsement. There are several thousand educators holding such endorsements, but no records of how many are teaching ELL students. The other requirement affecting the instruction of ELL students is the state law requiring English to be the official language of instruction (A.C.A. §6-16-104). Recent research by Robert E. Slavin, Nancy Madden, Margarita Calderón, Anne Chamberlain and Megan Hennessy, 2010, has supported the view that Spanish-speaking students learn to read English equally well when instructed in English only or in both English and Spanish. The primary federal source of funding for ELL students is the Elementary and Secondary Education Act, Title III, Part A as Amended by the No Child Left Behind Act of 2001 or English Language Acquisition State Grants. This program provides grants to schools to ensure that limited English proficient children and youth, including immigrant children and youth, obtain English proficiency and meet state academic standards. Federal funding for this program (Title III) totaled $2.8 million for 36 districts for FY2008-09. The federal funding is provided only to districts that have enough ELL students to be eligible for $10,000 or more in Title III funding. Federal requirements stipulate that ELL students must be tested each year using a federally designated test known as the English Language Development Assessment (ELDA). The state is required to establish Annual Measurable Achievement Objectives (AMAOs), or targets for each student’s ELDA scores, and for Adequate Yearly Progress (AYP) improvements for the Limited English Proficiency (LEP) subpopulation. The federal government uses the state's AMAOs to monitor Arkansas's progress with ELL students. Federal law also requires districts to monitor for two years the achievement of students who exit from the ELL program.

Page 56
Professional Development Professional development (PD) for educators is a critical factor in the effort to improve student performance and ensure highly qualified teachers in the classroom. The Arkansas Accreditation Standard 10.01.3 requires that all teachers have 60 hours of professional development each school year. The current funding level for professional development is $50 per student, the same amount the state has spent on PD since the General Assembly first established PD funding in FY2004-05. In FY2008-09, districts received $41.33 per student with the balance of the funding going to ADE for a statewide online PD program. ADE provides funding to the Arkansas Educational Television Network to provide the web-based PD courses. The following table shows the per-student amount established for PD each year since 2006-07. (For more information about state PD expenditures, see page 26.) During FY2008-09, districts spent $17,547,335 with an average per-ADM expenditure of $40.80, compared with the $41.33 they were provided.
PD Per-Student Funding
2006-07 2007-08 2008-09 2009-10 2010-11
Per Student $50 $50 $50 $50 $50
Responses from the BLR’s district survey indicate that a high percentage of districts’ PD is provided by educational cooperatives (coops) and the districts themselves. Contractual PD is infrequently used by school districts in Arkansas.
In a BLR survey of teachers, respondents said that grade-specific and subject-specific PD was most effective in improving instruction aimed at increasing student achievement. Respondents also noted that districts choosing PD based on individual teachers' needs is important as well. Research shows that equally important is the instilling of knowledge and skill acquisition through follow-up modeling, observational feedback, and job-embedded mentoring by presenters or coaches (Blank & de las Alas, 2008; Council of Chief State School Officers, 2009; Fogarty & Pete, 2009; Yoon et al., 2007). Teachers need time and coaching to apply strategies taught in PD exercises to fully acquire operational skills and knowledge. All BLR surveys and interviews, including some in-depth case studies by the BLR, indicate that technology training for teachers is a top priority for PD. When principals were asked to indicate the top five most effective PD for teachers, technology training was the most frequent response. According to on-site interviews and case studies, most districts have purchased valuable technology (e.g., Smart Boards) with stimulus funds, but many teachers need to learn how to use it. Too many teachers, for example, are using SMART Boards as "white boards." Many principals and teachers indicated that they also need technology instructors in their district. ADE reports that most of the technology PD is done by educational cooperatives. Among their top survey responses for most effective PD, principals also listed training in the interpretation and use of test data for instruction. Teachers and principals also were asked which PD experiences in the past year would they rate as unproductive in terms of professional enhancement. Universally required workshops and conferences that do not meet teachers' needs or interests were rated as unproductive by teachers and many principals. Respondents also reported that one-time workshops or conferences, with no follow-up opportunities to practice skills taught, have little practical utility.

Page 57
Requiring teachers to attend workshops devoted to content they do not teach also was a common complaint among teachers on the BLR survey and in on-site interviews. Online PD Program In 2005 the Legislature passed Act 2318 of 2005, creating the Arkansas Online Professional Development Initiative. The statute requires ADE to identify statewide teacher professional development needs and work with school districts and AETN to develop a statewide online professional development program. The ADE program was allocated up to $4 million annually (about $9 per ADM) to develop and implement a statewide professional development support system. The funding came out of the approximately $23 million allocated annually for professional development categorical funding. Though the districts were losing $9 per student in PD funding (about 17.4% of the total amount allocated for PD), legislators hoped the statewide program would offer an efficient online delivery system for PD courses that would be free to district educators. Over the last five years, AETN has received annual grant payments ranging from about $2.9 million to $3.8 million. The department also provided smaller amounts of funding to other organizations supporting the system and providing other types of professional development, including the Arkansas Association of Educational Administrators, the Education Service Cooperatives, and the Arkansas Leadership Academy. AETN used its funding to develop the central element of the Online PD program, Arkansas IDEAS, the statewide program of online courses and teaching resources for educators. The program is offered through an online portal, where teachers can access vendor-created online courses, locally created courses that have been adapted for online use, and other reading materials and resources. The portal offers more than 1,000 PD credit-earning courses.
2006 2007 2008 2009
PD credit hours earned* 3,326 44,164 69,228 86,269
Courses completed** 956 20,773 32,126 35,043
New registered users* 1,196 6,802 5,601 4,280 * Source: BLR calculation of new users and annual credit hours earned based on AETN's cumulative figures **Source: BLR analysis of AETN's course database
Responses from the BLR’s district survey indicate that a little less than half of the districts use the state’s online PD for between 1% to 29% of their PD. The other half of districts do not use the AETN courses at all. Additionally, in its November 2009 report, the BLR found that funding provided to AETN had significantly exceeded AETN's cost of operating the online PD portal. As of June 30, 2010, AETN had a balance of unexpended funds in the amount of more than $4.4 million, according to figures provided by ADE. Since the BLR's report, ADE has indicated that for FY2011, AETN will maintain the program using its fund balances. Notably, AETN calculated its total expenditures for the program for FY2010 to be $2,763,196.63, yet the network's budget for FY2011 has been approved by ADE at $4,280,441.90, meaning AETN has budgeted about $1.5 million more than it spent in FY2010.

Page 58
Other changes implemented since the BLR's report include new contractual requirements to which AETN must adhere. According to the signed budget document, AETN agreed, among other things, that:
Requested funds should be expended during the fiscal year and all budget revisions must be approved by ADE in writing.
Appropriate documentation to support expenses will be maintained and AETN will provide them to ADE upon request.
Periodic financial reports and a yearly financial report will be submitted to ADE. Summary of Categorical Funding The following tables show how categorical funding was distributed and compares districts' spending in 2008-09 with the amount of categorical funding provided to them.
Students Districts Receiving
Funding
ELL 27,589 132
ALE 4,964 210
NSL 262,274 244
PD NA 244
Total District Expenditure
Per-Student Funding
Districts' Actual Per-
Student Expenditure
ELL $12,486,661 $293 $453
ALE $31,750,663.41 $4,063 $6,395.85
NSLA $144,987,178.30 90%+ poverty: $1,488 70%->90% poverty: $992
>70% poverty: $496
$552.80
PD $17,547,335.00 $41.33 $40.80

Page 59
Section 10: Educational Equity
Academic Equity To gauge the equity of Arkansas's educational system, the BLR examined the equity in districts’ funding and expenditures per pupil. District Funding The analysis found a high level of equality in the distribution of state education funding. However, when looking at just foundation funding combined with other sources of local funding, districts with higher property wealth are, in general, receiving more funding than districts with lower property values. When categorical funding is added into the analysis, the state-level funding equalizes districts with varying property values. District Spending When comparing school district expenditures per pupil to the property wealth of the district, the BLR analysis concluded that district spending per pupil is not strongly related to property wealth. School districts with a higher percentage of NSLA students are spending more per pupil than a district with a lower percentage of poverty students consistent with the intended use of categorical NSLA funding. A school district's expenditures per pupil are weakly related to the percentage of non-white or minority students within a district, meaning a district with more minority students spent slightly more per student than a district with a lower minority population. When comparing smaller school districts to larger school districts, smaller school districts spend only slightly more per pupil than larger districts. Analysis of District Funding and Expenditures The BLR staff reviewed school district funding and expenditures (except building acquisition and debt service expenditures) in FY2008-09 to see how districts' revenues and spending patterns related to a district's local wealth, racial composition, percent of students in poverty, and student test scores. Funding The funding analysis divided districts into five groups (quintiles). The quintiles in the following table are based on districts' property taxes per pupil.
2009 QUINTILE 5 4 3 2 1
PROPERTY TAXES PER PUPIL
$4,161.30 $2,667.70 $2,084.77 $1,722.52 $1,335.03
Assessed Value Per Pupil $116,621.56 $75,783.92 $60,487.62 $50,085.55 $39,731.82
Unrestricted State Funds Per Pupil
$8,220.33 $7,746.77 $7,383.05 $7,301.58 $7,011.36
State Categorical Funds Per Pupil
$451.59 $508.71 $480.11 $493.85 $525.03
ACTAAP % Proficient & Above
69.13% 66.80% 68.70% 69.66% 66.35%
NSLA % 55.90% 61.45% 60.16% 60.98% 65.66%
% White 73.51% 74.11% 78.36% 82.11% 76.48%

Page 60
The data above shows that while there was a large discrepancy between the districts with the highest and lowest property tax collections per student (the highest is 212% higher than the lowest), the discrepancy in the amount of unrestricted funds districts receive is considerably less (17%) as is the discrepancy in student test scores (4%). The following table groups districts based on district revenues per student. The revenues used in the calculation include unrestricted state funds such as state foundation funding and enhanced funding; categorical funding and other restricted state funds; and federal grant funding, such as Title I and Title VIB.
2009 QUINTILE 5 4 3 2 1
Selected Revenues Per Pupil $10,753.30 $9,397.29 $8,810.57 $8,359.82 $7,908.57
Unrestricted Funds Per Pupil $8,342.65 $7,719.15 $7,458.73 $7,184.41 $6,958.15
ACTAAP % Proficient & Above 58.32% 66.81% 69.67% 71.86% 73.99%
NSLA % 74.62% 65.51% 59.99% 55.33% 48.70%
% White 57.99% 71.82% 81.27% 83.25% 90.25%
% Non-White 42.01% 28.18% 18.73% 16.75% 9.75%
The analysis above indicates that revenues are higher for the quintile group having the highest NSLA rate and lowest for the quintile group for the lowest NSLA rate. Foundation funding is a larger percentage of available major revenues for the groups having the least amount of total revenues. Expenditures The following table examines district expenditures. It groups districts into quintiles based on districts' percentage of NSLA students.
2009 QUINTILE 5 4 3 2 1
NSLA % 84.82% 67.90% 59.47% 52.31% 39.66%
% Non White 52.41% 22.10% 17.29% 14.28% 9.35%
ACTAAP % Proficient & Above 55.68% 66.31% 70.33% 72.40% 75.90%
Total K-12 Expenditures*Per Pupil $10,136.16 $8,910.90 $8,233.03 $8,486.79 $7,875.37
K-12 Instruction Expenditures* Per Pupil
$5,639.11 $5,047.80 $4,894.78 $4,919.26 $4,661.02
Instruction Expenditures as a % of Total K-12 Expenditures*
55.70% 56.78% 59.46% 58.03% 59.24%
* Total expenditures do not include facilities or debt service expenditures.
This analysis demonstrates that expenditures are greatest among districts with high percentages of NSLA and non-white students. ACTAAP performance is usually higher among districts with lower percentages of NSLA students and the higher percentages of white students.

Page 61
The BLR also examined the percentage of districts' total expenditures that is spent on instruction, rather than administration, etc. Routine capital items coded to instruction, instruction support and operational support are included in the following calculated percentages. The data showed that the percentage of instructional expenditures has declined in each of the past five school years as indicated in the following graph:
% of Expenditures Spent on Instruction
56.5%
57.0%
57.5%
58.0%
58.5%
59.0%
59.5%
60.0%
60.5%
61.0%
2005 2006 2007 2008 2009
Instructional
Expenditures
Fund Balances The BLR analyzed three types of district fund balances: Legal balances, unrestricted fund balances and categorical fund balances. The latter two fund balances are part of the legal balance, which represents the balances of the teacher salary fund, the operating fund, and the debt service fund.
Legal Balances Unrestricted Fund Balances
Categorical Fund Balances
Beginning Balance July 1, 2008
$613,481,193.51 $490,482,528.33 $34,781,359.65
Ending Balance June 30, 2009
$638,338,723.19 $511,697,710.27 $32,463,657.04
Change in Fund Balances
$24,857,529.68 $21,215,181.94 -$2,317,702.61
The statewide average ratio of unrestricted fund balance to selected revenue amounts (which include unrestricted funds, such as foundation and enhanced funding; categorical funding; other restricted state funding, such as grant funding for instructional and operating support; and restricted federal grant funds) is 21.65%.

Page 62
The following table divides districts into five groups based on how large their unrestricted fund balance is when measured as a percentage of selected revenue.
2009 QUINTILE 5 4 3 2 1
Unrestricted Fund Balance as a Percent of Selected 2009 Revenue
49.53% 25.19% 17.14% 11.22% 5.17%
2009 Three-Quarter Average ADM
1,026.36 1,284.18 1,443.74 2,335.51 3,272.70
Five-Year Three-Quarter Average ADM Change
-4.86% -4.64% -4.26% 1.81% 2.07%
% Non-White 52.41% 22.10% 17.29% 14.28% 9.35%
ACTAAP % Proficient and Above
64.69% 67.98% 68.35% 69.23% 70.40%
Total Mills 34.78 36.54 36.20 36.93 36.95
Property Taxes Per Pupil $2,571.04 $2,176.43 $2,452.80 $2,206.22 $2,546.84
The table shows that districts in the group with the highest fund balance as a percentage of revenue also have the highest percentages of minority students, declining enrollments and the lowest test scores.
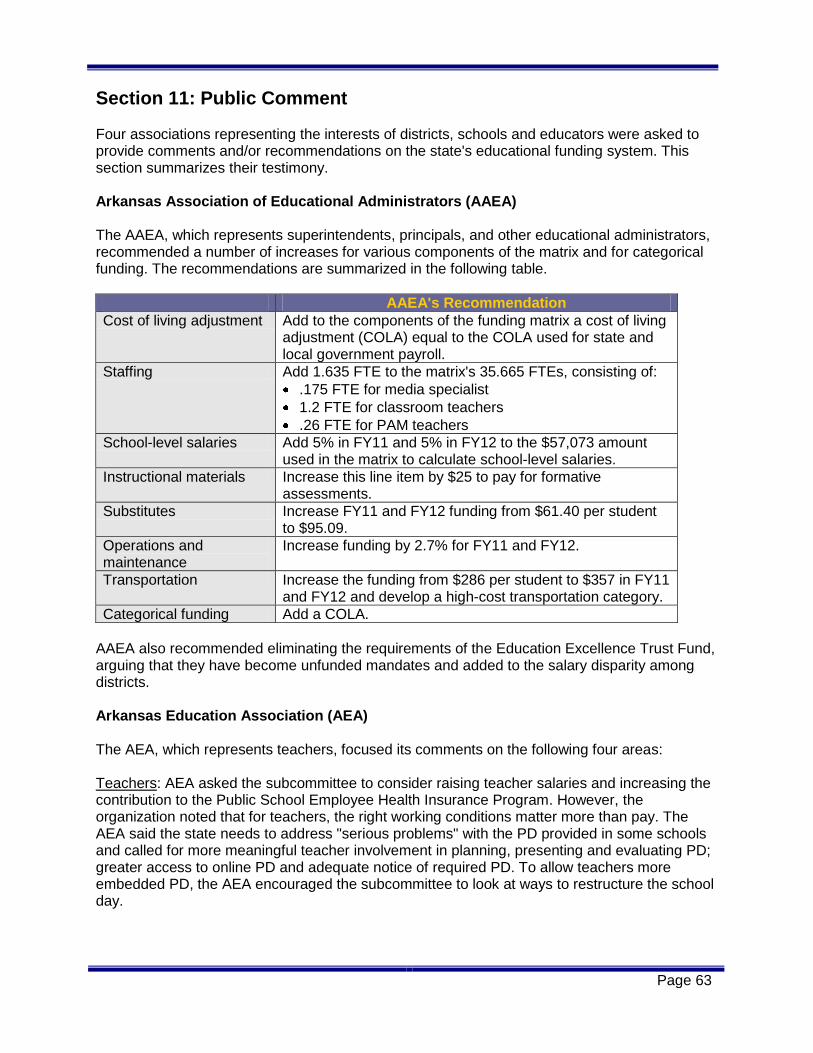
Page 63
Section 11: Public Comment Four associations representing the interests of districts, schools and educators were asked to provide comments and/or recommendations on the state's educational funding system. This section summarizes their testimony. Arkansas Association of Educational Administrators (AAEA) The AAEA, which represents superintendents, principals, and other educational administrators, recommended a number of increases for various components of the matrix and for categorical funding. The recommendations are summarized in the following table.
AAEA's Recommendation
Cost of living adjustment Add to the components of the funding matrix a cost of living adjustment (COLA) equal to the COLA used for state and local government payroll.
Staffing Add 1.635 FTE to the matrix's 35.665 FTEs, consisting of:
.175 FTE for media specialist
1.2 FTE for classroom teachers
.26 FTE for PAM teachers
School-level salaries Add 5% in FY11 and 5% in FY12 to the $57,073 amount used in the matrix to calculate school-level salaries.
Instructional materials Increase this line item by $25 to pay for formative assessments.
Substitutes Increase FY11 and FY12 funding from $61.40 per student to $95.09.
Operations and maintenance
Increase funding by 2.7% for FY11 and FY12.
Transportation Increase the funding from $286 per student to $357 in FY11 and FY12 and develop a high-cost transportation category.
Categorical funding Add a COLA.
AAEA also recommended eliminating the requirements of the Education Excellence Trust Fund, arguing that they have become unfunded mandates and added to the salary disparity among districts. Arkansas Education Association (AEA) The AEA, which represents teachers, focused its comments on the following four areas: Teachers: AEA asked the subcommittee to consider raising teacher salaries and increasing the contribution to the Public School Employee Health Insurance Program. However, the organization noted that for teachers, the right working conditions matter more than pay. The AEA said the state needs to address "serious problems" with the PD provided in some schools and called for more meaningful teacher involvement in planning, presenting and evaluating PD; greater access to online PD and adequate notice of required PD. To allow teachers more embedded PD, the AEA encouraged the subcommittee to look at ways to restructure the school day.

Page 64
AEA said the state needs to evaluate its teacher recruitment and retention program to determine whether they are successful and suggested the Adequacy Subcommittee consider providing financial and other incentives to encourage teachers to seek graduate degrees. Administrators: The association wants to ensure that administrators are trained to provide adequate instructional and disciplinary support and asked the state to determine whether new teacher and administrator programs are adequately supported. Fund balances: The AEA called for the data on district fund balances to be publicly available online and the state to devise policies to ensure that districts are not growing fund balances at the expense of improving student achievement. Achievement gap: The AEA repeated recommendations for reducing the achievement gap, which were presented during the 2008 adequacy study hearings: reintroduce state funding for school health clinics, provide high-quality after-school and summer programs, and reduce the K-3 class size. Arkansas School Boards Association (ASBA) The ASBA repeated testimony it has made during previous adequacy hearings, suggesting that the staffing levels established in the matrix are not sufficient for all districts of varying sizes or all schools with varying grade configurations. Some districts need more staff than is funded by the matrix to meet state accreditation standards. ASBA suggested having "expert, real world practitioners" create a class schedule to determine the actual number of necessary positions. ASBA also suggested that the legislature's adequacy study examine not only districts' expenditures, but also the context in which those expenditures are being made. The ASBA suggested that "distress intervention teams" collect information explaining the spending patterns of the districts they review. ASBA suggested that the matrix increase the number of instructional facilitators it funds from 2.5 to 4. Included in the 2.5 funded positions for that line item are two instructional facilitators, .5 of which can serve as a facilitator for technology issues, and .5 of an assistant principal. ASBA argues that districts need a full-time assistant principal, a full-time technology assistant and two full-time instructional facilitators separate from the assistant principal position and the technology position. ASBA argued that the matrix under-funds librarians, again noting that the staffing level set by the matrix for librarians isn’t practical in real schools. The association also indicated that the technology funding “may be insufficient,” noting that the funding level is based on the declining costs of old technology. The only categorical fund ASBA mentioned was PD. The organization said teachers need more than 60 hours of PD, and they need additional planning time. The ASBA also believes that administrators need some authority to prescribe how teacher spend their planning periods. Without such authority, organizing collaborative professional development activities during the school day is difficult. ASBA argued that ADE rules requiring six hours per day of instructional time has led to less time allowed for recess, which ASBA noted plays an important role in student achievement. The organization urged the General Assembly to clarify state law (A.C.A. § 6-16-132) to specify that the number of minutes spent in recess will count as part of the instructional day.

Page 65
ASBA suggested that $25 per student be appropriated for formative assessments and requested that the matrix be amended to include money for gifted and talented programs, which are required by accreditation rules. Arkansas Rural Education Association (AREA) AREA agreed with the comments made by AAEA and added two other concerns: a decline in federal funding for areas with forest land and excessive transportation costs. Decline in federal funding Many rural communities receive federal funding through the Secure Rural Schools & Community Self-Determination Act (SRSCA). The Act provides funding to offset communities' inability to generate revenues from land where national forests are located. AREA's written testimony, citing the National Forest Counties and Schools Coalition, indicates that this federal funding will decline 150% from $10.6 million in 2008 to $4.2 million in 2012. AREA argued that the anticipated decline warrants an amendment to the state's education funding formula. The federal funds are considered "miscellaneous funds" in the state funding formula. State law calls for a five-year average of districts' miscellaneous funds to be used as one part of the per-student foundation funding calculation. The organization said that in years when the districts' SRSCA funding drops below the five-year average, those districts do not receive the full amount of foundation funding for those years. The organization suggested amending state law to state that when a district's SRSCA funds drop, the state will make up the difference. AREA did not address actions to be taken if a district's SRSCA funds increase. Transportation AREA also expressed concern that the matrix funding for transportation is inadequate for many districts. AREA suggested leaving transportation in the matrix and creating a new categorical fund for districts that incur excessive transportation costs. AREA recognized that some additional funding for transportation was included in the isolated funding some districts receive. The organization suggested creating a transportation categorical that factors in this existing funding to ensure no districts receive twice the transportation funding.

Page 66
Section 12: Recommendations
After considering all of the information provided, the Adequacy Subcommittee determined that school districts should receive an increase in funding. The Subcommittee recognized that statewide districts spent, on average, $70.75 less foundation funding than they received. However, the Subcommittee noted that while some districts' needs were adequately met through foundation funding, the state aid was insufficient to meet the educational adequacy needs of nearly half of the districts. A total of 118 districts spent more than $5,789 per student on items meant to be covered by foundation funding. And by and large, the districts that spent less of their foundation funding tended to be districts that could afford to use other types of unrestricted funding. On average, the 127 districts that spent less than $5,789 collected $289.14 per student more in property taxes than those that spent more than the foundation funding provided. The Joint Adequacy Evaluation Oversight Subcommittee of the House and Senate Interim Committees on Education, therefore, recommends the following actions:
For FY2012, apply a 2.5% inflationary increase on all line items in the matrix, except transportation, and a 2.5% inflationary increase on all four categorical funds.
For FY2013, apply a 2.9% inflationary increase on all line items in the matrix, except transportation, and a 2.9% inflationary increase on all four categorical funds.
For FY2012 and FY2013, keep the funding for the transportation line item at its current FY2011 funding level of $297.50, but create a separate funding line item to be known as Enhanced Transportation Funding. Distribute funding for this line item using a formula based on “essential linear route miles” (those directly related to transporting students to and from school for the purpose of providing them with the opportunity to receive an adequate education) to those school districts whose transportation costs are not covered by the amount of funding provided to them by the current transportation line item in the matrix. Establish the funding for the Enhanced Transportation Funding line item using the appropriate inflationary adjustment to the amount of funding currently allocated to the transportation line item in the funding matrix (2.5% of the matrix funding for transportation in FY2012 and 2.9% in FY2013).

Page 67
Appendix A
Acts 57 and 1204, codified at A.C.A. § 10-3-2102 10-3-2102. Duties.
(a) During each interim, the House Interim Committee on Education and the Senate Interim Committee on Education shall meet separately or jointly, as needed, to:
(1) Assess, evaluate, and monitor the entire spectrum of public education across the State of Arkansas to determine whether equal educational opportunity for an adequate education is being substantially afforded to the school children of the State of Arkansas and recommend any necessary changes;
(2) Review and continue to evaluate what constitutes an adequate education in the State of Arkansas and recommend any necessary changes;
(3) Review and continue to evaluate the method of providing equality of educational opportunity of the State of Arkansas and recommend any necessary changes;
(4) Evaluate the effectiveness of any program implemented by a school, a school district, an education service cooperative, the Department of Education, or the State Board of Education and recommend necessary changes;
(5) Review the average teacher salary in the State of Arkansas in comparison to average teacher salaries in surrounding states and member states of the Southern Regional Education Board and make recommendations for any necessary changes to teacher salaries in the State of Arkansas established by law;
(6) Review and continue to evaluate the costs of an adequate education for all students in the State of Arkansas, taking into account cost of living variances, diseconomies of scale, transportation variability, demographics, school districts with a disproportionate number of students who are economically disadvantaged or have educational disabilities, and other factors as deemed relevant, and recommend any necessary changes;
(7) Review and continue to evaluate the amount of per-student expenditure necessary to provide an equal educational opportunity and the amount of state funds to be provided to school districts, based upon the cost of an adequate education and monitor the expenditures and distribution of state funds and recommend any necessary changes;
(8) Review and monitor the amount of funding provided by the State of Arkansas for an education system based on need and the amount necessary to provide an adequate educational system, not on the amount of funding available, and make recommendations for funding for each biennium.
(b) As a guidepost in conducting deliberations and reviews, the committees shall use the opinion of the Supreme Court in the matter of Lake View Sch. Dist. No. 25 v. Huckabee, 351 Ark. 31, 91 S.W.3d 472 (2002), and other legal precedent.
(c) The Department of Education, the Department of Workforce Education, and the Department of Higher Education shall provide the committees with assistance and information as requested by the committees.
(d) The Attorney General is requested to provide assistance to the committees as needed.
(e) Contingent upon the availability of funding, the House Interim Committee on Education, the Senate Interim Committee on Education, or both, may enter into an agreement with outside consultants or other experts as may be necessary to conduct the adequacy review as required under this section.

Page 68
(f) The study for subdivisions (a)(1)-(4) of this section shall be accomplished by:
(1) Reviewing a report prepared by the Division of Legislative Audit compiling all funding received by public schools for each program;
(2) Reviewing the curriculum frameworks developed by the Department of Education; (3) Reviewing the Arkansas Comprehensive Testing, Assessment, and Accountability
Program, § 6-15-401 et seq.; (4) Reviewing fiscal, academic, and facilities distress programs; (5) Reviewing the state's standing under the No Child Left Behind Act of 2001, 20 U.S.C.
§ 6301 et seq.; (6) Reviewing the Arkansas Comprehensive School Improvement Plan process; and (7) Reviewing the specific programs identified for further study by the House Interim
Committee on Education and the Senate Interim Committee on Education.
(g)(1) The study for subdivision (a)(5) of this section shall be accomplished by comparing the average teacher salary in Arkansas with surrounding states and Southern Regional Education Board member states, including without limitation:
(A) Comparing teacher salaries as adjusted by a cost of living index or a comparative wage index;
(B) Reviewing the minimum teacher compensation salary schedule; and (C) Reviewing any related topics identified for further study by the House Interim
Committee on Education and the Senate Interim Committee on Education. (2) Depending on the availability of National Education Association data on teacher
salaries in other states, the teacher salary comparison may be prepared as a supplement to the report after September 1.
(h) The study for subdivision (a)(6) of this section shall be accomplished by reviewing: (1) Expenditures from:
(A) Isolated school funding;
(B) National school lunch student funding;
(C) Declining enrollment funding;
(D) Student growth funding;
(E) Special education funding;
(2) Disparities in teacher salaries; and
(3) Any related topics identified for further study by the House Interim Committee on Education and the Senate Interim Committee on Education.
(i) The study for subdivision (a)(7) of this section shall be accomplished by: (1) Completing an expenditure analysis and resource allocation review each biennium; and
(2) Reviewing any related topics identified for further study by the House Interim Committee on Education and the Senate Interim Committee on Education.
(j) The study for subdivision (a)(8) of this section shall be accomplished by: (1) Using evidence-based research as the basis for recalibrating as necessary the state's
system of funding public education; (2) Adjusting for the inflation or deflation of any appropriate component of the system of
funding public education every two (2) years; and (3) Reviewing any related topics identified for further study by the House Interim
Committee on Education and the Senate Interim Committee on Education.

Page 69
Appendix B
Index of Adequacy Subcommittee reviews as required by Act 57 and Act 1204
Statutory Requirement Report Section
Reviewing a report prepared by the Division of Legislative Audit compiling all funding received by public schools for each program
Section 7
Reviewing the curriculum frameworks developed by the Department of Education
Section 5
Reviewing the Arkansas Comprehensive Testing, Assessment, and Accountability Program
Section 5
Reviewing fiscal, academic, and facilities distress programs Section 5
Reviewing the state's standing under the No Child Left Behind Act of 2001
Section 5
Reviewing the Arkansas Comprehensive School Improvement Plan process
Section 5
Comparing the average teacher salary in Arkansas with surrounding states and Southern Regional Education Board member states, including:
Comparing teacher salaries as adjusted by a cost-of-living index or a comparative wage index
Reviewing the minimum teacher compensation salary schedule
Section 8
Reviewing expenditures from isolated school funding Section 7
Reviewing expenditures from National School Lunch state funding Sections 7 and 9
Reviewing expenditures from declining enrollment funding Section 7
Reviewing expenditures from student growth funding Section 7
Reviewing expenditures from special education funding Section 8
Reviewing disparities in teacher salaries Section 8
Completing an expenditure analysis Section 10
Completing a resource allocation review Sections 8 and 9
Using evidence-based research as the basis for recalibrating as necessary the state's system of funding public education
Section 12
Adjusting for the inflation or deflation of any appropriate component of the system of funding public education
Sections 8 and 12
Act 1204 also established that the legislature would review any other program or topic identified for further study. The following table lists the only interim study proposal addressed by the Adequacy Subcommittee, along with the section of this report where the topic can be found.
ISP # Study Topic Report Section
2009-198 State-funded programs designed to help schools in school improvement
Section 5

Page 70
Appendix C
Education Committees and Adequacy Subcommittee Presenters Experts, state agency officials, and members of the General Assembly provided information, data, and other assistance to the Adequacy Subcommittee and the Education Committees. Bureau of Legislative Research
Mr. Richard Wilson, Assistant Director for Research Services
Ms. Jerri Derlikowski, Administrator, Policy Analysis and Research Services
Mr. Paul Atkins, Senior Research Specialist, Policy Analysis and Research Services
Dr. Brent Benda, Senior Research Specialist, Policy Analysis and Research Services
Ms. Lori Bowen, Senior Legislative Analyst, Legislative Fiscal Services Division
Mr. Michael Brown, Legislative Analyst, Policy Analysis and Research Services
Ms. Sarah Ganahl, Legislative Attorney, Legal Services Division
Mr. Mark Hudson, Senior Legislative Analyst, Legislative Committee Staff
Ms. Cheryl Reinhart, Legislative Attorney, Legal Services Division
Ms. Kristen Sharp, Legislative Analyst, Policy Analysis and Research Services
Ms. Nell Smith, Senior Research Specialist, Policy Analysis and Research Services Arkansas Department of Education
Dr. Tom Kimbrell, Commissioner
Dr. Diana Julian, Deputy Commissioner
Mr. Bill Goff, Assistant Commissioner, Fiscal and Administrative Services
Ms. Patty Martin, Associate Director, Research & Analysis, Fiscal and Administrative Services
Mr. Doug Eaton, Director, Division of Public Schools Academic Facilities and Transportation
Dr. Gayle Potter, Associate Director, Curriculum, Assessment, and Research
Ms. Lori Lamb, Program Coordinator, Alternative Learning Environments
Dr. Alice Barnes Rose, Assistant Commissioner, Division of Learning Services
Ms. Deborah Coffman, Education Associate Director, Professional Development Division of Legislative Audit
Mr. David Webb, Field Audit Supervisor, State Agencies Mr. Chris Masingill, Arkansas Recovery Implementation Officer, Office of the Governor Ms. Denise Airola, Assistant Director, NORMES, University of Arkansas Mr. Gene Wilhoit, Executive Director of the Council of Chief State School Officers Dr. Richard Abernathy, Executive Director, Arkansas Association of Educational Administrators Mr. Mike Mertens, Interim Executive Director, Arkansas Association of Educational
Administrators Mr. Rich Nagel, Executive Director, Arkansas Education Association Mr. Richard Hutchinson, Director of Government Relations, Arkansas Education Association Mr. Gerald Cooper, President, Arkansas Rural Education Association Mr. Dan Farley, Executive Director, Arkansas School Boards Association Mr. Ron Harder, Policy Service and Advocacy Director, Arkansas School Boards Association

Page 71
Appendix D
Lake View History and Legislative Response Lake View v. Huckabee The General Assembly's efforts to define and fund an adequate education were driven by a lawsuit filed in August 1992 by the Lake View School District in Phillips County. The lawsuit, filed as Lake View v. Tucker2, claimed the disparity between public school funding for wealthy districts and for low-income districts was unconstitutional. In 1995, the General Assembly changed its educational funding system to one that provides funding to districts based on the number of students, or average daily membership (ADM), equalized by the wealth of the district. Then in August 1998, Pulaski County Chancery Court Judge Collins Kilgore dismissed the case without a trial. On appeal, the Arkansas Supreme Court reversed the lower court's decision and held that the chancery court should determine whether the General Assembly's efforts corrected the funding disparities. In May 2001, Judge Kilgore found the Arkansas school funding system to be unconstitutionally inequitable and inadequate. The case was appealed to the Arkansas Supreme Court, and on November 21, 2002, the court upheld Judge Kilgore's ruling, declaring the state's public school funding system inequitable and inadequate. The court cited the state's "abysmal" educational rankings, low benchmark test scores, and the high need for remediation in college. Teacher salaries failed to keep pace with surrounding states and varied greatly within the state, hindering efforts to recruit and retain high quality teachers. The special needs of impoverished students, including those who were English language learners, were not being adequately met, nor were the needs of school districts in low-income areas and high-growth communities. The Supreme Court noted that ADE had not defined an adequate education nor assessed whether the state's public school system provides one. The court ordered the state to define educational adequacy, examine the entire spectrum of the state's public education system, and monitor how state education funding is spent. Legislative Response To comply with the court's ruling, the General Assembly created the Joint Committee on Educational Adequacy during the 2003 regular legislative session, and charged it with conducting an adequacy study. The committee hired school funding experts Lawrence O. Picus and Associates, which spent four months reviewing Arkansas school finance and adequacy issues and presented its final recommendations September 1, 2003. During the Second Extraordinary Session of 2003, the General Assembly enacted 73 education bills into law3, including a new funding formula, a comprehensive student testing and school accountability program and a school consolidation plan that eliminated all school districts with fewer than 350 students. The new state foundation funding formula calculated the amount of
2 The case was originally filed as Lake View School District No. 25 of Phillips County, Arkansas v. Jim
Guy Tucker, Case No. 92-5318, In the Chancery Court of Pulaski County, Arkansas. Governor Huckabee was substituted as a party in 2000. 3 See Summary of General Legislation, 84th General Assembly of the State of Arkansas, Second
Extraordinary Session 2003, http://www.arkleg.state.ar.us.

Page 72
funding necessary for providing an adequate education. The legislature also set each school's state funding level at $5,400 per student and paid for it with new taxes, which generated $400 million in additional revenue annually. The General Assembly also adopted legislation establishing that education is the state's top funding priority and must be funded first. Act 108's "doomsday" provision would force funding cuts to other state agencies if the funds in the Educational Adequacy Fund plus other resources available to the Department of Education Public School Fund Account of the Public School Fund "are not sufficient to meet the state's financial obligation to provide an adequate educational system as authorized by law." Court Supervision The Supreme Court released the state from court supervision in 2004, praising much of the General Assembly's work while noting that deficiencies still existed. But a year later after the 2005 legislative session, the Supreme Court reopened the case at the request of 50 school districts. The districts, led by the Rogers School District, argued that despite inflation and new state mandates placed on schools, the General Assembly failed to increase the $5,400 foundation funding in 2005-06. They claimed that the money schools received was not enough to provide an adequate education. On December 15, 2005, the Arkansas Supreme Court again declared the public school funding to be unconstitutionally inadequate. The court said the state had not complied with two laws: its doomsday provision requiring that education needs be funded first and Act 57 of the Second Extraordinary Session of 2003 which required the state to study the cost of providing an adequate education. And despite a 2005 allocation of $120 million for school facilities, the court also found that the General Assembly "grossly underfunded" repairs and improvements for school facilities. At the time of the Supreme Court decision, the Adequacy Study Oversight Subcommittee had already begun planning an interim study on education and eventually hired Lawrence O. Picus and Associates to reassess the foundation funding level. In addition, the General Assembly responded to the court's requirements in a special session in April 2006. The legislature increased the per-student foundation funding from $5,400 to $5,486 for 2005-06 and $5,620 for 2006-07. It also added $42 per student for teacher retirement, bringing the total per-student funding amount to $5,528 in FY2005-06 and $5,662 in FY2006-07. The General Assembly also added $50 million for school district facilities for 2005-06, $10 million for schools with declining enrollment for 2006-07,and $3 million for isolated schools for 2006-07. A year later in May 2007, the Supreme Court, in an historic decision signed by all seven of the participating justices, declared the Arkansas public school funding system constitutional.4
4Lake View Sch. Dist. No. 25 of Phillips County v. Huckabee, 370 Ark. 139, __ S.W.3d __ (2007).

Page 73
Appendix E: Glossary
Academic distress: The state designation for a district that has demonstrated a lack of student achievement on the state-mandated, norm-referenced or criterion-referenced tests for a sustained period of time. Districts are placed in academic distress if 75% or more of their students score below basic on criterion-referenced tests. Adequate yearly progress (AYP): The federal No Child Left Behind Act calls for all students to be proficient in literacy and mathematics by the 2013-2014 school year. In the meantime, schools' student test scores must meet designated targets, known as adequate yearly progress, toward meeting that goal. Alternative learning environment funding: A state categorical funding program that provides extra money to school districts to help them educate students who need different learning environments due to social or behavioral factors that make learning difficult in the traditional classroom. School districts received $4,063 per ALE student in 2009 and 2010 in ALE categorical funding. In 2009, there were 4,964 ALE students in Arkansas. Arkansas Comprehensive School Improvement Plan (ACSIP): A written plan schools and districts use to outline goals and activities that they believe will raise student academic achievement. It is written by schools and districts and approved by ADE. Arkansas Comprehensive Testing, Assessment, and Accountability Program (ACTAAP): The state's student testing system in which every student and every school is required to participate. ACTAAP tests students to gauge their understanding of the state curriculum and uses the collective test scores to measure the quality of the education that schools provide. Categorical funding: In addition to foundation funding school districts receive four groups of categorical funding. Three of the four categorical funds — English Language Learners (ELL), National School Lunch Act (NSLA), and Alternative Learning Environment (ALE) — are designed to help schools educate students with special needs. The fourth categorical fund — Professional Development (PD) — is designed to pay districts for providing staff professional development. Criterion-referenced tests (CRT): State-developed exams, designed to test a student's mastery of a particular topic. The state's augmented benchmark exam includes CRT questions that were customized to the Arkansas education standards, and it provides an NRT score comparing Arkansas students to other students nationally. English Language Learners: Students with limited English language proficiency. School districts received $293 per ELL student in 2009 and 2010 to help educate these students. ELL is one of the four categorical funds. In 2009, there were 27,589 ELL students in Arkansas. Facilities distress: The state designation for a district that fail to properly maintain their academic facilities in accordance with state laws and related rules. Under the law, the Arkansas Commission for Arkansas Public School Academic Facilities and Transportation may place a district in facilities distress for problems including material violation of local, state, or federal fire, health, or safety code provisions or laws; material failure to comply with state laws regarding purchasing, bid requirements or school construction; material default on any district debt obligation; and material failure to plan and progress satisfactorily toward accomplishing priorities set by the Division and the district's master plan.

Page 74
Fiscal distress: The state designation for a district having financial problems including a declining balance that jeopardizes the district’s fiscal integrity; material failure to properly maintain facilities; and insufficient funds to cover payroll, benefits, and/or tax obligations. Formative assessment: An ongoing process of frequently evaluating student's understanding — through quizzes, questioning, mid-lesson checks, etc. — to help teachers tailor lessons to student learning. Foundation funding: "An amount of money specified by the General Assembly for each school year to be expended by school districts for the provision of an adequate education for each student" (A.C.A. § 6-20-2303). Foundation funding is the base per-student amount of state funding provided to school districts. Each district receives the foundation funding amount multiplied by its student count, or average daily membership. In 2008-09 foundation funding was set at $5,789 per student. Matrix: The formula for calculating the foundation funding amount. The matrix is made up of individual items considered necessary for the operation of schools, including teachers, principals, and instructional materials. The matrix establishes a funding value for each item. National School Lunch Act funding: State funding provided to school districts with high percentages of students in poverty. This state funding should not be confused with the federal National School Lunch Act. The state money is called NSLA funding only because it uses the federal act's eligibility criteria for free and reduced price lunches. School districts whose student population consists of more than 90% students in poverty received $1,488 per NSLA student in 2009 and 2010. Those with 70%-90% poor students received $992 per NSLA student, and those with less than 70% received $496 per NSLA student. In 2008-09 there were 262,274 NSLA students in Arkansas. Norm-referenced tests (NRT): National standardized exams used to compare students' performance with one another and make state-to-state comparisons. The state's augmented benchmark exam includes CRT questions that were customized to the Arkansas education standards, and it provides an NRT score comparing Arkansas students to other students nationally. Professional development funding: One of the state's four categorical funds. State rules define professional development as "a coordinated set of planned learning activities that are based on research, are standards-based and continuous." All certified employees are required to receive 60 hours of such training annually. The state provides $50 per student to provide staff professional development. In FY2008-09, $41.33 of the $50 went to school districts and the remaining $8.67 funded the statewide online professional development program. That program is a partnership between ADE and AETN to offer online PD courses to all teachers across the state at no cost to the teachers or their school districts. School improvement: The federal No Child Left Behind Act calls for all students to be proficient in literacy and mathematics by the 2013-2014 school year. In the meantime, schools' student test scores must meet designated targets, known as adequate yearly progress, toward meeting that goal. Schools that fail to meet those incremental targets for two years in a row are placed on the school improvement list. In 2009, 404 of the state's nearly 1,100 school were on school improvement and another 173 were on alert (meaning the school has failed to make AYP for one year).