a Report For The Bbc Trust - Kpmg Us Llp · A report for the BBC Trust . ... 6.4 The impact of BBC...
89
The role of the BBC in supporting economic growth A report for the BBC Trust October 2015
Transcript of a Report For The Bbc Trust - Kpmg Us Llp · A report for the BBC Trust . ... 6.4 The impact of BBC...

The role of the BBC in supporting
economic growth
A report for the BBC Trust
October 2015

Important Notice
This report, “The role of the BBC in supporting economic growth” (“Report") has been prepared by KPMG LLP in accordance with specific terms of reference (“terms of reference") agreed between the British Broadcasting Corporation “the Addressee”, and KPMG LLP.
KPMG LLP has agreed that the Report may be disclosed to any party on the basis set out herein. KPMG LLP wishes all parties to be aware that KPMG LLP's work for the Addressee was performed to meet specific terms of reference agreed between the Addressee and KPMG LLP and that there were particular features determined for the purposes of the engagement.
The Report should not therefore be regarded as suitable to be used or relied on by any other person or for any other purpose.
The Report is issued to all parties on the basis that it is for information only. Should any party choose to rely on the Report they do so at their own risk. KPMG LLP will accordingly accept no responsibility or liability in respect of the Report to any party other than the Addressee.

Contents
1 Executive summary 1
2 About the study 8
3 The economic framework for assessing the BBC’s market impact 10
4 The economic impact of the BBC in the North West of England 14
4.1 Introduction 14
4.2 The BBC’s North West operations and the Salford move 14
4.3 Contributing to the UK’s GVA 17
4.4 Generating employment and developing skills 20
4.5 Investing and innovating 25
4.6 Creating network and agglomeration spillover effects 26
4.7 Generating wider positive impacts 29
5 The economic impact of the BBC’s online activity 30
5.1 Introduction 30
5.2 The BBC’s online activity 30
5.3 Economic impacts arising from BBC Online external spend with suppliers 32
5.4 The economic contributions of the BBC’s investment and innovation in the online market 33
6 The economic impact of the BBC on the music industry 47
6.1 Introduction 47
6.2 The scope of BBC support for the music industry 48
6.3 The impact of the BBC’s role in increasing artists’ exposure 49
6.4 The impact of BBC live music events 68
Technical Appendix 72

1
1 Executive summary
The constitutional basis for the British Broadcasting Corporation (‘BBC’) is the Royal Charter. As the end of the current Charter period is approaching, the process of consultation and review about the framework under which the BBC will operate in the future is underway.
As one area under consideration by DCMS is the BBC’s positive or negative wider impact on the market, the BBC Trust commissioned KPMG to conduct an analysis of the economic contribution of the BBC in the following specific areas:
• the North West of England (linked to the BBC’s move to Salford);
• the online market; and
• the UK music industry.
We recognise that these areas are a subset of what the BBC does. They are chosen as examples of some of the areas in which the BBC operates, which have wider benefits to the UK economy, in addition to the direct benefits for audiences and licence fee payers.
The BBC, as a whole, will have a much wider economic impact across the UK, through the many more products and services it supplies. Its economic impact spans not only its public broadcasting activities, but also its commercial activities. And the BBC operates both domestically and with a significant international reach, meaning that the BBC’s ‘exports’ have an additional economic benefit to the UK.
The intention of this report is to provide a flavour of the breadth of BBC activities and the economic contributions they make.
The economic impact of the BBC in the North West of England
Historically, the majority of the BBC’s operations were based in London and the South East of England. Although its regional hubs were many and, in some cases, significant – the Bristol and Midlands broadcasting centres having a notably high profile during the 1970s and 1980s – the majority of the organisation’s employees and activities were undoubtedly centred upon London and the surrounding area.
More recently, this changed. In 2011, significant parts of the BBC’s activities, including Sport, Children's, Radio 5 Live, and BBC Breakfast, were relocated to Salford, in the North West of England. For the first time, over half of the BBC's staff are based outside London. The consequence has been that the BBC’s economic impact outside of the South East has grown materially.
We estimate that the BBC’s activities in the North West (predominantly driven by the Salford site) contributed a total of £277 million to UK Gross Value Added (GVA)1 in FY2014/15. This was comprised of:
• £137 million of indirect GVA for the BBC’s Tier 1 suppliers2;
1 Our analysis is in gross terms
2 Tier 1 suppliers are those companies which are direct suppliers to the company that produces the finished product (in this case direct suppliers to the BBC)
1

2
• £80 million of indirect GVA in the wider supply chain; and
• £59 million of induced GVA.
This total GVA contribution is equivalent to approximately 5% of the GVA of Salford, 2% of the GVA of Manchester3 and 6% of the GVA of the UK’s programming and broadcasting activities sector4.
Although the BBC’s supplier expenditure is linked to BBC activity in the North West, as the wider supply chains will be spread across other regions of the UK, the indirect GVA benefits will also be spread across the UK. The same principle applies to the induced economic impacts arising from the expenditure of BBC and BBC suppliers’ employees.
A proportion of the expenditure will be retained within the region, however, adding to the positive economic impact that the BBC has on the local North West economy.
The BBC also contributes to employment in the North West, as well as more widely across the UK through its supply chain. In terms of its direct employment, our analysis indicates that:
• As of March 2015, there were over 2,500 Full Time Equivalent (FTE) employees based at the BBC’s Salford site (over 2,600 employees in headcount terms). There were also a further 116 FTE BBC employees at the other BBC sites in the North West.
• BBC employees in Salford account for approximately 80% of the BBC’s employment in the North of England and 13% of the BBC’s total employment in the UK.
• The large majority of employees in Salford are skilled specialists, with approximately 80% employed in journalist, production management and technical/digital roles.
• The BBC accounts for 40% of creative industry jobs in Salford and 2% of total employment in Salford.
• To further enhance its employees’ skills, the BBC invests in developing its staff through formal training and through supporting skills development and knowledge building and sharing. It also has specific schemes for young people, including an apprenticeship programme for individuals from the Greater Manchester area and a Young Ambassadors scheme for 16-19 year olds from Salford and Trafford.
The BBC has wider employment effects throughout the UK as a result of its activity in the North West through its purchases from suppliers and as a result of its direct and indirect employees spending. We estimate that the total indirect and induced employment is 3,778, comprised of:
• indirect employment at the BBC’s Tier 1 suppliers of 1,901;
• indirect employment in the wider supply chain of 1,196; and
• induced employment of 681.
We consider that there is evidence of further economic benefits arising from the BBC’s activities in the North West, particularly in Salford.
There is academic support for the idea that when a large, important, operator locates in a particular area, this tends to attract similar organisations looking to benefit from the same type of skills and
3 GVA of Salford and of Manchester sourced from Oxford Economics, Greater Manchester Forecasting Model, 2014
4 GVA of the UK’s programming and broadcasting activities sector sourced from ONS (2015) Annual Business Survey – 2013 Revised Results

3
experience5. These ‘agglomeration’ and ‘network’ effects are observed in many sectors: from scientific research in Cambridge, to Formula 1 teams in the M4 corridor, to financiers in the City of London.
There are signs that the BBC’s relocation to Salford has triggered the beginnings of a similar network in the North West.
With the establishment of MediaCityUK as a hub for firms with creative and digital capabilities – stemming from the BBC’s decision to locate there initially – these firms benefit from network effects and knowledge and skills spillovers from the BBC. Approximately 6,500 people are employed in MediaCityUK, around 40% of whom are BBC employees and forecasts suggest that there will be an additional 1,700 creative industry jobs in Salford by 20346. This suggests that the positive spillover effects arising from the cluster of firms in Salford, catalysed by the BBC’s presence, could be considerable.
There is evidence that agglomeration and network effects are important for research, development and productivity. Some of the benefits highlighted to us of the effects of the BBC’s relocation to Salford include: reduced barriers to collaboration for smaller, independent digital agencies; improvements to the quality of outputs for firms collaborating with the BBC; and a greater flow of creative industry talent to the area.
The economic contributions arising from the BBC’s activity in the North West of England, particularly those contributions retained locally, are important in the context of the broader economic performance of the area. The economic contribution of the BBC and the wider MediaCityUK development is also important to the UK government's commitments of “…rebalancing growth across the regions and nations of the UK and… to the creation of a Northern Powerhouse.”7
This is, not least, because:
• GVA per capita in the North West and in Greater Manchester has lagged behind the UK as a whole8; and
• the proportions of working age individuals in Salford with NVQ Level 3 qualifications and above continue to lag Great Britain as a whole, although there has been marked progress in the proportions of individuals with qualifications in Salford over recent years, coinciding with the BBC’s move to the area9.
The economic impact of the BBC’s online activity
An increasingly important element of the BBC’s offering as a public service broadcaster is its online activity. BBC Online now represents approximately 5% of the BBC’s annual PSB Group expenditure (£201 million out of £4,222 million10).
5 Attila Varga, Dimitrios Pontikakis, George Chorafakis, Agglomeration and interregional network effects on European R&D productivity, May 2010; http://neweconomymanchester.com/downloads/513-CLUSNET-Manchester-Workshop-Report-Final-091109-ARIAL-pdf
6 Oxford Economics, The Greater Manchester Forecasting Model
7 HM Treasury, Budget 2015, March 2015, paragraph 1.20
8 ONS, Regional Gross Value Added, 2013 data set
9 ONS, Annual Population Survey, 2015
10 BBC, Annual Report and Accounts, 2014/15

4
Not only has BBC Online grown rapidly in its importance to the BBC’s overall activity, its impact on consumers is significant. According to the BBC Annual Report 2014/15 around 50% of the UK adult population access BBC Online each week.11
BBC Online’s external spend generates GVA through the supply chain. Additionally, the BBC’s investment and innovation in the online space also creates wider spillover effects in the economy.
We have identified two specific mechanisms through which investment by the BBC related to its online activities has had a particularly positive economic impact:
• technology spillovers driven by the BBC’s innovation in the market; and
• knowledge and skills spillovers arising from collaborations, partnerships and wider industry initiatives.
Both of these result in overall development and expansion of the online market and related industries.
In terms of technology spillovers, we have identified a number of examples of where the BBC has catalysed the wider market:
• It is likely that there would be less investment in Video on Demand (VoD) as a new distribution technology without the BBC innovations and investments in technologies in this area. This is because such innovations can be expensive and carry risk. If any one organisation, such as the BBC, were to invest in the area and it were to succeed as a concept, it may be possible for it to be adopted by others relatively easily, once technologies have developed and costs reduced. In economics-language, there are ‘positive externalities’ associated with these types of innovations. Although the BBC was not the first provider to launch its VoD service, it has, undoubtedly, led the market with the implementation of numerous innovative technological improvements, such as downloadable content and a “live restart” facility. Indeed. as noted by Ofcom: “… BBC iPlayer has helped build consumer interest and take-up of on-demand services, providing market opportunities for other providers to deliver new, innovative services beyond traditional TV.”12
• Building on the observation regarding ‘positive externalities’ above, in order to further accelerate market development and competition, BBC Online has also encouraged the implementation of BBC technologies by its competitors through open-sourcing and technology transfer. As acknowledged by NESTA13, through its software development activities, the BBC may create value and innovation more widely. Using data from GitHub, a collaborative software development platform, NESTA found that the BBC’s development activity on this platform has grown significantly since 2012, with the number of BBC projects reaching 380, and there are over 800 instances where others have copied BBC code to continue working on it (‘forks’).
• The BBC is a key player in the Digital Production Partnership (DPP) which establishes standards for the transfer of completed programmes between broadcasters and independent producers and postproduction houses. Its aim is to smooth and accelerate the move to end-to-end digital production, and in doing so reduce complexity and cost and increase interoperability14.
• Again, relevant to the creation and dispersion of ‘positive externalities’, the BBC has supported the development of a number of new technology concepts before they have become commercially viable, to the benefit of the wider industry. For example, through the BBC’s IP
11 BBC, Annual Report and Accounts, 2014/15
12 Ofcom, Proposed changes to BBC Three, BBC iPlayer, BBC One and CBBC Market Impact Assessment, June 2015
13 https://www.nesta.org.uk/blog/public-service-coding-bbc-open-software-developer
14 https://www.digitalproductionpartnership.co.uk/who-we-are/
5
Studio project, a model is being developed for end-to-end broadcasting that will allow a live studio to run entirely on IP networks. This concept was successfully demonstrated at the 2014 Commonwealth Games and the BBC is working with technology companies to develop the approach into commercial products and services.
The second mechanism we identified through which the BBC’s online investments have had a particularly positive economic impact are via knowledge and skills transfer and via the positive effects arising directly from its collaborative activities. We have found these to be in the following areas:
• BBC Online’s partnerships and industry collaborations support knowledge transfer and skills development across the media and technology industries. Examples include: the BBC’s partnership to build open, internet-connected TV platforms, Freeview Play and Freesat; its partnership with the Arts Council England to create broadcast and online arts content; and its industry collaborative project BBC News Labs which works as an ‘incubator’ to take forward opportunities relating to journalism, technology and data. Evidence suggests that positive effects for the BBC and wider industry have arisen from these projects.
• Partnerships with universities are also a central part of BBC’s knowledge sharing and innovation policy. Currently, the BBC partners with numerous universities across the country. Examples include: BBC R&D’s 4-year strategic partnership with University College London (UCL) related to the future of digital content; the BBC’s support in helping UK universities to earn funding from major UK Research Councils such as the Engineering & Physical Sciences Research Council (EPSRC); the multi-university Audio Research Partnership set up to regenerate the BBC’s audio research capability; and the university and industry collaboration in the 5G Innovation Centre (5GIC) at the University of Surrey.
• Through providing direct support to industry, such as through the BBC’s ‘Connected Studio’, the BBC facilitates developments in the market and spreads BBC knowledge and skills. Successful candidates to the Connected Studio initiative benefit from BBC and wider industry expertise to develop their ideas. Through this collaboration, innovation is supported and ideas taken beyond proof of concept to development and testing where feasible. To date, the Connected Studio team has run 109 events, of which 24 have been in MediaCityUK. It has worked with 458 small companies and has given contracts to 160 digital and creative SMEs.
The economic impact of the BBC on the music industry
The BBC undertakes a wide range of music-related activities. It supports the UK music industry via each of its broadcasting channels: radio, television and online. It also engages in a range of broader music-related activities e.g. live music events, music talent initiatives and awards, and production of its own music outputs (such as albums and playlists).
The scale of the BBC’s music related activity suggests that its economic impact in this area could be significant. For example in 2014:
• BBC music television programmes reached around 7 million viewers, on average, each week;15
• a range of music related shows achieved significant viewer figures, e.g. the TV average audience for the BBC Music Awards was 4.17 million and for Last Night of the Proms (including Proms in the Park) was 9 million16; and
15 BARB data provided by the BBC
16 Data provided by the BBC

6
• there is wide reach of the BBC’s music radio stations. In Q2 2015, the average weekly reach of BBC Radio 1 was 10.4 million, for Radio 1Xtra was almost 1 million, for Radio 2 was 15.1 million, and for 6Music was 2.1 million17.
There is GVA and employment generated in the UK economy, both directly and indirectly, through all of this activity. This contributes to the UK music industry’s overall GVA contribution of £3.8 billion to the UK economy.18
Another important way in which the BBC supports the music industry is through the exposure it gives to music artists. Academic studies have found that increased media exposure of music, for example through radio play, is linked to increased sales in the music industry19. The BBC’s activities in this area are significant and evidence suggest that the BBC supports a wide range of music artists:
• Over the course of a month, across Radio 1, Radio 2, Radio 1Xtra, and 6Music, there were over 9,500 unique artists played and16,500 unique tracks played; and
• BBC analysis20 suggests that in 2013-14, Radio 1 played almost twice as many different new21 tracks as any of the five other commercial stations monitored22. Not only that, the BBC found that of the new tracks played during the daytime on Radio 1, a third were not played by any of the commercial stations monitored, demonstrating a limited overlap between music played on BBC Radio 1 and commercial stations.
In order to continue to generate positive contributions to the UK economy from the music industry, it is important that both existing and new UK artists become and remain well known, and that there is a continually growing pool of music talent. The BBC supports this in a number of ways through its broadcasting activities as well as a range of specific initiatives, such as:
• BBC music related awards and talent schemes – of which there are currently 17 schemes including BBC Young Musician of the year and Radio 3 New Generation Artists – which help in the discovery, as well as support, of new musical talent; and
• BBC Introducing which supports unsigned artists in the UK by providing a platform for promoting undiscovered musicians23.
KPMG undertook case study analysis for a number of musicians (including interviews with their promoters, managers and record labels) that the BBC has supported to find out more. These included London Grammar, Sam Smith, and Ed Sheeran. We found that each of these artists generate considerable GVA for the UK economy24, and we were also told by their record labels that their success, at least in part, can be attributed to the BBC’s support:
• London Grammar’s sales increased consistently after appearances on BBC TV or radio shows (e.g. in the hour following a BBC Breakfast interview in May 2014, week on week album sales
17 BBC, All Radio Report, Q2 2015.
18 Figures for 2013. UK Music, Measuring Music, September 2014
19 Liebowitz, S., The Elusive symbiosis: The impact of Radio on the Record Industry, 2004; A. Montgomery, W. Moe, Should Music Labels Pay for Radio Airplay? Investigating the Relationship Between Album Sales and Radio Airplay, 2002; Dertouzos, J., Radio Airplay and the Record Industry: An Economic Analysis, 2008
20 BBC Trust, Service Review: Radio 1, 1Xtra, Radio 2, Radio 3, 6 Music and Asian Network, March 2015
21 New Music is defined as either unreleased music or music released less than a month ago (physical release, not download release)
22 The BBC report does not include a full list of the commercial radio stations monitored. However, XFM and Absolute are named within the report
23 http://www.bbc.co.uk/programmes/articles/4wSZbmPkNVYMKpcHqPmkClp/frequently-asked-questions
24 Our analysis is based on estimated direct, indirect and induced GVA from the artists’ record sales. We recognise that this is only a limited part of the GVA contribution they account for as revenues from royalties, live performances and appearances, merchandise etc. also accounting for significant contributions. Although sales figures and GVA contributions from record sales cannot be attributed to the BBC specifically (there will have been a number of other important drivers of the artists’ record sales and success (including support from other broadcasters)), these case studies consider how the BBC has helped artists realise success based on the views of their record labels.
7
were up 190% and the album rose from number 33 on iTunes to number 6). We estimate that the GVA contribution of their album ‘If You Wait’ up to the week beginning 6th October 2014 was £4.3 million, with a further £0.5 million of GVA from their singles.
• Sam Smith’s record label explained to KPMG the importance of the BBC’s support in his career. This included first plays of his singles on Radio 1 and his win of the BBC Sound of 2014 award which led to an increase in his album sales from 1,000th in the Amazon album chart to 6th in the 24 hours after the win. We estimate that in 2014 alone, the GVA associated with Sam Smith’s UK album and singles sales and streams was £13.2 million.
• Ed Sheeran’s record label told KPMG that: “Radio 1Xtra and Radio 1 have been an enormous part of the Ed Sheeran phenomenon…this could not have been done without the support of the BBC.” We estimate that his total UK album and single sales to date have contributed £43.2 million of GVA to the UK economy.
• According to their record label: “Clean Bandit are a prime example why Radio 1 are so important in helping break new artists”. Some of the BBC support received has included: Radio 1 playlisting two of their singles and supporting three before any other commercial radio station had played any of Clean Bandit’s music; their first radio interview and debut television appearances were both with the BBC; and they have performed live a number of times for the BBC, including at Radio 1 Big Weekends. Despite only breaking through in 2014, we estimate that their record sales alone have generated GVA of approximately £3.8 million.
• We were told by Andreya Triana’s manager that she has received: “…incredible support from the BBC especially from Chris Evans at BBC Radio 2”. After appearing on BBC Radio 2, her album moved into the top 10. The manager also stressed to us the importance of the BBC as an early adopter of Ms Triana’s music.
• Shaun Escoffery’s record label told us that: “… [the BBC] acts as a door opener, providing a crucial platform and exposure which will allow Shaun to move on significantly with bigger label partners and investors. The key thing is that [Shaun’s] profile is such that he now has a platform to continue to increase revenues at an ever increasing rate as in [the music industry] it’s all about profile.” Each of Shaun Escoffery’s singles has been ‘A Listed’ by BBC Radio 2 and the BBC has also provided the platform for a number of live performances which have had a positive impact on his music sales. For example, on the day he performed at Radio 2 Live in Hyde Park in September 2015 his album sales increased by 12,890% and during the week sales increased by 722%.
In addition to providing music related radio, TV and online services, the BBC organises a wide range of live music events which also generate contributions to the UK economy both in terms of employment and GVA. There will also be a range of spillover effects including wider business impacts in the local area through attendance, and music industry revenues generated as a result of the relationship between artist exposure (supported though the live performance at the event) and revenues.
Although quantifying these impacts was not within the scope of this study we note that an existing study suggests that Radio 1’s Big Weekend in Glasgow contributed £3.7 million to local economy, with a further £10 million in press and marketing value.

8
2 About the study
The constitutional basis for the British Broadcasting Corporation (‘BBC’) is the Royal Charter, with the existing Charter running until 31 December 2016. As the end of the current Charter period is approaching, the UK Government has begun a consultation and review of the framework under which the BBC operates. As part of this, the Department for Culture, Media and Sport (‘DCMS’) recently published the BBC Charter Review25; a public consultation seeking views. The findings of the consultation and review will inform the UK Government´s future decisions about the BBC.
One of the areas under review is the scale and scope of the BBC. The existing Charter sets out the broad public purposes of the BBC and the main activities it should engage in (providing information, education and entertainment output through TV, radio and online services). However, although this sets the framework for what the BBC should be seeking to achieve, the Charter does not specify either the volumes or types of outputs/services that the BBC should provide.
In considering the scale and scope of the BBC, DCMS is focussing on three areas:
• what the BBC does and how it does it;
• the audiences it serves; and
• the role played by the BBC within the wider media and creative sector.
One of the consultation questions DCMS has posed in relation to this is:
Where does the evidence suggest the BBC has a positive or negative wider impact on the market?
In order to provide further evidence to address this consultation question, the BBC Trust commissioned KPMG to conduct independent analysis of the economic contribution of the BBC. Although the BBC as a whole will have an economic impact across the UK, and potentially more widely through its international reach, our analysis focusses on the economic impact in particular areas of the UK and in certain markets.
Our analysis focusses on the economic impact of the BBC in the following specific areas:
• the North West of England (linked to the BBC’s move to Salford);
• the online market; and
• the UK music industry.
DCMS notes that it has been suggested that there are a range of positive effects that the BBC can have on the wider market. These include:
• the impact the BBC has on raising broadcasting standards; and
• the positive effects for the creative industries and commercial parties from the spending on its staff, training and content.
Conversely, it is also hypothesised by the DCMS that there may also be some negative effects of the BBC’s broadcasting and internet activities, for example in terms of the ability of other providers to
25 Department for Culture, Media and Sport, BBC Charter Review, Public Consultation, 2015
2

9
compete and potential “crowding out” effects that may arise from BBC activity. A second KPMG study commissioned by the BBC Trust, An economic review of the extent to which the BBC crowds out private sector activity26, focusses on these potential crowding out effects.
Our analysis draws on a range of data, information and wider evidence gathered from the BBC and external sources. We assess the direct economic contributions made by the BBC in the areas listed above, in addition to indirect, induced and wider spillover effects. Our analysis is in gross terms. We have not assessed the net contribution of the BBC in each of the areas analysed. Therefore, we do take into account how UK resources used by the BBC, for example human capital and physical capital, would have been employed if they weren’t employed by the BBC.
In the next section of the report, we set out the overarching economic framework for assessing the BBC’s economic contribution before assessing in turn each area within the scope of our analysis.
26 KPMG, An economic review of the extent to which the BBC crowds out private sector activity, October 2015

10
3 The economic framework for assessing the BBC’s market impact
The British Broadcasting Company was formed on 18 October 1922 by a group of leading wireless manufacturers, and daily radio broadcasting began just under a month later, sharing news, music drama and 'talks' across the nation.
In January 1927, the British Broadcasting Corporation was established by Royal Charter.
By 1929, John Logie Baird broadcast some of his first experimental television broadcasts using BBC frequencies. With continued BBC investment and development, the BBC was the first broadcaster in the world to begin a regularly scheduled TV service, in 1936.
The developments brought about by the BBC have continued to the present day.
From BBC engineers inventing the first means of recording live TV in the 1940s, to the first video tape machine to be used in transmission27, to the first teletext service in the world (CEEFAX), the provision by BBC Research and Development of much of the technology and systems to make DAB happen and more recently the development and provision of new services, such as Red Button, Connected Red Button and the BBC iPlayer, the BBC has made a significant impact in the broadcasting, media and digital markets.28
All this activity has contributed, and continues to contribute, to the UK economy, and indeed more widely, through a range of channels.
Gross Value Added (GVA)
The first measure of economic contribution we consider when conducting an economic assessment of the BBC’s contribution to the UK economy, is its Gross Value Added (GVA) contribution. This measures the contribution to the economy of an individual producer, industry or sector, net of intermediate consumption (for example goods and services that are used in the production process). It is a measure of the economic value of goods and services produced.29
Through their own activities organisations add GVA to the UK economy – the direct GVA contribution. The BBC is different to a normal company, however, in that only a part of it is a commercial trading operation, namely BBC Worldwide, BBC Global News and BBC Studios and Post Production (BBC S&PP). Through these three commercial subsidiaries, it seeks to exploit licence fee-funded content and infrastructure to supplement its income to cover its overall expenditure and reduce the financial cost to the licence fee payer. Its Public Sector Broadcast (PSB) Group is not designed to be a revenue generating entity.
However, through its activities the BBC generates wider economic activity across the UK through its supply chain. This is not only the suppliers that directly facilitate its operation, such as communication network operators and utilities providers but also content, technology and publishing
27 VERA (Vision Electronic Recording Apparatus)
28 http://www.bbc.co.uk/timelines/zsgv34j
29 GVA is a key component of gross domestic product (GDP) which is a measure of the value of production and is a key indicator of the state of the economy. GVA is used in the estimation of GDP, by aggregating GVA across all industries and sectors in the economy and adjusting for taxes and subsidies at the whole economy level.
3
11
providers where the BBC sources this externally, such as through Independents. Each of these suppliers to the BBC has its own suppliers, and so the economic activity perpetuates across the economy. This activity through the whole supply chain is the indirect GVA generated by the BBC.
Induced GVA is also generated in the economy as a result of the BBC’s activities. These contributions arise from the additional economic activity generated by the BBC’s direct and indirect employees spending a proportion of their wages in the UK economy. We assess these impacts in the context of our analysis of the BBC’s activities in the North West of England.
The BBC also generates economic activity outside of the UK, for example through international elements of the supply chain but these are ‘leakages’ from the UK economy which do not generate domestic benefits.
Employment and skills
GVA is not the only measure of economic contribution. Another measure is the employment generated by a company’s operations. The creation and safeguarding of workforce jobs is particularly important when there is underemployment in the economy.
The BBC employs numerous staff itself – currently just under 20,500 in total across the UK30. This is the direct employment impact.
And similar to the indirect GVA contributions, the additional economic activity the BBC generates in its UK supply chain, for its direct (Tier 1) suppliers and in the wider supply chains also results in additional domestic employment – the indirect employment impacts.
Induced employment is also generated by the additional economic activity resulting from the BBC’s direct and indirect employees spending of a proportion of their earnings.
The contribution of employment to the UK economy depends on the level of productivity; the intensity of labour required for one unit of output. In general, higher skilled jobs are more productive, meaning each job makes a greater contribution to the economy.
Through developing the skills and experience of its employees the BBC seeks to raise the productivity of its employees and so adds additional value to the UK economy.
Economic growth theory suggests that the accumulation of human capital can have a positive impact on an economy’s growth if higher skills development and training goes hand-in-hand with more intensive research and development (R&D) and technological progress. Human capital relates to acquired capabilities through education, training and experience. It refers to the transition and use of available knowledge but is also important in the production of new knowledge, a source of innovation that ‘propels all factors of production’.31
Empirical evidence suggests that economies with the highest level of investment in scientific and technical knowledge, as well as education and training of the labour force are those that achieve sustainable positive growth rates. In Bacovic’s review of the literature32, he quotes Dias and McDermott who state that the decision on human capital accumulation is the key to fostering
30 This relates to the Public Service Broadcasting arm of the BBC only and not BBC Worldwide
31 Mincer, J., Human Capital and Economic Growth, NBER, November 1981
32 Bacovic, M and Lipovina-Bozovic, M., Knowledge Accumulation and Economic Growth
12
technological advances. Their empirical tests show that human capital growth constitutes more than 60% of the long-run average growth rate of the economy.
Investment and innovation
Investment activity is an important determinant of economic contribution given that it is recognised as an important driver of growth.
In endogenous growth models, investment, particularly in innovation, drives technological progress and so impacts on growth. When individuals or firms accumulate new capital, they inadvertently contribute to the productivity of capital held by others. Growth can be sustained by continuing accumulation of the inputs that generate positive externalities.33
For example, a study by Schiantarelli, using polled data for a large panel of countries finds that an increase in investment leads to a higher growth rate of output per worker in the long run.34
Another study found that the greater the investment in ‘machinery, equipment and software, in internal research and development, in acquisition of external knowledge, in marketing activities and other procedures, the greater the propensity for firms to innovate in terms of services.’35. These studies show that investment is important for continuing growth and productivity.
As highlighted above, there is evidence that the BBC has been at the forefront of technological progress throughout the decades.
Investment and innovation are also often outcomes of dynamic, competitive markets, whereby firms seek to develop their offering so as to attract and retain customers (or in the case of the broadcast market, viewers and/or listeners). Competition is a recognised driver of productivity and so economic growth. It improves productivity by raising incentives to innovate and by ensuring that resources are deployed to the most efficient firms.
Indeed, one of the pillars of the Government’s approach to raising productivity is, “promoting a dynamic economy that encourages innovation and helps resources flow to their most productive use” 36. Open and competitive markets are part of a dynamic economy.
However, competition in the UK broadcast market differs somewhat to other markets due to the existence of both public and private providers who are funded differently and tend to have different objectives. Commercial channels are funded primarily by a combination of advertising and subscription revenues, their main objective being to maximise profits. PSBs such as the BBC are generally funded by a licence fee. This public funding places an obligation on the PSB to serve the public, for example by focussing on reach and diversity rather than profit37. The BBC’s current objectives include promoting education and learning and stimulating creativity and cultural excellence.38
While the question has been raised about whether the BBC might hold an unfair advantage over its competitors due to its level of public funding, and so may `crowd out´ private sector activity, KPMG’s
33 Grossman, G. M. and Helpman, E., Endogenous Innovation in the theory of Growth, NBER, November 1994
34 Bond, S., Leblebicioglu, A. and Schiantarelli, F., Capital Accumulation and Growth: A New Look at the Empirical Evidence, Boston College and IZA, July 2007
35 Silvia, M. J. M., Simoes, J. Moreira, J and Sousa, G. , Investment and Expenditure on Innovation Activities and Innovative Capability: Empirical Evidence from Portuguese Services Firms and KIBS, International Business Research, February 2012
36 HM Treasury, Fixing the Foundations: Creating a more prosperous nation, July 2015
37 Picard, R., Sicilian, P., Is there still a place for Public Service Television?, September 2013
38 http://www.bbc.co.uk/bbctrust/governance/tools_we_use/public_purposes.html

13
study39 suggests that there is little evidence that BBC spending has crowded out commercial broadcasters’ spending.
Wider spillover effects
There are also wider spillover effects arising from the BBC’s activity. These can include the positive externalities arising from: knowledge and skills development and transfer; network and agglomeration effects; and market expansion and development (for example, through technology and innovation transfers).
By nature, these economic spillover effects are much more difficult to quantify than the direct and indirect economic contributions. Nonetheless, the scale and scope of impacts can be significant both within the industry itself, in the broader sector and related industries, and across the wider economy.
We apply this overarching economic framework for assessing the economic contribution of the BBC to the three specific areas we are considering within the scope of this study: the contribution in the North West of England; in the online market; and in the music industry.
While the various channels of economic contribution cannot be quantified in all of these areas, we draw on the available evidence to explain the potential scale and scope of impact based on both a qualitative and, where feasible, quantitative assessment.
39 KPMG, An economic review of the extent to which the BBC crowds out private sector activity, October 2015

14
4 The economic impact of the BBC in the North West of England
4.1 Introduction The BBC has operations across the UK, reflecting its role as the national public broadcaster, with its purpose remits including representing and catering for the different nations, regions and communities of the UK.
Historically, however, the BBC had a predominantly London focus in terms of the location of its activities. This is demonstrated in the 2008/09 economic impact study commissioned by the BBC which estimated that around 71% of the BBC’s expenditure and 69% of the BBC’s UK GVA was generated in London40.
This changed in 2011 with the relocation of significant parts of its activities to Salford, in the North West of England. The BBC’s economic impact outside of the South East has grown materially.
For the purposes of this study, we have focussed on this increase in activity in the North West and the role the BBC has played in the establishment of the digital and creative hub in Salford. Specifically, our analysis focuses on quantifying the economic impact of the BBC’s activities in this region. However, we recognise that this is only part of the picture of the wider impact the BBC as a whole has across the UK.
Rebalancing the economy both across sectors and geographically remains a key priority for the Government. Indeed, the March 2015 Budget specifically states that: “This government is committed to rebalancing growth across the regions and nations of the UK and is committed to the creation of a Northern Powerhouse.”41
4.2 The BBC’s North West operations and the Salford move The North West is now home to a range of the BBC’s operations, with the Salford site being the location of BBC North’s headquarters, and other functions which were re-located from London and the previously existing BBC site in Manchester. The functions in Salford include: Sport; Radio 5 Live; Children’s; Learning; and BBC Breakfast, as well as parts of Marketing and Audiences and the BBC Academy. Other departments that also now operate out of the BBC’s site in Salford include: Religion and Ethics; Regional and Local news; the Philharmonic Orchestra; and technical operations and broadcasting staff. BBC Children in Need HQ staff also moved to Salford earlier this year, as well as a number of individuals in digital and technology roles.
In addition to the Salford site, the BBC has wider operations in the North West, including BBC Radio Merseyside and BBC Radio Lancashire.
The figure below outlines the scale and scope of activity in the region.
40 Deloitte, The Economic Impact of the BBC: 2008/09, Table 6. It should be noted that the GVA and expenditure proportions are based on the data provided in Table 6 of the Deloitte report. We note that these figures do not align with the Deloitte text preceding Table 6, which suggests that London accounts for 74% of BBC GVA. We have not verified the accuracy of the data or analysis included in the Deloitte report.
41 HM Treasury, Budget 2015, March 2015, paragraph 1.20
4

15
Figure 1: Overview of BBC locations and functions in the North West of England
The current level of activity in the North West region presents a very different picture to 5 years ago, before the Salford site opened in 2011 and before completion of the first phase of the BBC’s move in 2012.
The commitment to move significant parts of the BBC’s activities outside of London was made much earlier than the 2011 move date. The timeline below outlines the key dates associated with the BBC’s move. The BBC’s move to Salford also sparked the beginning of the re-development of Salford Quays - formerly a derelict port – and gave the impetus for the development of MediaCityUK which is now home to the BBC, ITV, the University of Salford and more than 80 commercial

16
businesses42. The area also features one of the biggest HD studio complexes in Europe, as well as commercial offices, apartments, a hotel and a public piazza.
Figure 2: Timeline of the BBC’s relocation to Salford
The primary objectives of the move to Salford were not solely economic ones, but also centred around:
• better serving audiences in the North;
• improving the quality of content for audiences across the UK; and
• improving efficiency using new technology and new ways of working.
It was also recognised that an important objective was to provide economic and other benefits including up to 15,000 jobs within the region43. It was hoped when the development was announced that it would attract new and growing businesses, regenerate the local economy and provide a media hub that was able to benefit from network and spillover effects.
We explore the economic impacts of the BBC’s operations in the North West in the remainder of this section.
42 http://www.thequays.org.uk/about/partners/mediacityuk/
43 National Audit Office, The BBC’s move to Salford, April 2013

17
4.3 Contributing to the UK’s GVA As explained in Section 3, a mechanism through which the BBC contributes to the economy is through the GVA its activity generates. Our GVA analysis for the BBC focuses on the indirect GVA contributions made through the supply chain since the BBC’s PSB Group itself is a non-commercial organisation. Our analysis is in gross terms. We have not assessed the net contribution of the BBC’s activities in the North West to the UK economy44.
The indirect GVA generated from the BBC’s activity in the North West relates to the GVA generated by suppliers supporting the activity in that region (i.e. the BBC’s public service broadcasting activity that originates in the North West). This activity spans a range of BBC services including TV, radio, online and wider activity such as that of the BBC Philharmonic Orchestra that is based in Salford.
Given the complexities of the BBC’s financial reporting systems expenditure data had to be collated from across these different BBC divisions. While the whole activity of some departments, such as Children’s, is located in the North West, other divisions such as TV, Radio and Digital have activity spanning the UK. Therefore, each department’s overall expenditure was assigned across the different regions to reflect the activity in each. The BBC had recently conducted this financial analysis and provided us with the relevant expenditure data for the North West for the purposes of our analysis.
The expenditure associated with the BBC’s activity in the North West is predominantly driven by activity taking place at the Salford site in MediaCityUK. We understand from the BBC that this accounts for the majority of BBC activity not only in the North West but more widely in the North. Given the financial data available from the BBC, however, it is not possible to isolate the expenditure associated specifically with the BBC site in Salford45.
Overall BBC expenditure associated with its activity in the North West in FY2014/15 was approximately £369 million. The breakdown of this expenditure is shown in the Table below.
Table 1: Breakdown of BBC expenditure linked to its activities in the North West, FY2014/15
Expenditure Categories North West Expenditure
Content & Programming £352,635,200
In-house £286,669,335
Indie £61,703,462
Other £4,262,404
Infrastructure/support £16,458,854
Total £369,094,054
Source: BBC Data
44 The analysis, therefore, does not take into account how UK resources used by the BBC, for example human capital and physical capital, would have been employed if they weren’t employed by the BBC.
45 We understand that the BBC management and financial accounts capture activity on a functional basis, rather than geographical basis. Expenditure data relating to the use of the Licence fee is captured and reported for Television, Radio, BBC Online, Orchestras and performing groups, S4C, Development spend, and BBC World Service. While BBC North reports financials individually, this represents only a subset of the activity that takes place in Salford, with other activity in Salford spanning the different areas.

18
These expenditure figures include both spending with suppliers and the payroll costs associated with BBC activity in the North West. To estimate the indirect GVA impacts, payroll must be deducted to isolate the level of spending with suppliers supporting activity in the North West of England.
Based on employee remuneration data for BBC sites in the North West we estimate that payroll costs for this region were approximately £125 million in FY2014/1546.
This suggests that the BBC spent approximately £244 million with suppliers supporting BBC activity in the North West, all of which will have generated indirect GVA contributions.
To estimate the BBC’s indirect GVA contribution associated with North West expenditure we undertook a dual approach in our analysis, using both analysis of pan-BBC supplier data and applying sector specific ‘Type I’ economic multipliers47 available from the Office of National Statistics (ONS).
The first stage of our analysis of indirect effects estimates the GVA contribution of the BBC’s Tier 1 suppliers48.
The BBC provided us with extensive supplier data relating to its pan-BBC supplier spending in FY2013/14. These data included details of the Standard Industry Classification (SIC) code for each of the suppliers, as provided by Dun and Bradstreet. The data had been cleaned and enhanced as part of an earlier study for the BBC assessing the economic contribution it makes to the creative industries49, for example to fill gaps in the SIC codes, remove the data for suppliers where SIC codes could not be identified and to reclassify suppliers where the SIC code identified them as in a non-creative industry as a result of the SIC code not accurately representing the types of goods/services provided to the BBC by the supplier50.
Based on this dataset, we identified the proportions of pan-BBC supplier spending in each of the industry groupings. This is summarised in the Table below.
46 The BBC was unable to provide payroll costs associated with the BBC activity in the North West on the same basis that the expenditure data was provided. However, we were provided with payroll data for the employees based at BBC sites in the North West. Although there may be some staff costs associated with employees who undertake some activity in the North West for whom this is not their main BBC site, we consider the payroll costs for North West based employees to be a reasonable proxy for the staff costs associated with the activity in the region. Any overestimation of the North West payroll costs reduces the estimated supplier spending and so has a downward impact on the GVA estimates, making them conservative. Conversely, if the payroll costs are underestimated, this leads to an upward bias on the GVA estimates. We have no evidence of the potential direction of the effect.
47 Type I economic multipliers include indirect effects but not induced effects
48 Tier 1 suppliers are those companies which are direct suppliers to the company that produces the finished product (in this case direct suppliers to the BBC)
49 Frontier, The contribution of the BBC to the UK creative industries: A report prepared for the BBC, April 2015
50 Further details are provided in Annex 1 of the Frontier report
Tier 1 supplier GVA = Supplier contract value x sector average GVA as proportion of output
19
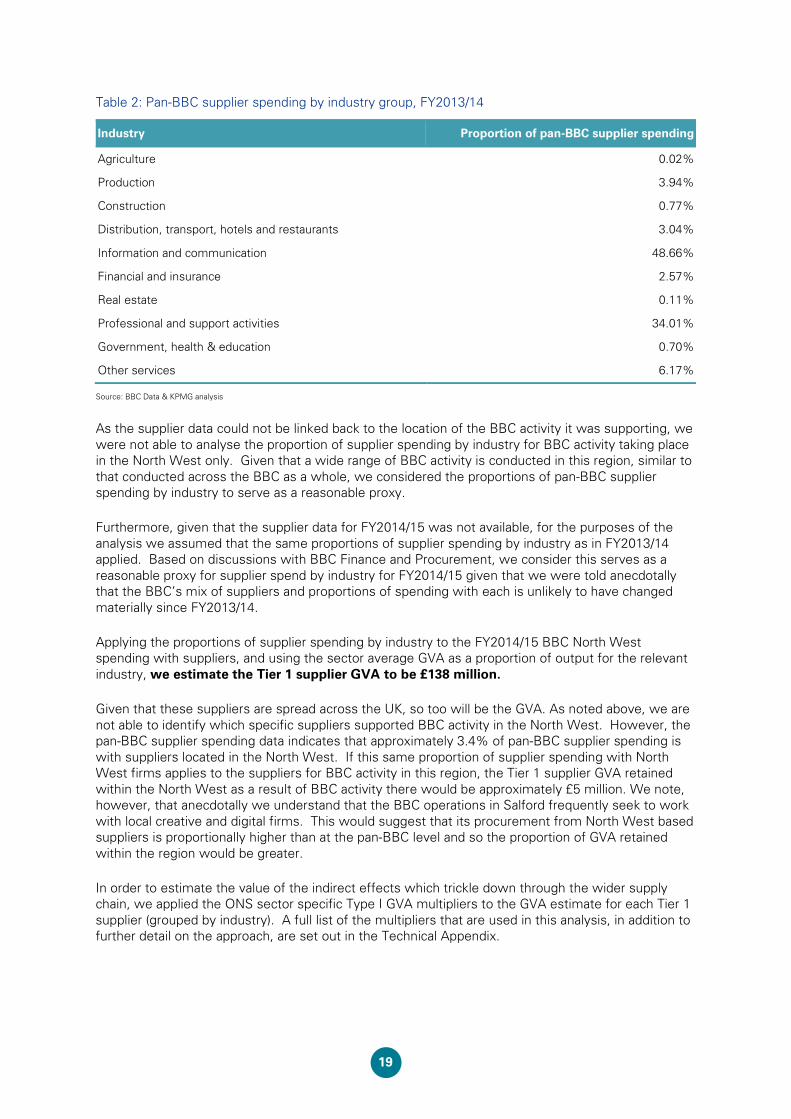
Table 2: Pan-BBC supplier spending by industry group, FY2013/14
Industry Proportion of pan-BBC supplier spending
Agriculture 0.02%
Production 3.94%
Construction 0.77%
Distribution, transport, hotels and restaurants 3.04%
Information and communication 48.66%
Financial and insurance 2.57%
Real estate 0.11%
Professional and support activities 34.01%
Government, health & education 0.70%
Other services 6.17%
Source: BBC Data & KPMG analysis
As the supplier data could not be linked back to the location of the BBC activity it was supporting, we were not able to analyse the proportion of supplier spending by industry for BBC activity taking place in the North West only. Given that a wide range of BBC activity is conducted in this region, similar to that conducted across the BBC as a whole, we considered the proportions of pan-BBC supplier spending by industry to serve as a reasonable proxy.
Furthermore, given that the supplier data for FY2014/15 was not available, for the purposes of the analysis we assumed that the same proportions of supplier spending by industry as in FY2013/14 applied. Based on discussions with BBC Finance and Procurement, we consider this serves as a reasonable proxy for supplier spend by industry for FY2014/15 given that we were told anecdotally that the BBC’s mix of suppliers and proportions of spending with each is unlikely to have changed materially since FY2013/14.
Applying the proportions of supplier spending by industry to the FY2014/15 BBC North West spending with suppliers, and using the sector average GVA as a proportion of output for the relevant industry, we estimate the Tier 1 supplier GVA to be £138 million.
Given that these suppliers are spread across the UK, so too will be the GVA. As noted above, we are not able to identify which specific suppliers supported BBC activity in the North West. However, the pan-BBC supplier spending data indicates that approximately 3.4% of pan-BBC supplier spending is with suppliers located in the North West. If this same proportion of supplier spending with North West firms applies to the suppliers for BBC activity in this region, the Tier 1 supplier GVA retained within the North West as a result of BBC activity there would be approximately £5 million. We note, however, that anecdotally we understand that the BBC operations in Salford frequently seek to work with local creative and digital firms. This would suggest that its procurement from North West based suppliers is proportionally higher than at the pan-BBC level and so the proportion of GVA retained within the region would be greater.
In order to estimate the value of the indirect effects which trickle down through the wider supply chain, we applied the ONS sector specific Type I GVA multipliers to the GVA estimate for each Tier 1 supplier (grouped by industry). A full list of the multipliers that are used in this analysis, in addition to further detail on the approach, are set out in the Technical Appendix.

20
Using this approach, we estimate that in FY2014/15 the wider supply chain GVA associated with the BBC’s expenditure associated with its activities in the North West was £80 million.
This takes the total indirect GVA contribution linked to BBC expenditure associated with its activities in the North West to £217million.
Similar to the Tier 1 supplier GVA, although the BBC supplier expenditure is linked to BBC activity in the North West, as the wider supply chains will be spread across the UK, reaching beyond the North West region, the GVA benefits will also be spread across the UK. A proportion of the wider supply chain expenditure is likely to be retained within the region however – adding to the positive economic impact that the BBC has on the local North West economy.
The economic contributions arising from the BBC’s activity in the North West of England are particularly important in the context of the broader economic performance of the area. As shown in the Figure below the GVA per capita of the North West region and the Greater Manchester area has lagged behind the overall performance of the UK, and forecasts suggest that this will continue.
Figure 3: GVA per capita for Greater Manchester, the North West and UK, 2000-2020
Source: ONS Regional Gross value added, 2013 data set
Through any increases in spending with suppliers located in the region, this has positive impacts on the overall level of GVA of the area.
BBC financial data suggests that pan-BBC expenditure relating to its activity taking place in the North West has increased 139% between FY2011/12 and FY2014/15.
4.4 Generating employment and developing skills
4.4.1 Impacts from the BBC’s direct employment in the North West
When the BBC opened its new site in Salford Quays, there were initially 2,000 job openings at the site. Approximately a third of these were filled by BBC employees moving from London, a third were moved from the BBC operations located at Oxford Road in Manchester and a third were newly hired into the BBC, making this one of the BBC’s largest recruitment drives in the corporation’s history. Half of these new posts were filled by people living in the North West.
0
5000
10000
15000
20000
25000
30000
2000
2001
2002
2003
2004
2005
2006
2007
2008
2009
2010
2011
2012
2013
2014
2015
2016
2017
2018
2019
2020
GV
A p
er c
apita
Greater Manchester North West UK
Wider supply chain GVA = Tier 1 supplier GVA x (1 - sector specific Type I GVA multiplier)

21
As of March 2015, there were over 2,500 Full Time Equivalent (FTE) employees based at the BBC’s Salford site (over 2,600 employees in headcount terms). BBC employees in Salford account for approximately 80% of the BBC’s employment in the North of England and 13% of the BBC’s total employment in the UK
These BBC employees account for approximately 2% of total employment in Salford and approximately 40% of creative industry employment in Salford.51
Additionally, there are a further 116 FTE BBC employees based at the other BBC sites in the North West.
Now over half of the BBC’s staff work outside of London.
The majority of staff employed in Salford also live within the Greater Manchester region. Approximately 59% of these employees live within Greater Manchester and 82% live in the North West region. This adds to the overall prosperity of the area.
Figure 4: Home postcode for BBC employees in Salford52
Source: KPMG analysis of BBC data
51 Total employment in Salford and creative industries employment in Salford figures sourced from Oxford Economics, Greater Manchester Forecasting Model, 2014
52 This analysis is based on the data capturing the residential base of Salford employees. However, we note that this will not reflect the staff based in Salford that have more than one property, including one in Salford/Greater Manchester. It is unclear how many staff this may affect.

22
While a number of BBC employees relocated to Salford following the BBC’s move there (as noted above, approximately a third of the initial posts were filled by London staff), at the macroeconomic level this is very unlikely to have impacted materially the London economy. The corresponding improvement to the Salford and North West economy as a result of additional economic activity there following the BBC’s move is likely to have outweighed any negative economic impacts in London.
4.4.2 Indirect employment impacts through the BBC in the North West’s spending with suppliers
The BBC has wider employment effects arising from its activity in the region through its purchases from suppliers.
As noted above, the BBC spent approximately £244 million in FY2014/15 with suppliers linked to BBC activity in the North West. This expenditure itself creates additional employment – the indirect employment arising from the BBC’s purchasing.
We have estimated the indirect employment effect using a dual approach of using the Tier 1 supplier GVA estimates (as calculated above) with ONS employment data to generate GVA per employee figures, and applying sector specific ‘Type I’ employment multipliers available from the ONS.
The first stage of our analysis of indirect employment estimates the employment contribution of the Tier 1 suppliers to BBC activity in the North West53.
On this basis, we estimate the Tier 1 supplier BBC indirect employment to be 1,901. While these suppliers will be spread across the UK, a proportion of them are located in the North West, so the BBC’s spending with them contributes to additional employment generated within the region.
Similar to the Tier 1 supplier GVA, the indirect employment effects trickle down through the wider supply chain. We estimate these impacts by applying the ONS sector specific Type I employment multipliers to the indirect employment estimate for each Tier 1 supplier (grouped by industry). A full list of the employment multipliers that are used in this analysis, in addition to further detail on the approach, are set out in the Technical Appendix.
Based on this approach, we estimate that in FY2014/15 the wider supply chain indirect employment associated with the BBC’s expenditure linked to its activity in the North West was 1,196. Again this employment will be spread across the UK given that supply chains are likely to span across the UK.
This takes the total indirect employment contribution linked to the BBC’s expenditure associated with its activity in the North West to 3,097.
53 Tier 1 suppliers are those companies which are direct suppliers to the company that produces the finished product (in this case direct suppliers to the BBC)
Tier 1 supplier employment linked to BBC activity = Tier 1 supplier GVA x sector average GVA per employee (FTE)
Wider supply chain indirect employment = Tier 1 supplier indirect employment x (1 - sector specific Type I employment multiplier)

23
4.4.3 Induced GVA and employment impacts arising from the employment associated with the BBC’s activity in the North West
As a result of the earnings of the BBC’s employees there are induced economic impacts. These impacts arise from the additional economic activity generated throughout the economy as a result of the spending linked to these employees’ earnings. While there will be some degree of leakage of this spending outside of the region and a smaller proportion outside of the UK, a sizeable proportion of this is likely to directly impact locally, linked to spending on housing, leisure and retail, for example.
The indirect employment through the BBC’s supply chain also leads to induced economic impacts. Multiplier effects arise through the spending of indirect employees, resulting in additional economic activity and higher contributions to the UK economy.
Our approach to estimating the induced economic impacts is set out in the Technical Appendix.
We estimate that the induced GVA arising from the BBC’s employment in the North West and the employment through the supply chain linked to its activity in the region was £59 million in FY2014/15.
This takes the total GVA contribution arising from the BBC’s activities in the North West to £277 million in the last full financial year.
This total GVA contribution is equivalent to approximately 5% of the GVA of Salford, 2% of the GVA of Manchester54 and 6% of the GVA of the UK’s programming and broadcasting activities sector55.
There are also induced employment effects arising from the spending of employees of the BBC in the North West and the indirect employees in the supply chain. We estimate that this induced employment was 681 in FY2014/15.
This takes the total employment contribution arising from the BBC’s activities in the North West to 3,778.
4.4.4 Skills generation and knowledge transfer
As outlined in Section 3, it is not only employment in and of itself that generates positive economic effects, but also the skill level of those roles. In general higher skilled jobs are more productive and so generate a greater economic contribution.
Historically, skills levels in Salford have fallen behind the UK overall. In 2009, Salford had a higher proportion of 16 to 64 year olds with no qualifications than in the rest of the UK and in the North West as a whole.
As shown in the Figure below, however, this position has now changed, with the proportion of working age individuals in Salford with no qualifications now broadly in line with the average across the UK. This is not to say that there is not more to be done. There are still differentials in terms of the proportions of individuals with NVQ Level 3 qualifications and above. However, there has been marked progress in this area, which has coincided with the arrival of the BBC in the area.
54 GVA of Salford and of Manchester sourced from Oxford Economics, Greater Manchester Forecasting Model, 2014
55 GVA of the UK’s programming and broadcasting activities sector sourced from ONS (2015) Annual Business Survey, 2013 Revised Results

24
Figure 5: Qualification levels of 16-64 year olds in Salford, the North West and Great Britain, 2009 and 2014
Source: ONS Annual Population survey 2015
The BBC’s move to Salford has allowed it to create a significant number of skilled roles in the area – both within the BBC and indirectly through expenditure with local suppliers. Given the scale and scope of BBC activity in Salford and the North West region more widely, this requires individuals with a range of skills and backgrounds, from journalists, content developers, engineers and technology experts, to production staff, designers and presenters.
The breakdown of roles at the BBC in Salford by type are shown in the Figure below.
Figure 6: Proportion of BBC employees in Salford by role, FY2014/15
Source: BBC data
The majority of BBC staff based in Salford are employed in journalism, production management and technical and digital roles (80%). These are skilled and specialised roles.
To further enhance the skills level of its employees, the BBC invests in developing its staff, for example through formal training. Investments made in enhancing human capital, for example through
15% 14% 12% 10% 11% 9%
17% 14% 14% 13% 12% 12%
17% 18% 16% 17% 19% 17%
19% 20% 19% 21% 22%21%
23% 27% 30% 30% 31% 36%
9% 8% 9% 8% 6% 6%
0%
10%
20%
30%
40%
50%
60%
70%
80%
90%
100%
Salford North West Great Britain Salford North West Great Britain
2009 2014
Per
cent
age
of 1
6-64
yea
r old
s
No qualifications NVQ1 NVQ2 NVQ3 NVQ4+ Other qualifications
Journalism22%
Digital and Technical27%
Production Management31%
Other support functions20%
25
supporting skill development and knowledge building and sharing, can also have positive economic impacts.
In 2014/15, the BBC as a whole spent £41.1 million on HR and training56.
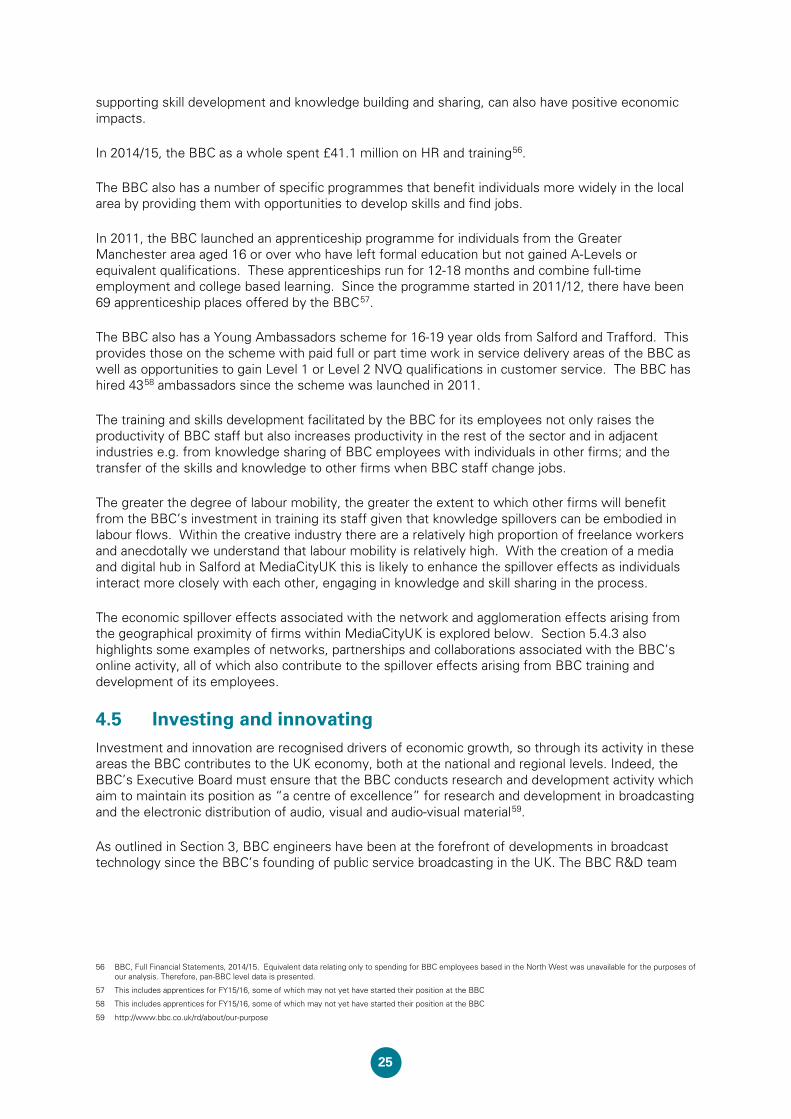
The BBC also has a number of specific programmes that benefit individuals more widely in the local area by providing them with opportunities to develop skills and find jobs.
In 2011, the BBC launched an apprenticeship programme for individuals from the Greater Manchester area aged 16 or over who have left formal education but not gained A-Levels or equivalent qualifications. These apprenticeships run for 12-18 months and combine full-time employment and college based learning. Since the programme started in 2011/12, there have been 69 apprenticeship places offered by the BBC57.
The BBC also has a Young Ambassadors scheme for 16-19 year olds from Salford and Trafford. This provides those on the scheme with paid full or part time work in service delivery areas of the BBC as well as opportunities to gain Level 1 or Level 2 NVQ qualifications in customer service. The BBC has hired 4358 ambassadors since the scheme was launched in 2011.
The training and skills development facilitated by the BBC for its employees not only raises the productivity of BBC staff but also increases productivity in the rest of the sector and in adjacent industries e.g. from knowledge sharing of BBC employees with individuals in other firms; and the transfer of the skills and knowledge to other firms when BBC staff change jobs.
The greater the degree of labour mobility, the greater the extent to which other firms will benefit from the BBC’s investment in training its staff given that knowledge spillovers can be embodied in labour flows. Within the creative industry there are a relatively high proportion of freelance workers and anecdotally we understand that labour mobility is relatively high. With the creation of a media and digital hub in Salford at MediaCityUK this is likely to enhance the spillover effects as individuals interact more closely with each other, engaging in knowledge and skill sharing in the process.
The economic spillover effects associated with the network and agglomeration effects arising from the geographical proximity of firms within MediaCityUK is explored below. Section 5.4.3 also highlights some examples of networks, partnerships and collaborations associated with the BBC’s online activity, all of which also contribute to the spillover effects arising from BBC training and development of its employees.
4.5 Investing and innovating Investment and innovation are recognised drivers of economic growth, so through its activity in these areas the BBC contributes to the UK economy, both at the national and regional levels. Indeed, the BBC’s Executive Board must ensure that the BBC conducts research and development activity which aim to maintain its position as “a centre of excellence” for research and development in broadcasting and the electronic distribution of audio, visual and audio-visual material59.
As outlined in Section 3, BBC engineers have been at the forefront of developments in broadcast technology since the BBC’s founding of public service broadcasting in the UK. The BBC R&D team
56 BBC, Full Financial Statements, 2014/15. Equivalent data relating only to spending for BBC employees based in the North West was unavailable for the purposes of our analysis. Therefore, pan-BBC level data is presented.
57 This includes apprentices for FY15/16, some of which may not yet have started their position at the BBC
58 This includes apprentices for FY15/16, some of which may not yet have started their position at the BBC
59 http://www.bbc.co.uk/rd/about/our-purpose

26
currently has over 100 employees working in two research labs based in the North West and South of the UK. The team looks to collaborate with others including universities, businesses and other broadcasters to help develop industry standards and develop next-generation standards60.
A large number of BBC innovations relate to the digital and online market. Specific examples of these, and an explanation of how they benefit the economy, are outlined in Section 5 below. A number of these examples stem from the BBC R&D team based in Salford, thereby increasing the economic contribution made by the BBC linked to its activity in the region.
More widely, as a result of the development of the site in Salford, the BBC contributed significantly to investment in the local area. As part of the move, the BBC Trust approved a lifelong budget for moving to Salford of £942 million61. This included the significant investment required for technology installation - spending of £87.9 million62 as of December 2012 - including:
• Information Technology for news, radio and offices: the largest part of the technology installation; and
• studio, presentation and broadcast equipment: managed in-house rather than outsourced to Peel Media Ltd as had originally been planned.
The design and fit-out of the buildings involved a further £41 million of investment63.
And this is only the investment incurred by the BBC in developing its Salford site.
In developing MediaCityUK, spurred on by the BBC decision to locate there, there has been much greater investment in the area. As we go on to explain below, MediaCityUK in Salford is establishing itself as a hub for creative and digital firms. Evidence suggests that The Peel Group (part of the Joint Venture that owns MediaCityUK) has invested approximately £650 million in MediaCityUK to date64. And given that a wide range of other companies and institutions, including ITV and the University of Salford, have now based themselves on the site, they too are likely to have made significant investments as part of their moves. For example, the ITV Annual Report 201365 states that it has £3 million of capital commitments at 31 December 2013 which primarily relate to the development at MediaCityUK, including the new location for Coronation Street.
4.6 Creating network and agglomeration spillover effects Broader economic spillover effects can arise through the agglomeration effects of firms in the same or complementary industries locating in close proximity to each other in order to benefit from the increase in productivity this creates.
As noted by NESTA, “Many of the mechanisms for the knowledge and network spillovers…- such as commercial relationships and collaborations and labour flows across sectors- are more likely to take place between firms that are located close to each other.”66
MediaCityUK in Salford is establishing itself as a hub for firms with creative and digital capabilities and so is benefitting from these network and knowledge spillover effects, stemming from the BBC’s
60 http://www.bbc.co.uk/rd/about/our-purpose
61 National Audit Office, The BBC’s move to Salford, April 2013
62 This is the revised budget agreed in February 2011 and represents the approved budgeted lifetime cash cost, including operating costs, up to 2030. National Audit Office, The BBC’s move to Salford, April 2013
63 National Audit Office, The BBC’s move to Salford, April 2013
64 http://www.mediacityuk.co.uk/faqs
65 ITV plc Annual Report and Accounts FY13
66 NESTA, Creative clusters and innovation: Putting creativity on the map, November 2010

27
decision to locate there initially. The BBC was the anchor tenant for the site and indeed the development of the site arose from the BBC choosing the Salford Quays development proposal67 over the competing bid from the Central Spine scheme in Manchester.
Following the development of the site, and the BBC’s relocation of a range of its activities there, it is now also home to ITV, Coronation Street, SIS LIVE, the University of Salford, dock10 and over 250 innovative businesses.
Approximately 6,500 people are now employed in MediaCityUK, around 40% of whom are BBC employees. Their interaction with other creative and digital sector workers in the area will have spillover impacts. And with further development of MediaCityUK these opportunities for interactions and knowledge and skill spillovers are likely to increase. The Tomorrow building, due to open in Summer 2016, will provide an additional 4,600 m2 of commercial office space, designed for creative and digital businesses.68
As shown in the Figure below, the number of jobs in the creative industries in Salford has more than doubled between 2010 and 2013, with a step change in the level of jobs aligned to the BBC move to Salford. Creative industry jobs are expected to continue to grow, albeit at a considerably slower pace, with forecasts suggesting that there will be an additional 1,700 creative industry jobs in Salford by 2034.
Figure 7: Creative industry jobs in Salford, Greater Manchester and the North West, 2000 - 2034
Source: Oxford Economics, Greater Manchester Forecasting Model
The creative industries now account for 5% of total employment in Salford, up from 2% in 2010. And the BBC contributes significantly toward this, with 40% of the creative industry jobs in Salford being jobs at the BBC.
The BBC’s move to Salford can be seen as what Paul Krugman69 describes as a ‘small historical accident’ which has started a path of attracting investment in creative activities. A report by
67 The Salford Quays proposal was developed by a range of public sector bodies, including the North West Regional Development Agency, Central Salford urban regeneration Company and Salford City Council, with the site owners and developers, Peel Group
68 http://www.mediacityuk.co.uk/vision-and-history
69 Krugman, P., The Increasing Returns Revolution in Trade and Geography, December 2008
0
10
20
30
40
50
60
70
80
90
2000
2001
2002
2003
2004
2005
2006
2007
2008
2009
2010
2011
2012
2013
2014
2015
2016
2017
2018
2019
2020
2021
2022
2023
2024
2025
2026
2027
2028
2029
2030
2031
2032
2033
2034
Jobs
(tho
usan
ds)
Salford Greater Manchester North West

28
CLUSNET70 identified creative/ digital/ new media as a strategically important accelerator cluster in the Manchester economy.
More broadly, MediaCityUK and the BBC have become an integral part of the wider Tech North strategy, launched by the government in 2010 to bring together technical industries from across the North to form an ‘internationally renowned social hub’.71 In addition to the investment in MediaCityUK, £3.5 billion has already been invested to support Manchester’s digital and technology infrastructure. 72 The cluster in the region should have the economic effect of signalling to the national and international community the scale of talent and creative and digital businesses in the North West, thereby helping to attract further inward investment into Manchester and other Northern cities.
Cluster initiatives can help relieve the risk associated with the trial and error involved with innovation. Integrated parties are able to benefit from extensive networking cooperation and spillovers, and MediaCityUK is an example of greater collaboration between firms, organisations and universities. Firms involved in clusters are likely to have a clear competitive advantage due to the network and agglomeration effects that arise. Clusters such as this are an important source of specialisation and specialist knowledge.
Networks of relationships can be seen to play an essential role in the learning process of economic agents, particularly firms, in forming of inter-firm strategic alliances and the accumulation of social capital73. They are also important in allowing for diffusion of knowledge spillovers and serve as channels for risk sharing. Their presence consequently plays an important role in the innovation process.
Similarly, agglomeration theory looks into why firms tend to cluster together in specific geographical areas. Clustering captures efficiencies generated by tight linkages between firms such as allowing new technology to be adopted and exchanged more rapidly and improving the flow of ideas74. More recently, this literature has focussed on the importance of the clustering of human capital75. Employers gain access to a large pool of specialised labour and are able to draw from concentrations of talented people who power innovation and capital growth. This rapid mobility of talent is a source of great competitive advantage.
There is strong empirical evidence that agglomeration and network effects do exist and are important for research, development and productivity. These ideas provide a theoretical basis for the wider economic spillover effects of the BBC’s move to Salford and its role in shaping the creative landscape of the North. As part of this study we also interviewed a number of businesses who have worked for, and collaborated with, the BBC and they were able to provide qualitative evidence of the effects based on their own experience. Additionally, the Creative Industries Federation ran a series of BBC Policy Seminars which also provided evidence to us in relation to the BBC’s role and relationship with the creative industries in the Salford area.
A number of key themes emerged from participating businesses:
• The BBC’s move to Salford has reduced the barriers to collaboration faced by smaller, independent digital agencies. Apadmi76 indicated that its work with the BBC has increased since
70 CLUSNET, Manchester City Region Workshop, June 2009
71 https://www.gov.uk/government/news/deputy-prime-minister-launches-technorth
72 http://www.techcityuk.com/greater-manchester/
73 Varga, A., Pantikakis, D. and Chorafakis, G., Agglomeration and Interregional network effect on European R&D productivity, University of Pè𝑐𝑐𝑐𝑐, May 2010
74 Ciccone, A., Agglomeration Effects in Europe and the USA, CREI, September 2001
75 Florida, R., Cities and the Creative Class, Carnegie Mellon University, March 2008
76 Apadmi is a Manchester based company specialising in mobile technology, creating apps and server solutions to a range of clients, including the BBC

29
its move to Salford, this includes projects which they consider that they would not have been able to do had the BBC still been based in London. For example, Apadmi has benefited from BBC engineers embedded in its engineering teams. Magnetic North77 indicated that the BBC’s move has given them greater opportunities with the BBC, which in turn delivers additional credibility to attract new clients.
• The geographic proximity to the BBC improves the quality of outputs, both on BBC projects and more generally. We were told that being located in close proximity to the BBC when working with them improves the quality of work given that it allows greater collaboration and supports better knowledge and skill sharing. This helps to raise standards, which also benefits the sector more widely.
• There are wider positive effects arising from the growth of MediaCityUK which has attracted more creative businesses to the area. This has increased the pool of companies which can collaborate together. Apadmi told us that they have collaborated with other digital businesses, which would not have come about without MediaCityUK. Equally, the growth in MediaCityUK has brought jobs and talent to the North West. A number of local businesses cited that the employees the BBC brought with it has created a greater flow of talent within the creative industries in the North, benefitting them in terms of recruitment.
4.7 Generating wider positive impacts Better serving audiences in the North was one of the BBC’s principal objectives of moving to Salford. The BBC measures this using the approval gap between its viewers in the North of England and those elsewhere in the UK. Since the move to Salford, ‘portrayal’78 has improved steadily between the North and the pan-UK audiences. Specific departments of the BBC have seen more substantial shifts in approval gaps79. Radio 5Live’s reach in the North now exceeds reach at the pan-UK level.
Another way the BBC measures improvements in serving wider audiences is ‘general impression’80. The approval gap between the North and pan-UK audiences is now around 1-2%, down from a 3-4% approval gap previously81.
77 Magnetic North is an independent digital design company based in Manchester. It has worked with the BBC on a number of projects.
78 Portrayal figures relate to responses in relation to the statement: “the BBC reflects my region fairly”
79 Approval gap is the difference in overall BBC approval ratings across the UK or across different BBC services, and those in the different regions
80 General impression is directly linked to audience consumption, and is a rating between 1 (extremely unfavourable impression) and 10 (extremely favourable impression)
81 BBC North, Building the BBC in the North, Autumn 2013

30
5 The economic impact of the BBC’s online activity
5.1 Introduction An increasingly important element of the BBC’s offering as a Public Service Broadcaster is its online activity.
BBC Online plays an important role in meeting the BBC’s public purposes set out in its Charter and has the specific remit: “… to promote the BBC’s public purposes, by providing innovative and distinctive online content and distinctive propositions that reflect and extend the range of BBC’s broadcast services”82.
As an overall share of BBC services, BBC Online represents approximately only 5% of BBC’s annual PSB Group expenditure (£201 million out of £4,222 million83). Not only has BBC Online grown rapidly in its importance to the BBC’s overall activity, its impact on consumers is significant. According to the BBC Annual Report 2014/15 around 50% of the UK adult population access BBC Online each week.84
The latest review of BBC Online by the BBC Trust, undertaken in 2013, confirms this and concludes that BBC Online is: “… an extremely important part of BBC’s portfolio”85. The review highlighted the role of BBC News, BBC Sport and iPlayer as distinct products making a valuable contribution to the BBC’s public purposes.
In this section of the report, we outline the scale and scope of the BBC’s online activity and, using the economic framework set out in Section 3, focus our analysis on:
• the degree of external spend with suppliers to support the BBC’s online offering; and
• the economic impacts of the BBC investment and innovation in the online space and the spillover effects this creates. These spillovers include skills and knowledge development and sharing, technology spillovers and the broader market development that the BBC has contributed toward through its activity.
Given that many of the economic benefits arising from the BBC’s online activity are spillover effects, by nature these are much harder to quantify. Therefore, in this section of the report we adopt a largely qualitative approach, highlighting the economic framework and theory that underpins how the BBC’s online activity generates economic impacts. We also provide descriptive statistics, where possible, to demonstrate the scale and scope of the BBC’s activity to provide an indication of the potential order of magnitude of the impacts.
5.2 The BBC’s online activity Having launched in the 1990s, BBC Online has evolved to provide a broad range of online products, including News, Sport, Weather, iWonder, CBBC, Cbeebies, BBC Taster, BBC iPlayer and
82 BBC Trust, Review of BBC Online and Red Button, 2013
83 BBC, Annual Report and Accounts, 2014/15
84 BBC, Annual Report and Accounts, 2014/15
85 http://www.bbc.co.uk/bbctrust/our_work/services/online/service_reviews/online_redbutton.html
5

31
iPlayerRadio. They are available across a wide range of devices - on smartphone, tablet, desktop and connected TV.
The delivery of this BBC content over Internet protocol (IP) is supported by a range of infrastructure including publishing platforms, platform architecture and internet infrastructure.
Through these services and websites, users are able to read the latest news, listen to the radio, watch TV programmes live or on demand, and access informative and interactive content on numerous topics relevant to all audiences.
BBC Online is also an important complement of TV and radio services by providing users with complementary information on specific TV and radio programmes and has been successful in achieving high penetration of its services across a range of devices.
A timeline of the BBC’s online activity shows the development of BBC Online services over the last 25 years. The most important events include the launch of bbc.co.uk and BBC News online in 1997 as well as the launch of BBC iPlayer in 200786.
Figure 8: Timeline of the development of the BBC’s online activities
Currently, the BBC provides 18 distinct mobile apps plus a further 5 BBC News apps in other languages. BBC Red Button+, an improved version of BBC Red Button, launched in beta version in 2013, provides the link between online and TV services in internet connected TVs, bringing iPlayer and BBC Online content straight to users’ TVs. In addition, BBC iPlayer is available across a high number of devices, such as PlayStation and on smart TVs, comparing favourably to other video-on-
86 http://www.bbc.co.uk/timelines/zpwy87h

32
demand providers such as Sky or Virgin, which only offer their services across a limited number of platforms87.
Around 50% of adults now use BBC Online every week88. The latest statistics, for August 2015, for unique visitors/viewers to BBC online sites, across multiple platforms, is shown in the Figure below.
Figure 9: Multi-platform unique visitors/viewers on BBC sites, August 2015
Source: comScore MMX, August 2015, UK, BBC Sites, Unique Visitors.
The BBC Online sites were the highest ranking UK media brand in the comScore Top 20 Digital Media Properties in June 2015.89
5.3 Economic impacts arising from BBC Online external spend with suppliers
An important way in which the BBC contributes to the UK economy is through its supply chain.
As explained in Section 3, this supplier spending generates additional economic activity at the direct (Tier 1) suppliers and this perpetuates through the economy through their supply chains. This results in indirect GVA arising from the BBC.
Given that detailed supplier spending data relating only to BBC Online was not available to us for the purposes of this study, we are able to outline the high level external BBC spending associated with BBC Online but we do not estimate the indirect GVA arising from this.
The external expenditure by BBC Online has helped to increase creative and digital activity in the economy through direct contracting and outsourcing of goods and services from suppliers. The impacts in the wider economy are, to some extent, linked to the external spending quota for BBC Online that forms part of the Service Licence. The quota purpose is to ensure that BBC Online delivers audience benefits in terms of better value for money; and /or improvements in quality by working with the wider digital market. The quota requirement is for 25% of spend classified as
87 Ofcom, Online Media Services, 2014, Annex 4
88 BBC Accounts 2014/15 http://downloads.bbc.co.uk/annualreport/pdf/2014-15/bbc-annualreport-201415.pdf#page=101
89 comScore Top 20 Digital Media Properties by Total Multi-Platform Unique Visitors, June 2015. See: https://www.comscore.com/Insights/Market-Rankings/comScore-Ranks-Top-UK-Digital-Media-Properties-for-June-2015
0
5,000
10,000
15,000
20,000
25,000
30,000
BBC News BBCWeather
BBCHomepage
BBC Sport BBCiPlayer
CBeebies CBBC BBCBitesize
Tota
l Uni
que
Vie
wer
s (0
00s)
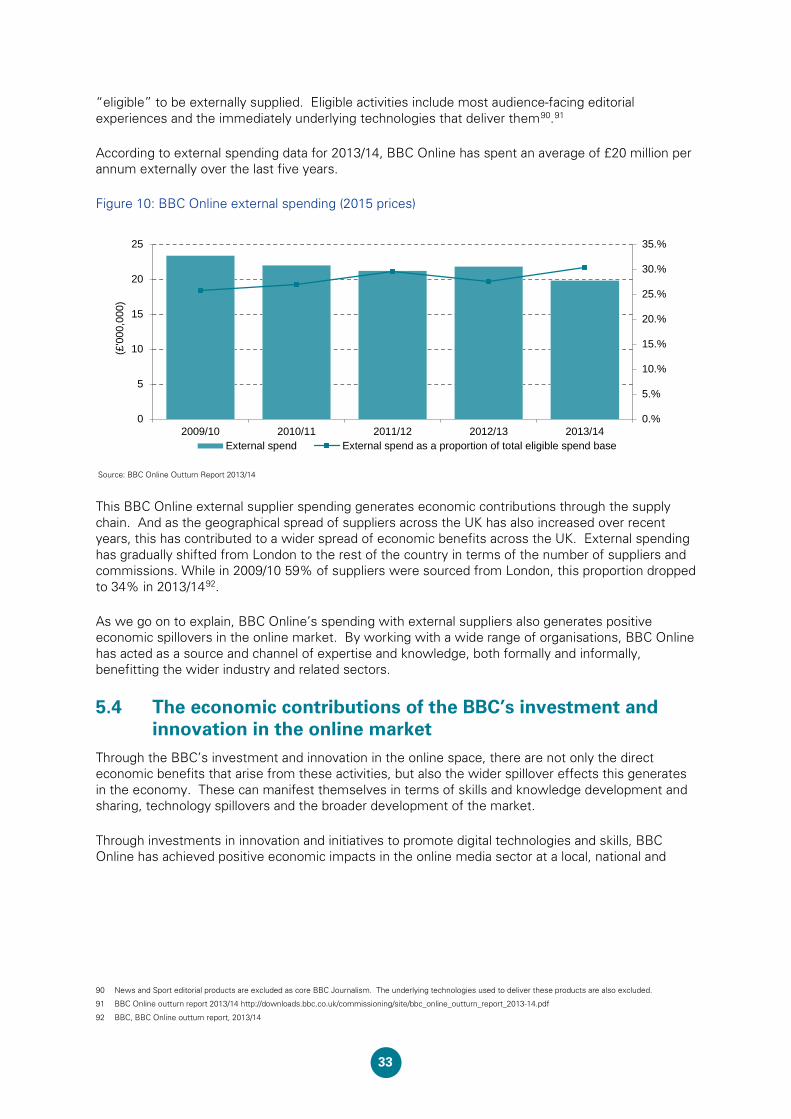
33
“eligible” to be externally supplied. Eligible activities include most audience-facing editorial experiences and the immediately underlying technologies that deliver them90.91
According to external spending data for 2013/14, BBC Online has spent an average of £20 million per annum externally over the last five years.
Figure 10: BBC Online external spending (2015 prices)
Source: BBC Online Outturn Report 2013/14
This BBC Online external supplier spending generates economic contributions through the supply chain. And as the geographical spread of suppliers across the UK has also increased over recent years, this has contributed to a wider spread of economic benefits across the UK. External spending has gradually shifted from London to the rest of the country in terms of the number of suppliers and commissions. While in 2009/10 59% of suppliers were sourced from London, this proportion dropped to 34% in 2013/1492.
As we go on to explain, BBC Online’s spending with external suppliers also generates positive economic spillovers in the online market. By working with a wide range of organisations, BBC Online has acted as a source and channel of expertise and knowledge, both formally and informally, benefitting the wider industry and related sectors.
5.4 The economic contributions of the BBC’s investment and innovation in the online market
Through the BBC’s investment and innovation in the online space, there are not only the direct economic benefits that arise from these activities, but also the wider spillover effects this generates in the economy. These can manifest themselves in terms of skills and knowledge development and sharing, technology spillovers and the broader development of the market.
Through investments in innovation and initiatives to promote digital technologies and skills, BBC Online has achieved positive economic impacts in the online media sector at a local, national and
90 News and Sport editorial products are excluded as core BBC Journalism. The underlying technologies used to deliver these products are also excluded.
91 BBC Online outturn report 2013/14 http://downloads.bbc.co.uk/commissioning/site/bbc_online_outturn_report_2013-14.pdf
92 BBC, BBC Online outturn report, 2013/14
0.%
5.%
10.%
15.%
20.%
25.%
30.%
35.%
0
5
10
15
20
25
2009/10 2010/11 2011/12 2012/13 2013/14
(£'0
00,0
00)
External spend External spend as a proportion of total eligible spend base

34
international level. This has been realised by promoting market expansion and through knowledge spillovers.
More specifically, we have identified two main mechanisms through which investment by the BBC has had a positive economic impact on the sector:
• technology spillovers driven by the BBC’s innovation in the market; and
• knowledge and skills spillovers arising from BBC collaborations, partnerships and wider industry initiatives.
Both of these result in overall development and expansion of the online market and related industries.
These impacts are not just realised at a national level. As exports become increasingly important to the UK’s broadcasting and media industry, with total sales of UK TV to international markets increasing by 5% in 2013/1493, the benefits of BBC Online’s investment have a global reach.
The mechanisms through which BBC Online investment results in economic impacts are discussed below after an overview of the scale and scope of BBC Online’s investment and innovation activity to provide context.
5.4.1 Scale and scope of BBC investment and innovation in the online market
The BBC considers investment and innovating in online services to be a priority. This was reflected in the BBC Director-General’s speech in 201394 which emphasised the role of research and development to accomplish his vision for the BBC95.
Over the last decade, BBC Online has spent between £174-201 million per annum across three main areas: content, distribution and infrastructure96.
Spending on BBC Online and the Red Button, however, has reduced in real terms since 2010 as a result of budget cuts and the need to implement cost controls. Despite this, the level of BBC activity and its innovation in these areas has continued to grow. Innovating online is a BBC strategic priority. As noted in the BBC Annual Report, FY2014/15 activities in relation to this included innovations such as the Radio 1 iPlayer channel and new apps for CBBC and BBC News97.
93 BBC, Accounts and Annual Report, 2014/2015, p.10
94 http://www.bbc.co.uk/mediacentre/speeches/2013/tony-hall-vision
95 http://www.bbc.co.uk/rd/about/vision
96 BBC, Annual Accounts Reports, 2008-2015
97 BBC, Annual Accounts Report, 2014/2015

35
Figure 11: BBC Online and Red Button expenditure (2015 prices)
Source: BBC Annual Accounts Reports, 2008-2015
The history of BBC has been marked by a high number of online related innovations, as shown in the timeline in Figure 8. These include the development of the BBC’s Video on Demand (VoD) offering – iPlayer – its subsequent iPlayer Radio, and other web and app offerings.
Over time, the BBC as a whole has invested heavily in technological improvements and innovation.
Investing in research and development (R&D) is not only motivated by rapid changes in technology, but it is also part of activities to promote the public purposes in the BBC’s Royal Charter. According to the agreement between DCMS and the BBC98, the BBC is required to invest in R&D to become a centre of excellence, promoting “open standards” where this is desirable, and collaborating with suitable partners.
Although the BBC has a dedicated R&D team of more than 100 technical staff working on developing new ways of broadcasting and distributing content electronically,99 its digital innovation spans its activities. As part of its transition to the digital age, BBC R&D investments have increasingly focused on technological improvements related to the internet. In its vision for the future, the BBC recognises that most content will be produced and broadcast over IP100. This means that there is an increasing focus on online activity and that the BBC will increasingly contribute towards this market.
Expenditure specifically dedicated to innovation cannot be easily identified in the BBC’s financial systems given that the majority of operating expenditure includes some element of innovation and R&D spending. Therefore, we are not able to quantify this spending within this report.
5.4.2 Technology spillovers driven by the BBC’s innovation in the online market
Public funded organisations have always been important in the development of new technology. In the media industry, the BBC has historically taken risks to create and invest in innovative programmes, technologies and processes, becoming a key partner to the private sector and in many
98 DCMS, Broadcasting: An Agreement between Her Majesty’s Secretary of State for Culture, Media and Sport and the BBC, July 2006
99 http://www.bbc.co.uk/rd/about/our-purpose
100 http://www.bbc.co.uk/rd/about/vision
0
50
100
150
200
250
300
2008 2009 2010 2011 2012 2013 2014 2015
(£'0
00,0
00)

36
cases enabling them to benefit from accessing and learning from the technological innovation and investment.
The BBC has been able to support online market development and innovation partly thanks to the certainty of revenue from BBC licence fees. This allows the BBC to take a longer term perspective and take on greater creative risk.
As a result of investing in developing more uncertain technologies and innovations, there are examples, such as the ongoing development of iPlayer, in which the BBC has paved the way for other providers to follow suit and implement new technologies at a reduced cost and risk. The competition that this generates has accelerated market expansion in online services, increasing economic output, given that competition serves to incentivise other providers of online media services to match the quality and breadth of services that the BBC is providing, as well as to adopt new technologies.
This has been enhanced by the fact that the BBC has promoted the use of open standards, making it easier for competitors to adopt newly developed technologies.
We set out below examples of how the BBC’s investment and innovation related to the online market has positive technology spillover benefits to firms in the wider market. These contribute toward the economic impact the BBC has on the UK’s online market.
5.4.2.1 Positive technology and innovation spillovers through the development of BBC iPlayer
The emergence of video on demand (VoD) as a new distribution technology is an example of how the BBC invested in technologies where it is likely that there would be underinvestment by the private sector given the risks involved.
In particular, the VoD market faced two potential barriers: first, consumer demand for the service was uncertain; and second, it required the simultaneous development of services in a number of linked, but distinct markets (content providers, content aggregators, transmission network providers, etc.).
By continuously investing in VoD technology and enhancing its offering, it can be argued that BBC Online has accelerated the development of this market, which now offers high quality VoD services. It is likely that there would be less investment in VoD as a new distribution technology without the BBC innovations and investments in technologies in this area. Such innovations can be expensive and carry risk. Not only that, if any one organisation were to invest in the area and it were to succeed as a concept, it may be possible for it to be adopted relatively easily by others, once technologies have developed and costs reduced. In economics-language, there are ‘positive externalities’ associated with these types of innovations.

37
Figure 12: Timeline of key developments in the VoD market
Since the development and launch of the first VoD services in the mid-2000s, demand for online TV services has significantly increased. As Ofcom notes101, there has been a considerable uptake in VoD devices, along with an increase in the variety of VoD services and apps available. Rollout has accelerated in recent years, particularly since 2010. It is likely that through its investments in iPlayer the BBC has helped to stimulate demand for on-demand TV.
The Figure below shows the number of VoD programme requests annually since 2008, shortly after iPlayer was launched.
Figure 13: BBC iPlayer, ITV Player, 4oD and Demand 5 programme requests: 2008-2013
Source: Ofcom, PSB Annual Report, 2014.
101 Ofcom, Communications Market Report, August 2014.
537
1,117
1,711
2,213
2,541
3,049
0
500
1,000
1,500
2,000
2,500
3,000
3,500
2008 2009 2010 2011 2012 2013
Req
uest
s ('0
00,0
00)
38
In 2014, 61% of adults over 16 years old reported watching television programmes or films online through an on-demand service102. In recent years, the online TV subscription model has become more and more popular showing steep growth in revenue, achieving over ten times the revenue obtained in 2010 (£23 million), reaching £317 million in 2014103.
Although the BBC was not the first provider to launch its VoD service, it has led the market with the implementation of numerous innovative technological improvements.
In the words of Netflix’s CEO: “The iPlayer really blazed the trail”104.
Innovations in iPlayer include continuous improvements to make it a fast service, downloadable content, and High Definition (HD) amongst others105. The BBC also led the VoD market in terms of enabling downloads and its development of live restart/watch over capabilities also led the market.
Such developments have created incentives for competitors to improve their online offerings, as well as possibly spurring demand for online VoD services. Indeed, Ofcom notes that, “the BBC has the potential to act as a catalyst for market development”, citing the example of iPlayer that it states, “has helped build consumer interest and take-up of on-demand services, providing market opportunities for other providers to deliver new, innovative services beyond traditional TV.”106
The introduction of HD streaming technology is another example illustrating BBC Online’s role in the development of the VoD market. While iPlayer introduced the option to watch videos in this format in 2009, offering HD services was not cost effective for other commercial providers, as recognised by Channel 4 Head of Online Products at the time107. Channel 4 and ITV VoD services have still not introduced HD format for online services but other online VoD providers like Netflix, which entered the UK market in 2012108, do offer some of their programmes in HD. BBC iPlayer is now trialling Ultra HD109. As a result, BBC iPlayer has developed technologies and set high quality standards that rival companies gradually adopt to be able to compete, once the technologies have developed and costs have sufficiently reduced.
These technological innovations and investments in BBC online TV services are likely to have had strong positive innovation and technology spillover impacts. As a result they will, therefore, have contributed to the overall market development and expansion. As shown in Figure 13 above, the overall market has grown significantly in recent years. Within this, BBC iPlayer attracts more users each year and has achieved the number one position as an online TV provider in the UK, with 35% of adults watching programmes on iPlayer at least once a month, double the proportion of adults watching the second most successful provider (ITV at 17%) in 2014, based on Ofcom survey data110.
Continuous innovations in BBC iPlayer services are reflected in the demand for this service, which has steadily grown since its launch in 2007. The latest iPlayer demand data up to July 2015 shows
102 Ofcom, Online Media Services, 2014
103 Ofcom, Communications Market Report, 2015
104 http://www.telegraph.co.uk/finance/newsbysector/mediatechnologyandtelecoms/media/11141864/Netflix-chief-Reed-Hastings-takes-on-telcos-cinemas-and-global-expansion.html
105 http://www.bbc.co.uk/blogs/bbcinternet/2009/04/bbc_iplayer_goes_hd_adds_highe.html
106 Ofcom, Proposed changes to BBC Three, BBC iPlayer, BBC One and CBBC Market Impact Assessment, June 2015
107 http://www.digitalspy.co.uk/tech/news/a161400/high-def-4od-difficult-to-justify.html#~poy1yt2bg4UKU8
108 https://pr.netflix.com/WebClient/loginPageSalesNetWorksAction.do?contentGroupId=10477
109 http://iplayerhelp.external.bbc.co.uk/tv/UHD
110 Ofcom, Online Media Services, 2015

39
an average monthly demand in 2015 of 222 million viewer TV programme requests, with 7% of programme requests being for simulcast111 services.
Figure 14: BBC iPlayer monthly TV programmes requests (2009-2015)
Source: iPlayer performance data
Trends in demand also show how iPlayer has successfully attracted demand through various devices. Currently, iPlayer is watched mostly on computers, tablets and mobile devices, almost in equal proportions. This may change in the future as internet TVs become more widely used.
Figure 15: Requests for BBC TV iPlayer programmes by device type (July 2015)
Source: iPlayer performance data
111 Simulcast relates to simultaneous broadcasting – the broadcasting of programmes over more than one medium, or more than one programme over the same medium, at exactly the same time
45
88
127145
212234
264
0
50
100
150
200
250
300
Jan-09 Jan-10 Jan-11 Jan-12 Jan-13 Jan-14 Jan-15
('000
,000
)
25%
20%
26%
14%
6%3% 6%
Computers Mobile devices Tablets TV platform operators Internet TV Games consoles Other
40
The number of requests for iPlayer is considerably higher compared to direct competitors – while BBC has an average number of monthly requests of 200 million, ITV Player receives 66 million requests112 and Channel 4 VoD services receives 45 million views113.
5.4.2.2 Positive technology and innovation spillovers through wider BBC initiatives
The BBC has supported the development of a number of other new technology concepts (in addition to its development of iPlayer) before they have become commercially viable, to the benefit of the wider industry.
For example, through the BBC’s IP Studio project, a model is being developed for end-to-end broadcasting that will allow a live studio to run entirely on IP networks. Since 2012, the IP Studio project has investigated new approaches to capturing, producing and delivering content. The feasibility of these approaches has been tested through prototypes and trials, including its application to the 2014 Commonwealth Games in Glasgow where the software was used extensively in the first major live event to be produced and delivered entirely over the internet.
According to the BBC, IP networks can provide more cost effective alternatives to traditional interconnects. IP-based production can also lead to greater agility and capability to carry new types of services and assist in the provision of high quality coverage of live and recorded events, supporting content personally customised for audiences.
The BBC is now working with technology companies from around the world to develop this approach into commercial products and services for the benefit of the wider broadcast community.
This is a further example of how BBC Online is contributing to technological progress and generating positive spillover effects to the benefit of the wider broadcast industry.
5.4.2.3 Positive spillovers from BBC open source technology
In order to further accelerate market development and competition, BBC Online has encouraged the implementation of BBC technologies by its competitors through open-sourcing and technology transfer. Open source software development is at the core of BBC’s policy to innovate and to share the benefits of new developments with the wider industry. It allows other individuals and organisations to download BBC software, free of charge, and to adapt and develop this and share the results.
As acknowledged by NESTA114, through its software development activities the BBC may create value and innovation more widely. Given that the software developed by the BBC is likely to be of value to the wider media and digital sectors, these positive spillovers are encouraged by the BBC’s use of open source licensing.
Using data from GitHub – a collaborative software development platform – NESTA115 found that the BBC’s development activity on this platform has grown significantly in recent years. The number of BBC projects in GitHub have multiplied 10 times since 2012, reaching 380. And instances where others have copied BBC code to continue working on it (‘forks’) have multiplied by 25 over the same period, to reach over 800. Data also shows that these forks span across the UK and internationally, covering 53 different countries. However, as a third of them are in the UK, there is evidence to
112 PSB data from Enders Analysis
113 Channel 4, Digital Media Pack, 2015
114 https://www.nesta.org.uk/blog/public-service-coding-bbc-open-software-developer
115 Ibid

41
suggest that beneficial impacts of the BBC’s open sourcing approach are accruing to the UK economy.
There are a range of current BBC open sourcing initiatives helping the overall industry compete and make the most of the knowledge developed by the BBC. These projects, all actively maintained by software teams in the BBC and used internally, include116:
• Hive Ci: a continuous integration platform for on-device testing;
• DeviceAPI: a collection of ruby gems117 that make working with physical devices easy and consistent. It provides common utilities such as device detection and identification, and useful helpers for installing applications and identifying problems with devices;
• Wraith: a responsive webpage screenshot comparison tool designed for visual regression testing; and
• Image Session Analyser (ISA): a ruby gem for comparing screenshots over a testing session. It is used in combination with the DeviceAPI gem to capture screenshots during video playback tests and confirm that video is actually being played.
The TV Application Layer (TAL) is also an example of a BBC project made available through open source licences. This technology was developed to make it easier and more efficient to implement iPlayer, News and Sport services for connected TVs across multiple devices118. The platform was then made open-sourced allowing other parties to contribute, benefiting app developers, content providers and manufacturers.
We understand from the BBC that TAL is now being used by Arqiva, a communications infrastructure and media services company operating in the broadcast, satellite and mobile communications markets. This provides a clear example of how other players in the market are benefitting from the innovations of the BBC and the technology spillovers facilitated by the BBC’s open source initiatives.
Not only does BBC Online increase competition and accelerate market development through its innovation and investment, but also by making it easier for other companies to compete, e.g. through open-sourcing technology and making knowledge available to industry. Technology and innovation spillovers are important contributions to the economy.
5.4.2.4 Positive spillovers from the BBC’s role in developing standards underpinning online media
Through its role in developing standards underpinning online media, the BBC generates further positive spillover effects. This helps in overall market development and benefits other players in the industry.
The Digital Production Partnership (DPP), which the BBC is a key player in, is one example of this.
The DPP establishes standards for the transfer of completed programmes between broadcasters and independent producers and postproduction houses. Its aim is to smooth and accelerate the move to end-to-end digital, and in doing so reduce complexity and cost and increase interoperability119.
116 http://www.bbc.co.uk/opensource/projects/
117 RubyGems is a package manager for the Ruby programming language that provides a standard format for distributing Ruby programs and libraries (in a self-contained format called a "gem")
118 http://www.bbc.co.uk/blogs/internet/entries/f4318816-475c-3ee9-bf3c-e69ec0dc580c
119 https://www.digitalproductionpartnership.co.uk/who-we-are/
42
We were told by the BBC that Sony stated: “The DPP is a very valuable forum with considerable potential to stimulate this sector to adopt collaborative solutions in the UK and beyond. Without doubt the BBC was and continues to be the prime mover in the DPP as it alone has the scale, vision and deep technical competence to promote the dialog across the fullest range of topics.”
5.4.3 Knowledge and skills spillovers arising from BBC collaborations, partnerships and wider industry initiatives in the online market
The BBC as a whole also generates positive spillover economic impacts through knowledge and skills transfer. These spillovers arise as firms gain access to knowledge and innovation produced by the BBC without incurring any costs and can explain why knowledge intensive businesses tend to co-locate120. Through these knowledge and skills spillovers the economic contributions arising from the BBC’s investments and innovations are enhanced.
As we set out below, there are a number of mechanisms through which BBC Online specifically generates these spillover effects, to the benefit of creative and technology intensive industries in particular. This includes its partnerships and industry collaborations, collaborations with academic institutions, and direct support it provides to industry through opportunities created by a range of projects and initiatives. These examples only provide a snapshot of the range of online related activities undertaken by the BBC that have positive economic impacts.
5.4.3.1 BBC Online partnerships and industry collaborations
One way in which BBC Online supports knowledge transfer and skills development across the media and technology industries is through partnerships. Some important partnerships that BBC Online currently maintains are121:
• Radioplayer - a partnership with commercial radio that allows audiences to access hundreds of radio stations online via a single console. It was launched in 2011 and now offers access to over 400 stations;
• Free-to-air platform partnerships: YouView - a partnership with ITV, Channel 4, Five, BT, TalkTalk and the communications infrastructure company Arqiva to build an open, Internet-connected TV platform; Freeview Play; and Freesat; and
• Online partnership with the Arts Council England – a public value partnership to create the best possible broadcast and online arts content.
As part of the partnership with the Arts Council England starting in 2009, “the Space” was created - an experimental digital arts platform which has led to the sharing of technology and improved digital production skills in the cultural sector122. The BBC contributed £2 million to support this project, including technology solutions, training and mentoring123.
We understand that the BBC’s contribution in terms of technology was critical to the success of the project and the delivery of the online platform. In addition to knowledge sharing, the Space supports the creative and technology industries by commissioning work through open calls and the Creative Fellowship. Overall, the Space aims to commission 50 new works every year and spends on average £5 million on this, including part-funding from partners and co-commissioners124.
120 NESTA, Creative clusters and innovation, 2008
121 http://www.bbc.co.uk/aboutthebbc/insidethebbc/howwework/partnerships/media_industry.html
122 BBC, The economic value of the BBC, 2011/12
123 Data and information provided by the BBC
124 http://www.thespace.org/faqs

43
By 2011/12, the Space had attracted over 1 million visits and, according to an evaluation by the Arts Council, it has succeeded in developing digital capacity and stimulating innovation125. Based on this evaluation, the majority of arts organisations that had been commissioned through the original pilot scheme stated that their involvement in the Space had had a major impact on their digital capabilities. Thus, through its contributions to support artists both from the creative and technological worlds as well as spreading innovation in the technology field, the Space has generated positive economic impacts.
BBC News Labs is another example of an industry collaborative project aiming to drive innovation in news. It works as an ‘incubator’ to take forward opportunities relating to journalism, technology and data, working closely with BBC News and R&D and collaborating with news organisations, and academic and research institutions. Goals of the initiative, include both supporting innovation transfer into production and driving open standards through news industry collaboration126. The fulfilment of each of these leads to an economic contribution through spillover effects.
As part of BBC News Labs, the BBC has put on 8 newsHACK events to date, to bring together developers and journalists to devise new ideas around the delivery of online news.
Over 120 organisations have participated in these, including news organisations, broadcasters and universities. And as a result a number of projects have been taken forward, benefitting from funding and/or support to turn the ideas generated at the events in to pilots.
While the wider economic impacts arising from the ideas and projects generated at BBC News Labs in many cases have not yet materialised to their full potential and are not quantifiable, there are some examples of the positive effects that have arisen for the BBC and wider industry:
• The News Storyline Ontology127 – a generic model for describing and organising the stories news organisations tell - was developed in collaboration with industry partners. It is now used in BBC News online and is being rolled out more widely, impacting on industry standards.
• An EU Horizon 2020 funded Big Data project - SUMMA (Scalable Understanding of Multilingual MediA) - submitted in April 2015 by BBC News Labs and partners aims to significantly improve media monitoring through the development of a scalable and extensible platform, with multilingual and cross-lingual capabilities, to support the journalism industry. This also arose from project collaborations started at a newsHACK event.128
There are also further examples of where outputs from R&D partnerships and industry collaborations have already been commercialised and are now being adopted across the industry. For example, Piero - a system for producing 3D graphics to help analyse and explain sports events – is based on technology originally developed by BBC R&D as a part of its work in an EC-funded project, and is now in use in various BBC Sports programmes129.
125 Arts Council, Summary evaluation of The Space, May 2013
126 http://bbcnewslabs.co.uk/about.html
127 http://www.bbc.co.uk/ontologies/storyline
128 http://bbcnewslabs.co.uk/projects/summa/
129 Following development of the technology, BBC R&D negotiated a licencing agreement for this technology with RedBee Media, who productised the technology and licenced it back to the BBC

44
5.4.3.2 Collaborations with universities and industry
Partnerships with universities are also a central part of the BBC’s knowledge sharing and innovation policy.
Currently, the BBC partners with numerous universities across the country where there are mutual interests. These partnerships vary in their length and form, ranging from short-term collaborations with individual universities to long-term multi-university research partnerships, often involving the co-location of staff to maximise collaborative working and the cross-fertilisation of ideas. These partnerships with universities also often involve companies and the research outcomes can be shared with the wider industry. The research questions addressed in these partnerships are aimed at solving industry problems and by doing so deliver economic impacts.
The BBC has a strong track record in working closely with universities and industry in collaborative R&D projects that are facilitated and part funded by bodies such as InnovateUK and the European Commission. Recent success in the competitive Horizon 2020 ICT programme of research will enable the BBC to collaborate with experts across Europe in research areas that will deliver impact through the creation of new products and services and new jobs and skills.
Examples of research areas include:
• new multi-screen and personalised content experiences;
• joint creation of Ultra-HD media;
• building an end-to-end object based media chain for audio; and
• the creation of a platform to improve online media monitoring for news.
One example of BBC collaboration with academia to take forward research is BBC R&D’s 4-year strategic partnership with University College London (UCL) related to the future of digital content. This partnership involves the co-location of 40 BBC staff plus 40 UCL staff working together to investigate communication technologies, internet research, content production, and user experience and access services. We understand that there have already been a number of positive outcomes from projects within this partnership including novel machine learning-based algorithms for tracking, segmentation and 3D reconstruction of generic videos downloaded from YouTube, and the creation of tools for audio clipping/zooming/sharing in the browser for improved search, discovery and edit, to name a handful. Each of these outcomes will generate economic benefits across the industry as they become more widely adopted.
There are also examples of where the BBC has helped UK universities to earn funding from major UK Research Councils. This BBC support and collaboration generates benefits directly to the universities as well as to the wider research community through the spillover effects from the projects themselves. Research grants from the Engineering & Physical Sciences Research Council (EPSRC) to UK universities for projects supported by the BBC among other organisations, total £121 million for 34 current projects across 16 UK universities. The outcomes from this critical mass of research activity will generate impact by reaching end users in ways that make a difference to the UK’s digital economy.
And of this £121 million pot of research, funding of over £40 million over 5 years was allocated by EPSRC to four Digital Economy Hubs in FY2014/15 at R&D partner universities (Newcastle, Nottingham, York and Swansea) within the BBC User Experience (UX) Research Partnership. BBC R&D played an important role in helping to secure this funding by committing to provide support to these hubs through in-kind contributions, for example: BBC R&D staff time to undertake UX research work and input to Advisory Boards and Technical Reviews; and access to equipment or resources to support the wide-ranging projects in these hubs. These are clear examples of where this type of support by the BBC achieves spillover benefits, including developing the knowledge and skills of the UX and Human Computer Interaction researchers, improving the employability prospects of the

45
students who work on the projects, and the resulting products and services that could be commercialised for further economic impact.
Additionally, in some cases, the BBC contributes to university research together with other businesses. An example is the 5G Innovation Centre (5GIC) at the University of Surrey which is conducting research into the development of advanced technologies for a 5G network of the future, with the aim of establishing a world-leading position in mobile broadband communications and internet innovation. The BBC is one of 13 founder members of the 5GIC along with mobile network operators, infrastructure and tools providers, media and communications organisations and the UK’s communications regulator.
By investing in the UK’s research into 5G, the BBC is playing a role in the development of the technology, supporting the UK to exploit this emerging technology from an early stage and helping the UK to realise the economic benefits linked to the commercialisation of supporting technologies, and early adoption of 5G technology itself. The 5GIC is also working closely with SMEs from across a range of the UK’s industries to help encourage participation in understanding the technology. Through this process, the BBC is therefore helping make a contribution to the development of commercial activity in the UK in this emerging area of technology.
5.4.3.3 Direct support to the industry
“Connected Studio” is another example of BBC knowledge spreading and of direct support to the industry.
The Connected Studio is the BBC’s initiative to deliver innovation across the BBC’s online activity130. It was launched in May 2012 and has worked with industry across the UK with a split team in London, Salford, Cardiff and Glasgow. It provides an opportunity for external digital agencies, technology start-ups, designers and developers to submit and develop ideas for innovative new features and formats for BBC Online to invest in. There is an annual £1 million fund available to invest in external parties early-stage concepts and public-facing pilots.
To date, the Connected Studio team has run 109 events (of which 24 have been in MediaCityUK) has worked with 458 small companies and has given contracts to 160 digital and creative SMEs. Ideas are selected on a competitive basis and short-listed ideas obtain funding throughout the process to be developed further and tested.
Through the Connected Studio, the BBC provides direct support to the industry; through the knowledge and skills spillovers both external parties and the BBC benefit from the opportunities created. Successful candidates to the initiative benefit from BBC and wider industry expertise to develop their ideas. The BBC works closely alongside the firms and also draws in the expertise of Independents to provide additional input where appropriate. Through this collaboration, innovation is supported and ideas taken beyond proof of concept to development and testing where feasible.
One example of a business benefiting from the Connected Studio is the Edinburgh based company Peekabu. It attended the BBC Connected Studio CBBC event in September 2012 and pitched an idea for ‘Eezl’ which was a response to a challenge around ways for children to sign-in for personalised BBC content. From approximately 30 ideas pitched at this event, they were one of ten that were asked back to a ‘Build Studio’ to build a prototype and further develop their idea. This was then one of four ideas that made it through for piloting and testing within a six month period. Following this, Eezl went in for further production with the CBBC Interactive team. During this
130 http://www.bbc.co.uk/corporate2/connectedstudio/

46
process, Peekabu was picked up by BBC Worldwide Labs to join their community incubator programme for up to a year.
Firms in the creative and digital industries also benefit directly from the Connected Studio initiative though BBC spending. Through the initiative around £650,000 a year is spent on contracts with these small companies, with the average cost of each contract ranging from £20,000 to £50,000. This investment is for a specific idea only and not an investment into the company131. Through this spending the BBC generates economic activity in the UK creative industries to the benefit of the wider economy.
Some of the ideas developed in the Connected Studio are now being developed and tested through BBC Taster132, a public-facing platform launched in January 2015 aimed at engaging audiences with the testing of early stage ideas to develop the BBC’s future plans. BBC Taster was built and is run through Connected Studio and is a website that invites audiences to try, rate and share the latest digital pilots from across the BBC, showcasing a range of digital innovation tools, techniques and content.
Since its launch, BBC Taster has had 5 million webpage views, with 5% of audiences participating to provide the BBC with views on the ideas being tested.133
Through this initiative the BBC’s team collaborates with a range of independent creative industries companies, in addition to technology providers.
All these examples of collaboration and the provision of direct support to the industry facilitate knowledge and skills transfer. They demonstrate how the development of future online services may be influenced by BBC’s investment and collaborative working, and how the spillover effects benefit wider media and technology related industries.
131 Information provided by BBC R&D
132 http://www.bbc.co.uk/taster/about
133 Data provided by the BBC

47
6 The economic impact of the BBC on the music industry
6.1 Introduction Music related activity – including via radio, television, online channels and live events – contributes toward a number of the BBC’s public purposes:
• to stimulate creativity and cultural excellence;
• to represent the UK, its nations, regions and communities; and
• to bring the UK to the world and the world to the UK.
The music industry makes a significant contribution to the UK economy. Estimates are that the total UK music industry’s GVA reached £3.8 billion in 2013, with 60% of this (£2.2 billion) coming from exports.
The economic contributions are associated with recorded music, live music, music publishing, music representatives, music producers and those performing or writing music, with the latter contributing the most significantly (£1.74 billion in 2013).
The industry also contributes to UK employment with approximately 111,000 employed in the industry overall in 2013, 67,900 of whom worked in performing or music writing134.
And this contribution is growing. Between 2012 and 2013, overall GVA of the industry rose by 9%135.
The BBC both directly and indirectly plays a role in helping to generate these economic contributions.
In this section, we examine the scale and scope of the BBC’s music related activity and, using the economic framework set out in Section 3, focus our analysis on: the economic impacts arising from the increased exposure it provides to music artists more generally, and specific case studies relating to its support for music artists; and the economic impacts relating to its live music events.
Given the scope of this study and due to timeframes and data readily available, we do not seek to capture the full extent of the BBC’s potential contributions or to quantify the economic impacts relating to the BBC music activity in all cases. We adopt a largely qualitative approach, highlighting the economic framework and theory that underpins how the BBC’s music related activity generates economic impacts and providing descriptive statistics, where possible, to demonstrate the scale and scope of the BBC’s activity to provide an indication of the potential order of magnitude of the impacts.
134 UK Music, Measuring Music, 2014
135 Ibid
6
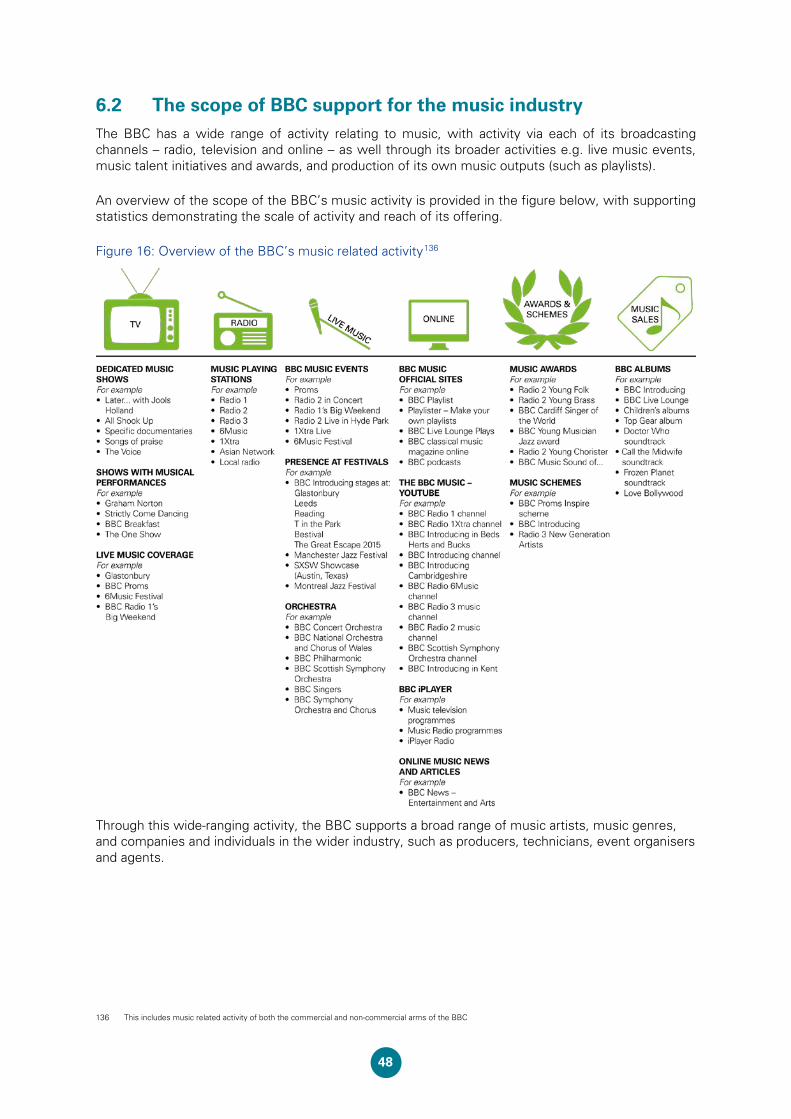
48
6.2 The scope of BBC support for the music industry The BBC has a wide range of activity relating to music, with activity via each of its broadcasting channels – radio, television and online – as well through its broader activities e.g. live music events, music talent initiatives and awards, and production of its own music outputs (such as playlists).
An overview of the scope of the BBC’s music activity is provided in the figure below, with supporting statistics demonstrating the scale of activity and reach of its offering.
Figure 16: Overview of the BBC’s music related activity136
Through this wide-ranging activity, the BBC supports a broad range of music artists, music genres, and companies and individuals in the wider industry, such as producers, technicians, event organisers and agents.
136 This includes music related activity of both the commercial and non-commercial arms of the BBC
49
And the scale of BBC activity suggests that the impacts could be significant. Data for 2014137 shows, for example, that:
• BBC music television programmes reached around 7 million viewers, on average, each week;
• BBC coverage of music events were also watched by large audiences – the TV average audience for the BBC Music Awards was 4.17 million and for Last Night of the Proms (including Proms in the Park) was 9 million; and
• there is wide reach of the BBC’s radio stations that predominantly play music. For example, in Q2 2015, the average weekly reach of BBC Radio 1 was 10.4 million, for Radio 1Xtra was almost 1 million, for Radio 2 was 15.1 million, and for 6Music was 2.1 million138.
There is GVA and employment generated in the UK economy, both directly and indirectly, through all of this activity.
For example, in producing and broadcasting a music dedicated TV programme such as ‘Later… with Jools Holland’, the BBC engages a range of suppliers. Through payments to these suppliers, GVA is generated in the economy. And employment linked to the show arises directly at the BBC, as well as indirectly through the supply chain.
There is also evidence to suggest that there will also be wider positive economic impacts e.g. arising as a result of the BBC helping to increase music artists’ exposure.
6.3 The impact of the BBC’s role in increasing artists’ exposure An important way in which the BBC supports the music industry is through the exposure it gives to music artists. This is through, for example, radio play, TV appearances, dedicated music shows and coverage, live event performances and award programmes which bring focus to select artists.
The increased exposure this generates for artists creates additional revenues for them and their producers, record labels, songwriters etc. In doing so, it directly generates GVA for the UK economy (where the revenues are generated and retained in the UK). There are also indirect positive economic impacts through the supply chain, linked for example, to the physical production of records, merchandise, event supplies etc.
To understand the potential economic impact the BBC has on the music industry through the exposure it gives to artists, we first consider the economic literature around the effect of music broadcasting on sales revenues. While the literature available primarily relates to radio play, we consider that, in principle, the same relationship should apply to other forms of music broadcasting, such as online and live appearances.
We then go on to examine data around the BBC’s broadcasting of music, particularly via the radio, to assess how this may impact on artists’ exposure.
6.3.1 Economic literature on the relationship between music broadcasting and record sales
A range of empirical studies have been undertaken to attempt to understand the relationship between music broadcasting – primarily radio play – and music record sales.
137 Data provided by the BBC based on the BARB genre of music programmes only
138 BBC, All Radio Report, Q2 2015

50
In general, there is consensus that an interdependency exists between radio broadcasters and the music industry. Radio plays increase record sales and playing records attracts listeners to radio stations.
This was recognised by Edward Fritts139, the president and CEO of the National Association of Broadcasters in the US who said that: “… the record industry reaps huge benefits from the public performance of their recordings by radio stations.”
Airplay may be perceived as a form of advertising of the musician and the repeated playing of an album may also positively impact the public’s perception of what type of music is enjoyable’140. This ‘learning’ element associated with broadcast music may encourage the future purchase of music. However, it may also be the case that listening to music on the radio or through other free mediums acts as a substitute for the purchase of music (be that albums, singles or attendance at live performances). The balance between these two factors to a large extent determines the impact of the BBC’s music broadcasting on the wider music industry.
In general, recent empirical studies have concluded that the relationship between radio plays and record sales is a significant, positive one.
A study by Dertouzos141 looks at the relationship between radio airplay of music and sales of albums and digital tracks from 2004 to 2006 in 99 designated market areas. Five econometric models are tested which control for a variety of market factors such as audience demographics and economic characteristics. Each of these models indicate that radio plays have a significant and positive impact on record sales142. The results of this study suggest that radio plays account for between 14% and 23% of sales of albums and digital tracks. Consumer surveys referred to within the study also highlight the importance of radio plays with approximately half of respondents indicating that they were influenced by the radio in their music purchase choices.
As part of the study, Dertouzos also conducted a number of simulations to estimate the effect of one standard deviation increases (equivalent to around ten additional tracks per day) in exposure, where exposure is measured by the number of listeners multiplied by the plays of a track. Overall, album sales were found to increase by 2% and digital tracks by 2.4%. However, there were some notable differences in the impacts across music genres143.
This paper stressed that these results “… were especially noteworthy because of their magnitude, their high statistical significance and because they are remarkably insensitive to a variety of econometric methods, assumptions and measurement techniques.”
It was concluded that radio plays a significant role in music industry sales and radio plays complemented, rather than substituted, album sales.
Consistent with the findings of Dertouzos, a 2013 study by Nielsen144 investigating how music exposure relates to music consumption found a significant relationship between radio air play and digital song sales.
139 Liebowitz, S., The Elusive symbiosis: The impact of Radio on the Record Industry, 2004.
140 A. Montgomery, a. and Moe, M., Should Music Labels Pay for Radio Airplay? Investigating the Relationship Between Album Sales and Radio Airplay, 2002
141 Dertouzos, J., Radio Airplay and the Record Industry: An Economic Analysis, 2008
142 The coefficient estimates across all categories are significant at the 99 percent level
143 Country music appeared to be the most responsive with an estimated increase of 3.4% while R&B and rap showed minimal increases around only 1%
144 Nielsen, Study: Radio airplay and music sales, 2013

51
Results of the study suggested that radio airplay drives both music sales and on-demand streaming, with the effects spanning across the first week of a song’s consistent radio airplay continuing through the peak sales week.
The results of the Nielsen Music 360 Consumer Survey145 also suggest that broadcast radio is the predominant source of music discovery (61% of respondents reported this)146.
A further study, by Montgomery and Roe, 200221, also finds a general positive relationship between radio airplay and album sales in the US. Their analysis is based on weekly US sales data collected across 14,000 record stores and weekly radio airplay data for 13 different albums released by Capital Records between 1993 and 1995147. While the study finds that there is generally a positive relationship between airplay and sales, this varies depending on the exact album. For all but two airplay had a significant effect on subsequent sales.
The consensus from the literature we have surveyed is that increased media exposure of music, for example through radio play, is linked to increased sales in the music industry.
There are studies that suggest the converse relationship, such as the 2004 paper by Liebowitz148, but the reference period for this study is the 1920s and 1930s. We are inclined to place higher weight on the findings of the more contemporaneous analyses.
6.3.2 The BBC’s impact on artists’ exposure through radio broadcasting
As set out in Section 6.2 above, the scope and scale of the BBC’s activity in relation to the music industry is wide.
And as the economic literature suggests, there is a positive relationship between increased artists’ exposure via broadcasting and record sales which indicates that the economic impact of the BBC on the wider music industry may be large.
As the UK’s largest radio provider, with 31.9 million listeners per week149, the evidence would suggest that the BBC is likely to play a significant role in supporting artists’ sales. Through Service Licence commitments, the BBC’s music radio stations also ensure that they support both new and UK music. For example, Radio 1’s commitment is for 40% of music played during the daytime to be from the UK, and 45% of music to be new.150
To examine this further, we analysed BBC data relating to four BBC radio stations for a month in 2015 (March) in order to quantify the scale of BBC music coverage on the radio and reach it provides to artists151. We understand from the BBC that while there may be fluctuations in the coverage of certain music and artists at certain times of year – for example around Christmas or in the summer when the majority of music festivals are held – the data for March should provide a generally representative picture.
145 Results referred to in Nielsen, Study: Radio airplay and music sales, 2013
146 We note that this survey relates to the US but we consider it reasonable to assume that this finding may also apply to the UK
147 We note that a limitation to the study is that while the sales data accounts for approximately 85% of all over the counter album sales in the United States, small stores are underrepresented which may have an impact on the results of the analysis
148 S. Liebowitz, 2004. The Elusive Symbiosis: The Impact of Radio on the Record Industry, Review of Economic Research on Copyright Issues vol 1(1) pp.93-118. http://www.serci.org/docs/liebowitz.pdf
149 https://media.info/radio/data/the-most-popular-radio-stations-in-the-uk
150 BBC, Performance against public commitments 2014/15. http://downloads.bbc.co.uk/annualreport/pdf/2014-15/bbc-papc-2015.pdf
151 Further details of the analysis and the cleaning of the BBC dataset are set out in the Technical Appendix to this report
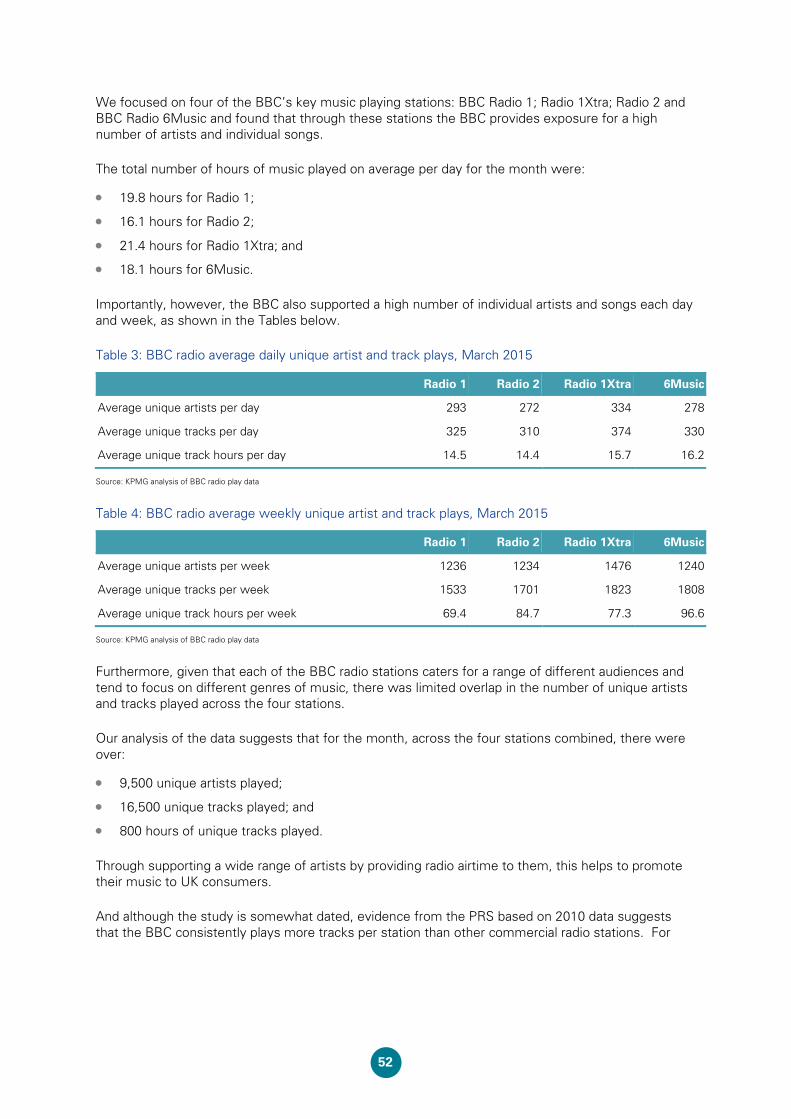
52
We focused on four of the BBC’s key music playing stations: BBC Radio 1; Radio 1Xtra; Radio 2 and BBC Radio 6Music and found that through these stations the BBC provides exposure for a high number of artists and individual songs.
The total number of hours of music played on average per day for the month were:
• 19.8 hours for Radio 1;
• 16.1 hours for Radio 2;
• 21.4 hours for Radio 1Xtra; and
• 18.1 hours for 6Music.
Importantly, however, the BBC also supported a high number of individual artists and songs each day and week, as shown in the Tables below.
Table 3: BBC radio average daily unique artist and track plays, March 2015
Radio 1 Radio 2 Radio 1Xtra 6Music
Average unique artists per day 293 272 334 278
Average unique tracks per day 325 310 374 330
Average unique track hours per day 14.5 14.4 15.7 16.2
Source: KPMG analysis of BBC radio play data
Table 4: BBC radio average weekly unique artist and track plays, March 2015
Radio 1 Radio 2 Radio 1Xtra 6Music
Average unique artists per week 1236 1234 1476 1240
Average unique tracks per week 1533 1701 1823 1808
Average unique track hours per week 69.4 84.7 77.3 96.6
Source: KPMG analysis of BBC radio play data
Furthermore, given that each of the BBC radio stations caters for a range of different audiences and tend to focus on different genres of music, there was limited overlap in the number of unique artists and tracks played across the four stations.
Our analysis of the data suggests that for the month, across the four stations combined, there were over:
• 9,500 unique artists played;
• 16,500 unique tracks played; and
• 800 hours of unique tracks played.
Through supporting a wide range of artists by providing radio airtime to them, this helps to promote their music to UK consumers.
And although the study is somewhat dated, evidence from the PRS based on 2010 data suggests that the BBC consistently plays more tracks per station than other commercial radio stations. For

53
example, 6Music played over 3,000 unique songs between mid-April and mid-May 2010 compared to just over 2,000 on NME Radio and around 750 on XFM152.
More recent BBC analysis also suggests that this is the case. BBC analysis153 suggests that in 2013-14, Radio 1 played a wide range of music, including new154 and UK music. It played almost twice as many different new tracks than any of the five other commercial stations monitored155. Not only that, the BBC found that of the new tracks played during the daytime on Radio 1, a third were not played by any of the commercial stations monitored, demonstrating a limited overlap between music played on BBC Radio 1 and commercial stations.
The evidence, therefore, suggests that not only does the BBC provide exposure to a wide range of artists through its radio broadcasting alone, this may be greater than that provided by other radio broadcasters. This is likely to be particularly the case for certain genres of music which tend to be underrepresented on the larger commercial radio stations but are picked up across the BBC stations.
In the next section of the report, we provide particular examples of the BBC’s support for a select number of individual music artists, and examine how the BBC contributed toward their careers, and hence contributed to their success and the economic returns they now deliver for the UK economy.
6.3.3 BBC support for music talent: music artist case studies
In order to continue to generate positive contributions to the UK economy from the music industry, it is important that both existing and new UK artists become and remain well known, and that there is a continually growing pool of music talent.
The core music industry is formed of:
• musicians and singers, composers, songwriters and lyricists;
• music publishers;
• music representatives; and
• music producers, recording studios and staff.
Together, they generate both recorded and live music.
It is key that there is an environment that gives song writers, producers and artists a ‘shop window’ – without that exposure, it is hard for them to become known and to monetise their product. Without this the economic contributions would be constrained.
As noted by UK Music156, the music industry is an ecosystem with success in one area propelling success in others. This is both in terms of the key players in the market as well as the commercial assets produced; musical composition can turn in to a recording, and lead to live performances, and these activities can evolve in to the artist developing a brand that is capable of generating value in its own right.
152 Page, W., A Songwriter’s perspective on 6 Music, Economic Insight, Issue 18, 20th May 2010
153 BBC Trust, Service Review: Radio 1, 1Xtra, Radio 2, Radio 3, 6 Music and Asian Network, March 2015
154 New Music is defined as either unreleased music or music released less than a month ago (physical release, not download release)
155 The BBC report does not include a full list of the commercial radio stations monitored. However, XFM and Absolute are named within the report
156 UK Music, Measuring Music, September 2014

54
The first important step in generating economic impacts from this cycle is activity to raise the profile of the artists’ music to support their breakthrough in to the industry.
The BBC supports this in a number of ways through a range of specific initiatives as well as its broadcasting activities.
The most obvious way the BBC offers support for new (and existing) talent is through exposure via airplay on its radio stations and appearances on a range of BBC shows such as Chris Evans on Radio 2, appearances and performances on television programs such as ‘Later…with Jools Holland’ and performances at live events such as Radio 1’s Big Weekend.
Special awards such as ‘BBC Music Sound of…’, which Sam Smith won in 2014 also recognise new artists and generate media attention157 as well as acting as a signalling tool for both the general population and to the music industry about up and coming artists.
Other BBC awards and talent schemes – of which there are currently 17 schemes including BBC Young Musician of the year and Radio 3 New Generation Artists – help in the discovery, as well as support, of new musical talent.
Through BBC Introducing, BBC Music also supports unsigned artists in the UK by providing a platform for promoting undiscovered musicians158. Artists are able to upload their own music to the BBC and the vast majority of these are then listened to by BBC producers at BBC Local Radio in order to identify talent and select artists to feature on the website, perform on the BBC Introducing stage at festivals and play on BBC Introducing slots on BBC Local Radio and on national BBC radio, for example on the BBC Introducing slot on the Radio 1 playlist.
BBC data suggests that:
• BBC Introducing has discovered 27 artists that have subsequently signed to major or significant independent record labels in the past 12 months;
• on average around 1,500 - 3,000 tracks are uploaded each month, of which over 80% are listened to by BBC producers; and
• over 130,000 artists are included within the BBC Introducing database, with around 500,000 tracks.
There is a range of highly successful artists, generating significant revenues, GVA and exports for the UK economy, that have been discovered through BBC Introducing. They include Florence and the Machine, George Ezra, Catfish and the Bottlemen and Jake Bugg.
Although it is not possible to fully estimate the economic impact the BBC has on the music industry through its support for music artists, it is possible to analyse to a certain extent their effect on specific individuals or songs.
To do so, we look at a number of case studies for select well-known and upcoming artists who have benefitted from BBC support in their careers. These artists were selected by the BBC as good examples of where they had supported artists and been influential in their careers.
157 http://www.bbc.co.uk/news/entertainment-arts-30225442
158 http://www.bbc.co.uk/programmes/articles/4wSZbmPkNVYMKpcHqPmkClp/frequently-asked-questions
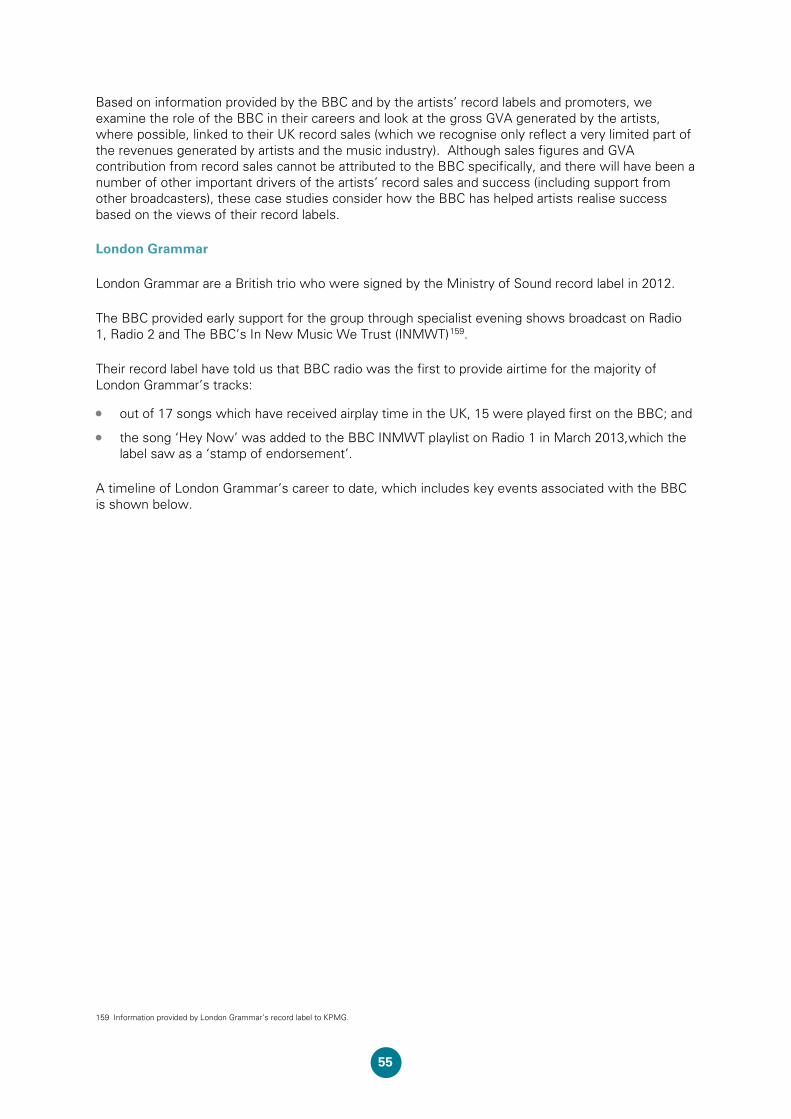
55
Based on information provided by the BBC and by the artists’ record labels and promoters, we examine the role of the BBC in their careers and look at the gross GVA generated by the artists, where possible, linked to their UK record sales (which we recognise only reflect a very limited part of the revenues generated by artists and the music industry). Although sales figures and GVA contribution from record sales cannot be attributed to the BBC specifically, and there will have been a number of other important drivers of the artists’ record sales and success (including support from other broadcasters), these case studies consider how the BBC has helped artists realise success based on the views of their record labels.
London Grammar
London Grammar are a British trio who were signed by the Ministry of Sound record label in 2012.
The BBC provided early support for the group through specialist evening shows broadcast on Radio 1, Radio 2 and The BBC’s In New Music We Trust (INMWT)159.
Their record label have told us that BBC radio was the first to provide airtime for the majority of London Grammar’s tracks:
• out of 17 songs which have received airplay time in the UK, 15 were played first on the BBC; and
• the song ‘Hey Now’ was added to the BBC INMWT playlist on Radio 1 in March 2013,which the label saw as a ‘stamp of endorsement’.
A timeline of London Grammar’s career to date, which includes key events associated with the BBC is shown below.
159 Information provided by London Grammar’s record label to KPMG.

56
Figure 17: London Grammar timeline
As shown in the timeline, the BBC has featured the band over recent years. Using sales data for London Grammar’s debut album, ‘If You Wait’ (released in September 2013), this figure shows a positive correlation between album sales and appearances/performances on BBC shows.

57
Figure 18: Weekly sales for ‘If You Wait’ album, September 2013 – October 2014
Weekly album sales increased after each of the BBC appearances. We cannot, with these data alone, establish a causal link between the two. In a number of cases, sales were on a steady upward trajectory prior to the band’s BBC appearance. And there were some upward spikes in sales that did not coincide with a London Grammar BBC television appearance. Nevertheless, it is notable from the chart that every time the band appeared on BBC TV, there was an uptick in its album sales. This is consistent with the wider empirical evidence outlined in Section 6.3.1 that increased artist media exposure tends to be positively related to record sales.
Further evidence from London Grammar chart positions and single sales160, generally also supports this:
• after London Grammar appeared on the Graham Norton Show on 7 February 2014, the album re-entered the Official Charts Company (OCC) Top 5 (at number 4), the iTunes Album Chart Top 5 and was the number 1 Amazon best seller;
• following this appearance, sales of singles from the album rose. Download sales of ‘Wasting my Young Years’ rose by approximately 30% the week after the show was broadcast and there was a 60% rise in sales for the single ‘Strong’. The uplift in sales continued in to the week following the appearance, with physical sales up by 10% and overall sales up 40% week on week;
• in the hour following the BBC Breakfast interview in May 2014, the album rose from number 33 on iTunes to number 6; week on week sales were up 190%; and physical retail stock requests rose by 1,186% following this and the band’s Ivor Novello Award win; and
• after the Later with Jools Holland appearance, the album climbed 2 places to number 7 in the OCC Album Chart. Sales also rose 20% on the previous week.
While record sales account for only a limited proportion of the overall revenues generated by artists (there are also revenue streams associated with royalties, performances, merchandising etc.), it is
160 KPMG analysis of sales and chart position data and wider information provided by London Grammar’s record label to KPMG
0
5,000
10,000
15,000
20,000
25,000
30,000
35,00009
/09/
2013
23/0
9/20
1307
/10/
2013
21/1
0/20
1304
/11/
2013
18/1
1/20
1302
/12/
2013
16/1
2/20
1330
/12/
2013
13/0
1/20
1427
/01/
2014
10/0
2/20
1424
/02/
2014
10/0
3/20
1424
/03/
2014
07/0
4/20
1421
/04/
2014
05/0
5/20
1419
/05/
2014
02/0
6/20
1416
/06/
2014
30/0
6/20
1414
/07/
2014
28/0
7/20
1411
/08/
2014
25/0
8/20
1408
/09/
2014
22/0
9/20
1406
/10/
2014
Sal
es P
er W
eek
29/10/2013Appeared
on 'Later... with Jools
Holland
12/12/2013Performed
in BBC's Live
Lounge
13/02/2014Performed in BBC's Live Lounge
07/02/2014Appeared
on the Graham
Norton Show
23/05/2014Appeared on BBC Breakfast
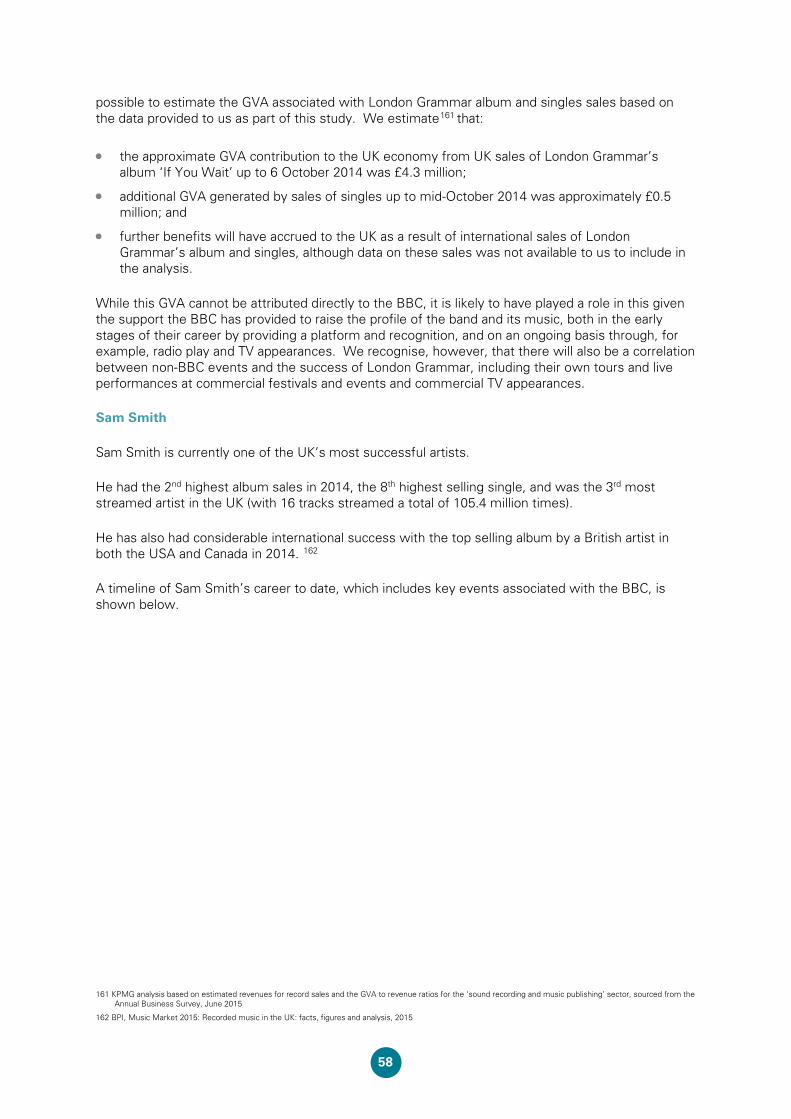
58
possible to estimate the GVA associated with London Grammar album and singles sales based on the data provided to us as part of this study. We estimate161 that:
• the approximate GVA contribution to the UK economy from UK sales of London Grammar’s album ‘If You Wait’ up to 6 October 2014 was £4.3 million;
• additional GVA generated by sales of singles up to mid-October 2014 was approximately £0.5 million; and
• further benefits will have accrued to the UK as a result of international sales of London Grammar’s album and singles, although data on these sales was not available to us to include in the analysis.
While this GVA cannot be attributed directly to the BBC, it is likely to have played a role in this given the support the BBC has provided to raise the profile of the band and its music, both in the early stages of their career by providing a platform and recognition, and on an ongoing basis through, for example, radio play and TV appearances. We recognise, however, that there will also be a correlation between non-BBC events and the success of London Grammar, including their own tours and live performances at commercial festivals and events and commercial TV appearances.
Sam Smith
Sam Smith is currently one of the UK’s most successful artists.
He had the 2nd highest album sales in 2014, the 8th highest selling single, and was the 3rd most streamed artist in the UK (with 16 tracks streamed a total of 105.4 million times).
He has also had considerable international success with the top selling album by a British artist in both the USA and Canada in 2014. 162
A timeline of Sam Smith’s career to date, which includes key events associated with the BBC, is shown below.
161 KPMG analysis based on estimated revenues for record sales and the GVA to revenue ratios for the ‘sound recording and music publishing’ sector, sourced from the Annual Business Survey, June 2015
162 BPI, Music Market 2015: Recorded music in the UK: facts, figures and analysis, 2015

59
Figure 19: Sam Smith timeline

60
Sam Smith’s record label explained to KPMG the importance of the BBC in his career, including for example:
• In October 2012 Annie Mac was the first to play and support his single ‘Latch’ (a collaboration with Disclosure). Sam Smith’s record label told us that this provided the artist with: “… the platform and exposure to build on and the BBC was unbelievably important for this”.
• We were told that Sam Smith’s first plays were always with Radio 1. For example, in January 2013, Sam Smith’s single ‘Lay Me Down’ was first played by Annie Mac and Zane Lowe at the BBC on Radio 1. Radio 1 was also the first station to play the single ‘La La La’ in April 2013.
• Sam Smith being named as BBC Music Sound of 2014 was: “… very significant in his career, propelling him to UK and international success …” according to his record label. In the 24 hours following the award, the artist’s sales increased from 1,000th on the Amazon album chart to 6th.
• ‘I’m Not The Only One’ being named as Track of the Day on Radio 1 also represented significant support provided by the BBC to the artist, according to his record label.
Sam Smith’s record label told KPMG that they: “…can’t advocate the BBC enough” regarding the importance of the support they have given the artist and the importance of that support to his emerging career.
Given Sam Smith’s UK and international success, his contribution to the revenues of the UK music industry is substantial:
• in 2014, Sam Smith sold 1,247,703 albums in the UK (with an estimated GVA of approximately £10.2 million); and
• in 2014, his UK single sales and streams were 2,935,108 (with an estimated GVA of approximately £2.9 million163 being generated as a result).
As well as the revenues associated with record sales, Sam Smith contributes additional revenues and GVA to the UK economy through live performances, global royalties and merchandising. Given the data available for our study, information on these revenue and GVA streams have not been available to us.
However, a 2013 study164 found that only 12% of the average musician’s income was from song writing and sound recordings. A larger proportion of top artists’ income was from song writing and sound recordings, but even this reached only around a third of the artist’s total income. For rock and pop artists, the study found revenues from song writing and sound recordings represented less than 20% of the artist’s total income, with live performances accounting for a larger share of income (other important categories being session work, merchandise and salary).
Insofar as Sam Smith, as one of the world’s biggest pop stars in 2015, has a similar income profile, it seems likely that the revenues and GVA coming into the UK from his live performances and merchandising are likely to be substantial in addition to the record sales described above.
163 KPMG analysis based on estimated revenues for record sales and the GVA to revenue ratios for the ‘sound recording and music publishing’ sector, sourced from the Annual Business Survey, June 2015. Sales figures sourced from BPI, Music Market 2015: Recorded music in the UK: facts, figures and analysis.
164 DiCola, P.C., Money from Music: Survey Evidence on Musicians’ Revenue and Lessons About Copyright Incentives, Northwestern University School of Law, January 2013

61
Ed Sheeran
Ed Sheeran moved to London in 2008 to pursue his career in the music industry.
By 2014, he had become the biggest selling artist in both the UK albums and singles markets. He also had the top selling album by a UK artist worldwide in 2014.165
A timeline of Ed Sheeran’s career to date, which includes key events associated with the BBC, is shown below.
165 BPI, Music Market 2015: Recorded music in the UK: facts, figures and analysis, 2015

62
Figure 20 Ed Sheeran timeline

63
Ed Sheeran’s record label told KPMG about the importance of the BBC from the start of his career:
• Ed Sheeran had his first ever play on Radio 1Xtra. KPMG was told by his record label that: “…without the right airplay and exposure, his success story would not have been possible”.
• His record label told us that Ed himself had said that: “…airplay is everything”.
• In April 2011, Zane Lowe made Ed Sheeran’s record ‘The A team’ the ‘Hottest Record’166. His label said that: “… one of the turning points was when Zane Lowe… embraced Ed which helped his already growing credibility”.
• Throughout his career, Ed Sheeran has been involved with a wide range of BBC music shows and events, including almost every show on Radio 1 (such as Zane Lowe, the Breakfast Show, Live Lounges, and Radio 1 Big Weekends).
Ed Sheeran’s UK and international success generates significant contributions to the UK.
Based on his total UK singles and album sales, we estimate that this has generated GVA in the UK economy of approximately £43million167 to date.
As noted in the case studies for other music artists, this only presents a very partial picture of his contribution to the UK economy. There will also be UK revenues, exports and employment generated, for example, through live performances, royalties, merchandising and linked to his brand. These are likely to be significant given that Ed Sheeran was ranked 3rd in the IFPI’s list of top global recording artists in 2014, selling approximately 4.4 million albums worldwide in 2014 and as he has undertaken two world tours in support of his second album ‘x’.
Ed Sheeran’s record label told KPMG that: “Radio 1Xtra and Radio 1 have been an enormous part of the Ed Sheeran phenomenon, it’s hard to put it into words but seeing him go from playing a gig at the Barfly to 3 Wembley stadiums in 3 years is as good as it gets and this could not have been done without the support of the BBC.”
Clean Bandit
According to their record label: “… Clean Bandit are a prime example why Radio 1 are so important in helping break new artists”.
Their single ‘Rather Be’, featuring Jess Glynne, was the most streamed track and the second highest selling single in the UK in 2014. They were also one of the UK’s breakthrough artists of 2014168.
A timeline of their career to date, which includes key events associated with the BBC, is shown below.
166 http://www.bbc.co.uk/blogs/zanelowe/2011/04/hottest_record_-_ed_sheeran_-.html
167 KPMG analysis based on estimated revenues for record sales and the GVA to revenue ratios for the ‘sound recording and music publishing’ sector, sourced from the Annual Business Survey, June 2015. Record sales data provided by the record label and average prices sourced from BPI, Music Market 2015: Recorded music in the UK: facts, figures and analysis.
168 BPI, Music Market 2015: Recorded music in the UK: facts, figures and analysis, 2015

64
Figure 21: Clean Bandit Timeline
Clean Bandit’s record label highlighted to KPMG the importance of the BBC to the band’s career:
• Radio 1 play-listed two singles and supported three before any other commercial radio station had played any of Clean Bandit’s music. The band’s record label told KPMG that before the release of the single ‘Rather Be’, “…[the] foundations that Radio 1 helped [Clean Bandit] secure were so important…”
• Their first ever radio interview was with Huw Stephens and they have performed on a number of Live Lounges, at two Radio 1 Big Weekends, on ‘An evening with Zane Lowe’ and with the BBC Philharmonic Orchestra live from Manchester.
• Clean Bandit made their debut television appearance on ‘Later… with Jools Holland’.
• Annie Mac played a Radio 1 exclusive of their ‘Real Love’ release with Jess Glynne.
• Radio 1’s support of Clean Bandit also helped the record label to introduce Jess Glynne who has gone from being a featured artist into the biggest selling new female of 2015.
Despite only breaking through in 2014, Clean Bandit’s significant single and album sales mean they have made important contributions to the UK music industry and wider economy. Based on sales

65
data provided by their record label we estimate that their record sales alone generated GVA of approximately £3.8 million169 to date.
Andreya Triana
Andreya Triana released her first album in 2010170.
Further details of her career to date are outlined in the timeline below.
Figure 22: Andreya Triana timeline
169 KPMG analysis based on estimated revenues for record sales and the GVA to revenue ratios for the ‘sound recording and music publishing’ sector, sourced from the Annual Business Survey, June 2015. Record sales data provided by the record label and average prices sourced from BPI, Music Market 2015: Recorded music in the UK: facts, figures and analysis
170 https://en.wikipedia.org/wiki/Andreya_Triana

66
As part of this study, KPMG spoke to both Andreya Triana’s record label and manager to understand the timing and nature of support she has received from the BBC and how, if at all, this has impacted on her career.
We were told by her manager that Andreya Triana has received “…incredible support from the BBC especially from Chris Evans at BBC Radio 2”. After appearing on BBC Radio 2, her album moved into the top 10. He also stressed to us the importance of the BBC as an early adopter of her music.
After releasing her second album ‘Giants’ on a small independent label, her manager told us that the BBC helped propel her from a well-respected artist in a niche area into the main stream.
He also told us that Andreya Triana’s regular appearances on the radio, including interviews with Jo Whiley, Dermot O’Leary and Terry Wogan have raised her profile and given her important exposure.
And, although her career is still building and developing, her manager told us that the BBC has opened up a wide number of opportunities to her which: “…would not have been available without the BBC’s initial support”. This has included performing with Take That at the O2 for the Rugby World Cup send off for the England Rugby team.
Given the early stages of her career Andreya Triana’s UK sales to date for her album ‘Giants’ are approximately 11,000 and for her single ‘Gold’ are around 13,000. The estimated revenues associated with these sales equates to a GVA of around £102,000. Again, this is only a partial picture of the artist’s total economic contribution which also includes any royalties and GVA associated with live performances or appearances.
Shaun Escoffery
Shaun Escoffery is a British soul artist whose first major release was the single ‘Space Rider’, released in March 2001. It was played regularly by the BBC Radio 1 DJ Trevor Nelson and The Dreem Teem and peaked at number 52 in the UK Singles Chart, followed by the UK number 53 hit ‘Days Like This’ in 2002.
Following a career in musicals, Shaun Escoffery has recently begun to release music again and his record label highlighted to us the importance of the support he has received from the BBC in raising his profile and giving him more mainstream exposure.
Further details of his career to date are outlined in the timeline below.

67
Figure 23: Shaun Escoffery timeline
His record label told KPMG that BBC Radio 2 provided substantial support for his new singles and his album, for example:
• His single ‘Natures Call’ was ‘A Listed’ in July/August 2014, which led to more than 40 local radio stations and a large number of regional commercial stations adding the single to their playlists. Following this the album also entered the Top 20 Independent Albums chart in the first week of release;

68
• His single ‘People’ was ‘A Listed’ in October/November 2014;
• His single ‘Nobody Knows’ was ‘A Listed’ in February 2015. In the 2 weeks following the playlisting of this single sales increased by 166%;
• His single ‘Perfect Love Affair’ was ‘A Listed’ in June/July 2015; and
• His album ‘In the Red Room’ was made Album of the Week in January 2015. In this week sales of album increased by 101%.
The BBC has also provided the platform for live performances across the network which have had a positive impact on Shaun Escoffery’s music sales.
For example, in November 2014 he performed live on Chris Evans’ show on Radio 2 and in the following 24 hours Shaun rose to Number 1 in Amazon’s Movers and Shakers Chart, with a sales increase of 913%. During the week the album’s overall sales through Amazon, HMV and digital stores increased by 342%.
Shaun Escoffery has also taken part in other events and shows across the BBC network.
In May 2015, he performed on Jools Holland’s show, and has also performed on many of the main shows on BBC Radio 2 e.g. on the BBC Breakfast show, Ken Bruce, Drivetime and Good Morning Sunday. Additionally, he performed at Radio 2 Live in Hyde Park in September 2015. On this same day his album sales increased by 12,890% and during the week sales increased by 722%. Also, his album re-entered the Amazon Top 100 and the Independent Albums chart.
Since the re-launch of his musical career, Shaun Escoffery has sold nearly 12,000 physical copies of his album and had in excess of 20,000 downloads, which we estimate equate to a GVA of approximately £0.3 million171 since he re-launched his career in 2014.
While these figures may be relatively modest at present, Shaun Escoffery’s record label told KPMG that these sales and contribution are: “…an 100% increase from when Radio 2 started supporting and they were definitely the main driving force”.
The label indicated that, for an artist on an independent label and with limited investment, the sales figures to date are good and provide a strong platform for his next album. KPMG was told that, “This would not have been possible without the strong commitment of Radio 2 from day one of the campaign.”
Shaun’s record label also told us that: “… [the BBC] acts as a door opener, providing a crucial platform and exposure which will allow Shaun to move on significantly with bigger label partners and investors. The key thing is that [Shaun’s] profile is such that he now has a platform to continue to increase revenues at an ever increasing rate as in [the music industry] it’s all about profile.”
6.4 The impact of BBC live music events In addition to providing radio, TV and online services, the BBC organises a wide range of different live music events.
171 KPMG analysis based on estimated revenues for record sales and GVA to revenue ratios for the ‘sound recording and music publishing’ sector, sourced from the Annual Business Survey, June 2015. Sales figures sourced from Nurture Music, and where a range of sales have been used, the average has been taken to calculate the GVA

69
As per the economic framework outlined in Section 3, these events generate GVA contributions (directly where the BBC generates revenues from the events, and indirectly through the economic activity generated through the supply chain). There will also be employment impacts, again both directly linked to the event and indirectly, as well as a range of wider spillover effects including wider business impacts in the local area through attendance, and music industry revenues generated linked to the relationship between artist exposure (supported though the live performance at the event) and revenues.
In this section, we provide an overview of some of the BBC’s live music events to demonstrate the scale of its activity through a range of descriptive statistics. We then consider the different channels through which the BBC’s hosting of live music events contributes to the UK economy.
Although it would be possible to quantify the economic impacts of the BBC events, provided sufficient data availability, this was not within the scope of our work. Therefore, we comment on the impacts from a qualitative perspective and refer to the results of existing economic impact reports where available.
Additionally, we do not analyse the potential displacement effects arising from BBC live performances which may arise, for example, from any decreased demand for attendance at alternative commercial live music events from the public.
6.4.1 Overview of BBC hosting and coverage of live music events
The BBC hosts a wide range of live music events each year including BBC Proms, BBC Radio 6 Music Festival and Radio 1’s Big Weekend. These are some of the BBC’s flagship events, and are wholly owned by the BBC.
Smaller events are also run by the BBC, including, Radio 2 in Concert, Radio 1 in Ibiza and BBC Radio 6Music Live at Maida Vale.
The BBC also covers various events as a broadcast partner, including Glastonbury, T in the Park, the Reading Festival and the Leeds Festival.
In order to assess the scale of the BBC’s hosting and TV/radio coverage of live music events and the scope of potential impacts, we have produced descriptive statistics relating to a subset of all BBC live music related activity over the last year. This analysis is not exhaustive and focusses only a number of the major events. Statistics relating to attendance, TV, radio and online reach of coverage and the number of artists performing are set out in the Table below.

70
Table 5: Key statistics relating to a subset of BBC live music events, May 2014- February 2015
Number of artists
performing Number of attendees
TV Reach (TV +3mins; Red Button
+1min) Radio Reach
Online reach including
iPlayer (by average number of requests)
Radio 1 Big Weekend Glasgow May 2014
55 50,000 TV average audience= 3.7 million
Red Button= 0.76 million
9.2 million 5.8 million
Last Night of the Proms (including Proms in the Park) September 2014
- 38,000 TV average audience= 9.0
million Red button= 0.72 million
1.8 million 0.2 million
Radio 2 in Hyde Park September 2014
27 48,400 Red Button= 1.65 million
4.5 million 0.7 million
Radio 1 Teen Awards October 2014
6 10,000 Red Button= 0.1 million
1.8 million 0.9 million
Radio 1Xtra Live November 2014
11 11,000 Red Button= 0.12 million
0.13 million 0.5 million
BBC Music Awards December 2014
17172 15,000 TV average audience= 4.17 million
5.6 million 2.0 million
6Music Festival February 2015
18 11,400 Red Button= 0.81 million
1.43 million 0.6 million
These seven events alone attracted over 180,000 attendees and achieved significantly greater reach through BBC TV, radio and online broadcasting of them.
This attendance and coverage, as well as activity directly related to the events’ hosting, generates economic impacts, including in the local area in which they are held.
6.4.2 Economic contributions of BBC live music events
As noted above, within the scope of this study we have not sought to quantify the economic impacts arising at the UK or local levels of BBC live music events. We also have not examined the potential displacement effects that may arise, particularly linked to a number of the events being free ticketed live music events. However, based on the economic framework developed we are able to assess the channels through which the BBC live music events impact on the UK music industry, and more widely the economy.
172 Including BBC Concert Orchestra

71
The first channel through which they contribute to the economy is in terms of GVA. According to a report by UK Music published in 2015, live music events generated £789 million in GVA in 2013, more than record sales, which generated £618 million173.
While a number of BBC live music events are free - BBC Radio 1’s Big Weekend is the biggest free ticketed event in Europe – and so do not focus on direct revenue generation, through the large range of suppliers to the event, indirect GVA and employment is generated.
Hosting a live music event involves the input of a host of suppliers, from stages, utilities, security, and caterers, to the artists performing, their promoters and agents and technical production companies. The revenues and GVA they generate, and employment they create, as a result of the BBC’s hosting of the event contribute indirectly to the economy.
Supplier spending for BBC Radio 1’s Big Weekend in 2014 totalled £2.1 million. This is revenue for suppliers on which GVA is generated as a result of the event both in the direct suppliers’ businesses but also through their wider supply chains.
Many of these economic impacts are localised given the BBC’s aim to use local suppliers for its live music events where possible. For example, 13 of the key suppliers to the 2015 6Music Festival held in Newcastle were based in Newcastle and the North. All of the stage crew, lighting, PA equipment and security were from local suppliers.
There are also a range of economic spillover effects associated with the BBC live events.
Through performing at the event, artists seek to increase public awareness and interest in their music in order to generate additional revenues, for example through increased record sales, ticket sales for subsequent performances and merchandise. Similar to the way in which radio play of records has a positive benefit for the music industry through the increased sale of the records, live events also act as a promotional tool for musicians and it would be expected that economic impacts arise from this through increased revenues for the artist and across the broader music industry ecosystem linked to this.
Furthermore, through attendance at the event there are wider impacts through the economy linked to spending on other activities or services related to attendance. This can include spending on hotels, transport, restaurants and in local retailers. As BBC events are hosted across the UK, these impacts will be spread across the country. While we do not have evidence of the extent of these impacts for BBC live music events, we note that a report by UK Music174 suggests that across the UK music industry 45% of live music events attendees are tourists, spending £3.1 billion every year, including direct and indirect spending.
Given the scale and scope of BBC live music events each year, and the various channels through which economic impacts related to them arise, the contributions to the economy are likely to be significant. Although we have not sought to quantify these impacts within this study we note that an existing study suggests that Radio 1’s Big Weekend in Glasgow contributed £3.7 million to local economy, with a further £10 million in press and marketing value. This is only one live event in a BBC schedule of numerous live music events each year and does not capture the extent of spillover effects, particularly relating to supporting music artists’ careers and assisting in their revenue generating potential. The overall economic impacts are likely to be substantial.
173 UK Music, Measuring Music, 2014
174 UK Music, Wish you were here: Music tourism’s contribution to the UK economy, 2015
72
Technical Appendix
The analysis in this report draws on a range of data, information and wider evidence gathered from the BBC and external sources, including publicly available information and interviews KPMG conducted with a number of third parties.
In this appendix, we set out a more detailed description on the approach taken to the analysis included within our report. It is structured in the order in which the analysis appears in the report.
The economic impact of the BBC in the North West of England
Contributing to the UK’s GVA
In order to estimate the indirect GVA contribution associated with the BBC’s activity in the North West of England, we first estimated the GVA associated with the Tier 1 suppliers supporting the BBC’s activity in the North West. This was done using the following formula:
In order to estimate the supplier contract value, we used an extensive supplier dataset provided by the BBC for FY2013/14 which included details of the Standard Industry Classification (SIC) code of each supplier175. Using this, we identified the proportions of pan-BBC supplier spending by SIC code. These proportions are given in Table 6. As explained in the main report, based on information provided by the BBC, we considered that the pan-BBC supplier spending proportions by SIC code would serve as a reasonable proxy for the BBC’s supply spending associated with its activity in the North West for FY2014/15.
The supplier spending proportions by SIC code are included in Table 6 below.
The sector averages for GVA as a proportion of output required for our calculations are also included in Table 6 below.
We then estimated the GVA associated with the wider supply chain supporting the BBC’s activity in the North West. This was done using the following formula:
The Tier 1 supplier GVA was estimated using the approach outlined above.
The sector specific ONS Type 1 GVA multipliers for each of the SIC codes are included in Table 6.
175 As explained in the main report this dataset had been augmented by Frontier for an earlier study for the BBC (Frontier, The contribution of the BBC to the UK creative industries: A report prepared for the BBC, April 2015)
Tier 1 supplier GVA = Supplier contract value x sector average GVA as proportion of output
Wider supply chain GVA = Tier 1 supplier GVA x (1- sector specific Type 1 GVA multiplier)

73
Table 6: Proportion of BBC supplier spending, GVA to output ratios, ONS Type I GVA multipliers and employment multipliers, by SIC code
SIC Code Industry description
Percentage of total BBC
spend GVA/Output
Ratio GVA
Multiplier Employment
Multiplier
1 Products of agriculture, hunting and related services
0.02% 39% 1.883800099 2.758900441
2 Products of forestry, logging and related services
0.00% 39% 2.407689456 1.491249976
3 Fish and other fishing products; aquaculture products; support services to fishing
0.00% 39% 1.542397793 1.219242879
6 Crude petroleum and natural gas & Metal ores
0.16% 33% 1.32031739 10.09037821
7 Crude petroleum and natural gas & Metal ores
0.00% 33% 1.32031739 10.09037821
8 Other mining and quarrying products 0.00% 33% 1.468153121 1.866088034
9 Mining support services 0.01% 33% 1.467933201 1.94813437
10
10.1 Preserved meat and meat products 0.00% 33% 3.142932359 2.435581661
10.3 Processed and preserved fish, crustaceans, molluscs, fruit and vegetables
0.00% 33% 2.162741038 2.025783339
10.5 Dairy products 0.00% 33% 5.137068468 3.227109167
10.6 Grain mill products, starches and starch products
0.00% 33% 3.250931299 4.47169328
10.7 Bakery and farinaceous products 0.00% 33% 1.762330597 1.455904346
10.8 Other food products 0.00% 33% 2.093194147 2.094625464
10.9 Prepared animal feeds 0.00% 33% 3.361341777 2.94397988
11.05 Alcoholic beverages 0.00% 33% 2.13942027 3.246533095
11.07 Soft drinks 0.00% 33% 2.743683355 4.602077051
13 Textiles 0.03% 33% 1.504538543 1.351511561
14 Wearing apparel 0.00% 33% 1.60121317 1.451335897
15 Leather and related products 0.00% 33% 1.512306219 1.584240942
16 Wood and of products of wood and cork, except furniture; articles of straw and plaiting materials
0.02% 33% 1.836138889 1.527123816
17 Paper and paper products 0.00% 33% 1.814380431 1.893178176
18 Printing and recording services 0.10% 33% 1.570628309 1.427418272
20.11 Industrial gases, inorganics and fertilisers (all inorganic chemicals) - 20.11/13/15
0.00% 33% 2.196244724 2.677763049
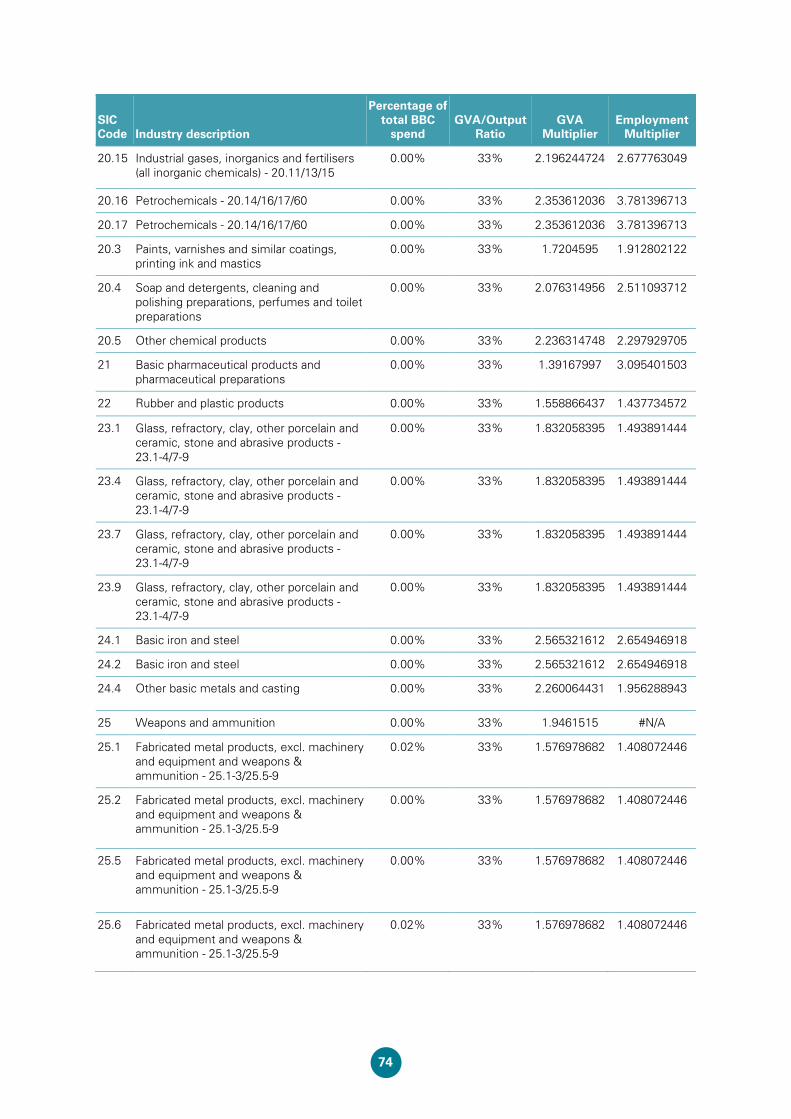
74
SIC Code Industry description
Percentage of total BBC
spend GVA/Output
Ratio GVA
Multiplier Employment
Multiplier
20.15 Industrial gases, inorganics and fertilisers (all inorganic chemicals) - 20.11/13/15
0.00% 33% 2.196244724 2.677763049
20.16 Petrochemicals - 20.14/16/17/60 0.00% 33% 2.353612036 3.781396713
20.17 Petrochemicals - 20.14/16/17/60 0.00% 33% 2.353612036 3.781396713
20.3 Paints, varnishes and similar coatings, printing ink and mastics
0.00% 33% 1.7204595 1.912802122
20.4 Soap and detergents, cleaning and polishing preparations, perfumes and toilet preparations
0.00% 33% 2.076314956 2.511093712
20.5 Other chemical products 0.00% 33% 2.236314748 2.297929705
21 Basic pharmaceutical products and pharmaceutical preparations
0.00% 33% 1.39167997 3.095401503
22 Rubber and plastic products 0.00% 33% 1.558866437 1.437734572
23.1 Glass, refractory, clay, other porcelain and ceramic, stone and abrasive products - 23.1-4/7-9
0.00% 33% 1.832058395 1.493891444
23.4 Glass, refractory, clay, other porcelain and ceramic, stone and abrasive products - 23.1-4/7-9
0.00% 33% 1.832058395 1.493891444
23.7 Glass, refractory, clay, other porcelain and ceramic, stone and abrasive products - 23.1-4/7-9
0.00% 33% 1.832058395 1.493891444
23.9 Glass, refractory, clay, other porcelain and ceramic, stone and abrasive products - 23.1-4/7-9
0.00% 33% 1.832058395 1.493891444
24.1 Basic iron and steel 0.00% 33% 2.565321612 2.654946918
24.2 Basic iron and steel 0.00% 33% 2.565321612 2.654946918
24.4 Other basic metals and casting 0.00% 33% 2.260064431 1.956288943
25 Weapons and ammunition 0.00% 33% 1.9461515 #N/A
25.1 Fabricated metal products, excl. machinery and equipment and weapons & ammunition - 25.1-3/25.5-9
0.02% 33% 1.576978682 1.408072446
25.2 Fabricated metal products, excl. machinery and equipment and weapons & ammunition - 25.1-3/25.5-9
0.00% 33% 1.576978682 1.408072446
25.5 Fabricated metal products, excl. machinery and equipment and weapons & ammunition - 25.1-3/25.5-9
0.00% 33% 1.576978682 1.408072446
25.6 Fabricated metal products, excl. machinery and equipment and weapons & ammunition - 25.1-3/25.5-9
0.02% 33% 1.576978682 1.408072446
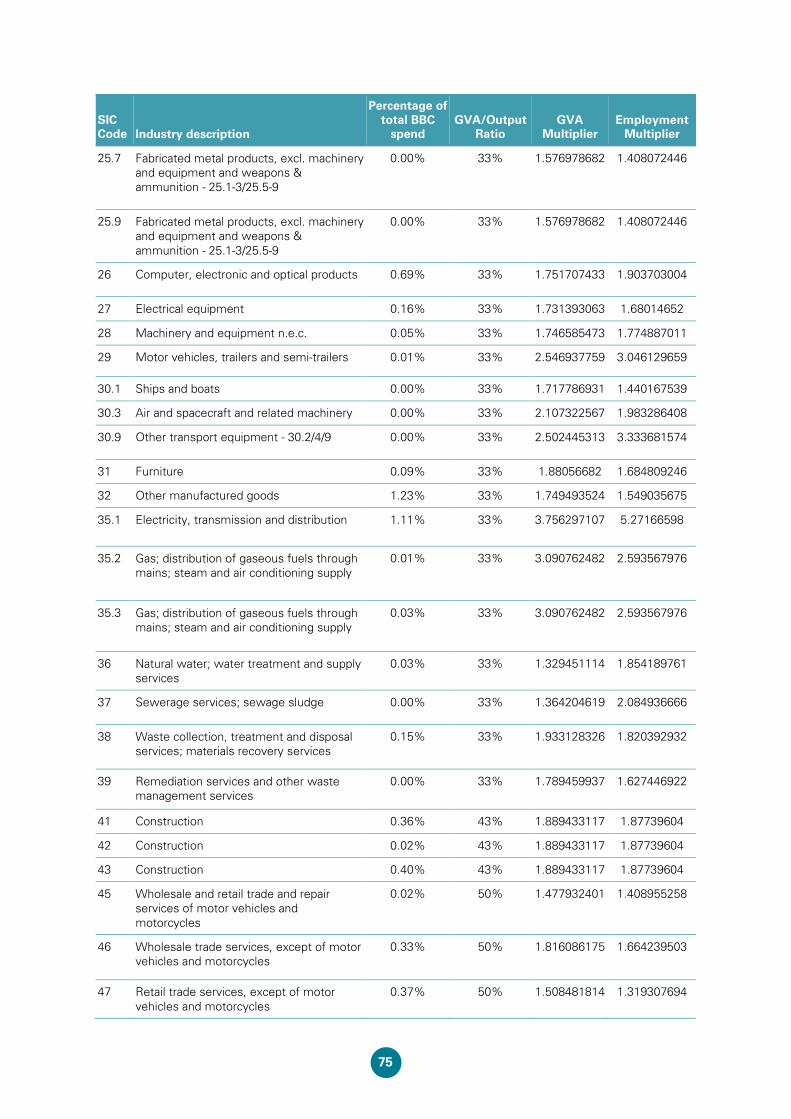
75
SIC Code Industry description
Percentage of total BBC
spend GVA/Output
Ratio GVA
Multiplier Employment
Multiplier
25.7 Fabricated metal products, excl. machinery and equipment and weapons & ammunition - 25.1-3/25.5-9
0.00% 33% 1.576978682 1.408072446
25.9 Fabricated metal products, excl. machinery and equipment and weapons & ammunition - 25.1-3/25.5-9
0.00% 33% 1.576978682 1.408072446
26 Computer, electronic and optical products 0.69% 33% 1.751707433 1.903703004
27 Electrical equipment 0.16% 33% 1.731393063 1.68014652
28 Machinery and equipment n.e.c. 0.05% 33% 1.746585473 1.774887011
29 Motor vehicles, trailers and semi-trailers 0.01% 33% 2.546937759 3.046129659
30.1 Ships and boats 0.00% 33% 1.717786931 1.440167539
30.3 Air and spacecraft and related machinery 0.00% 33% 2.107322567 1.983286408
30.9 Other transport equipment - 30.2/4/9 0.00% 33% 2.502445313 3.333681574
31 Furniture 0.09% 33% 1.88056682 1.684809246
32 Other manufactured goods 1.23% 33% 1.749493524 1.549035675
35.1 Electricity, transmission and distribution 1.11% 33% 3.756297107 5.27166598
35.2 Gas; distribution of gaseous fuels through mains; steam and air conditioning supply
0.01% 33% 3.090762482 2.593567976
35.3 Gas; distribution of gaseous fuels through mains; steam and air conditioning supply
0.03% 33% 3.090762482 2.593567976
36 Natural water; water treatment and supply services
0.03% 33% 1.329451114 1.854189761
37 Sewerage services; sewage sludge 0.00% 33% 1.364204619 2.084936666
38 Waste collection, treatment and disposal services; materials recovery services
0.15% 33% 1.933128326 1.820392932
39 Remediation services and other waste management services
0.00% 33% 1.789459937 1.627446922
41 Construction 0.36% 43% 1.889433117 1.87739604
42 Construction 0.02% 43% 1.889433117 1.87739604
43 Construction 0.40% 43% 1.889433117 1.87739604
45 Wholesale and retail trade and repair services of motor vehicles and motorcycles
0.02% 50% 1.477932401 1.408955258
46 Wholesale trade services, except of motor vehicles and motorcycles
0.33% 50% 1.816086175 1.664239503
47 Retail trade services, except of motor vehicles and motorcycles
0.37% 50% 1.508481814 1.319307694

76
SIC Code Industry description
Percentage of total BBC
spend GVA/Output
Ratio GVA
Multiplier Employment
Multiplier
49.1 Rail transport services 0.00% 50% 2.201835523 2.759946039
49.2 Rail transport services 0.00% 50% 2.201835523 2.759946039
49.3 Land transport services and transport services via pipelines, excluding rail transport
0.72% 50% 1.65328384 1.445835649
49.4 Land transport services and transport services via pipelines, excluding rail transport
0.54% 50% 1.65328384 1.445835649
50 Water transport services 0.01% 50% 2.58268893 7.628527472
51 Air transport services 0.01% 50% 1.86974989 2.322768253
52 Warehousing and support services for transportation
0.74% 50% 2.054926232 1.912949306
53 Postal and courier services 0.00% 50% 1.438890396 1.653601921
55 Accommodation services 0.04% 50% 1.629590426 1.318558362
56 Food and beverage serving services 0.25% 50% 1.566404394 1.248449507
58 Publishing services 0.30% 57% 1.638223866 2.057155555
59 Motion picture, video and TV programme production services, sound recording & music publishing & programming and broadcasting services
31.98% 57% 1.616467335 2.145464322
60 Motion picture, video and TV programme production services, sound recording & music publishing & programming and broadcasting services
0.65% 57% 1.616467335 2.145464322
61 Telecommunications services 6.90% 57% 1.452219323 1.888083423
62 Computer programming, consultancy and related services
8.10% 57% 1.398848045 1.523011471
63 Information services 0.72% 57% 1.405550182 1.677998087
64 Financial services, except insurance and pension funding
2.32% 49% 1.454199445 3.347636297
65.1 Insurance, reinsurance and pension funding services, except compulsory social security & Pensions
0.08% 49% 2.184759299 5.13881793
66 Services auxiliary to financial services and insurance services
0.16% 49% 1.474760136 1.415409902
68.1 Real estate services, excluding on a fee or contract basis and imputed rent
0.01% 74% 1.607346145 2.671942089
68.2 Real estate services, excluding on a fee or contract basis and imputed rent
0.02% 74% 1.607346145 2.671942089
68.3 Real estate services on a fee or contract basis
0.08% 74% 1.436902168 1.165905007
69.1 Legal services 3.20% 58% 1.32899183 1.335676625

77
SIC Code Industry description
Percentage of total BBC
spend GVA/Output
Ratio GVA
Multiplier Employment
Multiplier
69.2 Accounting, bookkeeping and auditing services; tax consulting services
0.75% 58% 1.22419793 1.19420757
70 Services of head offices; management consulting services
13.29% 58% 1.555829681 1.455832628
71 Architectural and engineering services; technical testing and analysis services
0.45% 58% 1.719639857 1.588892708
72 Scientific research and development services
0.07% 58% 1.801016127 1.567721481
73 Advertising and market research services 2.20% 58% 1.785299697 1.837550145
74 Other professional, scientific and technical services
0.53% 58% 1.569727651 1.727760614
75 Veterinary services 0.00% 58% 1.321947038 1.413974741
77 Rental and leasing services 1.19% 58% 1.396020497 1.658914009
78 Employment services 2.65% 58% 1.521464684 1.286498648
79 Travel agency, tour operator and other reservation services and related services
0.31% 58% 1.776401125 1.998145701
80 Security and investigation services 0.09% 58% 1.447569326 1.16157947
81 Services to buildings and landscape 0.04% 58% 1.722654652 1.326848621
82 Office administrative, office support and other business support services
9.26% 58% 1.49378505 1.454028597
84 Public administration and defence services; compulsory social security services
0.17% 58% 1.475669625 4.923518497
85 Education services 0.18% 58% 1.116793452 1.129538754
86 Human health services 0.06% 58% 1.175495786 1.12554486
87 Social care services 0.00% 58% 1.590786317 1.341751406
88 Social care services 0.29% 58% 1.590786317 1.341751406
90 Creative, arts and entertainment services 3.05% 65% 1.738609398 1.383030015
91 Libraries, archives, museums and other cultural services
0.04% 65% 1.700587953 1.662480998
92 Gambling and betting services 0.01% 65% 1.312723549 1.593392054
93 Sports services and amusement and recreation services
1.24% 65% 2.222058647 1.367141866
94 Services furnished by membership organisations
0.34% 65% 1.110695472 1.12135801
95 Repair services of computers and personal and household goods
0.00% 65% 1.421773702 1.306116866
96 Other personal services 1.49% 65% 1.447309168 1.20397128

78
SIC Code Industry description
Percentage of total BBC
spend GVA/Output
Ratio GVA
Multiplier Employment
Multiplier
97 Services of households as employers of domestic personnel
0.00% 65% 1 0
We estimated the induced GVA associated with the BBC’s activity in the North West using the following formula:
The Tier 1 supplier GVA was estimated using the approach outlined above.
The sector specific Type I and Type II GVA multipliers for each of the SIC codes were sourced from the Scottish Government176, given that the ONS does not produce Type II multipliers. The multipliers used to estimate the induced GVA effects are included in Table 7.
Table 7: Type I and Type II multipliers used to estimate the induced economic impacts177
Type I GVA multiplier
Type I employment
multiplier
Type II GVA multiplier
Type II Employment
multiplier
Agriculture 1.58 1.37 1.79 1.47
Forestry planting 1.29 1.26 1.52 1.42
Forestry harvesting 2.31 1.68 2.76 1.85
Fishing 1.47 1.22 1.69 1.33
Aquaculture 1.89 1.57 2.21 1.75
Coal & lignite 1.97 1.49 2.51 1.75
Oil & gas extraction, metal ores & other 1.40 1.40 1.62 1.61
Mining Support 1.20 1.42 1.35 1.79
Meat processing 2.95 2.38 3.52 2.63
Fish & fruit processing 2.25 1.99 2.76 2.28
Dairy products, oils & fats processing 3.03 2.83 3.63 3.15
Grain milling & starch 2.26 3.57 2.60 4.03
Bakery & farinaceous 1.38 1.30 1.74 1.53
Other food 1.50 1.56 1.84 1.84
Animal feeds 1.74 1.70 2.06 1.96
176 Scottish Government, Scottish Supply Use and Analytical Input-Output Tables, 1998-2012, Type I Leontief Table, Multipliers and Effects, all years, published July 2015. Scottish Government, Scottish Supply Use and Analytical Input-Output Tables, 1998-2012, Type 2 Leontief Table, Multipliers and Effects, all years, published July 2015.
177 Ibid
Induced GVA effects = (Tier 1 supplier GVA x Type II GVA multiplier) - (Tier 1 supplier GVA x Type I GVA multiplier)

79
Type I GVA multiplier
Type I employment
multiplier
Type II GVA multiplier
Type II Employment
multiplier
Spirits & wines 1.23 2.04 1.40 2.69
Beer & malt 1.26 1.46 1.45 1.75
Soft Drinks 1.55 1.86 1.91 2.30
Tobacco 0.00 0.00 0.00 0.00
Textiles 1.47 1.56 1.82 1.96
Wearing apparel 1.37 1.44 1.70 1.81
Leather goods 1.60 1.36 1.96 1.53
Wood and wood products 1.76 1.71 2.14 1.97
Paper & paper products 1.67 1.72 2.02 2.10
Printing and recording 1.30 1.27 1.60 1.51
Coke, petroleum & petrochemicals 1.68 2.86 1.95 3.54
Paints, varnishes and inks etc 1.35 1.33 1.59 1.55
Cleaning & toilet preparations 1.40 1.51 1.66 1.78
Other chemicals 1.16 1.32 1.46 1.86
Inorganic chemicals, dyestuffs & agrochemicals 1.34 1.53 1.56 1.88
Pharmaceuticals 1.08 1.40 1.24 2.18
Rubber & Plastic 1.51 1.55 1.86 1.87
Cement lime & plaster 1.79 1.65 2.21 1.96
Glass, clay & stone etc 1.43 1.28 1.80 1.52
Iron & Steel 1.59 1.39 2.02 1.66
Other metals & casting 1.48 1.25 1.85 1.44
Fabricated metal 1.31 1.31 1.64 1.62
Computers, electronics & opticals 1.27 1.43 1.54 1.79
Electrical equipment 1.44 1.46 1.81 1.81
Machinery & equipment 1.49 1.58 1.86 1.99
Motor Vehicles 1.49 1.67 1.85 2.09
Other transport equipment 1.93 2.18 2.39 2.75
Furniture 1.51 1.28 1.87 1.45
Other manufacturing 1.22 1.33 1.49 1.69
Repair & maintenance 1.40 1.74 1.69 2.09
Electricity 1.86 3.50 2.05 4.51
Gas etc 1.48 1.42 1.73 1.71
Water and sewerage 1.17 1.43 1.27 1.75
Waste, remediation & management 1.49 1.88 1.79 2.39
Construction 1.68 1.68 2.01 1.96
Wholesale & Retail - vehicles 1.24 1.21 1.51 1.40

80
Type I GVA multiplier
Type I employment
multiplier
Type II GVA multiplier
Type II Employment
multiplier
Wholesale - excl vehicles 1.57 1.64 1.88 1.92
Retail - excl vehicles 1.26 1.19 1.51 1.33
Rail transport 2.09 1.89 2.64 2.27
Other land transport 1.37 1.33 1.66 1.53
Water transport 1.65 2.53 1.93 3.09
Air transport 1.61 2.08 1.93 2.55
Support services for transport 1.62 1.66 1.97 1.95
Post & courier 1.23 1.19 1.56 1.38
Accommodation 1.26 1.16 1.51 1.27
Food & beverage services 1.27 1.16 1.51 1.27
Publishing services 1.25 1.28 1.57 1.51
Film video & TV etc; broadcasting 1.36 1.35 1.56 1.48
Telecommunications 1.28 1.41 1.54 1.76
Computer services 1.17 1.25 1.47 1.54
Information services 1.08 1.18 1.28 1.47
Financial services 1.22 1.45 1.43 1.74
Insurance & pensions 1.70 3.92 1.94 4.91
Auxiliary financial services 1.23 1.18 1.54 1.37
Real estate - own 1.28 1.88 1.38 2.18
Imputed rent 1.10 0.00 1.11 0.00
Real estate - fee or contract 1.20 1.22 1.36 1.35
Legal activities 1.17 1.17 1.38 1.33
Accounting & tax services 1.11 1.11 1.33 1.28
Head office & consulting services 1.47 1.34 1.76 1.46
Architectural services etc 1.46 1.61 1.76 1.95
Research & development 1.41 1.54 1.69 1.77
Advertising & market research 1.20 1.18 1.44 1.34
Other professional services 1.17 1.20 1.39 1.35
Veterinary services 1.25 1.13 1.49 1.23
Rental and leasing services 1.20 1.29 1.34 1.45
Employment services 1.23 1.18 1.53 1.31
Travel & related services 2.35 2.26 2.73 2.52
Security & investigation 1.15 1.07 1.46 1.16
Building & landscape services 1.20 1.14 1.46 1.24
Business support services 1.20 1.14 1.44 1.24
Public administration & defence 1.33 1.49 1.65 1.85
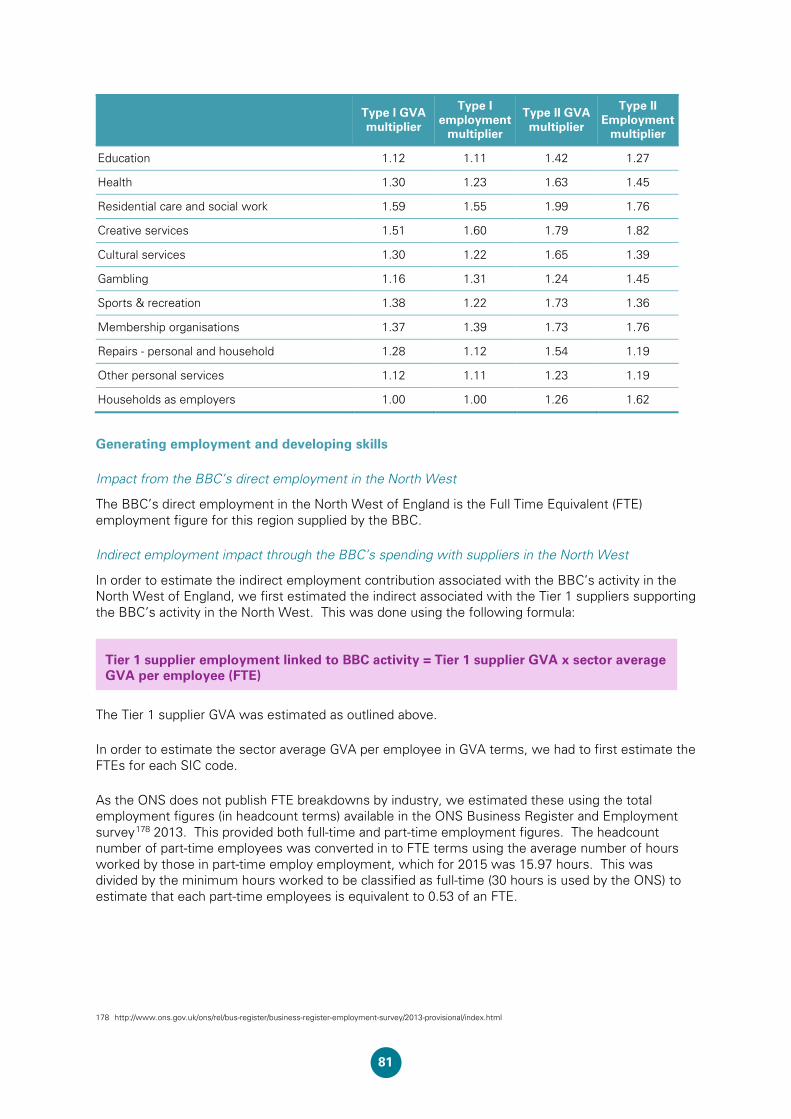
81
Type I GVA multiplier
Type I employment
multiplier
Type II GVA multiplier
Type II Employment
multiplier
Education 1.12 1.11 1.42 1.27
Health 1.30 1.23 1.63 1.45
Residential care and social work 1.59 1.55 1.99 1.76
Creative services 1.51 1.60 1.79 1.82
Cultural services 1.30 1.22 1.65 1.39
Gambling 1.16 1.31 1.24 1.45
Sports & recreation 1.38 1.22 1.73 1.36
Membership organisations 1.37 1.39 1.73 1.76
Repairs - personal and household 1.28 1.12 1.54 1.19
Other personal services 1.12 1.11 1.23 1.19
Households as employers 1.00 1.00 1.26 1.62
Generating employment and developing skills
Impact from the BBC’s direct employment in the North West
The BBC’s direct employment in the North West of England is the Full Time Equivalent (FTE) employment figure for this region supplied by the BBC.
Indirect employment impact through the BBC’s spending with suppliers in the North West
In order to estimate the indirect employment contribution associated with the BBC’s activity in the North West of England, we first estimated the indirect associated with the Tier 1 suppliers supporting the BBC’s activity in the North West. This was done using the following formula:
The Tier 1 supplier GVA was estimated as outlined above.
In order to estimate the sector average GVA per employee in GVA terms, we had to first estimate the FTEs for each SIC code.
As the ONS does not publish FTE breakdowns by industry, we estimated these using the total employment figures (in headcount terms) available in the ONS Business Register and Employment survey178 2013. This provided both full-time and part-time employment figures. The headcount number of part-time employees was converted in to FTE terms using the average number of hours worked by those in part-time employ employment, which for 2015 was 15.97 hours. This was divided by the minimum hours worked to be classified as full-time (30 hours is used by the ONS) to estimate that each part-time employees is equivalent to 0.53 of an FTE.
178 http://www.ons.gov.uk/ons/rel/bus-register/business-register-employment-survey/2013-provisional/index.html
Tier 1 supplier employment linked to BBC activity = Tier 1 supplier GVA x sector average GVA per employee (FTE)

82
Having derived the FTEs for each SIC code, the GVA for each corresponding SIC code was divided by this to give the average GVA per FTE. The analysis was conducted at the most granular level of SIC code possible (in the majority of cases the 4 digit SIC codes179).
We then estimated the indirect employment associated with the wider supply chain supporting the BBC’s activity in the North West using the following formula:
The Tier 1 supplier employment linked to BBC employment in the North West was estimated using the approach outlined above.
The sector specific ONS Type I employment multipliers for each of the SIC codes are included in Table 6 above.
We also estimated the induced employment associated with the BBC’s activity in the North West. This was done using the following formula:
The Tier 1 supplier GVA was estimated using the approach outlined above.
The sector specific Type I and Type II employment multipliers for each of the SIC codes were sourced from the Scottish Government180, given that the ONS does not produce Type II multipliers. The multipliers used to estimate the induced GVA effects are included in Table 7 above.
The economic impact of the BBC’s online activity
Given that many of the economic benefits arising from the BBC’s online activity are spillover effects, by nature these are much harder to quantify. Therefore, to assess the economic impacts arising from the BBC’s online activity we adopted a largely qualitative approach.
Where BBC Online expenditure data over time was available from the BBC we converted this in to real terms using RPI data sourced from the ONS181 and the latest Bank of England Inflation Report182. This applies to Figures 10, 11 and 12 in our report.
The RPI indices used are set out in the table below.
179 For 18 SIC codes FTE figures were not available at the 4 digit level. For 6 of these the 3 digit SIC code was used, for 8 the 3 digit SIC codes were used and for the remaining 4 SIC codes the 2 digit SIC codes had to be used.
180 Scottish Government, Scottish Supply Use and Analytical Input-Output Tables, 1998-2012, Type I Leontief Table, Multipliers and Effects, all years, published July 2015. Scottish Government, Scottish Supply Use and Analytical Input-Output Tables, 1998-2012, Type 2 Leontief Table, Multipliers and Effects, all years, published July 2015.
181 http://www.ons.gov.uk/ons/datasets-and-tables/data-selector.html?cdid=CHAW&dataset=mm23&table-id=2.1
182 Inflation for 2015 was assumed to be zero based on the inflation data included in the August 2015 Inflation report: Bank of England, Inflation Report, August 2015.
Wider supply chain indirect employment = Tier 1 supplier employment linked to BBC activity x (1- sector specific Type I employment multiplier)
Induced employment effects = (Tier 1 supplier employment x Type II employment multiplier) - (Tier 1 supplier employment x Type I employment multiplier)

83
Table 8: RPI data
Year RPI (1987 = 100) (December
values)
2008 212.9
2009 218.0
2010 228.4
2011 239.4
2012 246.8
2013 253.4
2014 257.5
2015 257.5
The economic impact of the BBC on the music industry
The BBC’s impact on artists’ exposure through radio broadcasting
One way in which we assessed the BBC’s impact on the UK music industry was to analyse the number of unique artists and tracks played on four of its major music playing radio stations.
In order to do this, we were provided with BBC detailed radio play data for each of the four BBC radio stations for each day in March 2015.
The dataset contained information on the name of each song played, the artist, the date and approximate time of play, and the length of time the song was played. The data were further segmented by programme (e.g. The Chris Evens Breakfast Show, Steve Wright in the Afternoon, The Radio 1 Breakfast Show with Nick Grimshaw etc.) and music category (e.g. commercial, library music and studio recording etc.).
However, the dataset contained duplicate entries for tracks where there was more than one artist performing the song. For example, the track ‘Uptown Funk’ by Mark Ronson and Bruno Mars, was listed twice in the dataset each time it was played – once with the artist listed as Mark Ronson and once with the artist listed as Bruno Mars.
There were also instances in the dataset where there were misspellings of artist names which meant that they appeared as unique artists when in fact they were not.
Therefore, in order to address these issues to identify unique tracks and artists (and so avoid overestimating in our results) the data was cleaned. The data was prepared for analysis by performing the following cleaning steps:
• Dropping duplicate entries so that each row in the dataset represented a unique combination of the variables. This was necessary to avoid double-counting songs that were entered more than once in the dataset yet had identical names, artists, and date, time and length of play, and were played in the same programme on the same station.
• Removing all song that contained “jingles” in the title and similar entries that were not music tracks.
• Correcting common inconsistencies in the spelling of artists’ names.

84
Although we were able to correct common inconstancies in spelling, completely removing these from the dataset would have to be performed manually which was not possible in the time available for our study. Having reviewed a sample of data, after the data cleaning process we identified that this issue affected only around 1% of remaining entries. Therefore, we consider that it does not materially affect the results that we present, although acknowledge that it leads to a marginal overestimation in the number of unique artists played by each radio station over the month.
BBC support for music talent: artist case studies
As part of the case study analysis of a number of musicians supported by the BBC we estimated the GVA of the record sales of each artist.
To do so, we first estimated the revenues associated with their record sales. In the majority of cases, these data were not provided by the artists’ record labels for confidentiality reasons. Therefore, we had to estimate it based on the number of records (singles and/or albums, either digital or physical) sold and the average prices for each of the types of records sourced from BPI Music Market reports183. These reports provided price data over time, split by type of record.
The price data used in our analysis are set out in Table 9 below.
Table 9: Average price of music albums and singles, 2010-2014184
2014 2013 2012185 2011 2010
Average price of album £ 7.64 £ 7.38 £ 7.14 £ 7.07 £ 7.35
Average price of digital album £ 7.30 £ 7.16 £ 6.75 £ 6.43 £ 6.11
Average price of single £ 0.94 £ 0.93 £ 0.92 £ 0.91 £ 0.90
Average price of digital single £ 0.94 £ 0.93 £ 0.88 £ 0.84 £ 0.80
While some of the record labels provided us with annual record sales (singles and/or albums), in some cases we were only provided with total figures for each single/album. Therefore, we had to apportion the sales to a relevant year. We attributed all sales to the year the record was released where this was the case. As prices have generally increased over time, as a result of this our revenue estimates are conservative.
In some cases, we were not provided with record sales split by each type of format (digital or physical). Where this was the case, we applied to these sales the average proportions of digital and physical sales for either singles or albums for the relevant year sourced from BPI Music Market reports186.
Having estimated revenues from record sales, we then estimated the associated GVA.
To estimate the direct GVA we applied the ratio of GVA to output for the ‘sound recording and music publishing’ sector, sourced from the ONS Annual Business Survey, June 2015 to the revenue figures.
183 BPI Yearbook 2014, BPI Yearbook 2012
184 BPI Yearbook 2014, BPI Yearbook 2012
185 This was calculated using the Constant Annual Growth rate of the price data between 2011 and 2014.
186 BPI Yearbook 2014, BPI Yearbook 2012

85
The indirect GVA effects were then estimated by applying the ONS Type I multiplier for the ‘Motion picture, video and TV programme production services, sound recording & music publishing & programming and broadcasting services’ sector. This multiplier is 1.62 as shown in Table 6 above.
We also estimated the induced GVA by applying the Scottish Government Type I and Type II multipliers for the ‘Motion picture, video and TV programme production services, sound recording & music publishing & programming and broadcasting services’ and taking the difference between the two.
We note that in UK Music’s187 assessment of the economic contribution of the UK music industry it is highlighted that official statistics for the music industry are imperfect due to the way that music maps poorly onto SIC codes. Therefore, for UK Music’s study a bespoke methodology was used based on accessing granular data from the Virtual Microdata Lab (VML) maintained by the ONS. It was not possible for KPMG to adopt this approach for the purposes of our analysis. Therefore, we had to rely on the imperfect SIC code data. We note that this may lead to underestimates in our assessment of the music artists’ GVA contributions from their record sales.
187 http://www.ukmusic.org/assets/general/UK_MUSIC_Methodology.pdf
© 2015 KPMG LLP, a UK limited liability partnership and a member firm of the KPMG network of independent member firms affiliated with KPMG International Cooperative (“KPMG International”), a Swiss entity. All rights reserved.
For full details of our professional regulation please refer to ‘Regulatory Information’ at www.kpmg.com/uk
This document is confidential and should not be disclosed or referred to in whole or in part, without my prior written consent. It should not be shown to anyone other than British Broadcasting Corporation and its professional advisors, or used for any other purpose.
This document has been prepared on the basis set out in our Engagement Letter addressed to British Broadcasting Corporation (the Client) dated 13 August 2015, and should be read in conjunction with the Engagement Letter.
We have not verified the reliability or accuracy of any information obtained in the course of our work, other than in the limited circumstances set out in the Engagement Letter.
This document is not suitable to be relied on by any party wishing to acquire rights against KPMG LLP (other than the Beneficiaries) for any purpose or in any context. Any party other than the Beneficiaries that obtains access to this document or a copy and chooses to rely on this document (or any part of it) does so at its own risk. To the fullest extent permitted by law, KPMG LLP does not assume any responsibility and will not accept any liability in respect of this document to any party other than the Beneficiaries.
The KPMG name, logo and “cutting through complexity” are registered trademarks or trademarks of KPMG International Cooperative (“KPMG International”).
www.kpmg.com