A Reference Architecture for Big Data Solutions
117
MASTER’S THESIS A Reference Architecture for Big Data Solutions Introducing a model to perform predictive analytics of enterprise data, combined with open data sources, using big data technology Author: Bas Geerdink Date: August 30, 2013 Utrecht University of Applied Science Faculty Science and Engineering P.O. box 182 3500 AD UTRECHT The Netherlands
Transcript of A Reference Architecture for Big Data Solutions

MASTER’S THESIS
A Reference Architecture for Big Data Solutions
Introducing a model to perform predictive analytics of
enterprise data, combined with open data sources, using
big data technology
Author:
Bas Geerdink
Date:
August 30, 2013
Utrecht University of Applied Science
Faculty Science and Engineering
P.O. box 182
3500 AD UTRECHT
The Netherlands

Big Data Reference Architecture
© Utrecht University of Applied Sciences
2
ACKNOWLEGDEMENTS
This document is the result of a study Master of Informatics that took two years. The study was
a fantastic journey into the world of informatics, business-IT alignment, architecture, business
strategy, and other subjects. The study and this research project have taken a lot of my time
and energy, and I could not have done it without the help of people close to me.
First, I would like to express my gratitude to all of the people who participated in the project. My
lectors Raymond Slot and Norman Manley gave excellent guidance and spend a lot of time
reviewing my material. Teachers Kobus Smit and Bas van Gils have helped me tremendously
by providing useful feedback.
Then, my fellow students. We had a great time during the past two years and have pulled each
other through at some moments. I would like to thank you for all the moments of joy and pain!
I would like to express a big 'thank you' to the team of experts, whose contribution to this
research project was voluntary and mostly in their free time. Next to the stakeholders mentioned
in this document, I got a lot of ideas and inspiration from my colleagues at CSC and ING.
Thanks, guys!
My family and friends were important to me during my study. I would like to thank them for
standing by and encouraging me, although I would have liked to spend more time in the
evenings and weekends with them.
Finally, I would like to thank Loes, the love of my life. She was a pillar of support throughout the
last two years and always displayed understanding of the time and effort that went into this
research. I promise I will make up the lost time!

Big Data Reference Architecture
© Utrecht University of Applied Sciences
3
TABLE OF CONTENTS
Acknowlegdements ................................................................................................................. 2
List of Tables & Figures .......................................................................................................... 5
Abstract .................................................................................................................................... 7
1 Introduction .................................................................................................................... 8
1.1 Problem statement ................................................................................................ 9
1.2 Research question .............................................................................................. 10
2 Literature Study ........................................................................................................... 11
2.1 Business Intelligence .......................................................................................... 11
2.2 Big Data............................................................................................................... 11
2.3 Open Data ........................................................................................................... 15
2.4 Predictive Analytics ............................................................................................. 18
2.5 Reference Architectures ...................................................................................... 20
2.6 Summary ............................................................................................................. 22
3 Research method ......................................................................................................... 23
3.1 Literature Review ................................................................................................ 24
3.2 Development of Reference Architecture ............................................................. 24
3.3 Justification / Evaluation of Reference Architecture ........................................... 26
3.4 Addition of Reference Architecture to the Knowledge Base ............................... 31
4 Findings and Discussion ............................................................................................ 32
4.1 Literature Review ................................................................................................ 32
4.2 Development of Reference Architecture ............................................................. 49
4.3 Results: the Big Data Solution Reference Architecture ...................................... 57
4.4 Justification / Evaluation of Reference Architecture ........................................... 80
5 Conclusion ................................................................................................................... 83
5.1 Observations ....................................................................................................... 83
5.2 Contribution ......................................................................................................... 85
5.3 Future Research ................................................................................................. 86
6 References .................................................................................................................... 88
Appendix I Literature Evaluation ..................................................................................... 98
I.I Components ........................................................................................................ 98
I.II Architecture Principles ........................................................................................ 99

Big Data Reference Architecture
© Utrecht University of Applied Sciences
4
I.III Architectural Best Practices .............................................................................. 100
Appendix II Results of Questionnaire ............................................................................ 101
II.I Section 1: Introduction ...................................................................................... 101
II.II Section 2: Impressions of the Big Data Solution Reference Architecture ......... 102
II.III Section 3: Quality of the Big Data Solution Reference Architecture ................. 103
II.IV Section 4: Additional questions ......................................................................... 104
Appendix III Options for Software Components ........................................................ 106
I.IV Importing Engine ............................................................................................... 106
I.V Processing Engine ............................................................................................ 107
I.VI Analytics Engine ................................................................................................ 111
I.VII Visualization Engine .......................................................................................... 113
I.VIII Management Engine ......................................................................................... 113
I.IX Distributed File System ..................................................................................... 114
I.X Distributed Database ......................................................................................... 115
I.XI Analytics Database ........................................................................................... 117

Big Data Reference Architecture
© Utrecht University of Applied Sciences
5
LIST OF TABLES & FIGURES
Figure 1: The convergence of hardware, application and data architectures to a stateless
"shared nothing" world is redefining the data foundation (Koff & Gustafson, 2011) ............... 13
Figure 2: Classification of open data platforms (Braunschweig et al., 2012) .......................... 17
Figure 3: The role of reference architectures (Cloutier et al., 2010) ....................................... 21
Figure 4: Information Systems Research Framework (Hevner et al., 2004) ........................... 23
Figure 5: The design of a reference architecture (Angelov et al., 2012) ................................. 24
Figure 6: Section 1, question 1 ................................................................................................ 29
Figure 7: Section 1, question 2 ................................................................................................ 29
Figure 8: Section 2, questions 1 to 4 ....................................................................................... 29
Figure 9: Section 2, questions 5 to 8 ....................................................................................... 30
Figure 10: Section 3, question 1 to 6 ....................................................................................... 31
Figure 11: Starfish architecture (Herodotou et al., 2011) ........................................................ 33
Figure 12: A conventional pipeline (top) compared to a streaming pipeline (bottom) (Law et al.,
1999) ........................................................................................................................................ 33
Figure 13: Conceptual architecture of service oriented DSS (Demirkan & Delen, 2012) ....... 34
Figure 14: Lambda Architecture diagram (Marz & Warren, 2013) .......................................... 35
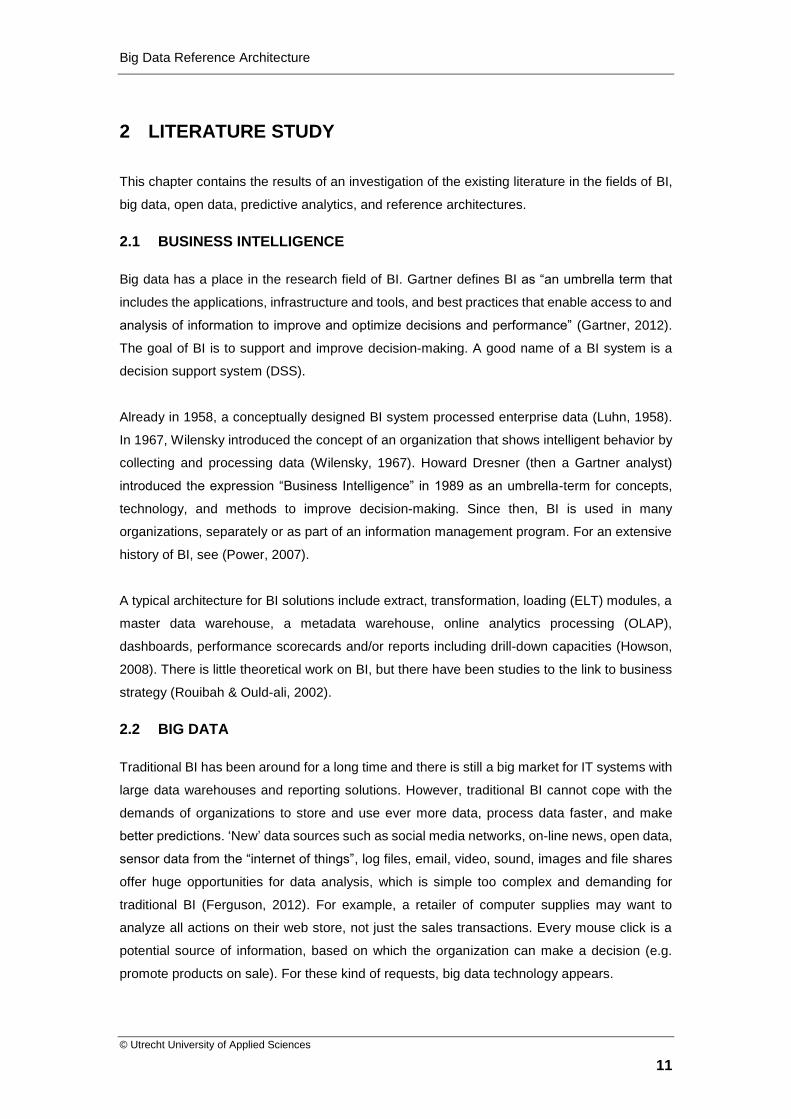
Figure 15: Big Data Enterprise Model (TechAmerica Foundation, 2012) ............................... 36
Figure 16: Hadoop environment of Karmasphere (Harris, 2012) ............................................ 37
Figure 17: Big Data Refinery architecture (Hortonworks, 2012) ............................................. 37
Figure 18: Big data solution architecture (Fujitsu, 2013) ......................................................... 38
Figure 19: Business Analytics Taxonomy (IDC, 2011) ............................................................ 39
Figure 20: Oracle Integrated Information Architecture Capabilities (Oracle, 2012) ................ 39
Figure 21: SAS Intelligence Platform (SAS, 2010) .................................................................. 40
Figure 22: SAS in-memory analytics (SAS, 2013) .................................................................. 41
Figure 23: Single Unified Architecture (MicroStrategy, 2013) ................................................. 41
Figure 24: Forrester Wave, Enterprise Hadoop Solutions, Q1 '12 (Forrester, 2012) .............. 43
Figure 25: Big Data Architecture (Anuganti, 2012) .................................................................. 44
Figure 26: Big Data Landscape (Busa, 2013) ......................................................................... 45
Figure 27: Reference Architecture for Big Data (Soares, 2012) ............................................. 46
Figure 28: Architectural Framework of ArchiMate (The Open Group, 2012) .......................... 54
Figure 29: Components & Interfaces of the Big Data Solution Reference Architecture .......... 61
Figure 30: Business Layer ....................................................................................................... 64
Figure 31: Application Layer .................................................................................................... 65
Figure 32: Processing Engine ................................................................................................. 68
Figure 33: Technology Layer ................................................................................................... 70
Figure 34: Framework for the evolution of reference architectures (Angelov et al., 2012) ..... 87

Big Data Reference Architecture
© Utrecht University of Applied Sciences
6
Table 1: The multi-dimensional space for reference architectures (derived from Angelov et al.,
2012) ........................................................................................................................................ 26
Table 2: Format for Defining Architecture Principles (The Open Group, 2011) ...................... 56
Table 3: The multi-dimensional space for the Big Data Solution Reference Architecture of type
3 ............................................................................................................................................... 57
Table 4: Examples of use cases for the Big Data Solution Reference Architecture ............... 59
Table 5: Code frequency for Components & Interfaces .......................................................... 60
Table 6: Data sources that can be used in big data architectures .......................................... 71
Table 7: Coding frequencies for Architectural Patterns ........................................................... 73
Table 8: Coding frequencies for Architecture Principles ......................................................... 75
Table 9: Loose coupling architecture principle ........................................................................ 76
Table 10: Interoperability architecture principle ....................................................................... 77
Table 11: Coding frequencies for Best Practices .................................................................... 78
Table 12: Average scores to quality criteria ............................................................................ 81
Table 13: Average scores to quality criteria ............................................................................ 84
Table 14: Hardware and software components in literature .................................................... 98
Table 15: Architecture principles in literature .......................................................................... 99
Table 16: Architectural best practices in literature ................................................................ 100
Table 17: Answers to question in section 1 ........................................................................... 102
Table 18: Answers to questions 1 to 4 in section 2 ............................................................... 102
Table 19: Answers to questions 5 to 8 in section 2 ............................................................... 102
Table 20: Answers to questions 1 to 6 in section 3 ............................................................... 104
Table 21: Options for the Importing Engine component ........................................................ 106
Table 22: Options for the Data Preparation Engine component ........................................... 107
Table 23: Options for the Data Exploration Engine component ............................................ 108
Table 24: Options for the Batch Processing Engine component ........................................... 109
Table 25: Options for the Stream Processing Engine component ........................................ 110
Table 26: Options for the Log Processing Engine component .............................................. 111
Table 27: Options for the Analytics Engine component ........................................................ 112
Table 28: Options for the Visualization Engine component .................................................. 113
Table 29: Options for the Management Engine component .................................................. 114
Table 30: Options for the Distributed File System component .............................................. 115
Table 31: Options for the Distributed Database component ................................................. 116
Table 32: Options for the Analytics Database component .................................................... 117

Big Data Reference Architecture
© Utrecht University of Applied Sciences
7
ABSTRACT
This thesis describes a research project with the goal of creating a reference architecture for
big data solutions. Big data is an evolution of the field business intelligence and at the same
time a revolution in terms of the business value it can bring to organizations. Cloud computing
and other inventions make massive parallel processing of data across a large amount of
commodity PCs possible. Following the big data breakthroughs, the field of predictive analytics
has received a boost, since boundaries of performance and costs have dropped significantly.
Thanks to big data technology, organizations can now register, combine, process and analyze
data to answer questions that perceived unsolvable a few years ago. An important part of the
big data realm is open data. Anyone can obtain or access these data sources directly from the
internet, ready to be combined with enterprise data. Useful predictions are possible by
combining the internal data of an organization to open data and linking the datasets in a
meaningful way.
Making the right predictions is only possible when organizations choose the right technology.
All the technology options call for a reference architecture that provides guidance to architects
for creating big data solutions. This solution reference architecture is an abstraction of 'real'
solution architectures. It aims to give guidance to organizations that want to innovate using big
data technology, open data sources, and predictive analytics mechanisms for improving their
performance. The purpose of the reference architecture is to help with setting up a concrete
architecture for big data solutions.
The Big Data Solution Reference Architecture was developed and evaluated with one iteration
of Hevner’s Information Systems Research Framework. Angelov’s framework for analysis and
design of software reference architectures guided the creative design process. An extensive
literature study and a qualitative research study using grounded theory on transcribed
interviews with big data experts forms the basis of the theoretical model. The resulting reference
architecture consists of an abstract diagram of components and interfaces, two architectural
patterns, two architecture principles, and two architectural best practices.
Ten big data experts evaluated the final reference architecture by answering a questionnaire
that measured several quality criteria. Their answers give the indication that the created model
is a reasonably good reference architecture for big data solutions, with good practical usability.
This model is of scientific and non-scientific importance, since it is be the first empirically
reviewed solution reference architecture for big data technology.

Big Data Reference Architecture
© Utrecht University of Applied Sciences
8
1 INTRODUCTION
The research field of business intelligence (BI) exists since the mid-1970s. The aim of BI is to
aid decision making in organizations, hence the name of systems in the BI-area is Decision
Support Systems. Organizations gather, process, and analyze enterprise data to gain insight in
the performance and success of internal business processes (Power, 2007).
Large organizations with few constraints on budget have since long analyzed extremely large
datasets. To name a few examples, the United States Department of Homeland Security
analyses computer systems and network traffic as part of its cyber-security program (U.S.
Department of Homeland Security, 2013), NASA simulates climate changes (Mangelsdorf,
2012), and CERN analyses gigantic datasets that are procured from its detectors in the Large
Hydron Collider when particles are collided at near-light speed (CERN, 2013). However, this
kind of data analyses was only attainable for a few organizations that have access to
supercomputers. Data in that size could only be processes in a reasonable amount of time
when using massive parallel-processing machines, for example the Titan system in the United
States or the JUQUEEN computer in Germany (Top 500 Supercomputers, 2012). BI in the
traditional way, using relational databases, OLAP cubes, and dedicated servers was not
powerful enough to process very large amounts of data, unstructured data, or multiple formats
of data in a reasonable amount of time.
However, in the past few years there were several technology breakthroughs in the BI
community. Thanks to cloud computing and the possibilities to use commodity hardware in
parallel, it is now possible to analyze very large datasets in a relatively short time for relatively
low costs. ‘Very large’ in this case means an order of magnitude 1000 more than before:
thousands of terabytes of data, thousands of servers to process and analyze the data.
According to McKinsey, “Big data refers to datasets whose size is beyond the ability of typical
database software tools to capture, store, manage, and analyze” (McKinsey Global Institute,
2011). The reported breakthroughs mark the start of a ‘big data’ era for ordinary organizations,
starting with Google who invented a paradigm to crawl internet sites and rank them for search
statistics using batch scripts that run across a multitude of ordinary PC components instead of
a supercomputer (Brin & Page, 1998).
Organizations in the public and private sectors now begin to see the benefits that exist in the
analysis of large datasets that reside in the organization when combined with open data
sources. With big data technology, organizations can now register, combine and process data
to make predictive analyses that where not possible a few years ago. Useful predictions are
possible by combining the internal data of an organization to open data and linking the datasets
in a meaningful way. For example, an organization that sells TVs could link its internal database

Big Data Reference Architecture
© Utrecht University of Applied Sciences
9
of TV models to an open dataset of TV reviews. It is possible to state the hypothesis that an
increase in positive reviews of a certain model will lead to more interest for the TV model, and
thus in more sales. The production department of the organization could prepare for that by
producing more TVs of that model.
These kind of predictions are only possible when organizations choose the right technology
and ask the right questions. This research project focusses on the components of solutions that
make these predictions possible. Its target is (architects of) organizations that want to innovate
using big data technology, open data sources, and predictive analytics mechanisms for
improving their performance.
This research project will greatly help organizations in their big data / open data projects. The
reference architecture, if proven successful, can be a solid basis for solutions that make use of
big data technology and open datasets to predict the future of an organization. The reference
architecture can serve as a guidance for architects working on big data projects. The reference
architecture will be of scientific and non-scientific importance, since it will be the first empirically
reviewed model for big data technology.
1.1 PROBLEM STATEMENT
The big data era has just begun; organizations are trying to find uses for the new possibilities.
Some business cases are eminent when searching for opportunities to analyze large datasets:
customer profiling using sales data, doing predictions of maintenance intervals of vehicles using
sensor data, etc. When combining big data technology with open data sources, the possibilities
for organizations are immense. To name a few: Twitter feeds can be used to gauge market
trends on which the prices of products can be based, and geospatial data of sickness can be
used to predict outbreaks of diseases.
The problem is that companies are eager to apply big data technology and use open data
sources, but are struggling to find a proper solution architecture for these projects. There is little
experience in the field, and there is almost no literature of renowned source. If only these
organizations could get some guidance in the form of a reference architecture, they would more
easily engage projects aimed at increasing their performance by creating IT systems that make
predictions of their enterprise data combined with open data. The results of this research project
will support architects in aligning strategy and direction to concrete implementations of
hardware and software technology.

Big Data Reference Architecture
© Utrecht University of Applied Sciences
10
1.2 RESEARCH QUESTION
The research question is:
“What is a good reference architecture for a solution that is able to use big data
technology to perform predictive analyses of open data sources combined with
structured, semi-structured, and unstructured enterprise data?”
The word “good” implies that the research project has the ultimate goal of creating a high-quality
reference architecture. Good in itself is an abstract word. However, the model must be
scientifically measurable. Therefore, concrete criteria have to be set that can assess the
reference architecture. Paragraph 3.3.2 describes these criteria and the selection method.
The underlying business goals of this research question are:
Organizations struggle with big data and open data projects. They require guidance for
working with the new technologies. A reference architecture provides this guidance in
the form of a model that can be adjusted and tailored for individual organizations;
Creating a solution reference architecture gives insight into the workings of big data
technology in organizations.
This research question has the following sub-questions:
Which architecture principles, patterns, and best practices are applicable when using
big data technology and open data sources to create a solution for predictive analysis
of enterprise data?
Which components from the field of big data are good building blocks to create a
solution architecture capable of predictive analysis of enterprise data, and in what
configuration?
In what way can open data sources help to perform predictive analytics of enterprise
data?
Is Angelov’s framework useful to create a reference architecture for big data solutions?
Is Hevner’s Information Systems Research Framework useful to create a reference
architecture for big data solutions?
Big Data Reference Architecture
© Utrecht University of Applied Sciences
11
2 LITERATURE STUDY
This chapter contains the results of an investigation of the existing literature in the fields of BI,
big data, open data, predictive analytics, and reference architectures.
2.1 BUSINESS INTELLIGENCE
Big data has a place in the research field of BI. Gartner defines BI as “an umbrella term that
includes the applications, infrastructure and tools, and best practices that enable access to and
analysis of information to improve and optimize decisions and performance” (Gartner, 2012).
The goal of BI is to support and improve decision-making. A good name of a BI system is a
decision support system (DSS).
Already in 1958, a conceptually designed BI system processed enterprise data (Luhn, 1958).
In 1967, Wilensky introduced the concept of an organization that shows intelligent behavior by
collecting and processing data (Wilensky, 1967). Howard Dresner (then a Gartner analyst)
introduced the expression “Business Intelligence” in 1989 as an umbrella-term for concepts,
technology, and methods to improve decision-making. Since then, BI is used in many
organizations, separately or as part of an information management program. For an extensive
history of BI, see (Power, 2007).
A typical architecture for BI solutions include extract, transformation, loading (ELT) modules, a
master data warehouse, a metadata warehouse, online analytics processing (OLAP),
dashboards, performance scorecards and/or reports including drill-down capacities (Howson,
2008). There is little theoretical work on BI, but there have been studies to the link to business
strategy (Rouibah & Ould-ali, 2002).
2.2 BIG DATA
Traditional BI has been around for a long time and there is still a big market for IT systems with
large data warehouses and reporting solutions. However, traditional BI cannot cope with the
demands of organizations to store and use ever more data, process data faster, and make
better predictions. ‘New’ data sources such as social media networks, on-line news, open data,
sensor data from the “internet of things”, log files, email, video, sound, images and file shares
offer huge opportunities for data analysis, which is simple too complex and demanding for
traditional BI (Ferguson, 2012). For example, a retailer of computer supplies may want to
analyze all actions on their web store, not just the sales transactions. Every mouse click is a
potential source of information, based on which the organization can make a decision (e.g.
promote products on sale). For these kind of requests, big data technology appears.

Big Data Reference Architecture
© Utrecht University of Applied Sciences
12
2.2.1 Definition
Big data is the term that is used for the field of analysis of large datasets. The origin of the term
‘big data’ goes back as far as the 1990s (Lohr, 2013). The term became widespread with an
article in The Economist in 2010 (The Economist, 2010). The amount of data in organizations
is growing rapidly. Data production will be 44 times greater in 2020 than it was in 2009 and
there will be a 650% growth in enterprise data in the next five years (CSC, 2012). In the near
future, many machines and other devices will get an IP address and connect to the web in the
‘internet of things’, providing even more data to be accessed (Ashton, 2009). However, big data
is not just about size; after all, what is ‘big’ is relative and changes across the years. Other
aspects of big data are the speed of data (e.g. streaming media) and the different types and
formats of the data (e.g. non-relational, semi-structured, or unstructured content). Therefore,
the definition of big data according to Gartner is “high volume, velocity and/or variety information
assets that demand cost-effective, innovative forms of information processing that enable
enhanced insight, decision- making, and process automation” (Gartner, 2012). Doug Laney
introduced this “3V” definition in 2001 (Laney, 2001). IBS and IBM provide another definition:
“Big data is a term associated with new types of workloads that cannot be easily supported in
traditional environments”, which indicates the switch from traditional BI to big data and the
relativeness of the term (Ferguson, 2012). IDC expects the big data technology and services
market to grow in revenue from $6 billion in 2011 to $23.8 billion in 2016. This represents an
annual growth rate of 31.7% (Vesset, et al., 2012).
2.2.2 Shared-nothing
A report of CSC’s Leading Edge Forum described big data as both an evolution and a revolution
(Koff & Gustafson, 2011). The evolution is the technology, which has just evolved along the
years. The revolution is the business opportunities that have suddenly risen from this evolution
of technology. CSC gives a good explanation of one of the fundamental technological
breakthroughs in big data: the “shared nothing” architecture. The convergence of hardware,
application and data architectures to a stateless "shared nothing" world, where each computing
node is independent and self-contained is one of the fundamental differences of big data
compared to the old “shared-disk” or “shared-memory” technologies of SAN clusters, relational
databases and client-server applications, which rely on a central data store (Stonebreaker,
1986). Shared nothing systems are scalable because adding extra computers (nodes) will not
impact the general performance as in causing a bottleneck. Figure 1 gives a visual
representation of the developments that led to the shared nothing architecture.

Big Data Reference Architecture
© Utrecht University of Applied Sciences
13
Figure 1: The convergence of hardware, application and data architectures to a stateless "shared nothing" world is redefining the data foundation (Koff & Gustafson, 2011)
Big data has its origin in parallel computation algorithms developed in the 1980s. Leslie Valiant
made an important contribution, when he introduced the Bulk Synchronous Parallel (BSP)
bridging model for parallel algorithms (Valiant, A Bridging Model for Parallel Computation,
1990). This model suddenly increased in popularity when multi-core processors in commodity
hardware became commonplace and clusters of multiple computers could connect over the
internet (Valiant, A bridging model for multi-core computing, 2010). The research fields of
parallel computing, cluster computing, distributed computing and cloud computing all originate
from these ideas. More recently, Google used the BSP model to create Pregel, a system for
large-scale graph processing in which graphs represent social networks (Malewicz, et al.,
2010). Pregel in its turn forms the basis of the Apache Giraph framework. Facebook uses this
framework to analyze the social graph of users and their connections, which is an excellent
example of big data (Ching, 2013).
2.2.3 Batch Processing
Big data technology is for analyzing very large collections of data sets on shared nothing,
parallel-distributed commodity hardware. A breakthrough came in 2004, when Dean and
Ghemawat introduced the MapReduce programming paradigm (Dean & Ghemawat, 2004).
MapReduce is a way to make use of commodity hardware and massive parallelism to process
very large datasets in batches. Google used this paradigm to crawl internet sites and rank them
for search statistics using batch scripts (Brin & Page, 1998). Once this technology became
widespread, it became the basis of a new wave of innovative technologies to analyze data.

Big Data Reference Architecture
© Utrecht University of Applied Sciences
14
Since a few years, it is possible to process data of a size that was previously not possible, at
an enormous speed.
2.2.4 Software
The world of big data technology has concentrated around a number of free and open-source
software (FOSS) components. A very important framework is the Apache Hadoop ecosystem,
which offers an implementation of the MapReduce algorithm and HDFS, a distributed file
system. The big data technology group includes more than MapReduce, for example the
underlying file system (e.g. GFS (Ghemawat, Gobioff, & Leung, 2003)) and database (e.g.
BigTable (Chang, et al., 2006) and HBase). There are a number of commercial products
available that provide enterprise solutions based on Hadoop, for example Cloudera,
Karmasphere, MapR, HortonWorks, and IBM InfoSphere BigInsights (Kolbielus, 2012). Other
examples of commercial big data products are Amazon Web Services Elastic MapReduce,
Infochimps Enterprise Cloud, EMC GreenPlum, Microsoft Windows Azure, and Google
BigQuery (Feinleib, 2012). Some system integrators such as CapGemini, Accenture, CSC, HP,
and Dell offer big data products and services to their clients.
2.2.5 NoSQL
Shared nothing architectures also form the basis of a relatively new type of lightweight, non-
relational database that are often part of a big data solution: NoSQL databases. The purpose
of these databases is to store unstructured and semi-structured data such as files, documents,
email, and social media. Carlo Strozzi coined the term “NoSQL” in 1998 when he developed a
database without a SQL interface (Lith & Mattson, 2010). In 2009, Eric Evans reintroduced the
term when he organized a meeting at Last.fm in San Francisco. Participants in the meeting
discussed several “open source, distributed, non-relational databases” databases: Voldemort,
Cassandra, HBase, Hypertable, and CouchDB (Evans, 2009). This was the beginning of the
NoSQL movement. Since then, databases with NoSQL-characteristics have won in popularity;
presently there are several variations and implementations (Edlich, 2013). In particular,
Google’s BigTable (Chang, et al., 2006) and Amazon’s Dynamo (DeCandia, et al., 2007) have
set the standard. Strozzi suggests renaming the NoSQL movement to “NoREL”, which would
be a better name for this database type since it abandons the relational model altogether
(Strozzi, 2012). There are certainly some drawbacks to NoSQL databases, for example an
increased rate of overhead and complexity, and a decreased reliability and consistency (Leavitt,
2010). However, these characteristics are an intended result of the design of NoSQL
databases; rather than the traditional relational databases which guarantee atomicity,
consistency, isolation, and durability (ACID) in transactions (Gray, 1981), NoSQL databases
are basically available, soft state, and eventually consistent (BASE), meaning that eventually
all data in a system will get updated and become consistent (Vogels, 2009). For a short
overview of NoSQL databases, see (Cattell, 2010).

Big Data Reference Architecture
© Utrecht University of Applied Sciences
15
2.2.6 Visualization
Big data can greatly benefit from visualization techniques. When analyzing very large amounts
of data, business users have to interpret the results. Text is difficult to process for people;
images and graphs are preferred over tables. Therefore, there is specialized software for big
data visualization. A good example an illustration of the human genome by the Circos tool,
showing location of genes implicated in disease, regions of with self-similarity and those with
structural variation within populations (Krzywinsk, et al., 2009).
2.2.7 Stream Processing
After MapReduce, several new technologies appeared that create even more possibilities for
organizations. An important technique is the streaming of high-speed data. Platforms such as
S4 (Neumeyer, Robbins, Nair, & Kesari, 2010), Twitter Storm, and Akka are capable of
processing enormous amounts of data in (near) real-time, by making use of clever algorithms
and the architecture principles that were already used for MapReduce: massive parallelism on
commodity hardware.
2.2.8 Data sources
Examples of big data sources are:
Astronomical data;
Climate data;
Credit card transactions;
Customer transactions in large supermarkets;
Digital books;
Enterprise email;
Genetic information, e.g. the human genome;
Health data, e.g. the combined heart pulse ratios of all patients in a hospital;
Mouse-clicks on the web;
RFID tags;
Sensor data from machines, e.g. trains, airplanes, construction tools;
Signals for intelligence analysis, e.g. used by ministries of defense;
Social media sites, e.g. Twitter and Facebook.
2.3 OPEN DATA
Open datasets are datasets which are publicly available for use. The impact that open data can
have becomes apparent in the true story of Moneyball, where a baseball team becomes very
successful with a marginal budget by using statistical analysis of player data (Lewis, 2004).
This kind of “data-first thinking” is becoming more fashionable in commercial and governmental
organizations, again pleading for the need for a reference architecture that combines the
strength of open data sources and big data technology.

Big Data Reference Architecture
© Utrecht University of Applied Sciences
16
2.3.1 Definition
As in free software, open data are ‘free’ as in ‘free speech’, not in ‘free beer’ (Stallman, The
Free Software Definition, 2013). According to opendefinition.org: “A piece of content or data is
open if anyone is free to use, reuse, and redistribute it — subject only, at most, to the
requirement to attribute and/or share-alike” (The Open Knowledge Foundation, 2009). The
European Commission wants to open up government data, because “information already paid
for by the public purse should not be paid for again each time it is accessed or used” (European
Commission, 2012). This research project extends the open data definition to incorporate
commercial open data sources, i.e. data is not free of charge. The reason for broadening the
scope is that otherwise the dataset would be too limited, and primarily originating from
governmental organizations. The reference architecture considers open data to be data that is
accessible for anyone, be it free or paid. This means that organizations who want to use Twitter
feeds, Facebook likes, financed sports data, and so forth, to combine with their enterprise data
in a big data solution will benefit from the resulting reference architecture. By extending the
open data definition, the reference architecture gets a wider scope and is suitable for more use
cases.
2.3.2 Repositories
Braunschweig et al. of the Technical University Dresden studied over fifty open data platforms
and found that, unsurprisingly, the current open data repositories vary greatly in size, domains,
technology, form, and purpose (Braunschweig, Eberius, Thiele, & Lehner, 2102). However, they
argue that the usefulness and appropriateness of open data sources is varied, and therefore
architects have to evaluate each source carefully before using it in an enterprise organization.
Subsequently, Braunschweig et al. created an overview of possible features of open data
platforms (sources) and datasets. They list requirements for a successful open data platform
and dataset, grouped into categories. For example, the API of a successful open data source
has the feature or requirement of fine-grain access and a successful dataset within that source
has indeed a granularity of raw data. The possible features and requirements formed the basis
of a classification model for open data platforms. Figure 2 contains a duplication of this model.

Big Data Reference Architecture
© Utrecht University of Applied Sciences
17
Figure 2: Classification of open data platforms (Braunschweig et al., 2012)
Figure 2 contains four categories (or dimensions) for classification of open data sources: Level
of Integration, Form of Access, organization, and Technical Implementation. Each category
contains two or three options for classification. Each option has a certain value, e.g. a
“Collection of Links” is a lesser form of open data than “Integrated Database”. Braunschweig et
al. used this classification model for a survey of open data repositories. The website of the
University of Dresden contains the results of the survey are published at (The Open Data
Survey, 2013). The findings were not encouraging: most open data repositories do not
implement standards, do not use open APIs, and contain data in a non-machine readable
format.
2.3.3 Open Science Data
Open science data is open data acquired through scientific research. Open data is recognized
as an important contribution to science; however there is still reluctance to publish datasets free
for anyone to use (Murray-Rust, 2008). An example of open science data is the Human Genome
Project, which created a map of human DNA. The US government released the resulting data
to the private sector to stimulate the biotechnology industry (U.S. Department of Energy
Genome Program, 2012). The European Commission recommends open access of scientific
data (European Commission, 2012). Other examples of places where scientific open data
sources are located are http://linkedscience.org/data and http://data.uni-muenster.de.
2.3.4 Variations
Open datasets come in two basic variations: dynamic and static. Updates to a static open
dataset only happen occasionally. For example, the dates of public holidays are only updated
once a year. Updates to dynamic open datasets are regular and these datasets provide (near)
real-time information. For example, weather data is updated almost continuously. Users can

Big Data Reference Architecture
© Utrecht University of Applied Sciences
18
acquired open datasets in many ways: as downloadable content on servers connected to the
internet, written on CDs or DVDs, etc. Modern ways to publish data is via APIs or web services
using SOAP or REST protocols, to make machine-readable datasets. When exchanging open
data, these protocols are important as they determine the data format and data access method.
Common open data protocols are Microsoft’s OData (Microsoft, 2013), Google’s GData
(Google, 2012), and W3C’s RDF (W3C, 2004) and SPARQL (W3C, 2013). Data management
systems such as CKAN (The Open Knowledge Foundation, 2013) can help to open, store, and
distribute datasets. There are websites that host open data for small groups, communities,
commercial or governmental organizations, for example http://datahub.io.
2.3.5 Examples
Examples of governmental open data sources are http://publicdata.eu/, http://data.gov,
http://data.gov.uk, http://data.overheid.nl, and http://data.worldbank.org. Examples of
commercial open data sources are The World Bank, Twitter (microblogging), LinkedIn
(business network), Kadaster (the Dutch national land registry office), RDW (Dutch national
registration of cars), and OpenWeatherMap (weather data).
2.4 PREDICTIVE ANALYTICS
Predictive analytics is a complex field of research that has its origin in Artificial Intelligence.
2.4.1 Definition
The aim of predictive analytics is to predict the future based on historical data, possibly
combined with open data sources. By making use of clever algorithms, and statistical models,
people working on predictive analytics try to find trends in the data and then project these trends
to say meaningful things about the upcoming events. The results of predictive analytics always
contain uncertainties. Predictions and forecasts contain a certain amount of probability, for
example: “There is a chance of 67% that a customer buys book A if he has already bought book
B, if we offer book A for the price of X”. In sophisticated models, the probabilities spread out in
a function, for example a normal distribution. This helps organizations to make decisions and
to mitigate risks. Techniques from the fields of statistics and machine learning can be used or
combined; a predictive analysis engine or forecasting program can contain regression models
and/or neural networks, for example in time series forecasting (Zhang, 2003). Examples of
concrete prediction methods are autoregressive integrated moving average (ARIMA) and
machine learning. The concept of a model is crucial in predictive analytics; the model
determines the prediction based on the data. This model is constantly adjusted, tuned,
optimized, and trained depending on the environment and altering insights of the users.
Predictive analytics is not a new research field. There are already a number of success stories,
for example in insurance companies (Nyce, 2007). It has recently received more attention due
to the big data era, since it has become easier to analyze large amount of data in various forms.

Big Data Reference Architecture
© Utrecht University of Applied Sciences
19
More data and more variations in data simply mean that more predictions are possible, with
more data sources. There are several free and open-source tools that can be used for predictive
analytics, including R, KNIME, Orange, and Weka. In addition, enterprise software vendors
such as Angoss, Alteryx, KXEN, Salford Systems, StatSoft, SAP, SAS, IBM, Tibco, and Oracle
provide solutions that help with analyzing data and predicting the future (Gualtieri, 2013).
2.4.2 Data Exploration and Discovery
A special case of predictive analytics and data mining is data exploration and discovery. Other
names for this research field are knowledge extraction and knowledge discovery. With big data,
it is possible to analyze and combine very many data from very many different sources.
Specialized software can identity relationships or clusters in those combinations of data sets,
which are invisible to the human eye (Fayyad U. M., Piatetsky-Shapiro, Smyth, & Uthurusamy,
1996). For example, by combining the family history of patients in a hospital with the diagnosis,
a computer program can identify if a certain disease has a genetic nature. Another purpose of
data exploration and discovery is the correlations between geographic data, email, video, and
other data sources in homeland security, to identify possible national security threats. With the
increasing use of the internet, a wealth of data is available that has real value in data exploration
and discovery use cases. For instance, web usage data, mouse clicks, and weblogs that
together determine the behavior of people possibly correlate to demographic data or healthcare
records.
The main difference between data exploration and discovery with other areas of predictive
analytics is that the order of data sources does not matter. In ‘normal’ predictive analytics, there
usually is a time sequence or transaction sequence, where in data exploration and discovery
the data is just ‘there’, in a random or unimportant order. In addition, data exploration and
discovery calls for a data-driven approach, whereas business questions or use cases drive
other methods of predictive analytics. In data exploration and discovery, there is no a priori
hypothesis for the results of the analysis.
There are several techniques and methods available from the fields of mathematics and
artificial intelligence that have a relation with data exploration and discovery, for example
association rule learning, spatial indices, affinity analysis, pattern recognition, and certain
machine learning algorithms (Fayyad, Piatetsky-Shapiro, & Smyth, 1996). Some commercial
vendors (e.g. SAS and IBM) offer solutions specifically for data exploration and discovery
(Cheung, Resende, Lindner, & Saracco, 2012). K-means, decision trees, deep learning (multi-
layered neural networks) and random forests (weighted multiple decision trees based on
randomly selected sets of variables) are the most successful prediction algorithms.
2.4.3 Drawbacks
Predictive analytics is a research field that offers huge opportunities and interesting business
cases, but performing predictive analytics can be very difficult. There is some debate about the

Big Data Reference Architecture
© Utrecht University of Applied Sciences
20
practical use of predictive analytics, and the real-world possibilities. Recently there has been
discussion if a tool such as Google Trends can actually predict the stock market (Leinweber,
2013). The discussion shows that scientists are debating the worth of predictive analytics tools.
Nate Silver described the difficulties of performing predictive analytics in his book of 2012
(Silver, 2012). He argues that although we have the tools of statistics and analytics, humans
fail to get to the real meaning of (big) data because of our limited understanding of uncertainty
and probability. These observations must serve as a reminder to the fact that technology such
as big data may not be the key to predicting the future. A reference architecture for big data
and predictive analytics will be helpful, but the architects and business people using it must
concern themselves about the complexity of the research field.
2.4.4 Examples
Some examples of specific uses for predictive analytics are:
Demand forecasting (e.g. in manufacturing, consultancy);
Disease outbreak detection;
Financial forecasting;
Forensic analytics;
Fraud detection (e.g. in credit card transactions, financial crimes in banks, claims, tax);
Predicting customer behavior based on historical sales data;
Predicting customer behavior based on social media sentiment analysis;
Video analysis.
2.5 REFERENCE ARCHITECTURES
A reference architecture is an abstraction of ‘real’ architectures. There are various forms of
reference architectures: enterprise reference architectures, solution reference architectures,
information systems reference architectures, etc. This paragraph explains the concept of a
solution reference architecture, and the various possible implementations.
2.5.1 Definition
A solution reference architecture is a skeleton for a solution, where the elements are templates
or outlines for components. According to Muller, architects can use a reference architecture as
guidance to create a concrete architecture for their organization, business context and
technology (Muller, A Reference Architecture Primer, 2008). A solution reference architecture
contains hardware and components, patterns and best practices, principles, and presents itself
in a visually appealing way. Typically, proven existing architecture form the basis for a reference
architecture. According to the Rational Unified Process, a reference architecture is “in essence,
a predefined architectural pattern, or set of patterns, possibly partially or completely
instantiated, designed, and proven for use in particular business and technical contexts,
together with supporting artifacts to enable their use. Often, these artifacts are harvested from
previous projects.” (Reed, 2002) This definition targets, so it is applicable for this research.

Big Data Reference Architecture
© Utrecht University of Applied Sciences
21
However, several authors have tried to generalize this definition. Cloutier et al. defined the true
purpose of reference architectures. Figure 3 contains a summary of their conclusions (Cloutier,
et al., 2010).
Figure 3: The role of reference architectures (Cloutier et al., 2010)
2.5.2 Framework for analysis and design
In 1996, the general framework for enterprise reference architectures GERAM was developed.
It contains an overview of the contents of a generic reference architecture (Bernus & Nemes,
1996). GERAM eventually evolved into a model with a methodology and enterprise-modelling
framework (IFIP–IFAC Task Force on Architectures for Enterprise Integration, 1999). Although
the model is very consistent, it is abstract is not as practical and hands-on as other frameworks.
Angelov et al. defined a more useful framework for the analysis and design of software
reference architectures (Angelov, Grefen, & Greefhorst, 2012). The framework contains
classifications of reference architectures, for different context of use of a reference architecture.
2.5.3 Varieties
A reference architecture can be either horizontal (industry-independent) or vertical (industry-
specific). Muller and Van de Laar researched architectural frameworks and architecture
methods, and found that these concepts are not domain specific, and thus horizontal, in
comparison to system and product line architectures. They argue that reference architectures
are similar to the system and product line architectures as they generally contain more domain
information, with the difference being mainly in the abstraction level; reference architectures
are abstract (Muller & Laar, Researching Reference Architectures and their relationship with
frameworks, methods, techniques, and tools, 2009). However, this research project aims for a

Big Data Reference Architecture
© Utrecht University of Applied Sciences
22
horizontal reference architecture, independent of industry or organization size. That provides
the risk that the reference architecture will become too general.
The aim of the Big Data Solution Reference Architecture is to be technology-independent. The
model will contain conceptual components, with a list of options as possible implementations.
These options are free and open-source projects such as Apache Hadoop and Cassandra, as
well as products and solutions of commercial big data vendors such as EMC, IBM, Microsoft,
Oracle, SAP, and SAS. The technology itself does not matter, the business value it brings does.
2.5.4 Examples
Examples of domain-specific, technology-independent reference architectures are AUTOSAR
for the automobile industry (AUTOSAR, 2013) and SAFE for federated enterprises, as part of
the MIKE2.0 standard for information management (McClowry, Rindler, & Simon, 2012).
The Dutch government used various reference architectures for different domains, for example:
NORA for all government organizations (Goutier & Lieshout, 2010);
GEMMA for local municipalities (KING - Kwaliteitsinstituut Nederlandse Gemeenten,
2011);
ROSA for educational organizations (Ministry of Education, Culture and Science,
2012);
The NICTIZ reference model for hospitals (Nictiz, 2013).
A solution reference architecture that is similar in scope and goal to the Big Data Solution
Reference Architecture is IBM’s SOA Solution Stack. IBM designed this reference architecture
for architects who are creating a service-oriented architecture solution. The model contains
elements from several layers like infrastructure, application, and business (Arsanjani, Zhang,
Ellis, Allam, & Channabasavaiah, 2007). In its broadest context, application platforms such as
Java EE and Microsoft SharePoint are domain-independent reference architectures; they
define the context for applications and provide tools, mechanisms, and best practices to help
developers create real solution architectures and software solutions.
2.6 SUMMARY
To summarize this literature study: the combined force of big data technology, predictive
analytics, and open data offers a wealth of possibilities for organizations that want to make
predictions about the future. There are plenty of free and open-source big data products and
frameworks. In addition, several commercial vendors offer big data products or as-a-service
platforms. Organizations will have to choose components for their big data solutions, and find
ways to approach the big data projects. A big data solution reference architecture will facilitate
and guide architects of these organizations.

Big Data Reference Architecture
© Utrecht University of Applied Sciences
23
3 RESEARCH METHOD
This chapter describes the research method for the research project. The method contains
three models: Hevner’s Information Systems Research Framework, Angelov’s framework for
designing reference architectures, and Kazman’s Software Architecture Analysis Method
(SAAM). The latter two are interpretations of the elements Develop/Build and Justify/Evaluate
of Hevner’s model.
Hevner’s model (Hevner, March, Park, & Ram, 2004) is the de facto standard for creating
information systems artifacts. It is perfectly suited to structure the design of the Big Data
Solution Reference Architecture, since that is an information system artifact based on business
needs and existing literature (the knowledge base). Figure 4 contains and overview of Hevner’s
model.
Figure 4: Information Systems Research Framework (Hevner et al., 2004)
In Hevner’s framework, the business needs of the ‘environment’ identify new artifacts, such as
the new to be developed reference architecture. In the Big Data Solution Reference
Architecture case, the problem statement of this research proposal contains the business needs
(see paragraph 1.1). Next, a loop of develop, justify, develop, justify … creates the artifact,
using the existing knowledge base. Finally, executing the two steps in the bottom of the diagram
apply the artifact to the environment, and make it an addition to the knowledge base.

Big Data Reference Architecture
© Utrecht University of Applied Sciences
24
The research project for a big data solution reference architecture executes all steps in Hevner’s
framework, with the exception of the application in the appropriate environment. The
assess/refine loop was completed once. More iterations would be desirable, as this would
increase the quality of the model over time; however, due to time restrains this was not possible.
In short, there were five steps in the research method. The numbers correspond to the blue
circles in Figure 4:
1. Problem statement (see paragraph 1.1) and literature review (see paragraph 3.1);
2. Development of reference architecture, using the existing knowledge base and the
expert interviews (see paragraph 3.2);
3. Justification / evaluation of reference architecture (see paragraph 3.3);
4. Addition of the reference architecture to the knowledge base (see paragraph 3.4).
The following paragraphs explain these steps in detail.
3.1 LITERATURE REVIEW
The first step in the research method is a literature review. By researching the existing
knowledge base of both scientific and non-scientific sources, the researcher got an overview of
the current state of affairs in BI, big data, open data, predictive analysis, and relevant reference
architectures. In Hevner’s model, the insights from the literature form a basis of the new
information system artifact. In the case of designing the Big Data Solution Reference
Architecture, the relevant literature was searched for elements that could be reused in the
model. For example, if the literature contains lists of software components for a big data
solution, these components could possibly be included in the reference architecture in an
abstract form.
3.2 DEVELOPMENT OF REFERENCE ARCHITECTURE
Angelov’s framework guided the development of the reference architecture. Figure 5 contains
an overview of the process.
Figure 5: The design of a reference architecture (Angelov et al., 2012)
The following paragraphs describe the steps in this process.

Big Data Reference Architecture
© Utrecht University of Applied Sciences
25
3.2.1 Define “Why”, “Where” and “When”
Angelov’s model requires a clear statement on the following aspects of the reference, before
commencing the design of the model:
The goal of the reference architecture (“Why”);
The application context of the reference architecture (“Where”);
The timing aspects of the reference architecture (“When”).
3.2.2 Classify the reference architecture
Next, the architecture type was classified using these “Why”, “Where” and “When” answers.
This gives the reference architecture a place amongst other reference architectures, in one of
the five types defined by Angelov et al.
3.2.3 Invite stakeholders (“Who”)
To gather more data for the creation of a reference architecture, the research conducted a
number of interviews with experts in big data, open data, and/or predictive analytics. The
interview data formed the basis for the reference architecture. Qualitative data analysis
techniques facilitated in acquiring the building blocks of the reference architecture.
3.2.4 Define “What” and “How”
The activity in this step was to define the following characteristics of the final reference
architecture:
The concreteness of the described components;
The representation, e.g. visually or text;
The level of details.
To generate the model (the reference architecture) from the data, the researcher conducted
several iterations grounded theory. Grounded theory is “theory that was derived from data,
systematically gathered and analyzed through the research process. In this method, data
collection, analysis, and eventual theory stand in close relationship to one another.” (Corbin &
Strauss, 2008) A central process in grounded theory is coding, a practice where the researcher
processes the transcripts of interviews (or other sources such as diagrams, field notes, etc.) by
labelling text and categorizing the labels (codes). When working in iterations, with each iteration
the code base diminishes in size as the understanding of the researcher grows and codes group
or combine. For more explanation of grounded theory and the coding process, see chapter 22
of (Bryman & Bell, 2007).
Performing grounded theory as qualitative analysis of the interview data produced concepts
that were used in the creation of the reference architecture. The researcher transcribed and
coded the interview data using qualitative data analysis (QDA) software. For example, if a large
number of architects mention a type of database, it will be logical to include that database in
the reference architecture. The interview data, together with the literature, gave insight into

Big Data Reference Architecture
© Utrecht University of Applied Sciences
26
concepts such as hardware and software components, frameworks, architecture principles, and
best practices that could serve as generic components in a reference architecture. As such, the
concepts coming from the qualitative data analysis of the interviews forms the basis of a new
reference architecture, which is actually a conceptual model for organizations when they start
working with big data technology and open data sources.
3.2.5 Summary
Angelov et al. created a model for creation and classification of reference architectures, wherein
answers to questions are guiding the type of a reference architecture. The model consists of
dimensions, split up in sub-dimensions. Each sub-dimension has a code and is linked to one
question, with the exception of sub-dimension ‘Design (D)’ in dimension ‘Goal (G)’, which is
linked to four questions (D1 – D4). The model is summarized in Table 1; the first column lists
the dimensions of the types of reference architectures, the second column contains the codes
and names of the sub-dimensions and the third column contains the questions (sometimes with
codes) that are linked to the sub-dimensions. The downward-pointing arrows indicate the logical
dependencies in the model; e.g. the possible answers to the “where”, “who” and “when”
questions follow from the answer to the “why” question.
Dimension Sub-Dimension Question
Goal G1 Why
↓
Context C1 Where
Context C2 Who
Context C3 When
↓
Goal G2 D1: What
Goal G2 D2: Detail
Goal G2 D3: Concreteness
Goal G2 D4: How
Table 1: The multi-dimensional space for reference architectures (derived from Angelov et al., 2012)
3.3 JUSTIFICATION / EVALUATION OF REFERENCE ARCHITECTURE
After creating the Big Data Solution Reference Architecture, it was justified and evaluated
according to the research design. This is step 3 in Hevner’s Information Systems Research
Framework (see Figure 4). Angelov’s framework for analysis and design of reference
architectures offers a good method for analysis of a reference architecture. In Angelov’s
analysis method, dimensions of a reference architecture produce a classification of the model.
While this method is perfectly usable for any reference architecture, applying it to the Big Data

Big Data Reference Architecture
© Utrecht University of Applied Sciences
27
Solution Reference Architecture would not produce any new insights, since the model was
already created by setting the dimensions (see paragraph 3.2 and 4.2). Therefore, the outcome
is already defined: the reference architecture will be of type 3.
Since Angelov’s framework is not suitable for the justification/evaluation phase, a short
literature search was done to select a proper method for the analysis of the Big Data Solution
Reference Architecture. The following paragraphs describe the selected method and the
implications for the remainder of the research project/
3.3.1 Method
The goal of the research project is to create a ‘good’ reference architecture. ‘Good’ means that
big data architects and other potential users consider the model of high quality. As stated in the
research question (see paragraph 1.2), ‘good’ and ‘high-quality’ are not concrete and
measurable. Therefore, these terms were ramified into concrete criteria.
There are several methods of evaluating (reference) architectures using criteria. Most of these
methods target a specific type of architecture, for example software architectures or enterprise
architectures. There are no known, well-documented methods for evaluating reference solution
architectures, in contrary to the analysis of software architectures. Abowd et al. compared the
architecture analysis methods questionnaire, checklist, scenarios, metrics, and
prototype/simulation/experiment (Abowd, et al., 1997). They found that a questionnaire is most
suitable for evaluating general architectures, with ‘coarse’ level of detail, in an early phase.
These characteristics suit the Big Data Solution Reference Architecture perfectly. Accordingly,
the questionnaire method was chosen for the analysis of the model.
3.3.2 Criteria
Dobrica and Niemalä analyzed the quality attributes of the most widely used software
architecture analysis methods (Dobrica, Liliana & Niemalä, 2002). They found that the Software
Architecture Analysis Method (SAAM) (Kazman, Bass, Abowd, & Webb, 1994) and its
derivatives focus on the criteria maintainability, portability, modularity, and reusability.
Examples of criteria used with the ATAM method (Kazman, et al., 1998), which is a successor
of SAAM, are modifiability, security, performance, and availability. The criteria of SAAM
functioned in an evaluation of a software reference architecture by Graaf et al. They found that
the SAAM method and the provided criteria are suitable for evaluating a reference architecture
(Graaf, Dijk, & Deursen, 2005). Therefore, the SAAM criteria form the basis for the evaluation
of the Big Data Solution Reference Architecture. The criteria of portability was removed from
the list, since it only relates to software architectures (regarding elements such as software
compilers and platforms), which is too specific for the Big Data Solution Reference Architecture.
Two additions were made to the list of criteria: performance and scalability. A big data solution
relies on the speed of data processing (velocity), so the reference architecture has to be
intrinsically high-performing. Since big data is about scale and size (volume), the solution

Big Data Reference Architecture
© Utrecht University of Applied Sciences
28
architectures that spring from the reference architecture have to be scalable. Therefore, the
reference architecture in itself has to incorporate scalability as well.
To summarize, the five criteria for the evaluation of the Big Data Solution Reference
Architecture are:
Maintainability: the ease with which the reference architecture and concrete
implementations of the reference architecture can be maintained in order to isolate and
correct defects or their cause, meet new requirements, make future maintenance
easier, or is able to cope with a changed environment. This is also known as robustness
or fitness;
Modularity: the compartmentalization and interrelation of the parts of the reference
architecture, which allows the reference architecture and its components to be
manageable for the purpose of implementation and maintenance. This is also known
as partitioning or loose coupling;
Reusability: the likelihood that the reference architecture and its components can be
used for other purposes and use cases. This is important for the model since it should
be flexible and generic;
Performance: the amount of useful work accomplished by the reference architecture
compared to the time and resources used;
Scalability: the ability of the reference architecture and its components to handle a
growing amount of work and its ability to be enlarged to accommodate that growth.
3.3.3 Questionnaire
To evaluate the Big Data Solution Reference Architecture, the researcher presented the model
to group of 50 big data specialists. The subject matter experts that were interviewed in step 3
were part of the invited group. Together with the reference architecture, this group was given a
questionnaire that targets the underlying criteria of a ‘good’ big data reference architecture, as
well as some additional characteristics. The researcher created the questionnaire on-line with
the software of Qualtrics and distributed it via a link in an email. Respondents could participate
anonymously in the survey. The questionnaire consists of four following sections. The following
sub-paragraphs contain the rationale behind these sections, and the contents of the
questionnaire.
3.3.3.1 Section 1: Introduction
The first section contains two closed multiple-choice questions that indicate the primary working
role and the level of knowledge and experience about big data and predictive analytics.
Answers to these questions can be used to filter the results, e.g. if a respondent would have no
knowledge and experience with big data the score would possibly not be relevant. Figure 6 and
Figure 7 display the questions and possible answers in this section, as presented to the
respondents on screen.

Big Data Reference Architecture
© Utrecht University of Applied Sciences
29
Figure 6: Section 1, question 1
Figure 7: Section 1, question 2
3.3.3.2 Section 2: Impressions of the Big Data Solution Reference Architecture
This section contains eight closed multiple-choice questions that evaluated the general
characteristics of the reference architecture. The first four questions asked after the likeliness
that the respondent will use the elements of the Big Data Solution Reference Architecture in his
or her daily work. The scale for this question is: very unlikely (score 1), unlikely (score 2),
undecided (score 3), likely (score 4), and very likely (score 5). Answers to this question will give
an indication of the usefulness of the model. Figure 8 contains an overview of the questions 1
to 4, as displayed to the respondents on screen.
Figure 8: Section 2, questions 1 to 4
In the following four questions, respondents were asked to rate some aspects of the reference
architecture on a scale of ‘poor’ to ‘excellent’. Answers to these questions will provide an
indication of the meaning of potential user of the reference architecture. These answers serve
as basis for future improvements to the, in subsequent iterations of Hevner’s framework. Figure
9 gives an overview of these questions, as presented to the respondents.

Big Data Reference Architecture
© Utrecht University of Applied Sciences
30
Figure 9: Section 2, questions 5 to 8
At the bottom of the section, a free text box offered the respondents the opportunity to give
explanatory remarks about their answers.
3.3.3.3 Section 3: Quality of the Big Data Solution Reference Architecture
The third section contains six questions that evaluate the quality of the reference architecture.
The questions and possible answers are displayed in a matrix, with the questions on the vertical
axis and the possible answers on the horizontal axis. Each question is a closed multiple-choice
question, related to one of the criteria (maintainability, modularity, reusability, performance, and
scalability). The criterion maintainability was evaluated by two questions: “Rate the reference
architecture […] on the ease with which it can cope with defects […]” and “Rate the reference
architecture […] on the ease with which it can meet new requirements […]” The other criteria
all have one related question, in the order of appearance as in the list above. There are five
possible answers to the questions (poor, fair, good, very good, and excellent) that correspond
to scores from 1 to 5. The combined view of scores on all criteria in section 3 gives an overview
of the quality of the Big Data Solution Reference Architecture. Figure 10 displays the questions
as presented to the respondents.

Big Data Reference Architecture
© Utrecht University of Applied Sciences
31
Figure 10: Section 3, question 1 to 6
At the bottom of section 3, a text box again offers the respondents the opportunity to give
explanatory remarks about their answers.
3.3.3.4 Section 4: Additional questions
Finally, section 4 contains three open questions that are optional to answer:
Is the reference architecture complete, or are any important components missing?
What are the strong and weak points of the reference architecture?
Please add any comments or questions in the text box below.
Answers to these questions can provide further insight in the perception of the Big Data Solution
Reference Architecture, and could contain valuable suggestions or possible improvements for
future work.
3.4 ADDITION OF REFERENCE ARCHITECTURE TO THE KNOWLEDGE BASE
In the fourth and final step of Hevner’s framework, the Big Data Solution Reference Architecture
will be published in a scientific journal. Next to that, the reference architecture will be actively
promoted in social media, conferences, seminars, and other media.

Big Data Reference Architecture
© Utrecht University of Applied Sciences
32
4 FINDINGS AND DISCUSSION
The previous chapter describes the research method. This chapter contains the results of the
research project.
4.1 LITERATURE REVIEW
As a first step, the researcher searched the existing literature for big data architectures. Both
scientific and non-scientific sources were used to get an overview of work that has been done
on architectures considering big data, open data, and predictive analytics.
After the literature review, in line with the research method explained in paragraph 3.1, an
evaluation of the literature identified the usable elements for the Big Data Solution Reference
Architecture. Paragraph 4.1.4 contains a description of that analysis.
This literature review consists of three parts:
Scientific sources, which lists peer-reviewed articles or journal proceedings (see
paragraph 4.1.1);
Commercial sources, which lists white papers and non-peer reviewed articles from
commercial vendors (see paragraph 4.1.2);
Private sources: blog posts, articles, and websites created by individuals (see
paragraph 4.1.3).
4.1.1 Scientific Sources
4.1.1.1 Herodotou et al.
In 2011, Herodotou et al. published a paper about Starfish, a self-tuning system for big data
analytics based on Hadoop (Herodotou, et al., 2011). The goal of Starfish is to get good
performance from Hadoop by automatically tuning the system. Figure 11 contains the
architecture of the Starfish ecosystem.

Big Data Reference Architecture
© Utrecht University of Applied Sciences
33
Figure 11: Starfish architecture (Herodotou et al., 2011)
Starfish is interesting from an architectural point of view as Starfish has its place in a very logical
ecosystem of big data products and frameworks. It is clear to see that Herodotou et al. see the
big data landscape as a pipeline of data: data input on the left is processed and analyzed using
tools such as Hadoop, HDFS, Pig, Hive, and Oozie, and finally published in a database on the
right side of the diagram.
4.1.1.2 Law, Schroeder, Martin, & Temkin
An architecture that is interesting for appliance in a big data solution is the multi-threaded
streaming pipeline architecture for large structured data sets by Law et al. (Law, Schroeder,
Martin, & Temkin, 1999). In this architecture, data splits into smaller bits, which go into a
pipeline. In doing so, a system built on this architecture is able to process large amounts of
data. The architecture relies on techniques such as multithreading, data separability, and
caching. Figure 12 explains the core concept of the architecture.
Figure 12: A conventional pipeline (top) compared to a streaming pipeline (bottom) (Law et al., 1999)

Big Data Reference Architecture
© Utrecht University of Applied Sciences
34
Figure 12 shows a data pipeline for visualization use cases, e.g. computer simulation. While a
conventional pipeline just processes data in line with the “Pipes and Filters” pattern (Avgeriou
& Zdun, 2005), the streaming pipeline of Law et al. uses clever caching mechanisms and
parallelization on small data pieces to achieve better performance.
4.1.1.3 Demirkan & Delen
In the field of decision support systems (or commonly referred to as business intelligence; see
paragraph 2.1), efforts are carried out to research the options for organizations to use big data
technologies and predictive analytics. One of those studies by Demirkan and Delen produced
an interesting conceptual architecture, see Figure 13 (Demirkan & Delen, 2012).
Figure 13: Conceptual architecture of service oriented DSS (Demirkan & Delen, 2012)
The interesting notion about this diagram and about the article in general, is that there is no
MapReduce engine in the architecture. The reason for this is probably that the authors
approach the subjects of big data and predictive analytics from a BI perspective, and their aim
was to create a service-oriented architecture. However, many elements surface that are
common to other architectures. First, the architecture contains a pipeline of data. The left side
of the diagram contains the data input, which is imported (ETL), managed and eventually
displayed on the machines on the right. A second notion is the traditional approach to data
storage: a data warehouse, data marts, and OLAP are central in the architecture. That means
big data is not necessary Hadoop, HDFS, and NoSQL. Further, Demirkan & Delen point out
that all software components can exist in on the ‘cloud’, as a service. That is interesting when
creating the reference architecture, since the abstract components, architecture principles, and
best practices have to be in line with that approach.

Big Data Reference Architecture
© Utrecht University of Applied Sciences
35
4.1.1.4 Marz & Warren
Marz and Warren introduced the concept of a Lambda Architecture for big data (Marz & Warren,
2013). Figure 14 contains a summary of this architecture.
Figure 14: Lambda Architecture diagram (Marz & Warren, 2013)
In a Lambda Architecture, big data solutions span three layers: the Speed layer, the Serving
Layer, and the Batch layer. Each layer has its own characteristics, and layer carries out a
specific type of computation. For example, the Batch layer is designed to run functions that can
be executed periodically (e.g. every day at night) and require a significant time to complete (e.g.
2 hours), such as a MapReduce job that processes all web clicks in a web store to determine
potential buyers’ behavior.
4.1.1.5 TechAmerica Foundation
The TechAmerica Foundation, which includes scientists of the Western Governors University
and North Carolina State University as well as analysts of IBM, SAP, and Amazon, examined
big data from a government perspective and created a “Big Data Enterprise Model”, replicated
in Figure 15 (TechAmerica Foundation, 2012). Although this model is not in a peer-reviewed
paper, the scientific nature and non-commercial goals of the framework justify the treatment of
this literature source as scientific.
Big Data Reference Architecture
© Utrecht University of Applied Sciences
36
Figure 15: Big Data Enterprise Model (TechAmerica Foundation, 2012)
TechAmerica’s model clearly shows some components we already encountered in other
literature, for example MapReduce and dedicated databases. Interesting elements of the model
are the structured, semi-structured, and unstructured data sources on the left side of the
diagram, which serve both as input and as output to the architecture. To use them,
TechAmerica defined abstract components in the “Infrastructure” layer and “Connectors” and
“Analytic Applications” in the “Accelerators” layer. The interesting notion about this model is that
is does not focus on the technology, but rather on the functional aspects of the architecture,
something which can be maintained in the Big Data Solution Reference Architecture.
4.1.2 Commercial Sources
4.1.2.1 Karmasphere
Karmasphere presents an example of an existing domain-independent reference architecture
for big data, built on Hadoop. Figure 16 contains an overview of this reference architecture
(Harris, 2012).

Big Data Reference Architecture
© Utrecht University of Applied Sciences
37
Figure 16: Hadoop environment of Karmasphere (Harris, 2012)
Karmasphere is one of the companies who have built a commercial offering on top of a free
and open source software stack. Their reference architecture (or environment) contains generic
building blocks in a layered structure. The model is consistent and complete, but since it is
abstract and high-level, the practical is limited. More concrete implementation options, more
descriptive text, and examples of real-world usage would improve the model.
4.1.2.2 Hortonworks
Hortonworks names the Apache Hadoop framework a data refinery, in analogy with the oil
industry (Hortonworks, 2012). This principle results in a reference architecture as depicted in
Figure 17.
Figure 17: Big Data Refinery architecture (Hortonworks, 2012)

Big Data Reference Architecture
© Utrecht University of Applied Sciences
38
Hortonworks’ model is interesting because it is a very simple representation of a big data
reference architecture, in which many software components find a place that are also in the
other literature: structured and unstructured data sources, Hadoop, HBase, Hive, traditional BI,
various types of databases, etc. That makes the Big Data Refinery model an interesting basis
to build the Big Data Solution Reference Architecture on, although it would need concretization
and expanding.
4.1.2.3 Fujitsu
In 2013, Fujitsu published a white paper that presents “approaches” for creating big data
solutions (Fujitsu, 2013). Figure 18 contains the high-level overview of a typical big data solution
that is included in the paper.
Figure 18: Big data solution architecture (Fujitsu, 2013)
This paper is an extension to a white paper of 2012, in which Fujitsu elaborates on linked (open)
data and gives thoughts about the ways to exploit big data (Mitchell & Wilson, 2012). Fujitsu
identifies three platforms (data sources, analytics, and access) and four main steps (extract &
collect, clean & transform, analyze & visualize, decide & act) in the process of big data analysis.
There are four types of data in the diagram: various data, consolidated data, distilled essence,
and applied knowledge. By its simplicity, this reference solution architecture is very
understandable and applicable to many use cases. On the downside, the model combines high-
level components with detailed instructions for usage. For example, an in-memory database
(IMDB) apparently lives in multiple places, touched by several data flows.
4.1.2.4 McKinsey
McKinsey has not actually defined an architecture for big data, but their 2011 report contains a
list of technologies and abstract software components that are important for big data (McKinsey
Global Institute, 2011). The list includes obvious things such as MapReduce, but also highlights
several components on the outskirts of a big data architecture such as genetic algorithms,
neural networks, sentiment analysis, and predictive modeling. These concepts are included in
the analysis for the definitive reference architecture.

Big Data Reference Architecture
© Utrecht University of Applied Sciences
39
4.1.2.5 IDC
In 2011, Philip Carter of IDC published a white paper that dives into the ‘future’ architectures of
big data analytics (Carter, 2011). Besides giving an interesting overview of the rise of analytics,
Carter describes a taxonomy of tools and components that make up a big data solution and
gives a list of big data technologies. Figure 19 contains a reproduction of the taxonomy.
Figure 19: Business Analytics Taxonomy (IDC, 2011)
This taxonomy contains components from traditional BI and the ‘new world’ of big data
analytics. What is interesting in this model is that Carter created a unique abstraction and
classification of real-world software components, thereby giving architects a conceptual
framework alike a reference architecture to work with. Further, the model focuses on the
business aspects of analytics, while at the same time providing a generic overview (not industry-
specific) of components.
4.1.2.6 Oracle
Software giant Oracle produced a holistic capability map that contains many big data
components (Oracle, 2012). Figure 20 contains an overview of the capability map.
Figure 20: Oracle Integrated Information Architecture Capabilities (Oracle, 2012)

Big Data Reference Architecture
© Utrecht University of Applied Sciences
40
The beauty and usefulness of Oracle’s model is in the pipeline approach (Data Acquire
Organize Analyze Decide), and the abstract components that are displayed. Oracle
elaborated on this model in their white paper of February 2013, in which an Information
Management and Big Data Solution Reference Architecture is presented (Oracle, 2013). In that
paper, Oracle identifies as key architecture principles: “treating data as an asset through a
value, cost, and risk lens, and ensuring timeliness, quality, and accuracy of data”.
4.1.2.7 SAS
Software vendor SAS has many products and service with big data technology. SAS focuses
mainly on the high-performance side of big data. Their technology stack includes in-memory
databases and in-memory analytics, aimed at doing analytics as close to the data as possible
(SAS, 2012). SAS adds two new dimensions to the “3V” model: Variability and Complexity.
According to SAS, the increasing amount of data and the increasing variety in usable data
sources results in an increasing amount of linking, matching, and transformation of data across
organizations and applications.
The SAS Intelligence Platform contains an overview of the SAS landscape (SAS, 2010). This
model is a reference architecture for organizations who want to use SAS products. Figure 21
contains a duplication of the SAS Intelligence Platform.
Figure 21: SAS Intelligence Platform (SAS, 2010)
The SAS Intelligence Platform is a combination of traditional BI and big data, the latter in the
form high-performance analytics tools. Since this model is from 2010, it is possible that it is
outdated and will be replace by a newer version soon. Typical big data components such as a
distributed file system and NoSQL database are missing. This is because SAS primarily uses
its own products, but also due to the age of the Intelligence Platform and the traditional BI point
of view. In several recent publications, SAS highlights its dedicated big data solutions. For
example, Figure 22 displays a model from SAS that is specific for in-memory big data analytics
(Mendelsohn, Chew, Kent, & Holmes, 2013). This model contains several modern big data tools
such as unstructured data sources, streaming data, Hadoop, and predictive analytics tooling.

Big Data Reference Architecture
© Utrecht University of Applied Sciences
41
Nevertheless, the model is an unclear mixture of technology, business processes, and
industries.
Figure 22: SAS in-memory analytics (SAS, 2013)
4.1.2.8 MicroStrategy
According to MicroStrategy, its business intelligence architecture (see Figure 23) is capable of
big data analytics (MicroStrategy, 2012).
Figure 23: Single Unified Architecture (MicroStrategy, 2013)
Big Data Reference Architecture
© Utrecht University of Applied Sciences
42
The Single Unified Architecture is very broad and complete. MicroStrategy positions only its
own products in the platform, which makes the model very vendor-specific. The data in the
platform flows from bottom to top and passes several (optional) components. Remarkable is
that MapReduce is pictured as a “database”, instead of a batch-processing module. Further,
this is a typical example of seeing big data as an evolution of BI. The title of MicroStrategy’s
web page is literally “Big Data: Bigger, Faster, and More Efficient Business Intelligence”.
Compared to competitor SAS, MicroStrategy focuses on traditional BI and data warehousing
while SAS focuses on big data and real-time analytics with external data sources.
4.1.2.9 Gartner
Gartner introduced the “3V” model and published an article in which the effects of big data on
established architecture models, principles and patterns is investigated (Natis, Laney, &
Altman, 2012). In their report, they suggest some interesting recommendations:
Make applications stateless to accommodate scaling and parallelism (potentially in the
cloud);
The service-oriented architecture (SOA) model must be extended with advanced
patterns of separation of concerns;
Big data architectures can benefit from event-driven architecture (EDA) when it comes
to handling data streams.
These recommendations point out that big data can benefit from established architecture
patterns and principles, but at the same time must extend the traditional paths that architects
take when creating solutions. Next to this specific paper, Gartner published a large set of
material on big data that dives deeper into the technology and methods of big data architecture
(Gartner, 2013).
4.1.2.10 Forrester
Similar to Gartner, Forrester also publishes a lot of content on the subject of big data (Forrester,
2013). In an interesting article, Forrester plotted the Enterprise Hadoop solutions on the axis of
‘strength of offering’ and ‘market presence’, resulting in the diagram duplicated in Figure 24
(Kolbielus, 2012).

Big Data Reference Architecture
© Utrecht University of Applied Sciences
43
Figure 24: Forrester Wave, Enterprise Hadoop Solutions, Q1 '12 (Forrester, 2012)
The remarkable point in the Forrester research is that the listed enterprise Hadoop solutions
include both free and open-source and commercial (proprietary) products. This poses an
interesting question that is related to the research question and that was addressed in the
interviews: is there a best practice or architecture principle to use free and open-source
software?
4.1.2.11 Others
There are more commercial organizations who have in some way or another published about
big data architecture. For example, Teradata has created a Unified Data Architecture (Teradata,
2013) and ThinkBig has defined their own Big Data Reference Architecture (Think Big Analytics,
2013). VMware published considerations for creating big data solutions, amongst which a
simple framework that can be viewed as a high-level reference architecture (Ibarra, 2012).
TDWI published an article about the integration of Hadoop into BI, in which a survey leads to
an interesting overview of big data technology and some trends and best practices (Russom,
2013). In a post of 2012, TDWI calls for new architectures and approaches for big data (Briggs,
2012). Forbes created a useful, up-to-date overview of the big data landscape (Feinleib, 2012).
CSC’s report on the big data (r)evolution contains an extensive overview of methods and
technologies (Koff & Gustafson, 2011). CapGemini has created a reference architecture for big
data but not published it; however, in a recent video Chief Technical Officer Manual Sevilla
explains that CapGemini’s Big Data Reference Architecture consists of a pipeline of five pillars,
or steps: Identifying, Acquiring, Organization, Analytics, and Acting (Sevilla, 2013). Computer
giant IBM published a series of articles and books about big data, both of their own products
(Zikopoulos, et al., 2013) and the FOSS stack (Eaton, deRoos, Deutsch, Lapis, & Zikopoulos,

Big Data Reference Architecture
© Utrecht University of Applied Sciences
44
2012). An interesting IBM resource is their article about data exploration and discovery, which
indicates that IBM believes in the power of this big data appliance (Cheung, Resende, Lindner,
& Saracco, 2012). Finally, O’Reilly published two short books about the ‘emerging architecture’
of real-time big data analytics (Barlow, 2013) and ‘current perspectives’ on big data (O'Reilly,
et al., 2012). All these bits and pieces contribute to the overall knowledge of big data
architecture.
4.1.3 Private Sources
4.1.3.1 Anuganti
A good example of a diagram that can be part of a Big Data Solution Reference Architecture is
Anuganti’s model (Anuganti, 2012), duplicated in Figure 25. Anuganti created this model based
on years of experience as a data architect, working for large enterprises in several industries.
Figure 25: Big Data Architecture (Anuganti, 2012)
Anuganti’s architecture is complex due to the many layers and software components involved.
However, it is a ‘pick and choose’ model where each component is optional. Anuganti created
a certain data pipeline through the model: data flows from the structured, semi-structured, and

Big Data Reference Architecture
© Utrecht University of Applied Sciences
45
unstructured data sources on the bottom left side of the diagram, to the Hadoop/HDFS cluster,
takes some sidesteps, to end up finally in the Reporting engine on the top right of the diagram.
4.1.3.2 Busa
Busa created an overview of the big data landscape, which is a complete big data reference
architecture (Busa, 2013). Figure 26 contains a duplication of the landscape.
Figure 26: Big Data Landscape (Busa, 2013)
Busa combines components from the BI practice with modern technology. His architecture
model is clear and concise but lacks the detail for a successful implementation. In addition, the
components are all concrete frameworks, which makes it difficult to make choices based on
abstractions (e.g. replace Mahout with R or SPSS) and makes the model very time-specific;
there are no guarantees that a software component that is the best choice on this moment
remains on top of the preferred stack in the future.
4.1.3.3 Joshi
InformationWeek published a blog post by Rajive Joshi in 2011, which highlights key design
challenges and principles of data-centric design in the big data era (Joshi, 2011). Joshi argues
that data-centric design, which is the practice of separating data from behavior, results in
loosely coupled systems connected via a data bus. Such an architecture pattern is suitable for
big data solutions, since it allows distributed systems to work independently and in parallel. A
data-centric design begins with adhering to some architecture principles, for example:
Expose the data and metadata;
Hide the behavior;
Delegate data handling to a data bus;
Explicitly define data-handling contracts.
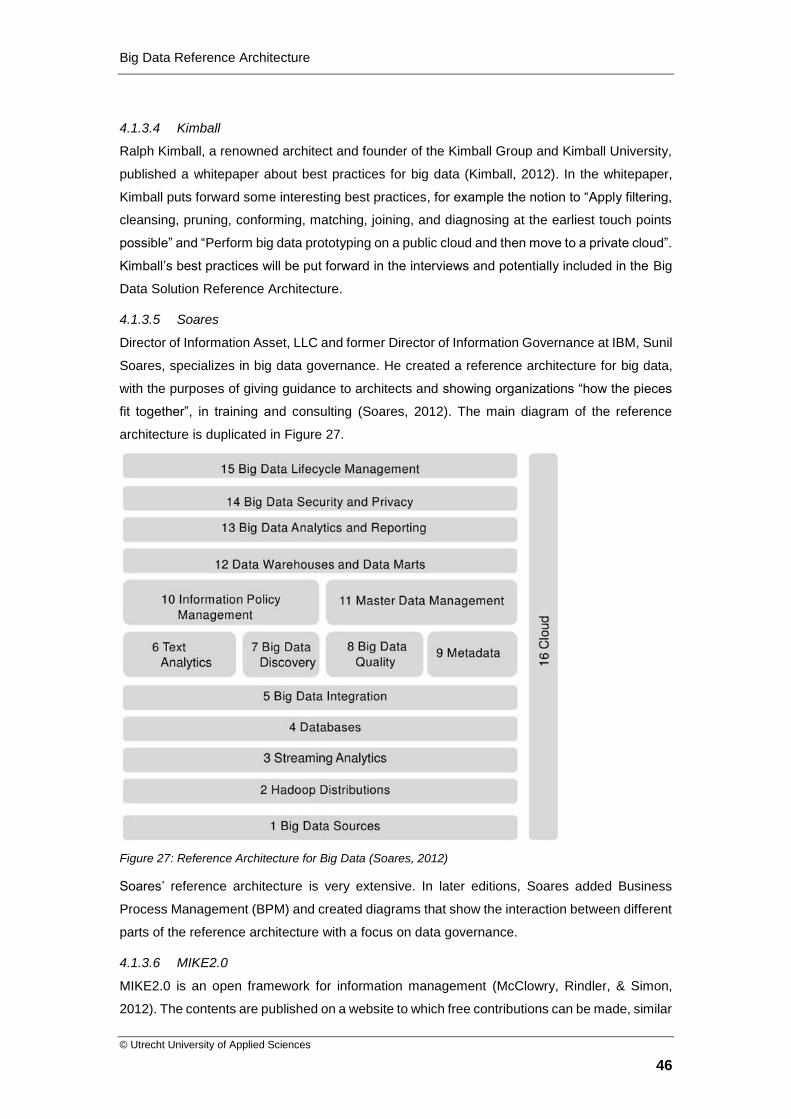
Big Data Reference Architecture
© Utrecht University of Applied Sciences
46
4.1.3.4 Kimball
Ralph Kimball, a renowned architect and founder of the Kimball Group and Kimball University,
published a whitepaper about best practices for big data (Kimball, 2012). In the whitepaper,
Kimball puts forward some interesting best practices, for example the notion to “Apply filtering,
cleansing, pruning, conforming, matching, joining, and diagnosing at the earliest touch points
possible” and “Perform big data prototyping on a public cloud and then move to a private cloud”.
Kimball’s best practices will be put forward in the interviews and potentially included in the Big
Data Solution Reference Architecture.
4.1.3.5 Soares
Director of Information Asset, LLC and former Director of Information Governance at IBM, Sunil
Soares, specializes in big data governance. He created a reference architecture for big data,
with the purposes of giving guidance to architects and showing organizations “how the pieces
fit together”, in training and consulting (Soares, 2012). The main diagram of the reference
architecture is duplicated in Figure 27.
Figure 27: Reference Architecture for Big Data (Soares, 2012)
Soares’ reference architecture is very extensive. In later editions, Soares added Business
Process Management (BPM) and created diagrams that show the interaction between different
parts of the reference architecture with a focus on data governance.
4.1.3.6 MIKE2.0
MIKE2.0 is an open framework for information management (McClowry, Rindler, & Simon,
2012). The contents are published on a website to which free contributions can be made, similar

Big Data Reference Architecture
© Utrecht University of Applied Sciences
47
to a wiki. Parts of the MIKE2.0 framework are solution offerings in the fields of BI, information
asset management, enterprise data management, enterprise content management, and others.
Solution offerings present options for solutions to common problems in the field of their subject.
The solution offerings contain technology and business solutions, for example design patterns,
guidance for processes, reference architectures, and other methods and techniques. A recent
addition is the Big Data Solution Offering (Rindler, McKnight, & McClowry, 2012). This solution
offering contains explanations of Hadoop, NoSQL, and other technologies, and gives insight in
the usage of these tools. Also, some best practices are given. Overall this source can be seen
as a reference architecture, as it gives guidance to big data architects. A strong point of the
model is that it is a part of the SAFE Architecture Framework. However, the relation is only
dimly explained and the mapping is very weak. The model could be improved by elaborating
more on big data architecture.
4.1.4 Evaluation
This chapter contains an overview of literature on the subject of big data architecture. Several
scientific, commercial and private sources contain useful diagrams or texts, from which
elements for a big data reference architecture can be distilled. Some notable big companies
are not listed as reference, for example Microsoft and SAP. Although these organizations
certainly offer big data products and services (e.g. SAP HANA and Microsoft Windows Azure
HDInsight), they have not published any material that is interesting for this research project.
In total, 27 literature sources were investigated. Most articles and websites mention several
aspects of big data architecture. It is not just about software; a solution architect should also
concern himself with business processes, infrastructure, patterns, principles, and best
practices. Big data architectures in literature points contain the following elements:
Hardware and software components;
Architecture principles;
Best practices.
Table 14, Table 15 and Table 16 in Appendix I contain the scientific, commercial, and private
sources and the elements that were found. The tables list the literature sources at the top, in
the order of appearance in this document. The left side of the tables contain the elements of
(reference) architectures that were found in the articles, websites and books, sorted on the
number of appearances in column “Count”. A ‘V’ indicates a match; the architecture in the
source contains the listed component, principle, or best practice. In this way, by plotting the
components, principles, and best practices in a crosstab, the tables can be used for getting a
high-level overview of the literature on the subject of big data architecture. Obviously, the
sources are very different in nature and each has a specific topic or address a specific area of
the research field. Therefore, only counting the check-marks is a limited evaluation method of
the literature. However, the elements on the left side of the tables present a reasonable

Big Data Reference Architecture
© Utrecht University of Applied Sciences
48
collection of components, principles and best practices that could form the basis of a reference
architecture. The remainder of this paragraph highlights the findings from these tables.
First, the literature clearly defines the core of a big data architecture. Nearly all sources contain
the following components:
A parallel batch-processing engine (e.g. Hadoop MapReduce);
A distributed file system (e.g. HDFS);
A NoSQL database.
Second, there is obviously more than MapReduce: data sources, data mining processes,
coordination and configuration engines, databases, monitoring, etc. In addition, traditional BI
systems and software components still seem to have a place in a big data architecture. All
these components play a role in the literature, some more than others. Several other
components are typical for a big data architecture, simply because they surface often in the
literature. The following components have a place in the majority of the literature that describes
a big data architecture:
A querying engine;
A predictive analytics engine;
A statistical analysis or machine learning engine;
A data importing / collecting / ETL engine;
A real-time / stream / complex event-processing engine.
Third, several architecture principles exist in the articles and websites on big data. Loose
coupling, cloud computing, and scalability are popular principles in literature. There are several
principles about whom the literature sources disagree. For example, IBM, SAS, and Kimball
very strongly believe in the principle of “Close-to-source data processing”, which implicates that
data should be analyzed as early as possible to reduce storage costs and processing time. On
the contrary, MicroStrategy believes in retrieving and storing as many data as possible and
performing analytics at a relatively late stage. The researcher discussed these contradictions
with the experts in the interviews.
Fourth, for best practices there is only one item that truly stands out: the “data pipeline
approach”. This best practice indicates that a big data architecture is like a pipeline through
which data flows. Several literature sources point to another best practice that is in contract
with the pipeline approach, namely the “data exploration and discovery” method. This best
practice is actually a type of big data analytics where the data is not retrieved or imported, but
remains at its source and is approachable directly for analytical purposes (see paragraph 2.4.2).

Big Data Reference Architecture
© Utrecht University of Applied Sciences
49
Fifth, there seems to be more consensus about the hardware and software component than
about the principles and best practices. This indicates that people agree about big data
technology, but have yet to reach a common understanding about the approaches and patterns
in big data architecture. For example, TDWI considers the best practice of data governance
very important, but the majority of articles about big data best practices do not even mention it.
The components, architecture principles, and best practices found in literature were put forward
in the expert interviews to confirm their place in the final model. In this way, the literature review
in Hevner’s framework served to create a provisional model of the final Big Data Solution
Reference Architecture.
4.2 DEVELOPMENT OF REFERENCE ARCHITECTURE
At the beginning of this step, the researcher created a provisional model based on the literature
review. This provisional model is actually a list of elements that make up the reference
architecture. This provisional model formed the basis to work with from this step forward. For
example, the interview questions were based on the elements of the provisional model. The
provisional model of the reference architecture consists of the following elements, in
conformance with the categories highlighted in paragraph 4.1.4:
Hardware and software components;
Architecture principles;
Best practices.
There are two sources for the Big Data Solution Reference Architecture: literature and
interviews with stakeholders. The question is: do these sources contain common elements? If
subject matter experts mention a component, architecture principle or other part of a reference
architecture often, and this component has a significant place in literature, it will get a place in
the reference architecture. This paragraph also explains the evaluation method of the reference
architecture. To make an objective evaluation, a list of acceptance criteria measures the fit of
an element in the reference architecture.
4.2.1 “Why”, “Where” and “When”
Answers to the “why”, “where” and “when” questions in Angelov’s model have to be stated
clearly to give meaning to the reference architecture, and to place it into context. This paragraph
explains the rationale behind the choices.
4.2.1.1 Why
The goal of the Big Data Solution Reference Architecture is to guide architects who want to
create a solution architecture that is capable of working with big data. Angelov et al. defined
two possible values for the Goal sub-dimension G1: standardization and facilitation. The Big
Data Solution Reference Architecture clearly aims at providing guidelines and inspiration for

Big Data Reference Architecture
© Utrecht University of Applied Sciences
50
the design of solutions. The main ambition is not to standardize concrete architectures or to
improve interoperability of existing components/systems. Thus, the goal of the Big Data
Solution Reference Architecture is facilitation.
4.2.1.2 Where
The context of the reference architecture is organizations who want to predict the future using
large datasets of enterprise data combined with open data sources. The reference architecture
is industry-independent but targets organizations of considerable size that have the resources
(time, money, and people) available to perform a big data project under architectural guidance.
Typically, an organization using the reference architecture has at least 100 employees and an
IT department of at least 10 employees. The intended recipient of the Big Data Solution
Reference Architecture is a lead architect who is able to make decisions about the concrete
solution architecture, architecture principles, and resources. Since the Big Data Solution
Reference Architecture must be industry-independent, the Context sub-dimension C1 gets the
value “multiple organizations”.
4.2.1.3 When
The reference architecture is time-independent. However, it is likely that the abstract hardware
and software components that are included in the reference architecture will be outdated in a
few years’ time. Therefore, the owner must maintain and update the reference architecture on
a regular basis. The C3 sub-dimension has two possible values: preliminary and classical. A
typical preliminary reference architecture is designed when no concrete components or other
parts of the reference architecture exist in practice. This is not the case for the Big Data Solution
Reference Architecture; there are several known big data solutions working in practice
(Anuganti, 2012) (CSC, 2012) (Joshi, 2011). Rather, the Big Data Solution Reference
Architecture takes the practical experience of a group of experts and uses that to give a “best
practice reference architecture”. Thus, the Context sub-dimension C3 gets the value “classical”.
4.2.2 Classify the reference architecture
According to the “why”, “where”, and “when” statements above, the reference architecture is of
“type 3”. Reference architectures of type 3 are facilitating, classical, designed for multiple
organizations and created by an independent organization.
4.2.3 Invite stakeholders (“Who”)
The Context sub-dimension C2 contains the list of stakeholders that were involved in the design
of the Big Data Solution Reference Architecture. There are two groups involved: requirements
Designers (D) and providers (R).
4.2.3.1 Designers
The first group of stakeholders in Angelov’s model is the designers of the reference architecture.
According to Angelov, an independent organization should design The Big Data Solution
Reference Architecture of type 3. That is the case, since the Hogeschool Utrecht is a research
organization and therefore has the freedom to be independent. The group of Designers consists

Big Data Reference Architecture
© Utrecht University of Applied Sciences
51
of one person: Bas Geerdink, researcher at the Hogeschool Utrecht and the author of this
thesis.
4.2.3.2 Requirements Providers
As stated by Angelov et al., the group of stakeholders that provides requirements must match
the type of reference architecture. In the case of the Big Data Solution Reference Architecture,
which is type 3, the requirements from software and user organizations determine the design
of the reference architecture.
Following these guidelines, a group of five stakeholders was identified and has been
interviewed in the months April and May of 2013. The group consists of subject matter experts
in the field of big data, from multiple organizations (software and user). Every expert elaborated
about his experience in the field of big data and explained the hardware and software
components, architecture principles, and best practices that he uses in big data projects.
The following stakeholders have been interviewed from software organizations:
A chief technologist and data architect at ScaleIN;
A big data pre-sales consultant at CSC;
A software architect at Xebia.
The following stakeholders have been interviewed from user organizations:
An enterprise solutions architect at 4Synergy;
An application development consultant at Unisys.
At this point in time, the research processed with the conduction of the actual interviews. The
interviews were structured; each interview followed a fixed schedule of questions while leaving
room for side steps and digression (Bryman & Bell, 2007). In addition, the researcher used
elements of the provisional model and the acquired insights from the literature during the
interviews. The structured, guiding question list in the expert interviews was:
Which hardware and software components would you consider important in a big data
architecture?
What is the best way to integrate big data components?
Which patterns and best practices would you adopt in a future big data solution?
Are there any architectural principles that you use in big data projects?
In which situations have you applied a big data solution?
As described in chapter 3, grounded theory and qualitative data analysis was used to process
the transcribed interview data. The following paragraph reveals the resulting codes and
categories.

Big Data Reference Architecture
© Utrecht University of Applied Sciences
52
4.2.4 Define “What” and “How”
This paragraph describes the aspects of the reference architecture, and the rationale of the
choices. The values of the “what” and “how” dimensions follow from the classification of the Big
Data Solution Reference Architecture as type 3 in Angelov’s model.
4.2.4.1 D1: What is described?
According to Angelov’s model, type 3 reference architectures should consist of components,
interfaces, and policies/guidelines. Adhering to this model, the codes were categorized in the
following categories:
Components & interfaces;
Policies & guidelines:
o Architectural patterns;
o Architecture principles;
o Architectural best practices.
These categories match the provisional model, with the exception of the architectural patterns.
After reviewing the literature, interviewing the stakeholders and analyzing the transcripts with
grounded theory and using the provisional model, the coded transcripts pointed out that this
category is necessary for the reference architecture.
Components are business processes, software applications or frameworks, and hardware.
Interfaces are the functional relationships, technical connections, data flows, compositions, and
aggregations between these components.
Architectural patterns are proven solutions to recurring enterprise architecture problems. They
offer architects abstracted methods and techniques to work with, which have been applied in
similar problems by other experts in the field (Buschmann, Meunier, Rohnert, Sommerlad, &
Stal, 1996). In this regards they are similar to application architecture patterns in software
engineering, which have been more widely used in practices (Gamma, Helm, Johnson, &
Vlissides, 1994), (Fowler, 2002). Garlan and Shaw introduced some examples of architectural
patterns and called them “Common Architectural Styles”. Examples of their patterns are Pipes
and Filters (also known as the Data Flow pattern), Data Abstraction and Object-Oriented
Organization, and Layered Systems (Garlan & Shaw, 1994).
Architecture principles are “fundamental approaches, beliefs, or means for achieving a goal”
that give guidance to architects (Beijer & de Klerk, 2010). Architecture principles are very
important parts of any solution or enterprise architecture. Principles can be normative or
scientific. A normative principle is “a declarative statement that normatively prescribes a
property of something”, whereas a scientific principle is “a law or fact of nature underlying the
working of an artifact” (Proper & Greefhorst, 2011). The Big Data Solution Reference

Big Data Reference Architecture
© Utrecht University of Applied Sciences
53
Architecture will contain normative principles that give guidance to architects who are designing
big data solutions. In a sense, the normative architecture principles work as constraints to the
organization; they give a certain amount of freedom to work with, but specify absolute
boundaries for the solution.
Finally, architectural best practices describe other aspects that are important when creating a
big data architecture. These best practices give guidance in the processes in which architects
surely are involved: management, planning, estimating, budgeting, cooperation with internal
and external suppliers, and so forth.
4.2.4.2 D2: How detailed is it described?
Type 3 reference architectures prescribe semi-detailed components and policies/guidelines,
and aggregated or semi-detailed interfaces. That suits well with the Big Data Solution
Reference Architecture since it is supposed to be an industry-independent, generic reference
architecture. Angelov et al. suggest to measure the level of detail by counting the number of
elements (e.g. components, guidelines) or the number of aggregation levels (e.g. layers in an
enterprise architecture). The Big Data Solution Reference Architecture, with semi-detailed
components, interfaces and policies/guidelines, should not contain numerous elements at more
than two aggregation levels.
4.2.4.3 D3: How concrete is it described?
Reference architectures of type 3 should have abstract or semi-concrete elements. This implies
that the Big Data Solution Reference Architecture will describe its components, interfaces, and
policies/guidelines in a non-specific, abstract way. The components that surfaced from the
literature and interviews will become abstract concepts rather than concrete products or
frameworks in the reference architecture. This will keep the reference architecture high-level,
and keep the reference architecture simple because the number of components will be small.
The abstraction will be done in the iterative coding cycles of the transcribed interview data. For
example, if an expert mentions ‘MongoDB’ or ‘Cassandra’, both are coded as ‘NoSQL
database’. In the reference architecture, the abstract concept of a ‘NoSQL database’ is then
added to the list of components.
4.2.4.4 D4: How is it represented?
According to Angelov’s model, type 3 reference architectures have semi-formal element
specifications. The semi-formal representation requires well-defined notations of the elements
of the reference architecture. The different parts of the Big Data Solution Reference
Architecture are presented in different ways. The hardware and software components are
presented visually, in a diagram on one page. Additional text will explain the components in
detail, and their interfaces. The choice for the visual representation, aided by text, was made
because that is the standard in existing literature (for example, see the diagrams in paragraph
3.1) and because this representation will give an overview of the reference architecture in one
notion. The other elements of the reference architecture, e.g. the architecture principles and

Big Data Reference Architecture
© Utrecht University of Applied Sciences
54
best practices, will be represented as text, tables, or lists, since no good visual representation
is possible. The Big Data Solution Reference Architecture uses the following notations:
ArchiMate 2.0 (The Open Group, 2012) for the components and interfaces;
The Pattern Language of Avgeriou and Zdun (Avgeriou & Zdun, 2005) for the
architectural patterns;
TOGAF 9.1 (The Open Group, 2011) for the architecture principles;
No specific format for best practices.
The remainder of this paragraph elaborates on the choices for the representation of the
elements of the reference architecture.
4.2.4.4.1 Components & interfaces
The reference architecture depicts the components and interfaces in ArchiMate, because this
is a modelling language that provides a complete overview of the architecture of a solution.
Figure 28 summarizes the ArchiMate Framework.
Figure 28: Architectural Framework of ArchiMate (The Open Group, 2012)
As depicted in Figure 28, ArchiMate offers three layers of architecture. The Application layers,
where software components and interfaces sit, has connections to two architecture layers that
are very important in big data predictive analysis enterprise solutions: the Business layer with
business processes/functions and the Technology layer with infrastructure components. Each
layer defines three categories of components:
Passive structure, which are concrete components that physically exist;
Behavior, which are components that execute actions;
Active structure, which are entities that are capable of performing behavior.
Since the literature and interviews with the subject matter experts indicate that big data
solutions consist of elements in the Application and Technology layers, ArchiMate is the
sensible choice for visual representation of the Big Data Solution Reference Architecture
components.

Big Data Reference Architecture
© Utrecht University of Applied Sciences
55
Another option for the notation of components and interfaces is UML (ISO/IEC 19501:2005)
(Object Management Group, 2011). Since the Big Data Solution Reference Architecture allows
for creation of solution architectures, UML would be a logical choice for representation of the
components and interfaces. However, this notation focuses solely at software architecture
diagrams, in contrary to (for example) ArchiMate, which is primarily used for enterprise solution
design. UML is considered too technical for representing business processes (Wiering, et al.,
2004) and considered not accessible and understandable for managers and business
specialists (Lankhorst, 2004).
4.2.4.4.2 Architectural Patterns
Avgeriou and Zdun introduced their universal language for documenting architectural patterns
in 2005. They link architectural patterns to the common notion of views and viewpoints. For a
number of commonly used views such as the Layered View, the Data Flow View, the Data-
centered View, the User Interaction View, and the Component Interaction View, Avergiou and
Zdun presented patterns that match the views. For example, the Data Flow View contains the
patterns “Batch Sequential” and “Pipes and Filters”. Consequently, in their article gives an
excellent overview of reusable architectural patterns, linked to well-known views and viewpoints
and visualized in a unified way. These patterns serve as examples to ‘new’ patterns that might
emerge for the Big Data Solution Reference Architecture, but also as reference library of
reusable items for the reference architecture.
4.2.4.4.3 Architecture Principles
Architecture principles (definition: see paragraph 4.2.4.1) are a somewhat underexposed part
of solution architecture and enterprise architecture (Proper & Greefhorst, 2011). The best
representation found in literature is part of The Open Group’s TOGAF 9.1 framework
(Greefhorst & Proper, 2011). TOGAF lists four components of architecture principles, and
recommends a format for representing them (The Open Group, 2011). Each principle has four
attributes: Name, Statement, Rationale, and Implications. Table 2 contains a reproduction of
the template for the representation of a principle.
Name Should both represent the essence of the rule as well as be easy to remember. Specific
technology platforms should not be mentioned in the name or statement of a principle.
Avoid ambiguous words in the Name and in the Statement such as: "support", "open",
"consider", and for lack of good measure the word "avoid", itself, be careful with
"manage(ment)", and look for unnecessary adjectives and adverbs (fluff).
Statement Should succinctly and unambiguously communicate the fundamental rule. For the most
part, the principles statements for managing information are similar from one
organization to the next. It is vital that the principles statement be unambiguous.
Rationale Should highlight the business benefits of adhering to the principle, using business
terminology. Point to the similarity of information and technology principles to the
principles governing business operations. Also describe the relationship to other

Big Data Reference Architecture
© Utrecht University of Applied Sciences
56
principles, and the intentions regarding a balanced interpretation. Describe situations
where one principle would be given precedence or carry more weight than another for
making a decision.
Implications Should highlight the requirements, both for the business and IT, for carrying out the
principle - in terms of resources, costs, and activities/tasks. It will often be apparent
that current systems, standards, or practices would be incongruent with the principle
upon adoption. The impact to the business and consequences of adopting a principle
should be clearly stated. The reader should readily discern the answer to: "How does
this affect me?" It is important not to oversimplify, trivialize, or judge the merit of the
impact. Some of the implications will be identified as potential impacts only, and may
be speculative rather than fully analyzed.
Table 2: Format for Defining Architecture Principles (The Open Group, 2011)
4.2.4.4.4 Architectural Best Practices
Since the category of architectural best practices is very broad, there is no semi-formal notation
for the representation of its elements. Rather, each element will be explained in text and
supported by case studies, theories, and/or models from literature.
4.2.5 Summary
Table 1 in paragraph 3.2.2 summarized Angelov’s classification model for reference
architectures; it contains the dimensions, sub-dimensions and questions that determine the
type of a reference architecture. Paragraphs 4.2.1 to 4.2.4 contain the answers to the questions.
Table 3 contains the same data as Table 1, with the addition of column ‘Answer’, which contains
the answers to the questions for the Big Data Solution Reference Architecture, and column
‘Explanation’ which contains the reference to the paragraphs above.
Dimension Sub-
Dimension
Question Answer Explanation:
see paragraph
Goal G1 Why Facilitation 4.2.1
↓
Context C1 Where Multiple organizations 4.2.1
Context C2 Who Independent organization (D),
Software organizations (R),
User organizations (R)
4.2.3
Context C3 When Classical 4.2.1
↓
Goal G2 D1: What Components, interfaces,
policies/guidelines
4.2.4
Goal G2 D2: Detail Semi-detailed components
and policies/guidelines,
4.2.4

Big Data Reference Architecture
© Utrecht University of Applied Sciences
57
Aggregated or semi-detailed
interfaces
Goal G2 D3:
Concreteness
Abstract or semi-concrete
elements
4.2.4
Goal G2 D4: How Semi-formal element
specifications
4.2.4
Table 3: The multi-dimensional space for the Big Data Solution Reference Architecture of type 3
4.3 RESULTS: THE BIG DATA SOLUTION REFERENCE ARCHITECTURE
At this point in time, the reference architecture was designed. This paragraph contains the Big
Data Solution Reference Architecture that was created after investigating the literature,
interviewing the experts, using grounded theory to perform quantitative data analysis, and
determining the representations of the various elements. The reference architecture is a
guideline, not a prescription. Each element in the model is optional in the solution architecture
that is ultimately created. In analogy with creating an architecture for a house, the reference
architecture will contain the layout of the rooms, doors and windows, but omits the actual
physical descriptions of the wallpapers, latches, and window frames. The components are
integrated building blocks that can be deployed in a working state, with processes, policies, and
best practices on how to use it.
The reference architecture consists of categories, according to the elements that were defined
in the “what” question (dimension D1) of Angelov’s model. For all elements and sub-elements,
tables of coding frequencies are displayed. These tables consist of three columns: Code,
Cases, and Count. The Code columns contains the codes that were found in the category. The
Cases column contains the number of cases in which the code was used. This number has a
maximum of 5, since five interviews were taken. The Count column contains the total number
of times the code was used in the transcripts. The tables are all sorted: first on Cases, next on
Count.
The reference architecture can be used to create solutions for use cases of predictive analytics
using big data technology and open data sources. Table 4 contains a list of typical use cases.
The table is only a very small subset of all use cases, meant to give an appetite of the
possibilities; there are plenty example in the given industries and sectors such as telecom,
energy, education, and others. Each organization should find its own use case and purpose for
the reference architecture.
Industry Use Case
Defense A ministry of defense wants to build a system to collect and analyze signals, to
notice national security threats (SIGINT). The system predicts the chance that a

Big Data Reference Architecture
© Utrecht University of Applied Sciences
58
certain data source or communication contains hostile information that could harm
citizens.
Financial
Services
A national authority for financial markets wants to improve fraud detection of credit
card data. By using a sophisticated prediction engine, individual transactions can be
marked as likely to be fraud based on the behavior of clients.
Financial
Services
A large bank wants to offer a service to clients that predicts account balance. When
a client log in to his or her personal online banking website, a forecast of the
balance on the bank accounts in possession is shown on the screen. The forecast
is based on historical earnings and spending of the individual as well as the group
the person is in, based on social categorization. Forecasts can also include other
data sources such as the search behavior of the person on the internet; if the client
visited second-hand car sales pages it's likely he or she will buy a car in the near
future.
Government A local government organization with its own customer support helpdesk want to
predict the load of calls, and thereby the staffing needs of the helpdesk
Government A national law enforcement agency wants to predict crime threats by analyzing
sensory data, social media, web traffic and email records.
Healthcare A hospital wants to reduce re-hospitalization figures, and improve "patient flow" to
increase the quality of care and reduce costs. A prediction is made for each patient
that determines the risk of recurring illness once he or she is discharged from the
hospital. The prediction is based on historical data, patient profile, and the latest
illness research reports.
Healthcare A national health organization wants to predict outbreaks of diseases as soon as
possible, to distribute medication, and take other pre-emptive actions. Sources for
the predictions are hospital data, social media, illness records of companies, online
news feeds, and others.
Insurance An insurance company wants to forecast the amount of deaths and other indicators
of life insurance payments, to adjust policies and manage costs. The data used for
these predictions are customer profiles (including income, location, age, and sex),
historical data, and sources that contain indications of disease outbreaks such as
news feeds and social media.
Retail A manufacturer of mobile phones want to forecast the amount of sales for the
upcoming period, based on historical data, market trends, and sentiment of
(potential) customers.
Retail An e-commerce website wants to promote cross-selling of products by presenting
related products to potential customers. The prediction of products that are likely to
be interesting to the customer is performed by an analytics engine that takes
various sources as input: other clients' buying behavior, web traffic of the customer
from cookies, and price differentiation of products on sale.

Big Data Reference Architecture
© Utrecht University of Applied Sciences
59
Oil and gas An oil refinery wants to predict machine failures to optimize costs and downtime.
The machines produce sensory data that can be used for analytics, as well as
working schedules and sales forecasts.
Transportation A railway company wants to lower the costs of maintenance on trains by improving
the predicted replacements of train parts, based on sensor data of the trains.
Transportation A national government wants to predict road traffic flows and congestions. These
predictions can be used to optimize digital road signs and send better routes to in-
car satnav systems. The predictions are based on actual traffic data, historical data,
Twitter feeds, public holidays, and other sources.
Table 4: Examples of use cases for the Big Data Solution Reference Architecture
The elements of the Big Data Solution Reference Architecture are described in the following
paragraphs.
4.3.1 Components & Interfaces
This category contains all components (business, software, and hardware) that are part of the
reference architecture, as well as the interfaces between them. In the interviews, stakeholders
were asked to identify the most important components given the business challenge of
predicting the future. Business processes (as business components), software and hardware
components, and other elements that the interviewee talked about, were captured immediately.
However, if an interviewee did not mention a component that was a critical part of the literature
(e.g. mentioned in 70% of the articles, see Table 14 in Appendix I), it was mentioned specifically
to the interviewee in questions such as: “Do you also know about [component]?”, “Have you
considered [component]?”, “The literature mentions [component], do you have any experience
with that?”
The literature (see paragraph 4.1) and expert interviews (see paragraph 4.2) point out one thing
very clearly: big data is largely about MapReduce. Abstracted, this means that the centerpiece
of a big data architecture is a parallel batch-processing engine. This is combined with a
distributed file system to allow large quantities of data to be processed. However, the reference
architecture not only aims at batch processing but also incorporates big data solutions that are
created for (near) real-time data processing.
Table 5 gives an overview of the codes and categories for the components and interfaces.
Code Cases Count
MapReduce Framework 5 19
NoSQL Database 5 16
Relational Database 5 7
ETL Framework 4 10
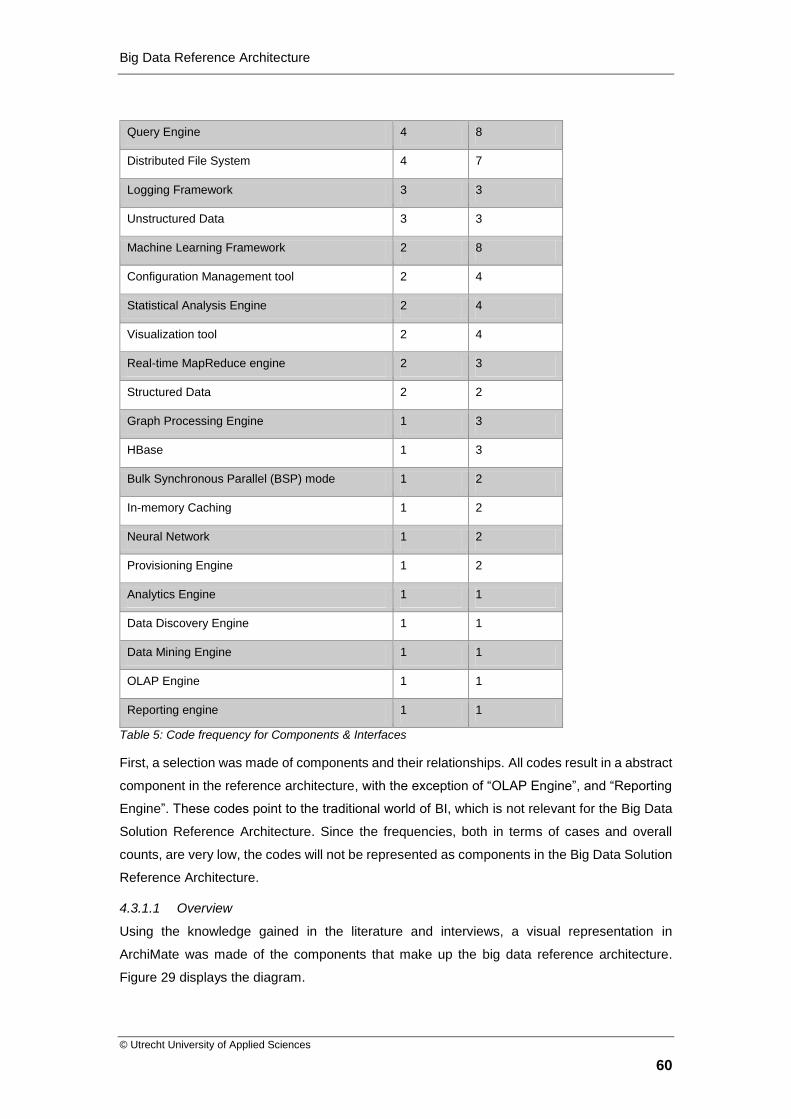
Big Data Reference Architecture
© Utrecht University of Applied Sciences
60
Query Engine 4 8
Distributed File System 4 7
Logging Framework 3 3
Unstructured Data 3 3
Machine Learning Framework 2 8
Configuration Management tool 2 4
Statistical Analysis Engine 2 4
Visualization tool 2 4
Real-time MapReduce engine 2 3
Structured Data 2 2
Graph Processing Engine 1 3
HBase 1 3
Bulk Synchronous Parallel (BSP) mode 1 2
In-memory Caching 1 2
Neural Network 1 2
Provisioning Engine 1 2
Analytics Engine 1 1
Data Discovery Engine 1 1
Data Mining Engine 1 1
OLAP Engine 1 1
Reporting engine 1 1
Table 5: Code frequency for Components & Interfaces
First, a selection was made of components and their relationships. All codes result in a abstract
component in the reference architecture, with the exception of “OLAP Engine”, and “Reporting
Engine”. These codes point to the traditional world of BI, which is not relevant for the Big Data
Solution Reference Architecture. Since the frequencies, both in terms of cases and overall
counts, are very low, the codes will not be represented as components in the Big Data Solution
Reference Architecture.
4.3.1.1 Overview
Using the knowledge gained in the literature and interviews, a visual representation in
ArchiMate was made of the components that make up the big data reference architecture.
Figure 29 displays the diagram.

Big Data Reference Architecture
© Utrecht University of Applied Sciences
61
Figure 29: Components & Interfaces of the Big Data Solution Reference Architecture
The visual representation of the components and interfaces is semi-detailed and contains semi-
concrete elements, following the guidelines of Angelov et al. for a “type 3” reference architecture
(see paragraph 4.2.2). The level of detail can be measured from the number of layers and the
number of components. In the Big Data Solution Reference Architecture, both are reasonably
low: three layers and relatively small number of components.
The ArchiMate language allows for very complex diagrams, with architectures including
functions, interfaces, interactions, services, collaboration, devices, locations, etc. None of these
elements was used. Rather, the diagram is simple and includes only the following elements
(definitions from (The Open Group, 2012)):
Business Process ( ): a behavior element that groups behavior based on an
ordering of activities. It is intended to produce a defined set of products or business
services;
Data Object ( ):a passive element suitable for automated processing;

Big Data Reference Architecture
© Utrecht University of Applied Sciences
62
Application Component ( ): a modular, deployable, and replaceable part of a
software system that encapsulates its behavior and data and exposes these through a
set of interfaces;
Technology Artifact ( ):a physical piece of data that is used or produced in a
software development process, or by deployment and operation of a system;
Network ( ): a communication medium between two or more devices;
Node ( ): a computational resource upon which artifacts may be stored or deployed
for execution;
System Software ( ): a software environment for specific types of components and
objects that are deployed on it in the form of artifacts.
Next to these components, the following ArchiMate relationships are used in the diagram
(definitions from (The Open Group, 2012)):
Composition ( ): the composition relationship indicates that an object is
composed of one or more other objects. This relation is visualized as components
overlapping. For example, the Predict business process consists of four sub-
processes, amongst which Import Data;
Used By ( ): the used by relationship models the use of services by processes,
functions, or interactions and the access to interfaces by roles, components, or
collaborations. For example, the Analytics Engine application component is used by
the Analyze Data process;
Flow ( ): the flow relationship describes the exchange or transfer of, for
example, information or value between processes, function, interactions, and events.
For example, data flows between the Distributed Database and the Analytics Database
system software components;
Realization ( ): the realization relationship links a logical entity with a more
concrete entity that realizes it, e.g. the Imported Data artifact is realized by the
Importing Engine;
Specialization ( ): the specialization relationship indicates that an object is a
specialization of another object, e.g. the Open Data artifact is a specialization of the
Raw Data artifact;
Assignment ( ): the assignment relationship links active elements (e.g.,
business roles or application components) with units of behavior that are performed by
them, or business actors with business roles that are fulfilled by them. For example,
the Analytics Data artifact is assigned to the Analytics Database.

Big Data Reference Architecture
© Utrecht University of Applied Sciences
63
The size of the component blocks in the Application Layer give an indication of the “importance”,
the complexity, and the required amount of computer resources (memory, disk space, number
of frameworks, etc.) of the component. For example, the Processing Engine is displayed larger
than the Management Engine since it has more tasks, demands more resources and is
considered one of the core components of the big data solution.
The model focusses on “what” rather than “how”. The conceptual elements of the reference
architecture are all structures, residing in the left column of the diagram in Figure 28. The
structural character of the model was chosen on purpose, to give architects a clear guidance
while still presenting abstract components. The focus on “what” allows for an easy translation
of the abstract reference architecture to real physical components in the big data solutions that
are implementations of the model. The level of concreteness is apparent from the abstractness
of the components; no concrete components are listed but rather the templates or concepts.
For example, instead of including “HDFS”, the concept of a Distributed File System is used.
However, in the supporting text several options and examples are provided for the components,
to give architects a feel for the possibilities. The criteria for the components that are selected
for the architecture are scalability, ease of use, maturity, and level of support. The options are
presented in tables, which are alphabetically sorted by component name. Amongst the options
provided are commercial (proprietary) components and free and open-source (FOSS)
components. Commercial, proprietary solutions often have FOSS frameworks under the hood,
and one of the architectural best practices of this reference architecture is “Use free and open-
source software” (see paragraph 4.3.2.3.1). Therefore, architects using the reference
architecture are recommended to opt for FOSS.
A concept that sprouts from the literature and the interviews is to see big data analytics as a
data pipeline (also see the Architectural Patterns category in paragraph 4.3.2.1). In contrast to
other solution architectures where data ‘moves around’ between services, databases,
applications, objects, and so forth, big data is about getting a large dataset “streaming” through
a set of tools and frameworks to get insight and derive meaning, and ultimately take action. In
our research, the sources are enterprise data and open data, and the insight is a statement of
predictive analytics. Thus, one of the first choices was to represent the reference architecture
as a data pipeline. In the diagram, the data "flows" at the Application layer and the Technology
layer; the application components communicate and pass data to each other figuratively, while
the actual data flow happens in the infrastructure. As mentioned above, the reference
architecture aims at both batch processing and (near) real-time data processing solutions.
The remainder of this paragraph highlights various elements and aspects of the Big Data
Solution Reference Architecture, explaining and illustrating the most important components and
interfaces per layer.

Big Data Reference Architecture
© Utrecht University of Applied Sciences
64
4.3.1.2 Business Layer
Figure 30: Business Layer
Prediction or forecasting is the main business problem that needs to be solved. The business
layer (see Figure 30) contains one main business process: “Predict”. This is the main goal of
the entire solution for which the reference architecture is used: to predict the future using
enterprise data, open data sources and big data technology. The business process is divided
into four sub-processes or business process steps: Import Data, Process Data, Analyze Data,
and Decide. All sub-processes can be triggered by users of a system, e.g. by the press on a
button, or it can be automatically triggered by an event or as part of a workflow. The sub-
processes have relationships to the application components in the Application Layer. All
relationships are “Used By” relations. This means that the processes use application
components, e.g. to analyze data, an actor (human or machine) uses the functions of a
visualization program.
An example of a business process that suits the reference architecture is: prediction of the
weather. To make a prediction, sensor and historical data has to be imported into a system,
processed (e.g. filtered, cleaned, normalized), and analyzed. Finally, a meteorologist can make
a decision about the weather forecast.
4.3.1.2.1 Import
The first step or cycle in the data pipeline is importing the data. The business process is
responsible for gathering all the relevant data to the business problem, from within the
organization and from external sources. This action can be triggered automatically or can be
executed manually. For example, a business owner who is interested in the forecasted
maintenance of trains in the upcoming month might initiate a procedure that gathers all sensor
data of the trains that are in working order.
4.3.1.2.2 Process
Once the data has been imported into a suitable repository, it has to be processed to make it
suitable for analysis. This business process takes care of data filtering, cleaning, enriching, etc.
Usually these actions are sequentially executed and automated. For example, an automatic
nightly batch in an e-commerce organization processes all sales records of the day, matches it
to historical data and market trends and produces a new dataset that can be used for cross-
selling purposes.

Big Data Reference Architecture
© Utrecht University of Applied Sciences
65
4.3.1.2.3 Analyze
The data must be analyzed by a sophisticated algorithm, tool or process that predicts the future.
This business process analyses the data and makes it suitable for representation. The
underlying technology of this business process is statistics, artificial intelligence, etc. The type
of analysis that is performed to give insight depends on the use case. For example, in the case
of customer insight, the analysis can consist of market basket analysis (to identify cross-selling
opportunities), click-stream analysis to determine on-line behavior of potential customers, and
even real-time analysis of GPS locations of mobile users to determine whether they are in the
vicinity of a suitable shop. Another example is the use of neural networks to recognize patterns
in weather data or social media messages.
4.3.1.2.4 Decide
Finally, the business process Decide is used to make a decision about the data. This business
process is also known as business insight, actionable insights, actionable intelligence, etc.
Typically, a business user is looking at a visual representation, such as a graph, about the
prediction. The interpretation of the visuals can be a challenging and complex task. The people
using the technology have to be aware of the implications of working with predictive analytics.
For one, the outcomes of the “Analyze” function will be “fuzzy”. The big data systems will
produce figures such as “there is a chance of 52.3% that the workload on your customer support
helpdesk is above 40% during the next weekend”. This uncertainty is sometimes qualified as
the fourth “V” in the big data model: Veracity (next to Volume, Variety, and Velocity) (Schroeck,
Shockley, Smart, Romero-Morales, & Tufano, 2012).
In a sense, this step can also be named “Act”. However, a decision does not always imply an
action; after data analysis, doing nothing can be the best choice. The business process “Decide”
is not by definition a human action. The process to import, process, and analyze data, and
consequently make a decision, can be fully automated. In that case, a machine makes the
decision. An example of such a situation is the prediction of the weather on a website; the
produced forecasts are the result of a fully automated sequence of data gathering, analysis,
and visualization. An example of a human Decide action is a manager of an insurance
company, who decides to lower the price of a life insurance policy based on a graph of
predictions that cover the life insurance business.
4.3.1.3 Application Layer
Figure 31: Application Layer

Big Data Reference Architecture
© Utrecht University of Applied Sciences
66
The Application Layer, depicted in Figure 31, contains the core elements of the big data solution
from an Information Systems perspective. The components in this layer are applications,
software packages, frameworks, or products. The components are given the name of
“Engines”, as that closely represents what they do; each component converts raw input into
useful output, similar to a car engine, which is a machine that converts fuel into motion.
According to Wikipedia, “the field of computer science uses the term Engine to provide a mental
model of software components an order of magnitude more complex than an ordinary modules
of software, such as a libraries, platforms, SDKs or objects” (Wikipedia, 2013). The name
“Engine” also provides a link to “Software Engineering”, where this layer is all about: the
software has to be analyzed, build, integrated, configured, tested, implemented, and
maintained.
From the Importing Engine to the Visualization Engine, “Flow” relationships are visible that
indicate the data flow on the application level. The actual data is transferred in the Technology
Layer; however, when looking sec at the Application Layer it is safe to say the data flows from
one Application Component to another. Next to the “Flow” relations, the engines have
relationships with the data artifacts in the Technology Layer, as follows:
The Importing Engine accesses Raw Data;
The Importing Engine realizes Imported Data;
The Processing Engine uses Imported Data;
The Processing Engine realizes Processed Data;
The Analytics Engine uses Processed Data;
The Analytics Engine realizes Analytical Data;
The Visualization Engine uses Analytical Data.
There are four components that are mapped one-to-one to the business processes of the
Business Layer, described in paragraph 4.3.1.2. Next to that, there is a “Raw Data” data object
and the component “Management Engine”, which are not directly related to a business process.
The following paragraphs describe these six components.
4.3.1.3.1 Raw Data
Raw data is open data from a source on the internet or enterprise data that resides somewhere
in the organization. This data can be in structured, semi-structured, or unstructured form.
Together, these data are characterized as multi-structured data.
4.3.1.3.2 Importing Engine
Raw data gets imported from its source and must be stored on a distributed file system. The
importing engine has the following tasks:
Data Discovery;
Data Mining;
Data Collection;

Big Data Reference Architecture
© Utrecht University of Applied Sciences
67
Data Loading;
Data Acquisition;
Data Ingestion.
In the traditional world of BI, this component is responsible for the extract, transform, and load
(ETL) of data. In the case of (near) real-time data analysis, this step is skipped; incoming data
is processed immediately once it arrives at the organization. Table 21 in Appendix III contains
a list of possible products and frameworks for importing data. However, this list far from
complete; options such as custom-made scripts or programs are also good solutions for getting
data into the file system.
4.3.1.3.3 Processing Engine
Imported data has to be processed to be ready for analysis. The Processing Engine, together
with the Analytics Engine, is the core of a big data solution for predictive analytics. It typically
contains MapReduce jobs, querying mechanisms, and other distributed parallel processing
tools. The Processing Engine retrieves the input data from a distributed file system and it writes
data to a distributed database after processing. The processing engine can run multiple
iterations with different configuration, e.g. if multiple MapReduce jobs are required to process
the data. The key to big data is distributed parallel processing. A “shared nothing” architecture
combined with a fast network is the key to processing huge volumes and varieties of data, with
high velocity. The processing engine is responsible for any and all of the following tasks:
Data Transportation;
Data Cleaning;
Data Filtering;
Data Serialization;
Data Integration;
Data Search;
Data Querying;
Data Transformation;
Complex Event Processing;
Log Processing.
Since this component contains many tasks and therefore many possible implementations, the
Processing Engine is further split up into categories. The categories are Processing Engines
with their own specialty. Each category is a possible implementation of the Processing Engine.
As with all other components, the categories are optional; e.g. the big data solution is not
required to include a Data Transformation Engine. There are five categories or Engines:
Data Preparation Engine;
Data Querying Engine;
Batch Processing Engine;

Big Data Reference Architecture
© Utrecht University of Applied Sciences
68
Stream Processing Engine;
Log Processing Engine.
Figure 32: Processing Engine
The sub-components of the Processing Engine and their relationships are displayed in Figure
32. There are several “Flow” relations between the components, meaning that it’s possible that
data flows from one Engine to another. For example, the architecture could contain a Log
Processing Engine that collects log files, aggregates and filters them, and stores the result in a
distributed file system that is used by a Hadoop cluster. The remainder of this paragraph
explains the components in the Processing Engine in detail.
Data Preparation Engine
The tasks Transportation, Serialization, Cleaning, Filtering, and Integration of data fall under
the category of Data Preparation. Software is available that processes data in these ways. It is
for each organization to decide which tasks are required and which components will suit best.
Table 22 in Appendix III contains an overview of several options for the Data Preparation
Engine.
Data Exploration Engine
The Data Exploration Engine takes care of the tasks Data Search and Data Querying. There
are big data tools that are built for searching/crawling/indexing large datasets. Data Querying
is a task that makes life easier for big data developers. For efficient processing of multi-
structured data sources, a tool can be used that translates declarative queries to MapReduce
jobs. Examples of high-level languages that are suitable for this job are Jaql, Pig Latin, and
HiveQL. When interpreted by a search or query tool, the language queries are automatically
executed in parallel and distributed. For example, the HiveQL query “SELECT customerId,
orderNr FROM orders;” is processed by the Hive framework to create a MapReduce job
that outputs a list of orders. Table 23 in Appendix III contains a list of options for the Data
Exploration Engine.
Batch Processing Engine
The most widely used software framework for distributed parallel processing engine is Apache
Hadoop. This FOSS solution is incorporated in a number of commercial offerings. Some

Big Data Reference Architecture
© Utrecht University of Applied Sciences
69
organizations offer a Hadoop solution, e.g. a software suite that incorporates Hadoop. Other
companies offer distributions of the Hadoop stack, providing a managed ready-to-use
environment and support. Table 24 in Appendix III contains several of these options.
Stream Processing Engine
In case the big data solution has to analyze real-time or near real-time data streams, specialized
software must be used to process the incoming data streams. Table 25 of Appendix III lists the
options for stream processing software.
Log Processing Engine
A special category of Data Processing is the handling of log files. These machine-generated
data contain a wealth of information for an organization if analyzed in the correct way. Typically,
a software product collects log files in an organization and makes the logs available for
analytical processing. Table 26 in Appendix III contains a list of software components that are
specialized in processing log files.
4.3.1.3.4 Analytics Engine
The processed data must be analyzed to make useful predictions about the future. Using
techniques from the fields of statistics and artificial intelligence (such as neural networks,
genetic algorithms, and machine learning), this software actually performs the predictive
analytics calculations. Machines need to be trained to make correct predictions about the future.
The components in this engine have one or more of the following tasks:
Simulation;
Machine Learning;
Genetic algorithms;
Natural language processing;
Statistical Analysis;
Pattern recognition;
Text analytics;
Sentiment analysis;
Geospatial analytics;
Time-series forecasting;
Video analytics;
Voice analytics.
The analytics engine can be database-based, or in-memory. Table 27 in Appendix III contains
a list of possible options for the Analytics Engine component. Again, these are just some
options. Particular in the field of analytics and forecasting, components can be custom build or
derived from models such as ARIMA or regression analysis.

Big Data Reference Architecture
© Utrecht University of Applied Sciences
70
4.3.1.3.5 Visualization Engine
A visualization engine is a software package that is capable of presenting the predictive data in
a useful way. Dashboards, reports, graphs, tagclouds, clustergrams, and history flows are
suitable for such tasks. Although many software vendors try to sell products or big data suites
with visualization engines, there is FOSS available that does the job. The SVG format, an open
World Wide Web Consortium (W3C) standard, is an XML-based format for drawing two-
dimensional graphical objects (W3C, 2013). Using JavaScript and tools like D3 that support
SVG rendering, it is possible to create beautiful and informational browser-based visuals.
Table 28 in Appendix III contains a list of options for the Visualization Engine. The tools
mentioned are only the software equivalents of the Visualization Engine. One could also think
about the component as a service or even a human action. For instance, the creation of
infographics is a manual job that is extremely well suited to present a lot of information in a
short overview.
4.3.1.3.6 Management Engine
The Management Engine is the director of all other components in the Application Layer. This
software has the following tasks:
Storage and execution of the workflow across all components in the Application layer;
Coordination of tasks that run in the Application layer;
Provisioning of infrastructure, system software and information systems in the
Technology and Applications layers;
Monitoring of infrastructure and applications.
It can also be argued that tasks such as data governance, data security, master data
management, and metadata management play a role in the Management Engine. However,
the expert interviews and resulting codes have not indicated these tasks to be important. Table
29 in Appendix III contains a list of the options for the Management Engine.
4.3.1.4 Technology Layer
Figure 33: Technology Layer

Big Data Reference Architecture
© Utrecht University of Applied Sciences
71
The Technology layer (see Figure 33) contains the low-level infrastructure and system software
that is needed for a big data solution. On two possible networks (Intranet and Internet), raw
data is hosted and three types of server clusters provide the ability to store the various types of
data. Outside of the network, four artifacts represent the data that is stored in the layer.
Data flows from the Distributed File System into the Distributed Database, and then into the
Analytics Database. This is represented by the ArchiMate “Flow” relationships between the
components, and follows the Pipes and Filters architectural pattern (see paragraph 4.3.2.1.1).
The data artifacts represent the actual data. The “Association” relationships with the system
software components indicate the location of the data files / tables, e.g. a set of imported sensor
data is stored on the distributed file system. The technology artifacts are realized by or used by
the application components in the Application Layer; for an explanation of the relationships, see
paragraph 4.3.1.3. The components in the Technology Layer are explained in detail in the
following paragraphs.
4.3.1.4.1 Intranet & Internet
The layer contains two networks (Intranet and Internet), with two artifacts that represent open
data and enterprise data, and three nodes that represent server clusters. The nodes (clusters)
are located on one network, or both networks. For example, a file cluster can be obtained as
infrastructure-as-a-service (IaaS) from a service provider in the cloud, while the database
cluster is a hybrid form (mixture) of on-premise and cloud-based servers, and the analytics
cluster resides on internal servers.
The network(s) should be fast. To allow distributed parallel processing, especially in the
Importing Engine and the Processing Engine, the supporting network of the software should be
able to handle huge amounts of data extremely efficient.
4.3.1.4.2 Raw Data
The Raw Data artifact consists of Open Data and Enterprise Data sources. Open data resides
on the internet, enterprise data on the intranet. Table 6 contains an overview of internal and
external data sources.
Type Structured Semi-structured Unstructured
Enterprise Data Relational databases File shares, log data
Open Data REST open data sources Social media sources
Table 6: Data sources that can be used in big data architectures
The reference architecture uses open data, so the interviews contained questions about the
way that external data sources should be connected to enterprise data. The interviews and
literature point out that a big data architecture should handle multiple types of data: structured,
semi-structured and unstructured. Together, this is referred to as multi-structured data. CSC’s
big data consultant Martijn Loderus has an interesting notion of treating all external data as

Big Data Reference Architecture
© Utrecht University of Applied Sciences
72
‘sensors’. Elaboration on this idea in a metaphorical way: a big data solution can be seen as an
instrument, or even an organism, that “feels” its way around in the surrounding environment
(open data), takes into account its own internal state (enterprise data), processes the combined
set (MapReduce) and eventually produces a meaningful advice (predictive analytics).
4.3.1.4.3 File Cluster
The file cluster is a big data solution that is capable of storing large amounts of data in a
distributed, fail-safe way. Table 30 in Appendix III contains a list of options for the Distributed
File System component.
4.3.1.4.4 Database Cluster
The database cluster is a hardware component that is capable of hosting a large, distributed
big data database. The database can store data in-memory or on disk. In-memory databases
load all data and the database applications (e.g. stored procedures, functions) into the RAM
memory of server, which has faster read and write access than a hard drive. This type of
databases can be used when speed is crucial for success of the use case, for example when
(near) real-time analysis has to be done.
The distributed database that runs on the cluster can be one of the following types:
Relational (RDBMS): high-performing table-oriented databases with shared-disk or
shared-everything architecture. These databases are optimized for data quality and
ACID transactions, not for concurrency;
NoSQL: databases with built-in scalability, optimized for storing distributed
unstructured data, with shared nothing architecture (see paragraph 2.2 for an
explanation). There are several types of NoSQL databases:
o Key-Value: a schema-less mechanism to store data of any kind;
o Document: mechanism used for storing semi-structured information. A
document is a package of data in any format, e.g. XML or JSON, which are
stored via unique keys in the database;
o Object: a database that stores objects as in object-oriented programming.
Table 31 in Appendix III contains a list of options for the Distributed Database component.
4.3.1.4.5 Analytics Cluster
The analytics cluster is a hardware component that stores the processed data. The database
that runs on the cluster is typically smaller but more sophisticated and specialized than the
distributed database on the database cluster, for example graph (NoSQL database with
element in hierarchical graph structures), neural network databases or data warehouses that
go beyond the traditional BI capabilities. There is certainly overlap with the databases in the
Database Cluster; most products cannot be place in only one category. Table 32 of Appendix
III lists some options for the Analytics Database.

Big Data Reference Architecture
© Utrecht University of Applied Sciences
73
4.3.2 Policies & Guidelines
As part of the “what” dimension in Angelov’s framework, the policies and guidelines in the Big
Data Solution Reference Architecture consist of three sub-categories: architectural patterns,
architecture principles, and best practices.
4.3.2.1 Architectural Patterns
Architectural patterns “offer well-established solutions to architectural problems help to
document the architectural design decisions, facilitate communication between stakeholders
through a common vocabulary, and describe the quality attributes of a software system as
forces” (Avgeriou & Zdun, 2005). These architectural patterns are important to the working of
the reference architecture; they define the way the reference architecture is constructed and
the way the architects should work with the reference architecture. Table 7 contains the codes
that point to architectural patterns that were found in the expert interviews.
Code Cases Count
Data Pipeline 2 2
Cloud 1 3
Application layer is leading 1 2
Amdahl's Law 1 1
Use MapReduce to prepare data 1 1
Table 7: Coding frequencies for Architectural Patterns
The interview data shows that relatively few architectural patterns were mentioned. However,
these architectural patterns are important to the working of the reference architecture; they
actually define the way the reference architecture is constructed and the way the architects
should work with the reference architecture. In particular, the “Data Pipeline” code is important
to the construction of the reference architecture and to the architectures that will be created
from it. Together with code “Use MapReduce to prepare data” this forms the basis of patterns
“Pipes and Filters“ and “Batch Sequential”, as part of the “Data Flow View” (Avgeriou & Zdun,
2005). The Batch Sequential pattern is an excellent way to look at one MapReduce job, but is
no good guide for the entire data flow within a big data solution. The pattern is too simplistic
and too low-level to be a good candidate for the reference architecture. Therefore, the pattern
that was chosen as the one giving guidance to the data flow is the “Pipes and Filters” pattern.
Another architectural pattern that surfaces from the interviews is the “Layers” pattern. Codes
“Cloud” and “Application layer is leading” both indicate a layering in the architecture. Code
“Amdahl’s Law” is mentioned only once, and is not a clear indicator of a common pattern that
should be used in the Big Data Solution Reference Architecture. Therefore, this codes is not
used any further in the process of designing the reference architecture.
The following sub-paragraphs explain the the patterns “Pipes and Filters” and “Layers” in detail.

Big Data Reference Architecture
© Utrecht University of Applied Sciences
74
4.3.2.1.1 Pattern 1: Pipes and Filters
Following the data analysis, the first architectural pattern included in the reference architecture
is the “Pipes and Filters” pattern. This pattern deals with how streams of data are successively
processed or transformed by components.
The definition of the Pipes and Filters pattern is as follows:
"Consider as in BATCH SEQUENTIAL the case where a complex task can be sub-divided into
a number of smaller tasks, which can be defined as a series of independent computations.
Additionally the application processes streams of data, i.e. it transforms input data streams into
output data streams. This functionality should not be realized by one monolithic component
because this component would be overly complex, and it would hinder modifiability and
reusability. Furthermore, different clients require different variations of the computations, for
instance, the results should be presented in different ways or different kinds of input data should
be provided. To reach this goal, it must be possible to flexibly compose individual sub-tasks
according to the client’s demands. In a PIPES AND FILTERS architecture a complex task is
divided into several sequential subtasks. Each of these sub-tasks is implemented by a
separate, independent component, a filter, which handles only this task. Filters have a number
of inputs and a number of outputs and they are connected flexibly using pipes but they are
never aware of the identity of adjacent filters. Each pipe realizes a stream of data between two
components. Each filter consumes and delivers data incrementally, which maximizes the
throughput of each individual filter, since filters can potentially work in parallel. Pipes act as
data buffers between adjacent filters. The use of PIPES AND FILTERS is advisable when little
contextual information needs to be maintained between the filter components and filters retain
no state between invocations. PIPES AND FILTERS can be flexibly composed. However,
sharing data between these components is expensive or inflexible. There are performance
overheads for transferring data in pipes and data transformations, and error handling is rather
difficult." (Avgeriou & Zdun, 2005)
Using the Pipes and Filters pattern implies that the architecture of a big data solution must be
built around a series of tasks. In the Big Data Solution Reference Architecture, all layers contain
an example of the division into tasks. The best example is the Application Layer, which consists
of the components Importing Engine, Processing Engine, Analytics Engine, and Visualization
Engine. Each component is independent and modular, and can be thought of as a filter. Data
flows or streams in a pipe between these components, represented by the “Flow” ArchiMate
relation.
The Pipes and Filters pattern matches best with the common form of predictive analytics, where
data is presented, imported and processed in a sequence. In case of data exploration and
discovery (or knowledge discovery) as explained in paragraph 2.4.2, there is less of a data flow.
In that case, the Importing Engine is probably not used, or only has the function of a throughput

Big Data Reference Architecture
© Utrecht University of Applied Sciences
75
engine that simply transfers the data without doing anything with it. The Processing Engine will
contain data exploration and/or stream processing engines, and the Processing Engine takes
the form of a high-performance machine learning, mathematical analytics, or pattern recognition
framework.
4.3.2.1.2 Pattern 2: Layers
Another architectural pattern that can be identified from the interviews is “Layers”, as part of the
“Layered View”. Codes “Cloud” and “Application layer is leading” both indicate a layering in the
architecture. The Layers pattern is closely connected to the architecture principle “Loose
coupling” (see paragraph 4.3.2.2.1).
The definition of the Layers pattern is:
“Consider a system in which high-level components depend on low-level components to
perform their functionality, which further depend on even lower-level components and so on.
Decoupling the components in a vertical manner is crucial in order to support modifiability,
portability, and reusability. On the other hand, components also require some horizontal
structuring that is orthogonal to their vertical subdivision. To achieve these goals, the system is
structured into layers so that each layer provides a set of services to the layer above and uses
the services of the layer below. Within each layer, all constituent components work at the same
level of abstraction and can interact through connectors. Between two adjacent layers, a clearly
defined interface is provided. In the pure form of the pattern, layers should not be by-passed:
higher-level layers access lower-level layers only through the layer beneath.” (Avgeriou & Zdun,
2005)
The Layers pattern is implemented in the Big Data Solution Reference Architecture by
representing the components of the architecture in the layers Business Layer, Application
Layer, and Technology Layer. This division follows TOGAF and ArchiMate and is a standard
partition of solution architectures (see paragraph 4.2.4.4).
4.3.2.2 Architecture Principles
As stated in paragraph 4.2.4.1, normative architecture principles will be identified that give
guidance to architects that create big data solutions. Table 8 contains the codes that were
categorized as “Architecture Principle” in the expert interviews.
Code Cases Count
Higher-level programming language 4 6
Linux 2 3
Loose coupling 2 2
Open standards 2 3
Web Architecture 1 2
Table 8: Coding frequencies for Architecture Principles

Big Data Reference Architecture
© Utrecht University of Applied Sciences
76
The frequent occurrence of the code “Higher-level programming language” shows that the
subject matter experts often refer to programming languages. Programming languages that
were specifically mentioned in the interviews are Java, Python, Scooby, and Scalding. This
could be an important notion for software developers or system administrators, but is not
suitable for the goal and scope of the Big Data Solution Reference Architecture as the principles
should be semi-detailed and abstract or semi-concrete according to “type 3” reference
architectures of Angelov’s model (see paragraph 4.2.2).
The code “Linux” indicates an architecture principle that implicates a preferred use of the Linux
operating system over other operating systems. While architects will agree to use Linux in a big
data solution, the reference architecture must be independent of the implementation of
components, and thus independent of operating system. Therefore, the code “Linux” will not be
translated into an architecture principle.
The code “Web Architecture” is only used in one interview, and therefore too weak to be
considered for usage in the reference architecture. The codes “Loose coupling” and “Open
standards” result in two principles: “Loose coupling” and “Interoperability”. These principles are
presented in the following sub-paragraphs, with the notation prescribed by TOGAF 9.1 (see
paragraph 4.2.4.4.3).
4.3.2.2.1 Principle 1: Loose coupling
Name Loose coupling
Statement Create a solution with loosely coupled building blocks, e.g. message-exchanging
software components instead of integrated frameworks
Rationale By loosely coupling the components, the modularity, reusability and modifiability of
the solution increases. Big data is a fast-moving field, where components are
developed, improved, and retired frequently. To be able to cope with the changing
requirements and components, the big data solution has to be flexible. If a building
block has to be replaced, upgraded, removed, or added, other building blocks should
be impacted as little as possible. By loosely coupling the components, these kind of
actions are relatively easy.
Implications Components of the solution such as software packages, frameworks, databases
should be selected based on their ability to be decoupled from the solution. That
means components should have clear service contracts,
data interfaces, and/or APIs that preferably rely on messaging.
Table 9: Loose coupling architecture principle
4.3.2.2.2 Principle 2: Interoperability
Name Interoperability

Big Data Reference Architecture
© Utrecht University of Applied Sciences
77
Statement Software and hardware should conform to defined standards that promote
interoperability for data, applications, and technology.
Rationale Standards help ensure consistency, thus improving the ability to manage systems
and improve user satisfaction, and protect existing IT investments, thus maximizing
return on investment and reducing costs. Standards for interoperability additionally
help ensure support from multiple vendors for their products, and facilitate supply
chain integration.
Implications Interoperability standards and industry standards will be followed unless there
is a compelling business reason to implement a non-standard solution.
A process for setting standards, reviewing and revising them periodically, and
granting exceptions must be established.
The existing IT platforms must be identified and documented.
Table 10: Interoperability architecture principle
4.3.2.3 Architectural Best Practices
Architectural best practices describe other aspects that are considered important when creating
a big data solution architecture. These best practices are aimed at processes in which architects
surely are involved: management, selection of components, planning, estimating, budgeting,
cooperation with internal and external suppliers, and so forth. The category Architectural Best
Practices consists of codes that indicate important concepts, methods, and techniques for
architects when working on big data solutions. Table 11 contains an overview of the codes.
Code Cases Count
Free and open-source 4 7
Highly skilled team 4 5
Individualization 4 4
Fuzzy Logic 3 5
Don't use commercial products 3 4
Agile development 2 6
Database type 2 5
Scalability 2 5
Top-down approach 2 5
Reference architecture is necessary 2 4
Use service providers 2 4
CAP Theorem 2 3
Get an overview 2 3
Manage the hype 2 3

Big Data Reference Architecture
© Utrecht University of Applied Sciences
78
Performance 2 2
Risk of obsolete technology 2 2
Industry-independent 1 4
Data quality 1 2
Filter data before use 1 2
Basic model 1 1
Bottom-up approach 1 1
Details matter 1 1
DevOps 1 1
Objectivity 1 1
Think in batch-processing 1 1
Use large files 1 1
Work cost-effective 1 1
Table 11: Coding frequencies for Best Practices
Two best practices were distilled from these codes: “Use free and open-source software” and
“Agile development”, which are explained in detail in the following sub-paragraphs.
4.3.2.3.1 Best Practice 1: Use free and open-source software
Most architectures that are addressed in the interviews and literature are based on FOSS
components. When asked specifically, the interviewed architects agree to the notion that free
and open-source software forms the core of big data. As mentioned in the literature study (see
paragraphs 2.2 and 4.1), there are commercial (proprietary) products and services available
that are based on the FOSS stack; for example, several large IT companies are trying to
solutionify Hadoop. However, as pointed out by the interviewed stakeholders, the free and
open-source community is leading in innovation when it comes to big data software
components. This notion is even supported by commercial organizations such as IBM
(Zikopoulos, et al., 2013). The FOSS products are simply better than the commercial ones in
terms of usability, modifiability, performance, reliability, and costs. Vendor lock-in is avoided,
and the architecture principles “Loose coupling” and “Interoperability” can be applied more
easily with FOSS.
Free and open-source (FOSS) in this reference model is software that is both free and open-
source, classified according to the definition of the Free Software Foundation. This definition
states that software can used, copied, changed, and distributed by anyone (Free Software
Foundation, 2013). The FOSS definition is tighter than the Open Source definition, which only
states that the software should be free of charge and the source code should be publicly
available and modifiable (The Open Source Initiative, 2008). The Open Source definition is only

Big Data Reference Architecture
© Utrecht University of Applied Sciences
79
applicable to practical applications, not to the social and political aspects (Stallman, Why Open
Source misses the point of Free Software, sd). In contrast, FOSS is about the liberty of software,
not about the price. The unfortunate event is that the word “free” in English speech has two
meanings, unlike for example French where there is libre and gratuit. This point is made clear
in Richard Stallman’s famous article in which he states: “think of “free speech,” not “free beer.””
(Stallman, The Free Software Definition, 2013). Examples of FOSS licenses are the GNU
(Lesser) Public License, the Apache Licenses, the Microsoft Public License, the Mozilla Public
Licenses, and the Intel Open Source License (Free Software Foundation, 2012).
Preferring FOSS components over proprietary software can have some impact on organization,
especially if this best practice is not implemented yet. With FOSS, organizations cannot rely on
support contracts and have to build up knowledge of the components in-house.
4.3.2.3.2 Best Practice 2: Agile development
The codes “Agile development’ and “DevOps” indicate a strong preference for agile
methodologies when it comes to creating big data solutions. There should be a strong
preference for agile methodologies when it comes to creating big data solutions. Architects
should be advised to create software and hardware iteratively, and release small changes to
an existing working solution. Examples of methodologies that have proven to be successful in
an “agile” way are Scrum (Schwaber, 1995), Kanban (Kniberg & Skarin, 2009), Lean
(Poppendieck & Poppendieck, 2003), and XP (Beck, Extreme Programming Explained:
Embrace Change, 2004). All these methods have in common that they strive for high-quality
working solutions by having small teams working collaboratively in short iterations, focusing on
the delivery of useful artifacts. In a certain sense, the Rational Unified Process (RUP) can also
be considered “agile” when applied in the correct way, although this methodology is usually not
thought of as a purely iterative but rather as a mixture of traditional “waterfall” and modern
“agile” approaches (Kruchten, 2003). Each organization should take their pick for a method, as
long as the principles in the Agile Manifesto (Beck, et al., 2001) are applied strictly. For some
organizations that are engaging a big data project, an agile way of working will already be in
place since agile is becoming the de-facto standard in software development (Dingsøyr, Nerur,
Balijepally, & Moe, 2012). If that is not the case, the introduction of agile development will
introduce some difficulties as a switch from traditional methodologies can be a cultural
challenge (Livari & Livari, 2011).
4.3.3 Summary
The Big Data Solution Reference Architecture is a model for creating solutions that make
predictions about the future using open data sources and structured, semi-structured, and
unstructured enterprise data. The reference architecture is usable for architects in “green field”
situations or in projects with an existing technology base. The reference architecture is generic
on purpose; any commercial or public organization can use it to apply in a typical big data use
case.

Big Data Reference Architecture
© Utrecht University of Applied Sciences
80
The Big Data Solution Reference Architecture presents the following key points to architects:
Create a big data solution that is derived from the components & interfaces diagram
presented in paragraph 4.3.1.1;
Think of the big data solution as a pipeline, with components that act as filters;
Divide the solution in layers;
Make sure components are loosely coupled;
Use open standards to enable interoperability;
Use free and open-source software components where possible;
Develop agile.
4.4 JUSTIFICATION / EVALUATION OF REFERENCE ARCHITECTURE
This paragraph contains a justification of the Big Data Solution Reference Architecture,
described in paragraph 4.3. This evaluation is part three of Hevner’s Information Systems
Research Framework (see Figure 4) and the method that was used is a questionnaire that
evaluated the quality criteria of a reference architecture, based on SAAM (see paragraph 3.3).
The following paragraphs describe the most interesting findings of the questionnaire, per
section. For an overview of the sections, see paragraph 3.3.3. Appendix II contains the full list
of the questionnaire results.
4.4.1 Sampling
The target population of the reference architecture is all big data architects. Of this population,
a representative group of 50 big data architects was selected as a representative sample. This
group was considered a representative sample of the population. The sampling was done by
selecting big data specialists from the personal network of the researcher. Of this sample, ten
respondents answered the questionnaire. The response rate is therefore 20%. The number of
respondents is considered not big enough to formulate definite conclusions about the quality of
the reference architecture, so any conclusions should be taken lightly as three is no full scientific
proof.
4.4.2 Section 1: Introduction
The respondents have several roles (manager, architect, developer, etc.), but all are related to
IT. All respondents are more or less experienced with big data and predictive analytics. Three
respondents use big data technology in their day-to-day work. This indicates a small but highly
skilled group of respondents.
4.4.3 Section 2: Impressions of the Big Data Solution Reference Architecture
The answers to the first four questions in section 2 indicate that the respondents are likely to
use the elements of the Big Data Solution Reference Architecture in their work. The mean score
on these questions is
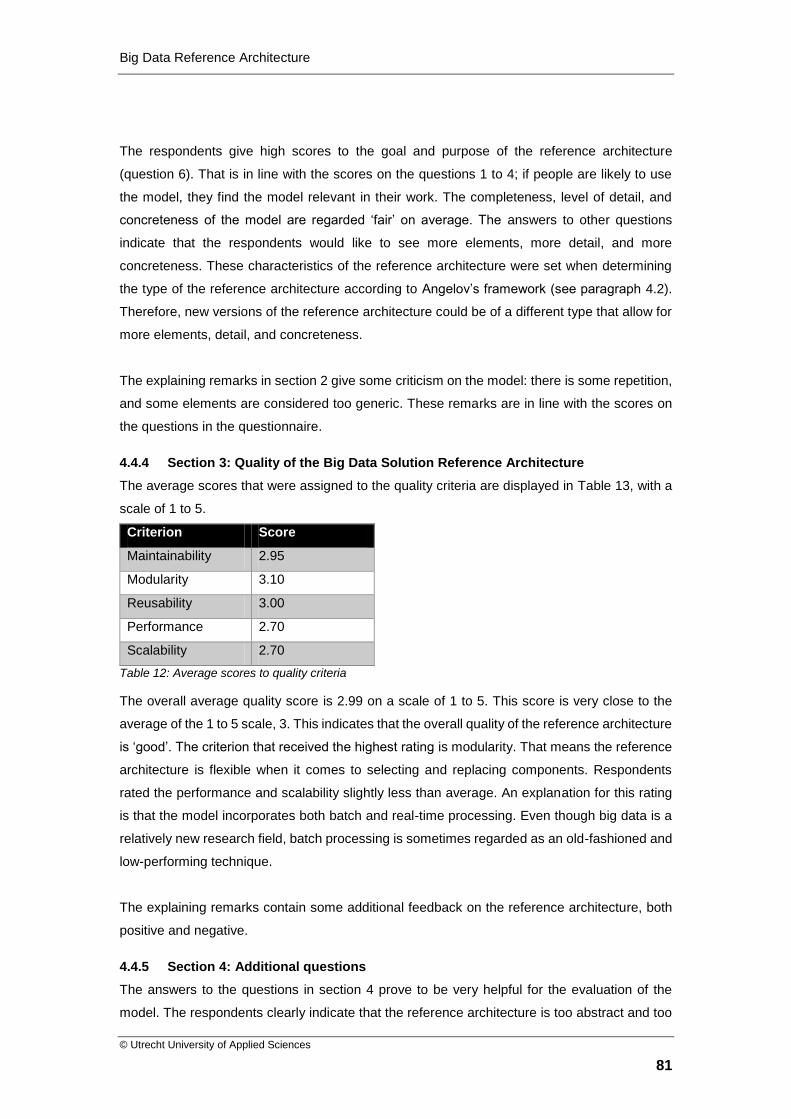
Big Data Reference Architecture
© Utrecht University of Applied Sciences
81
The respondents give high scores to the goal and purpose of the reference architecture
(question 6). That is in line with the scores on the questions 1 to 4; if people are likely to use
the model, they find the model relevant in their work. The completeness, level of detail, and
concreteness of the model are regarded ‘fair’ on average. The answers to other questions
indicate that the respondents would like to see more elements, more detail, and more
concreteness. These characteristics of the reference architecture were set when determining
the type of the reference architecture according to Angelov’s framework (see paragraph 4.2).
Therefore, new versions of the reference architecture could be of a different type that allow for
more elements, detail, and concreteness.
The explaining remarks in section 2 give some criticism on the model: there is some repetition,
and some elements are considered too generic. These remarks are in line with the scores on
the questions in the questionnaire.
4.4.4 Section 3: Quality of the Big Data Solution Reference Architecture
The average scores that were assigned to the quality criteria are displayed in Table 13, with a
scale of 1 to 5.
Criterion Score
Maintainability 2.95
Modularity 3.10
Reusability 3.00
Performance 2.70
Scalability 2.70
Table 12: Average scores to quality criteria
The overall average quality score is 2.99 on a scale of 1 to 5. This score is very close to the
average of the 1 to 5 scale, 3. This indicates that the overall quality of the reference architecture
is ‘good’. The criterion that received the highest rating is modularity. That means the reference
architecture is flexible when it comes to selecting and replacing components. Respondents
rated the performance and scalability slightly less than average. An explanation for this rating
is that the model incorporates both batch and real-time processing. Even though big data is a
relatively new research field, batch processing is sometimes regarded as an old-fashioned and
low-performing technique.
The explaining remarks contain some additional feedback on the reference architecture, both
positive and negative.
4.4.5 Section 4: Additional questions
The answers to the questions in section 4 prove to be very helpful for the evaluation of the
model. The respondents clearly indicate that the reference architecture is too abstract and too

Big Data Reference Architecture
© Utrecht University of Applied Sciences
82
generic on many points. There are several compliments to the model: clear diagrams and
descriptions, layering, etc. The sections contain the following suggestions for improvements:
Add caching mechanism. This could result in an additional component, a new
architecture pattern or an architectural best practice;
Increase the amount of (near) real-time processing options;
Add organizational elements: business/application functions in addition to concrete
components. This is a suggestion to add more components in the Behavior structure
in the ArchiMate diagram;
4.4.6 Summary
Ten big data experts out of a sample of 50 completed a questionnaire that investigated the
quality aspects of the Big Data Solution Reference Architecture. The results of the
questionnaire indicate that the reference architecture meets all of the quality criteria that were
defined in the research design: maintainability, modularity, reusability, performance, and
scalability. Moreover, the general impressions of the model are reasonably positive. There are
high scores on the likeliness that architects and other big data experts are going to use
elements of the model. Altogether, this indicates that the model can be qualified as a
‘reasonably good’ reference architecture. It will have its use in the architecture community, and
will probably be adopted once published. However, there is some criticism on the reference
architecture as well. Most importantly, respondents question the usability of the model. The
respondents give relatively low ratings to the performance, scalability, completeness, level of
detail, and the concreteness of the model. The reason for doubt on the usability is primarily due
to the level of abstraction; the model is considered too general, especially the architectural
patterns, architecture principles, and architectural best practices.

Big Data Reference Architecture
© Utrecht University of Applied Sciences
83
5 CONCLUSION
This thesis describes a research project with the aim of creating a reference architecture for big
data solutions. The research question of the project was: “What is a good reference architecture
for a solution that is able to use big data technology to perform predictive analytics of open data
sources combined with structured and unstructured enterprise data?” To answer this research
question, the project consisted of the creation of a big data solution reference architecture
based on existing literature and expert interviews. A group of ten big data experts responded
to a questionnaire to evaluate and justify the model.
5.1 OBSERVATIONS
The research method used Hevner’s Information Systems Research Framework and Angelov’s
reference architecture creation framework for the design and analysis of the reference
architecture.
First, the researcher conducted an extensive literature review and created a provisional model
of the reference architecture. Using the knowledge gained in the literature study and the
provisional model, the researcher interviewed five big data experts and analyzed the
transcribed interview data using grounded theory and qualitative data analysis tools, thereby
producing a coded dataset. The derived coding categories of the dataset form the basis of the
contents of the reference architecture:
Software components & interfaces;
Policies & guidelines
o Architecture principles;
o Architecture patterns;
o Architectural best practices.
By presenting a questionnaire to a group of big data experts, the resulting reference architecture
was justified and evaluated. The quality of the model was ramified into five criteria:
maintainability, modularity, reusability, performance, and scalability. A group of ten people
completed the questionnaire was, out of a sample of 50. That is too little to make hard
classifications about the quality of the model. However, the questionnaire was only distributed
to people working with big data, and all respondents were more or less knowledgeable and
experienced in that area. This makes the results of the questionnaire fairly accurate, and gives
certain weight to the outcome. Nonetheless, the results should not be treated as scientific proof
but as indicative evidence.

Big Data Reference Architecture
© Utrecht University of Applied Sciences
84
The results of the questionnaire indicate that big data architects will likely use the Big Data
Solution Reference Architecture in their work. Table 13 displays the average scores on the
quality criteria, on a scale of 1 to 5.
Criterion Score
Maintainability 2.95
Modularity 3.10
Reusability 3.00
Performance 2.70
Scalability 2.70
Table 13: Average scores to quality criteria
The overall average quality score is 2.99 on a scale of 1 to 5. This answers the main research
question; the created model is a ‘reasonably good’ reference architecture for a solution with big
data technology to perform predictive analytics of open data sources combined with structured,
semi-structured, and unstructured data sources.
The answers to the sub-questions of the main research question are as follows:
Which architecture principles, patterns, and best practices are applicable when using
big data technology and open data sources to create a solution for predictive analysis
of enterprise data?
o The reference architecture contains two architecture principles, next to
architecture patterns and best practices, that architects are advised to adhere
to when creating a big data solution: Loose coupling and Interoperability;
Which components from the field of big data are good building blocks to create a
solution architecture capable of predictive analysis of enterprise data, and in what
configuration?
o The reference architecture contains the most important components and
interfaces for a big data solution. These components are displayed as abstract
building blocks in a one-page overview and are explained in detail in the
supporting text;
In what way can open data sources help to perform predictive analytics of enterprise
data?
o As stated in the reference architecture, open data sources can play an
imported role in a big data solution architecture. This surfaces in the structured
and unstructured data sources that are part of the reference architecture;
Is Angelov’s framework useful to create a reference architecture for big data solutions?
o Angelov’s framework has greatly helped in designing the Big Data Solution
Reference Architecture. The framework gave guidance and structure to the
creative process. However, respondents of the survey gave criticism on the
level of detail and concreteness of the resulting model. Determining these

Big Data Reference Architecture
© Utrecht University of Applied Sciences
85
aspects was part of applying Angelov’s framework, after setting the type of the
reference architecture (see paragraph 4.2.4). The type of the reference
architecture is fundamental to its design. At the same time, the model could
benefit from more detail and concreteness. This is a contradiction; therefore,
Angelov’s framework may not be suitable for possible future improvements. If
Angelov’s framework is maintained, the type of the reference architecture
should be adjusted, which would lead to a completely new reference
architecture;
Is Hevner’s Information Systems Research Framework useful to create a reference
architecture for big data solutions?
o Hevner’s model has proven to be an excellent guideline for creating a reference
architecture. All steps in the research design followed each other logically.
Working with the model was a pleasant way of performing this research project.
All steps were logical, clearly explained, and easy to execute.
5.2 CONTRIBUTION
Since the Big Data Solution Reference Architecture is a ‘good’ reference architecture for its
purpose, the question rises what this implies.
First, the model is unique in its kind. It is the first (and currently only) reference architecture for
big data, predictive analytics, and open data that is somewhat supported by scientific evidence.
This makes the model the best reference architecture for architects working in this area; all
other reference architectures are either commercial in intend or have been created by
individuals or organizations without evidence of the components. Most authors even fail to
explain the reasoning behind their model.
Another aspect that makes the Big Data Solution Reference Architecture unique is it
completeness. Most similar reference architectures only consist of a diagram of software
components. In contrast, the Big Data Solution Reference Architecture contains components &
interfaces, architectural patterns, architecture principles, and architectural best practices. All of
these elements are described in detail and are backed up by literature research and a
qualitative data analysis (grounded theory) of expert interviews.
The results of the questionnaire indicate that it is likely that big data experts will use the Big
Data Solution Reference Architecture in their daily work. That statement in itself is a strong
accomplishment; an important goal of the model is to have a place in real projects by big data
architects.

Big Data Reference Architecture
© Utrecht University of Applied Sciences
86
Finally, by performing extensive literature research and interviewing subject matter experts, this
thesis has made an important contribution to the fields of big data, solution architectures,
reference architectures, BI, and predictive analytics. By documenting the findings, the
knowledge about these subjects has been enlarged and deepened.
To summarize, the Big Data Solution Reference Architecture is a new and unique model that
delivers a strong contribution to the community of architects and other people who are working
with big data technology, open data, and predictive analytics.
5.3 FUTURE RESEARCH
This paragraph contains suggestions for future research that would contribute to the scientific
community with the use of the Big Data Solution Reference Architecture.
An obvious future step is to create a solution architecture with guidance of the reference
architecture. By conducting one or more case studies with the model, its practical use and
quality can be investigated. An example of a case study is to create a solution architecture for
a bank, with the goal of combining open data sources (e.g. weather data) with enterprise data
(e.g. bank account balances) to produce a forecast (e.g. buying behavior of citizens in a
shopping area). Another example is to create an architecture in a government organization that
helps to predict the amount of violence in the upcoming weekend by combining holiday dates,
the football calendar, traffic data, weather data, and others.
The Big Data Solution Reference Architecture was only evaluated with ten respondents to the
questionnaire. A future research project could repeat the evaluation with a larger sample, to
gain more accurate insight into the quality of the reference architecture.
It would be interesting to see how the Big Data Solution Reference Architecture evolves over
time. Angelov et al. provided a framework for the evolution of reference architectures (see
Figure 34). For example, it is possible that the Big Data Solution Reference Architecture evolves
from type 3 to type 1 or variant 3.1.

Big Data Reference Architecture
© Utrecht University of Applied Sciences
87
Figure 34: Framework for the evolution of reference architectures (Angelov et al., 2012)
Another iteration of Hevner’s Design Science framework could improve the model. As
suggested, the type of reference architecture according to Angelov’s framework could be
adjusted to increase the levels of concreteness and detail of the reference architecture. Another
option is to maintain a type 3 architecture, and design the model so that the concreteness and
detail are maximized within the boundaries of Angelov’s model. The third option is to step away
from Angelov’s framework and use another model to design an improved version of the
reference architecture.
Finally, a future research project could investigate the way in which organizations move from
traditional BI systems to modern big data analytics. It would be useful to see if the Big Data
Solution Reference Architecture can play a role in migration projects, e.g. by mapping the
existing BI software components to new systems in the target architecture.
Big Data Reference Architecture
© Utrecht University of Applied Sciences
88
6 REFERENCES
Abowd, G., Bass, L., Clements, P., Kazman, R., Northrop, L., & Zaremski, A. (1997).
Recommended Best Industrial Practice for Software Architecture Evaluation. Software
Engineering Institute. Pittsburgh, PA, USA: Carnegie Mellon University.
Angelov, S., Grefen, P., & Greefhorst, D. (2012). A framework for analysis and design of
software reference architectures. (Elsevier, Ed.) Information and Software
Technology(54), 417-431.
Anuganti, V. (2012, November 30). Typical "Big" Data Architecture. Retrieved from Venu
Anuganti Blog: http://venublog.com/2012/11/30/typical-big-data-architecture/
Arsanjani, A., Zhang, L.-J., Ellis, M., Allam, A., & Channabasavaiah, K. (2007, March 28).
Design an SOA solution using a reference architecture. Retrieved from IBM:
http://www.ibm.com/developerworks/library/ar-archtemp/
Ashton, K. (2009, June 22). That 'Internet of Things' Thing. Retrieved from RFID Journal:
http://www.rfidjournal.com/articles/view?4986
AUTOSAR. (2013, March 15). 4.1. Retrieved from AUTOSAR: http://www.autosar.org
Avgeriou, P., & Zdun, U. (2005). Architectural Patterns Revisited – A Pattern Language. 10th
European Conference on Pattern Languages of Programs, (pp. 1-39). Irsee, Germany.
Barlow, M. (2013). Real-Time Big Data Analytics: Emerging Architecture. Sebastopol, CA, USA:
O'Reilly Media, Inc.
Beck, K. (2004). Extreme Programming Explained: Embrace Change (2nd ed.). Addison-
Wesley.
Beck, K., Beedle, M., Bennekum, A. v., Cockburn, A., Cunningham, W., Fowler, M., . . . Thomas,
D. (2001). Principles behind the Agile Manifesto. Retrieved from Manifesto for Agile
Software Development: http://agilemanifesto.org/
Beijer, P., & de Klerk, T. (2010). IT Architecture - Essential Practice for IT Business Solutions.
Lulu.com.
Bernus, P., & Nemes, L. (1996). A framework to define a generic enterprise reference
architecture and methodology. Computer Integrated Manufacturing Systems, 9(3), pp.
179-191.
Braunschweig, K., Eberius, J., Thiele, M., & Lehner, W. (2102). The State of Open Data - Limits
of Current Open Data Platforms. International World Wide Web Conference 2012.
Lyon, France.
Briggs, L. L. (2012, October 24). Big Data Calls for New Architecture, Approaches. Retrieved
from TDWI: http://tdwi.org/articles/2012/10/24/big-data-architecture-approaches.aspx
Brin, S., & Page, L. (1998). The Anatomy of a Large-Scale Hypertextual Web Search Engine.
Computer Networks and ISDN Systems, 30(3), 107-117.
Bryman, A., & Bell, E. (2007). Business Research Methods (2nd ed.). Oxford: Oxford University
Press.

Big Data Reference Architecture
© Utrecht University of Applied Sciences
89
Busa, N. (2013, February 2). Big Data: A technology overview. Retrieved from Natalino Busa:
http://www.natalinobusa.com/2013/02/big-data-technology-overview.html
Buschmann, F., Meunier, R., Rohnert, H., Sommerlad, P., & Stal, M. (1996). Pattern-Oriented
Software Architecture. Wiley.
Carter, P. (2011). Big Data Analytics: Future Architectures, Skills and Roadmaps for the CIO.
Singapore: IDC.
Cattell, R. (2010, December). Scalable SQL and NoSQL Data Stores. SIGMOD Record, 39(4),
pp. 12-27.
CERN. (2013). Data analysis. Retrieved from CERN:
http://public.web.cern.ch/public/en/research/DataAnalysis-en.html
Chang, F., Dean, J., Ghemawat, S., Hsieh, W. C., Wallach, D. A., Burrows, M., . . . Gruber, R.
E. (2006). Bigtable: A Distributed Storage System for Structured Data. 7th USENIX
Symposium on Operating Systems Design and Implementation (OSDI), (pp. 205-218).
Seattle, WA, USA.
Cheung, S., Resende, L., Lindner, S., & Saracco, C. M. (2012, April 23). Developing a big data
application for data exploration and discovery. Retrieved from IBM:
http://www.ibm.com/developerworks/library/bd-exploration/
Ching, A. (2013, August 14). Scaling Apache Giraph to a trillion edges. Retrieved from
Facebook: https://www.facebook.com/notes/facebook-engineering/scaling-apache-
giraph-to-a-trillion-edges/10151617006153920
Cloutier, R., Mullet, G., Verma, D., Nilchiani, R., Hole, E., & Bone, M. (2010). The Concept of
Reference Architecture. Systems Engineering, 13(1), 14-26.
Corbin, J., & Strauss, A. (2008). Basics of Qualitative Research: Grounded Theory Procedures
and Techniques (3rd ed.). SAGE Publications, Inc.
CSC. (2012). Big Data Just Beginning to Explode. Retrieved from CSC:
http://www.csc.com/insights/flxwd/78931-
big_data_growth_just_beginning_to_explode
DeCandia, G., Hastorun, D., Jampani, M., Kakulapati, G., Lakshman, A., Pilchin, A., . . . Vogels,
W. (2007). Dynamo: Amazon's Highly Available Key-value Store. 21st ACM
Symposium on Operating Systems Principles (pp. 205-220). Stevenson, WA, USA:
ACM.
Demirkan, H., & Delen, D. (2012). Leveraging the capabilities of service-oriented decision
support systems: Putting analytics and big data in the cloud. Decision Support
Systems, 1-10. doi:10.1016/j.dss.2012.05.048
Dingsøyr, T., Nerur, S., Balijepally, V., & Moe, N. B. (2012). A decade of agile methodologies:
Towards explaining agile software development. The Journal of Systems and
Software(85), 1213-1221.
Dobrica, Liliana, & Niemalä, E. (2002, July). A Survey on Software Architecture Analysis
Methods. IEEE Transactions on Software Engineering, 28(7), pp. 638-653.

Big Data Reference Architecture
© Utrecht University of Applied Sciences
90
Eaton, C., deRoos, D., Deutsch, T., Lapis, G., & Zikopoulos, P. (2012). Understanding Big Data
- Analytics for Enterprise Class Hadoop and Streaming Data. (S. Sit, Ed.) New York,
USA: McGraw-Hill.
Economist Intelligence Unit. (2011). Big data: Harnessing a game-changing asset. London, UK:
Economist Intelligence Unit Limited.
Edlich, S. (2013). List of NoSQL Databases. Retrieved from http://nosql-database.org/
European Commission. (2012, July 17). Commission recommendation of 17.7.2012 on access
to and preservation of scientific information. Brussels, European Union.
European Commission. (2012, July 7). Towards better access to scientific information: Boosting
the benefits of public investments in research. Brussels, European Union.
Evans, E. (2009, June 11). NOSQL meetup. Retrieved from Eventbrite:
http://nosql.eventbrite.com/
Fayyad, U. M., Piatetsky-Shapiro, G., Smyth, P., & Uthurusamy, R. (1996). Advances in
Knowledge Discovery and Data Mining. American Association for Artificial Intelligence.
Fayyad, U., Piatetsky-Shapiro, G., & Smyth, P. (1996, Fall). From Data Mining to Knowledge
Discovery in Databases. AI Magazine, pp. 37-54.
Feinleib, D. (2012, July 6). The Big Data Landscape. Retrieved from Forbes:
http://www.forbes.com/sites/davefeinleib/2012/06/19/the-big-data-landscape/
Ferguson, M. (2012). Architecting A Big Data Platform for Analytics. IBM. Wilmslow, UK:
Intelligent Business Strategies. Retrieved from
http://www.ibmbigdatahub.com/whitepaper/architecting-big-data-platform-analytics
Forrester. (2013). Big Data. Retrieved from Forrester: http://www.forrester.com/Big-Data
Fowler, M. (2002). Patterns of Enterprise Application Architecture. Addison-Wesley.
Free Software Foundation. (2012, July 15). Various Licenses and Comments about Them.
Retrieved from Free Software Foundation: http://www.gnu.org/licenses/license-list.html
Free Software Foundation. (2013, June 18). The Free Software Definition, 1.122. Retrieved
from Free Software Foundation: http://www.gnu.org/philosophy/free-sw.html
Fujitsu. (2013). Solution Approaches for Big Data. Munich, Germany: FUJITSU Technology
Solutions GmbH.
Gamma, E., Helm, R., Johnson, R., & Vlissides, J. (1994). Design Patterns: Elements of
Reusable Object-Oriented Software. Addison-Wesley.
Garlan, D., & Shaw, M. (1994). An Introduction to Software Architecture. Pittsburgh, PA: School
of Computer Science, Carnegie Mellon University.
Gartner. (2012). Business Intelligence (BI). Retrieved from Gartner IT Glossary:
http://www.gartner.com/it-glossary/business-intelligence-bi/
Gartner. (2013). Big Data, Bigger Opportunities: Investing in Information and Analytics.
Retrieved from Gartner: http://www.gartner.com/technology/research/big-data/
Ghemawat, S., Gobioff, H., & Leung, S.-T. (2003). The Google File System. Proceedings of the
19th ACM Symposium on Operating Systems Principles (pp. 29-43). Boston Landing,
NY, USA: ACM.
Big Data Reference Architecture
© Utrecht University of Applied Sciences
91
Google. (2012, April 27). Google Data APIs. Retrieved from Google Developers:
https://developers.google.com/gdata/
Goutier, H., & Lieshout, J. v. (2010, September 29). NORA, 3.0. Retrieved from e-overheid:
http://e-overheid.nl/onderwerpen/e-overheid/architectuur/nora-familie/nora
Graaf, B., Dijk, v. H., & Deursen, A. v. (2005). Evaluating an Embedded Software Reference
Architecture. Proceedings of the Ninth European Conference on Software Maintenance
and Reengineering (CSMR’05) (pp. 354-363). Manchester, UK: IEEE.
Gray, J. (1981). The Transaction Concept: Virtues and Limitations. VLDB '81 Proceedings of
the Seventh International Conference on Very Large Databases (pp. 144-154).
Cannes, France: Tandem Computers Incorporated.
Greefhorst, D., & Proper, E. (2011). Architecture Principles: The Cornerstones of Enterprise
Architecture. Springer.
Gualtieri, M. (2013, January 3). The Forrester Wave™: Big Data Predictive Analytics Solutions,
Q1 2013. Cambridge, MA, USA: Forrester. Retrieved from
http://www.forrester.com/The+Forrester+Wave+Big+Data+Predictive+Analytics+Solut
ions+Q1+2013/fulltext
Harris, D. (2012, February 6). What it really means when someone says ‘Hadoop’. Retrieved
from Gigaom: http://gigaom.com/2012/02/06/what-it-really-means-when-someone-
says-hadoop/
Herodotou, H., Lim, H., Luo, G., Borisov, N., Dong, L., Cetin, F. B., & Babu, S. (2011). Starfish:
A Self-tuning System for Big Data Analytics. 5th Conference on Innovative Data
Systems Research (CIDR '11) (pp. 261-272). Asilomar, California: Duke University.
Hevner, A. R., March, S. T., Park, J., & Ram, S. (2004, March). Design Science in Information
Systems Research. MIS Quarterly, 28(1), pp. 75-105.
Hortonworks. (2012). Apache Hadoop: The Big Data Refinery. Sunnyvale, CA.
Howson, C. (2008). Successful Business Intelligence: Secrets to Making BI a Killer App.
Chicago: McGraw-Hill/Osborne.
Ibarra, F. (2012, August 28). 4 Key Architecture Considerations for Big Data Analytics.
Retrieved from VMware: http://blogs.vmware.com/vfabric/2012/08/4-key-architecture-
considerations-for-big-data-analytics.html
IEEE. (2013). IEEE Standards Association. Retrieved from IEEE - Advancing Technology for
Humanity: http://standards.ieee.org/
IFIP–IFAC Task Force on Architectures for Enterprise Integration. (1999, March). GERAM:
Generalised Enterprise Reference Architecture and Methodology. Retrieved from
Griffith University:
http://www.ict.griffith.edu.au/~bernus/taskforce/geram/versions/geram1-6-
3/v1.6.3.html
Joshi, R. (2011, March 26). A Model For The Big Data Era - Data-centric architecture is
becoming fashionable again. Retrieved from InformationWeek:

Big Data Reference Architecture
© Utrecht University of Applied Sciences
92
http://www.informationweek.com/development/architecture-design/a-model-for-the-
big-data-era/229301115
Kazman, R., Bass, L., Abowd, G., & Webb, M. (1994). SAAM: A Method for Analyzing the
Properties of Software Architectures. ICSE '94 Proceedings of the 16th international
conference on Software engineering (pp. 81-90). Sorrento, Italy: IEEE.
Kazman, R., Klein, M., Barbacci, M., Longstaff, T., Lipson, H., & Carriere, J. (1998). The
Architecture Tradeoff Analysis Method. Proceedings of the Fourth IEEE International
Conference on Engineering of Complex Computer Systems (ICECCS) (pp. 68-78).
Monterey, CA, USA: IEEE.
Kimball, R. (2012, September). Newly Emerging Best Practices for Big Data. Retrieved from
Kimball Group: http://www.kimballgroup.com/2012/09/30/newly-emerging-best-
practices-for-big-data/
KING - Kwaliteitsinstituut Nederlandse Gemeenten. (2011). GEMMA. Retrieved from KING:
http://www.kinggemeenten.nl/king-kwaliteitsinstituut-nederlandse-gemeenten/e-
dienstverlening-verbeteren/gemma
Kniberg, H., & Skarin, M. (2009). Kanban and Scrum - making the most of both. InfoQ.
Retrieved from http://www.infoq.com/minibooks/kanban-scrum-minibook
Koff, W., & Gustafson, P. (2011). Data rEvolution. Retrieved from CSC Leading Edge Forum:
http://www.csc.com/lef/ds/84818-data_revolution
Kolbielus, J. G. (2012, February 2). The Forrester Wave™: Enterprise Hadoop Solutions, Q1
2012.
Kruchten, P. (2003). The Rational Unified Process: An Introduction (3rd ed.). Addison-Wesley.
Krzywinsk, M. I., Schein, J. E., Birol, I., Conners, J., Gascoyne, R., Horsman, D., . . . Marra, M.
A. (2009). Circos: An information aesthetic for comparative genomics. Genome
Research, 1639-1645. Retrieved from Circos: http://circos.ca/intro/genomic_data/
Laney, D. (2001, February 6). 3D Data Management: Controlling Data Volume, Velocity, and
Variety. Retrieved from Gartner: http://blogs.gartner.com/doug-
laney/files/2012/01/ad949-3D-Data-Management-Controlling-Data-Volume-Velocity-
and-Variety.pdf
Lankhorst, M. M. (2004). Enterprise architecture modelling—the issue of integration. Advanced
Engineering Informatics(18), 205-216.
Law, C. C., Schroeder, W. J., Martin, M. K., & Temkin, J. (1999). A Multi-Threaded Streaming
Pipeline Architecture for Large Structured Data Sets. Proceedings of the conference
on Visualization '99 (pp. 225-232). San Francisco, CA, USA: IEEE Computer Society
Press.
Leavitt, N. (2010, February). Will NoSQL Databases Live Up to Their Promise? IEEE Computer,
43(2), pp. 12-14.
Leinweber, D. (2013, April 26). Big Data Gets Bigger: Now Google Trends Can Predict The
Market. Retrieved from Forbes:

Big Data Reference Architecture
© Utrecht University of Applied Sciences
93
http://www.forbes.com/sites/davidleinweber/2013/04/26/big-data-gets-bigger-now-
google-trends-can-predict-the-market/
Lewis, M. (2004). Moneyball: The Art of Winning an Unfair Game. New York: W. W. Norton &
Company.
Lith, A., & Mattson, J. (2010, June). Investigating storage solutions for large data - A comparison
of well performing and scalable data storage solutions for real time extraction and batch
insertion of data. Göteborg, Sweden.
Livari, J., & Livari, N. (2011). The relationship between organizational culture and the
deployment of agile methods. Information and Software Technolgy(53), 509-520.
Lohr, S. (2013, February 1). The Origins of ‘Big Data’: An Etymological Detective Story.
Retrieved from The New York Times: http://bits.blogs.nytimes.com/2013/02/01/the-
origins-of-big-data-an-etymological-detective-story/?_r=0
Luhn, H. P. (1958). A Business Intelligence System. IBM Journal, 314-319.
Malewicz, G., Austern, M. H., Bik, A. J., Dehnert, J. C., Horn, I., Leiser, N., & Czajkowski, G.
(2010). Pregel: A System for Large-Scale Graph Processing. Proceedings of the 2010
ACM SIGMOD International Conference on Management of data (pp. 135-145).
Indianapolis, IN, USA: ACM.
Mangelsdorf, J. (2012, Spring). Supercomputing the Climate: NASA's Big Data Mission. CSC
World, pp. 10-13. Retrieved from
http://www.csc.com/cscworld/publications/81769/81773-
supercomputing_the_climate_nasa_s_big_data_mission
Marz, N., & Warren, J. (2013). Big Data - Principles and best practices of scalable realtime data
systems. Manning Publications Co.
McClowry, S., Rindler, A., & Simon, P. (2012, September 17). SAFE Architecture. Retrieved
from MIKE2.0: http://mike2.openmethodology.org/wiki/SAFE_Architecture
McKinsey Global Institute. (2011, June). Big data: The next frontier for innovation, competition,
and productivity.
Mendelsohn, A., Chew, M., Kent, P., & Holmes, S. (2013, May 1). Big Data - Dream IT. Build
IT. Realize IT. Retrieved from SAS Global Forum 2013:
http://support.sas.com/resources/papers/proceedings13/
Microsoft. (2013, January 18). OData V3 Protocol Specification. Retrieved from OData:
http://www.odata.org/
MicroStrategy. (2012). Architecture for Enterprise Business Intelligence: An Overview of the
MicroStrategy Platform Architecture for Big Data, Cloud BI, and Mobile Applications.
Tysons Corner, VA, USA: MicroStrategy. Retrieved from MicroStrategy:
http://www.microstrategy.com/software/business-intelligence/big-data
Ministry of Education, Culture and Science. (2012). ROSA. Retrieved from Rijksoverheid:
http://www.wikixl.nl/wiki/rosa
Mitchell, I., & Wilson, M. (2012). Linked data: Connecting and exploiting big data. London, UK:
Fujitsu.

Big Data Reference Architecture
© Utrecht University of Applied Sciences
94
Muller, G. (2008, February 21). A Reference Architecture Primer. Retrieved from Gaudí System
Architecting: http://www.gaudisite.nl/info/ReferenceArchitecturePrimer.info.html
Muller, G., & Laar, P. v. (2009). Researching Reference Architectures and their relationship
with frameworks, methods, techniques, and tools. 7th Annual Conference on Systems
Engineering Research. Loughborough.
Murray-Rust, P. (2008, March). Open Data in Science. Serials Review, 34(1), 52-64.
Natis, Y. V., Laney, D., & Altman, R. (2012). The Nexus Effect: How Big Data Alters Established
Architecture Models. Stamford, USA: Gartner.
Neumeyer, L., Robbins, B., Nair, A., & Kesari, A. (2010). S4: Distributed Stream Processing
Platform. ICDMW 2010 IEEE International Conference on Data Mining Workshops (pp.
170-177). Sydney: ACM.
Nictiz. (2013). Referentiedomeinenmodel ziekenhuizen (RDZ). Retrieved from Nictiz:
http://www.nictiz.nl/page/Expertise/Specialistische-zorg/iZiekenhuis-
RDZ/Referentiedomeinenmodel
Nyce, C. (2007). Predictive Analytics. Malvern: American Institute for CPCU / Insurance
Institute of America.
Object Management Group. (2011, August). OMG Unified Modeling Language (OMG UML),
Infrastructure. Needham, MA, United States of America. Retrieved from
http://www.omg.org/spec/UML/2.4.1
Object Management Group. (2011, August). OMG Unified Modeling Language (OMG UML),
Superstructure. Needham, MA, United States of America. Retrieved from
http://www.omg.org/spec/UML/2.4.1
Oracle. (2012). Oracle Information Architecture: An Architect's Guide to Big Data. Retrieved
from http://www.oracle.com/technetwork/topics/entarch/articles/oea-big-data-guide-
1522052.pdf
Oracle. (2013). Information Management and Big Data: A Reference Architecture. Oracle.
Retrieved from http://www.oracle.com/technetwork/topics/entarch/articles/info-mgmt-
big-data-ref-arch-1902853.pdf
O'Reilly, T., Dumbill, E., Howard, J., Zwemer, M., Loukides, M., Slocum, M., . . . Hill, C. (2012).
Big Data Now: 2012 Edition. (M. Slocum, Ed.) Sebastopol, CA, USA: O'Reilly Media,
Inc.
Poppendieck, M., & Poppendieck, T. (2003). Lean Software Development: An Agile Toolkit.
Addison-Wesley.
Power, D. J. (2007, maart 10). A Brief History of Decision Support Systems, 4.0. Retrieved from
Decision Support Systems Resources: http://dssresources.com/history/dsshistory.html
Proper, E., & Greefhorst, D. (2011, February). Principles in an Enterprise Architecture Context.
Journal of Enterprise Architecture, pp. 8-16.
Reed, P. (2002, September 15). Reference Architecture: The best of best practices. Retrieved
from IBM developerWorks:
http://www.ibm.com/developerworks/rational/library/2774.html
Big Data Reference Architecture
© Utrecht University of Applied Sciences
95
Rindler, A., McKnight, W., & McClowry, S. (2012, November 4). Big Data Solution Offering.
Retrieved from MIKE2.0:
http://mike2.openmethodology.org/wiki/Big_Data_Solution_Offering
Rouibah, K., & Ould-ali, S. (2002). PUZZLE: a concept and prototype for linking business
intelligence to business strategy. Journal of Strategic Information Systems 11, 133-
152.
Russom, P. (2013). Integrating Hadoop Into Business Intelligence And Data Warehousing.
Renton, WA, USA: TDWI Research.
SAS. (2010, May). SAS 9.2 Intelligence Platform: Overview, Second Edition. Cary, NC, USA.
Retrieved from SAS:
http://support.sas.com/documentation/cdl/en/biov/63145/HTML/default/viewer.htm#a0
03069226.htm
SAS. (2012). Big Data Meets Big Data Analytics. Cary, NC, USA: SAS.
Schroeck, M., Shockley, R., Smart, J., Romero-Morales, D., & Tufano, P. (2012). Analytics: The
real-world use of big data - How innovative enterprises extract value from uncertain
data. Saïd Business School at the University of Oxford. Somers, NY: IBM Institute for
Business Value.
Schwaber, K. (1995). SCRUM Development Process. Proceesings of the OOPSLA'95
Workshop on Business Object Design and Implementation (pp. 1-23). Austin, TX, USA:
Springer.
Sevilla, M. (2013, May 30). Big Data Reference Architecture. CapGemini. Retrieved from
http://www.capgemini.com/resources/video/big-data-reference-architecture
Silver, N. (2012). The Signal and the Noise: Why So Many Predictions Fail - but Some Don't.
Penguin Press.
Soares, S. (2012, July 22). Big Data Reference Architecture. Retrieved from sunilsoares:
http://sunilsoares.wordpress.com/2012/07/22/big-data-reference-architecture-2/
Stallman, R. (2013, February 28). The Free Software Definition, 1.111. Retrieved from GNU:
https://www.gnu.org/philosophy/free-sw.html
Stallman, R. (n.d.). Why Open Source misses the point of Free Software. Retrieved from Free
Software Foundation: http://www.gnu.org/philosophy/open-source-misses-the-
point.html
Stonebreaker, M. (1986). The Case for Shared Nothing. Database Engineering, 9(1), 4-9.
Strozzi, C. (2012, March 20). NoSQL: A Relational Database Management System. Retrieved
from www.strozzi.it: http://www.strozzi.it/cgi-bin/CSA/tw7/I/en_US/nosql
TechAmerica Foundation. (2012). Demystifying Big Data - A Practical Guide To Transforming
The Business of Government. Washington, D.C.
Teradata. (2013). Teradata Unified Data Architecture - Give Any User Any Analytic on Any
Data. Dayton, Ohio: Teradata. Retrieved from http://www.teradata.com/products-and-
services/unified-data-architecture/

Big Data Reference Architecture
© Utrecht University of Applied Sciences
96
The Economist. (2010, February 25). Data, data everywhere. Retrieved from The Economist:
http://www.economist.com/node/15557443
The Open Data Survey. (2013). Retrieved from Technische Universität Dresden:
http://wwwdb.inf.tu-dresden.de/opendatasurvey/
The Open Group. (2011). Architecture Principles. Retrieved from TOGAF 9.1:
http://pubs.opengroup.org/architecture/togaf9-doc/arch/chap23.html
The Open Group. (2012, January). ArchiMate 2.0 Specification. Berkshire, United Kingdom.
Retrieved from The Open Group:
http://www.opengroup.org/subjectareas/enterprise/archimate
The Open Knowledge Foundation. (2009, November). Defining the Open in Open Data, Open
Content and Open Services, 1.1. Retrieved from Open Definition:
http://opendefinition.org/
The Open Knowledge Foundation. (2013). CKAN, the world’s leading open-source data portal
platform. Retrieved from http://ckan.org/
The Open Source Initiative. (2008). The Open Source Definition (Annotated), 1.9. Retrieved
from Open Source Initiative: http://opensource.org/osd-annotated
Think Big Analytics. (2013). Big Data Reference Architecture. Retrieved from Think Big
Analytics: http://thinkbiganalytics.com/leading_big_data_technologies/big-data-
reference-architecture/
Top 500 Supercomputers. (2012, November). Retrieved from Top 500 Supercomputers:
http://www.top500.org/
U.S. Department of Energy Genome Program. (2012, July 31). Human Genome Project.
Retrieved from U.S. Department of Energy:
http://www.ornl.gov/sci/techresources/Human_Genome/home.shtml
U.S. Department of Homeland Security. (2013). Cybersecurity. Retrieved from Homeland
Security: http://www.dhs.gov/topic/cybersecurity
Valiant, L. G. (1990, August). A Bridging Model for Parallel Computation. Communications of
the ACM, 33(8), 103-111.
Valiant, L. G. (2010). A bridging model for multi-core computing. Journal of Computer and
System Sciences(77), 154-166.
Vesset, D., Nadkarni, A., Olofson, K. W., Schubmehl, D., Flemin, M., Wardley, M., . . . Dialani,
M. (2012, December). Worldwide Big Data Technology and Services 2012–2016
Forecast. Retrieved from IDC: http://www.idc.com/getdoc.jsp?containerId=238746
Vogels, W. (2009, January). Eventually Consistent. Communications of the ACM, 52(1), pp. 40-
44.
W3C. (2004, February 10). Resource Description Framework (RDF) . Retrieved from W3C:
http://www.w3.org/RDF/
W3C. (2013). Scalable Vector Graphics (SVG). Retrieved from
http://www.w3.org/Graphics/SVG/

Big Data Reference Architecture
© Utrecht University of Applied Sciences
97
W3C. (2013, March 21). SPARQL 1.1 Overview. Retrieved from W3C:
http://www.w3.org/TR/2013/REC-sparql11-overview-20130321/
Wiering, M., Bonsangue, M., Buuren, R. v., Groenewegen, L., Jonkers, H., & Lankhorst, M.
(2004). Investigating the mapping of an Enterprise Description Language into UML 2.0.
Electronic Notes in Theoretical Computer Science(101), 155-179.
Wikipedia. (2013, April 9). Software engine. Retrieved from Wikipedia:
http://en.wikipedia.org/wiki/Software_engine
Wilensky, H. (1967). Organizational Intelligence: Knowledge and Policy in Government and
Industry. Basic Books.
Zhang, G. P. (2003). Time series forecasting using a hybrid ARIMA and neural network model.
Neurocomputing(50), 159-175.
Zikopoulos, Z., Parasraman, K., Deutsch, T., Corrigan, D., Giles, J., & deRoos, D. (2013).
Harness the Power of Big Data - The IBM Big Data Platform. (R. B. Melnyk, Ed.) New
York: McGraw-Hill.

Big Data Reference Architecture
© Utrecht University of Applied Sciences
98
APPENDIX I LITERATURE EVALUATION
This appendix contains three tables that contain a summary of the literature review. The
literature sources at the top are plot against elements of a (reference) architecture on the left.
A ‘V’ indicates a match; the architecture in the source contains the listed component, principle,
or best practice. Column ‘COUNT’ indicates the number of appearance in literature for a
component, principle or best practice. The tables are sorted descending by this column.
I.I COMPONENTS
Table 14: Hardware and software components in literature
Author: Her
od
oto
u
Law
et
al.
Dem
irka
n &
Del
en
Mar
z &
War
ren
Tech
Am
eric
a Fo
un
dat
ion
Kar
mas
ph
ere
Ho
rto
nw
ork
s
Fujit
su
McK
inse
y
IDC
Ora
cle
SAS
Mic
roSt
rate
gy
Gar
tner
Forr
este
r
Tera
dat
a
Thin
kBig
TDW
I
CSC
Forb
es
VM
war
e
IBM
O'R
eilly
An
uga
nti
Bu
sa
Soar
es
CO
UN
T
PERCEN
TAGE
Type: Scie
nti
fic
Scie
nti
fic
Scie
nti
fic
Scie
nti
fic
Scie
nti
fic
Co
mm
erci
al
Co
mm
erci
al
Co
mm
erci
al
Co
mm
erci
al
Co
mm
erci
al
Co
mm
erci
al
Co
mm
erci
al
Co
mm
erci
al
Co
mm
erci
al
Co
mm
erci
al
Co
mm
erci
al
Co
mm
erci
al
Co
mm
erci
al
Co
mm
erci
al
Co
mm
erci
al
Co
mm
erci
al
Co
mm
erci
al
Co
mm
erci
al
Pri
vate
Pri
vate
Pri
vate
Component
Parallel batch-processing engine V V V V V V V V V V V V V V V V V V V V V V V V V 25
NoSQL database (key-value, graph, document) V V V V V V V V V V V V V V V V V V V V V 21
Predictive analytics engine V V V V V V V V V V V V V V V V V V V V V 21
Distributed fi le system V V V V V V V V V V V V V V V V V V V V 20
Structured data sources V V V V V V V V V V V V V V V V V V V V 20
Data importing / collecting / ETL engine V V V V V V V V V V V V V V V V V V V 19
Real-time / stream / complex event processing engine V V V V V V V V V V V V V V V V V V V 19
Reporting engine (traditional BI) V V V V V V V V V V V V V V V V V V V 19
Unstructured data sources V V V V V V V V V V V V V V V V V V 18
Visualization engine V V V V V V V V V V V V V V V V V V 18
Query engine V V V V V V V V V V V V V V V V V 17
Relational database V V V V V V V V V V V V V V V V V 17
OLAP data warehouse V V V V V V V V V V V V V V V V V 17
Semistructured data sources V V V V V V V V V V V V V V V 15
Data mining / integration / serialization engine V V V V V V V V V V V V V V V 15
Statistical analysis engine V V V V V V V V V V V V 12
External / open data sources V V V V V V V V V V V V 12
Coordination engine V V V V V V V V V V V 11
Machine learning engine V V V V V V V V V V V 11
Monitoring engine V V V V V V V V V V V 11
Workflow / orchestration / scheduling engine V V V V V V V V V V 10
Deployment / configuration / dependency engine V V V V V V V V V 9
Text indexing / NLP engine V V V V V V V V 8
Search engine V V V V V V V V 8
Log processing engine V V V V V V V V 8
Data cleaning / fi ltering / validation engine V V V V V V V V 8
Geospatial data analysis V V V V V 5
Sentiment analysis engine V V V V 4
Signal processing V V V 3

Big Data Reference Architecture
© Utrecht University of Applied Sciences
99
I.II ARCHITECTURE PRINCIPLES
Table 15: Architecture principles in literature
Author: Her
od
oto
u
Law
et
al.
Dem
irka
n &
Del
en
Mar
z &
War
ren
Tech
Am
eric
a Fo
un
dat
ion
Fujit
su
McK
inse
y
IDC
SAS
Mic
roSt
rate
gy
Gar
tner
Cap
Gem
ini
TDW
I
CSC
VM
war
e
IBM
O'R
eilly
Josh
i
Kim
bal
l
MIK
E2.0
CO
UN
T
PERCEN
TAGE
Type: Scie
nti
fic
Scie
nti
fic
Scie
nti
fic
Scie
nti
fic
Scie
nti
fic
Co
mm
erci
al
Co
mm
erci
al
Co
mm
erci
al
Co
mm
erci
al
Co
mm
erci
al
Co
mm
erci
al
Co
mm
erci
al
Co
mm
erci
al
Co
mm
erci
al
Co
mm
erci
al
Co
mm
erci
al
Co
mm
erci
al
Pri
vate
Pri
vate
Pri
vate
Principle
Cloud computing V V V V V V 6
Service orientation V V V V V 5
Loose coupling / modularity V V V V 4
Scalability V V V V 4
Open standards V V V V V 4
Close-to-source data processing V V V 3
Robust and fault-tolerant V V 2
Data separability V 1
Mappable input V 1
Result invariant V 1
Digital nervous system V 1
Data-centric design V 1
Platform-independence V 1

Big Data Reference Architecture
© Utrecht University of Applied Sciences
100
I.III ARCHITECTURAL BEST PRACTICES
Table 16: Architectural best practices in literature
Author: Her
od
oto
u
Law
et
al.
Dem
irka
n &
Del
en
Mar
z &
War
ren
Fujit
su
McK
inse
y
IDC
Ora
cle
SAS
Mic
roSt
rate
gy
Gar
tner
Forr
este
r
Tera
dat
a
Thin
kBig
Cap
Gem
ini
TDW
I
IBM
O'R
eilly
An
uga
nti
Kim
bal
l
Soar
es
MIK
E2.0
CO
UN
T
PERCEN
TAGE
Type: Scie
nti
fic
Scie
nti
fic
Scie
nti
fic
Scie
nti
fic
Co
mm
erci
al
Co
mm
erci
al
Co
mm
erci
al
Co
mm
erci
al
Co
mm
erci
al
Co
mm
erci
al
Co
mm
erci
al
Co
mm
erci
al
Co
mm
erci
al
Co
mm
erci
al
Co
mm
erci
al
Co
mm
erci
al
Co
mm
erci
al
Co
mm
erci
al
Pri
vate
Pri
vate
Pri
vate
Pri
vate
Best practice
Data pipeline approach V V V V V V V V V V 10
Data governance V V V V 4
Data security / privacy management V V V V 4
Architecture layering V V V V 4
In-memory processing V V V V 4
Data exploration and discovery V V V V 4
(Master/Meta) data management V V V 3
Simulation V V V 3
Agile development V V V 3
Top-down analytics (by theory/hypothesis) V V 2
Sandbox mentality V V 2
Bottom-up analytics (by data) V V 2
Stateless applications V 1
Data audit, balance and control V 1
Information policy management V 1
Workload optimization V 1
Data caching V 1
Event-driven architecture V 1
Crowdsourcing V 1
Storytelling V 1
Structure around analytics V 1
Lifecycle management V 1

Big Data Reference Architecture
© Utrecht University of Applied Sciences
101
APPENDIX II RESULTS OF QUESTIONNAIRE
This appendix contains the full questionnaire and the results of the survey. For an explanation
of the contents of the questionnaire, see paragraph 3.3.3. The results are evaluated in
paragraph 4.4. Each section contains one or more questions. Answers to open questions are
displayed in bulleted lists. For each range of multiple-choice questions, a table is displayed that
contains the ‘raw’ scores on the questions.
For the multiple-choice questions in section 1, the possible answers are listed the column
‘Answer’ on the left side of the table, and the number of respondents who have selected that
answer to the question are displayed in column ‘Responses’. Finally, in the column ‘%’ the
number of responses is translated into a percentage.
For the multiple-choice questions in sections 2 and 3, the questions are listed in the column
‘Question’ on the left side of the table. The possible answers are listed in the following five
columns, since there are five possible answers. The values in the table cells indicate the
number of respondents who have selected the answer for the question.
II.I SECTION 1: INTRODUCTION
Please indicate your primary working role.
# Answer Response %
1 Software architect 3 30%
2 Software developer 1 10%
3 Manager / supervisor / team lead 1 10%
4 Business analyst 0 0%
5 Business architect 0 0%
6 Data scientist 0 0%
7 Other, namely:
tech lead and scrum master (1)
IT Architect (1)
Solutions Architect (1)
enterprise architect (1)
CIO (1)
5 50%
TOTAL 10 100%
Give an estimation of your knowledge and experience with Big Data and predictive analytics.

Big Data Reference Architecture
© Utrecht University of Applied Sciences
102
# Answer Responses %
1 None. 0 0%
2 I've only heard some of these things. 0 0%
3 I've read some books/articles/blogs, have gone to some
presentations/seminars, but have no real-world experience.
3 30%
4 I've practiced with these topics, and have done some work with it. 4 40%
5 I use Big Data technology in my day-to-day work. 3 30%
TOTAL 10 100%
Table 17: Answers to question in section 1
II.II SECTION 2: IMPRESSIONS OF THE BIG DATA SOLUTION REFERENCE ARCHITECTURE
How likely is it that you are going to use the elements of the Big Data Reference Architecture
in your work, in the near future (1-2 years)?
# Question Very Unlikely
Unlikely Undecided
Likely Very Likely
Mean
1 Components & Interfaces 0 1 4 3 2 3.56
2 Architectural Patterns 0 2 4 3 1 3.22
3 Architecture Principles 0 4 2 2 2 3.11
4 Architectural Best
Practices
0 3 2 4 1 3.22
TOTAL 0 10 12 12 6 3,28
Table 18: Answers to questions 1 to 4 in section 2
Please give a rating to the various aspects of the Big Data Solution Reference Architecture.
# Question Poor Fair Good Very Good Excellent Mean
5 The goal and purpose of the
model
0 0 6 2 2 3.60
6 The completeness of the
model
1 3 5 1 0 2.60
7 The level of detail, e.g. the
number of components
0 5 2 3 0 2.80
8 The concreteness of the
elements, e.g. abstract
concepts vs. concrete
implementations
3 2 2 2 1 2.60
TOTAL 4 10 9 8 3 2.90
Table 19: Answers to questions 5 to 8 in section 2

Big Data Reference Architecture
© Utrecht University of Applied Sciences
103
Provide any explaining remarks:
there is quite some repetition in the architecture. in my opinion it could be possible to
remove some of the vervosity, by better naming the elements of each layer.
Re. the Architectural patterns, principles and best practices: they all do make sense
but (at least for me) they are a bit obvious and not that big data specific.
Missing risk/security aspects (the RA restricts itself to happy flows), which could be
covered by techniques such as abuse case modeling and, possibly, architectural risk
analysis.
Ik vind het componentenmodel heel goed en de patterns ook hoewel het er weini zijn,
maar de achitectuur principes en de architectuur best practices heel beperkt en
algemeen en daardoor niet of nauwelijks interessant of bruikbaar. Daar zou ik graag
meer van zien.
II.III SECTION 3: QUALITY OF THE BIG DATA SOLUTION REFERENCE ARCHITECTURE
Rate the reference architecture, or a concrete solution architecture as implementation, on:
# Question Poor Fair Good Very
Good
Excellent Mean
1 the ease with which it can
cope with defects, e.g. be
adjusted to fix a bug in the
Analytics Engine
1 2 4 3 0 2.90
2 the ease with which it can
meet new requirements,
e.g. add a new data source
0 1 8 1 0 3.00
3 the ability to switch
components, e.g. replace
an implementation of the
Visualization Engine
0 1 7 2 0 3.10
4 the likelihood that it can be
used for multiple use cases
in different industries, e.g.
healthcare, finance,
government, oil & gas, etc.
0 2 6 2 0 3.00
5 the speed and performance
it can accomplish,
compared to similar models
1 2 6 1 0 2.70

Big Data Reference Architecture
© Utrecht University of Applied Sciences
104
or other BI / Big Data
architectures
6 the ability to scale when the
data are increased
significantly in volume,
velocity or variety
1 1 8 0 0 2.70
TOTAL 3 9 39 9 0 2.90
Table 20: Answers to questions 1 to 6 in section 3
Provide any explaining remarks:
the architecture is very abstract yet. I gave it good to many points but in fact in oreder
to answer properly the reference architecture should be further refined
I think the model in general is too abstract to make any assumptions on the
characteristics.
I do not have sufficient domain knowledge to accurately assess these quality criteria,
so in order to avoid statistical bias I have chosen "Good" as answer for each question.
"The speed and performance" en "the ability to scale" en "ease to cope with defects"
snapte ik niet als eigenschappen van een referentie architectuur. Gaat het nu om
eigenschappen van een Big Data toepassing? Of om de onderhoudbaarheid en
kwaliteit van de referentiearchitectuur?
II.IV SECTION 4: ADDITIONAL QUESTIONS
Is the reference architecture complete, or are any important components missing?
caching: reuse of data and results. multi-tenancy latency analysis: slow path, fast
path
Well, a reference architecture can be very high level as well as rather detailed, so it is
difficult to answer this question. I consider this somewhat in between and do find it very
useful. It is useful for big data novices, and is useful for more advanced users as well.
I'd like to add the more realtime (stream processing) elements. More and more BigData
is moving from batch oriented solutions to online.
I'd rather discuss functions than components. In terms of functions the model seems
fairly complete However, I would like to see links to the organizational aspect of it. See
for example DAMA DMBOK
2.2.3 => Je zou nog een schema kunnen toevoegen met verbindingen die er onderling
stappen die je er benoemd.. Data transportation,..enz.
As indicated before, risk/security is not addressed.
Ik mis een antwoord op de vraag wanneer je een Big Data oplossing zou moeten
willen? Daarmee samenhangend: wat zijn de kaders en de belangrijkste

Big Data Reference Architecture
© Utrecht University of Applied Sciences
105
uitgangspunten? De patterns zijn een krachtig hulpmiddel maar het zijn er jammer
genoeg maar twee. Zijn erniet meer?
The model seems complete to me.
For me the picture looks complete.
What are the strong and weak point of the reference architecture?
strong: is abstract, layered weak: is abstract, layered :)
Strong: component diagrams, mapped to tools. Clear description, good visualisations.
Week: architectural principles etc. seems rather generic (and from that perspective still
useful, but not that big data relevant).
Weak: -too general Strong: -Good guideline for Big Data novices.
Strpong point: simplicity Weak point: since you chose components rather than
functions, it is now harder to model things like: I am choosing to group two logical
components in 1 physical component
Sterke punt dat het is gevisualiseerd is in de verschillende lagen die we tijdens lessen
hebben behandeld over architectuur. Ik snap de keuze van 'open data' in internet,
maar het zou ook natuurlijk in intranet kunnen vallen.., maar dat is een beetje geneuzel
van mij. De indruk die het bij mij achterlaat is dat het een goed model is.
Strong: comprehensive and traceable use of generalisation and specification
techniques, abstraction Weak: contextual layer (as exists in Zachman
Framework/SABSA) seems a bit thin, traceability to business drivers is missing
(disclaimer: I am not a seasoned architect, so please take these comments with a
reasonable grain of salt, they are merely meant to help), risk/security aspects are not
addressed
Sterk punt: keurig overzichtelijk ArchiMate model. Complimenten! Zwakke punt:
principes en best practices. De best practices vond ik veeeeeel te algemeen. Als je
het zo algemeen formuleert heeft het geen toegevoegde waarde in een
referentiearchitectuur voor Big Data.
For me as technician, the architecture is very high level. This is a strong but also a
weak point. The architecture is a good starting point.
Please add any other comments or questions:
it not quite clear to me the reason why processing and analysis are two different steps.
maybe you can explain it to me next time we meet.
Soms heb je afkortingen genoemd, maar dan is het onbekend waar die afkorting voor
staan voor mijn: bijvoorbeeld: HDFS, SDK Ik hoop dat je er wat aan hebt en succes
ermee
Goede eerste poging maar verdient nog wel een flinke verdiepingsslag om echt
bruikbaar te zijn als referentie architectuur.

Big Data Reference Architecture
© Utrecht University of Applied Sciences
106
APPENDIX III OPTIONS FOR SOFTWARE COMPONENTS
This appendix contains a series of tables that contain some options for the software
components of a big data solution architecture. The tables can be used to get an overview of
the free and open source software (FOSS) available, as well as the commercial/proprietary
offerings. The lists are by no means complete; products and frameworks change continually
and the big data environment is far from settled. Many components cannot be placed in one
category. In that case, the best match was picked based on the core functionalities of the
component. The tables are sorted alphabetically on the Name column.
I.IV IMPORTING ENGINE
Name Purpose License Description
Angoss
Knowledge-
SEEKER
Data Mining Proprietary Tool with data mining capabilities including data
preparation, profiling, decision tree design
functionality
Chukwa Data
Collection
Apache
(FOSS)
Data collection for distributed systems
IBM
InfoSphere
Data Explorer
Data
Discovery
Proprietary Federated navigation and discovery across a
broad range of applications, data sources and file
types
MuleSoft
Anypoint
Data
Integration
Proprietary SaaS integration tool
Pentaho Data
Integration
(Kettle)
Data
Integration
Proprietary Data integration platform
Rapid Miner Data Mining Affero
General
Public
License
(FOSS)
Tool for data mining, data Integration, analytical
ETL, and data analysis
Splunk Data
Collection
Proprietary Collection and indexing of machine-generated
data
Talend Open
Studio
Data
Collection,
Data Loading
Data
Acquisition
GNU
General
Public
License
(FOSS)
Loading, extraction, transformation and
processing of large and diverse data sets
Table 21: Options for the Importing Engine component

Big Data Reference Architecture
© Utrecht University of Applied Sciences
107
I.V PROCESSING ENGINE
I.II.I Data Preparation Engine
Name Purpose License Description
Angoss
Knowledge-
SEEKER
Data
Transformation
Proprietary Tool that allow users to extract, manipulate
and transform data to prepare it for modeling
Apache Avro Data Serialization Apache
(FOSS)
Data serialization system
Apache
Sqoop
Data
Transportation
Apache
(FOSS)
Transferring bulk data between Hadoop and
other (relational) databases
DataCleaner Data Cleaning GNU Lesser
General
Public
License
(FOSS)
Data quality analysis application
Refine and
OpenRefine
Data Cleaning New BSD
(FOSS)
Tool for working with messy data, cleaning it
up, transforming it from one format into
another, extending it with web services, and
linking it to databases
Informatica
Vibe
Data Integration Proprietary A data management engine that can access,
aggregate, and manage data
Scribe Data Integration Proprietary Integration of customer data
Talend Open
Studio
Data Integration FOSS Loading, extraction, transformation and
processing of large and diverse data sets
Table 22: Options for the Data Preparation Engine component
I.II.II Data Exploration Engine
Name Purpose License Description
Apache Hive Querying Apache
(FOSS)
Tool for data summarization and adhoc querying
Apache Lucene Search Apache
(FOSS)
Tool with indexing and search technology, as well as
spellchecking, hit highlighting and advanced
analysis/tokenization capabilities
Apache Nutch Serach Apache
(FOSS)
Extensible and scalable web crawler software, based
on Lucene
Apache Pig Querying Apache
(FOSS)
High-level data-flow language and execution
framework for parallel computation

Big Data Reference Architecture
© Utrecht University of Applied Sciences
108
Apache Sorl Search Apache
(FOSS)
High performance search server, built using Lucene
Cloudera
Impala
Querying Apache
(FOSS)
Query engine that runs on Hadoop
ElasticSearch Search Apache
(FOSS)
Real-time search and analytics engine for the cloud,
based on Lucene
Google Big
Query
Search Proprietary Online web service for interactive analysis of massive
datasets
LGTE Search New BSD
(FOSS)
Information retrieval tool, developed at the Technical
University of Lisbon
MarkLogic
Search
Search Proprietary Big data search engine
Sphinx Search GNU
General
Public
License
(FOSS)
General-purpose search server
Xapian Search GNU
General
Public
License
(FOSS)
Probabilistic information retrieval library and full-text
search engine
Table 23: Options for the Data Exploration Engine component
I.II.III Batch Processing Engine
Name Purpose Licence Description
Amazon Elastic
MapReduce
Hadoop
Solution
Proprietary Hosted Hadoop framework running on the web-
scale infrastructure of Amazon Elastic Compute
Cloud (Amazon EC2) and Amazon Simple
Storage Service (Amazon S3)
Apache
Hadoop
MapReduce
MapReduce
Framework
Apache
(FOSS)
Framework that allows for the distributed
processing of large data sets across clusters of
computers using simple programming models
Cloudera Hadoop
Distribution
Proprietary Distribution of Hadoop and related projects
Datameer Hadoop
Solution
Proprietary Solution for data integration, data management,
and analytics on top of Hadoop

Big Data Reference Architecture
© Utrecht University of Applied Sciences
109
Disco MapReduce
Framework
BSD (FOSS) Lightweight framework for distributed computing
based on the MapReduce paradigm, developed
by Nokia
EMC
Greenplum HD
Hadoop
Solution
Proprietary Supported version of the Apache Hadoop stack
including HDFS, MapReduce, Hive, Pig, HBase,
and ZooKeeper
HortonWorks Hadoop
Distribution
Proprietary Distribution of Hadoop and related projects
IBM InfoSphere
BigInsights
Hadoop
Solution
Proprietary General big data platform, including Hadoop
InfoChimps
Cloud
Hadoop
Solution
Proprietary Suite of robust, scalable cloud-based big data
services
MapR Hadoop
Distribution
Proprietary Distribution of Hadoop and related projects
Microsoft
Windows
Azure
HDInsight
Hadoop
Solution
Proprietary Service that deploys and provisions Hadoop
clusters in the cloud, providing a software
framework designed to manage, analyze and
report on big data
Oracle Big
Data Appliance
Hadoop
Solution
Proprietary Integrated big data platform of hardware and
software, on top of Cloudera (including Hadoop),
Oracle NoSQL and R
Mortar Data Hadoop
Solution
Proprietary Hadoop-as-a-Service solution to work with Pig
and Python on Hadoop
Teradata
Appliance for
Hadoop
Hadoop
Solution
Proprietary Tightly integrated hardware/software stack,
optimized for enterprise-class big data storage
and refining
Qubole Hadoop
Solution
Proprietary Hadoop-as-a-Service running on Amazon AWS
Table 24: Options for the Batch Processing Engine component
I.II.IV Stream Processing Engine
Name Purpose License Description
Akka Programming
Framework
Apache (FOSS) A specialized framework for distributed,
parallel processing of large datasets,
programmed in the Scala language
Apache
Spark
Programming
Framework
Apache (FOSS) Cluster computing system for data analytics
with APIs in Pyton, Scala and Java,
developed by UC Berkeley AMPLab

Big Data Reference Architecture
© Utrecht University of Applied Sciences
110
Esper Complex
Event
Processing
GNU General
Public License
(FOSS)
Library for CEP
IBM
InfoSphere
Streams
Development
Platform
Proprietary Computing platform that allows user-
developed applications to quickly ingest,
analyze and correlate information as it arrives
from thousands of real-time sources
S4 Programming
Framework
Apache (FOSS) General-purpose, distributed, scalable, fault-
tolerant, pluggable platform that allows
programmers to develop applications for
processing continuous unbounded streams of
data
Software AG
Apama
Complex
Event
Processing
Proprietary Platform for CEP
TIBCO
StreamBase
Complex
Event
Processing
Proprietary Platform for CEP
Twitter Storm Programming
Framework
Eclipse Public
License (FOSS)
Distributed real-time computation framework
to reliably process unbounded streams of data
Table 25: Options for the Stream Processing Engine component
I.II.V Log Processing Engine
Name License Description
Apache
Flume
Apache (FOSS) Tool for collecting, aggregating, and moving large amounts of
log data
Fluentd Apache (FOSS) Tool to collect events and logs with abilities to add plug-ins
Kibana MIT License
(FOSS)
Scalable interface for Logstash and ElasticSearch with
search, graph, and analyze functions
Graylog2 GNU General
Public License
(FOSS)
Tool for log management
Loggly Proprietary Cloud-based log management service
Logscape Proprietary Log collecting and searching tool
Logstash Apache (FOSS) Tool for managing events and logs
Splunk Proprietary Tool that collects, indexes and harnesses all of the fast-
moving machine data generated by your applications, servers
and devices

Big Data Reference Architecture
© Utrecht University of Applied Sciences
111
Sumo Logic Proprietary Cloud-based log management solution
Table 26: Options for the Log Processing Engine component
I.VI ANALYTICS ENGINE
Name Purpose License Description
Actian
ParAccel
Analytics
(General, Multi-
purpose)
Proprietary Big data analytics database platform
Alteryx
Strategic
Analytics
Analytics
(General, Multi-
purpose)
Proprietary Analytics platform
Angoss
Knowledge-
STUDIO
Analytics
(General, Multi-
purpose)
Proprietary Cloud-based creation and execution of
analytical models
Apache Giraph Graph Processing Apache
(FOSS)
Iterative graph processing system built for
high scalability, developed at Facebook
Apache
Mahout
Machine Learning Apache
(FOSS)
Scalable machine learning framework
framework
Analytics
Analytics
(General, Multi-
purpose)
Proprietary Cloud-based analytics framework with
visualization and API
Google Pregel Graph Processing Proprietary Framework that supports large-scale graph
processing
GraphLab Graph Processing Apache
(FOSS)
Software platform that enables advanced
analytics and machine learning on graphs
IBM SPSS Statistical
Analysis
Proprietary Statistical analysis of static data
KNIME Analytics
(General, Multi-
purpose)
GNU
General
Public
License
(FOSS)
Multi-purpose tool for data analysis
KXEN Analytics
(General, Multi-
purpose)
Proprietary Predictive analytics engine

Big Data Reference Architecture
© Utrecht University of Applied Sciences
112
Mathematica Mathematical
Analytics
Proprietary Integrated all-in-one platform for
computational data analysis
Oracle
Business
Analytics
Analytics
(General, Multi-
purpose)
Proprietary Predictive analytics engine
Orange Machine Learning GPL Data analysis tool with support for plug-ins,
developed by the University of Ljubljana
R Statistical
Analysis
GNU
General
Public
License
(FOSS)
Statistical analysis tool with options for plug-
ins
Salford
Systems SPM
Predictive
Modeling
Proprietary Software suite for analytics and data mining
platform for creating predictive, descriptive,
and analytical models from databases of
any size, complexity, or organization
SAP Analytics Analytics
(General, Multi-
purpose)
Proprietary Analytics tool on top of SAP HANA
SAS Analytics Analytics
(General, Multi-
purpose)
Proprietary Integrated environment for predictive and
descriptive modeling, data mining, text
analytics, forecasting, optimization,
simulation, experimental design and more
StatSoft
STATISTICA
Analytics
(General, Multi-
purpose)
Proprietary Integrated suite of analytics software
products
Teradata Aster
Big Analytics
Appliance
Analytics
(General, Multi-
purpose)
Proprietary Integrated hardware and software platform
for big data discovery and analytics
Weka Machine Learning GNU
General
Public
License
(FOSS)
Software for machine learning, developed
by the University of Waikato (New Zealand)
Table 27: Options for the Analytics Engine component

Big Data Reference Architecture
© Utrecht University of Applied Sciences
113
I.VII VISUALIZATION ENGINE
Name License Description
D3.js BSD License
(FOSS)
Library that uses JavaScript, HTML, SVG, and CSS for
rendering diagrams and charts
Datameer Proprietary Product that displays graphs, maps, tables, and other shapes
in a dashboard
Flot MIT (FOSS) Plotting library for jQuery
Gephi GNU General
Public License
(FOSS)
Network analysis and visualization software package
Google Charts Proprietary Web-based charting tool
IBM Cognos Proprietary Reporting and BI engine
QlikView Proprietary Reporting and BI engine
R GNU General
Public License
(FOSS)
Statistical analysis and visualization engine
Raphaël.js MIT (FOSS) JavaScript library for data visualization that works with SVG
Tableau Proprietary Visual analytics platform that offers interactive data
visualization
Visual.ly Proprietary Tool for generating infographics
Yellowfin Proprietary Reporting and BI engine
Zoomdata Proprietary Analytics platform with interactive visualizations
Table 28: Options for the Visualization Engine component
I.VIII MANAGEMENT ENGINE
Name Purpose License Description
Apache Ambari Provisioning,
Monitoring
Apache
(FOSS)
Tool for provisioning, managing, and
monitoring Apache Hadoop clusters which
includes support for Hadoop HDFS, Hadoop
MapReduce, Hive, HCatalog, HBase,
ZooKeeper, Oozie, Pig and Sqoop
Apache
Chukwa
Monitoring Apache
(FOSS)
Data collection system for monitoring large
distributed systems, built on top of HDFS and
Hadoop
Apache
Hadoop YARN
Resource
management
Apache
(FOSS)
Framework for job scheduling and Hadoop
cluster resource management

Big Data Reference Architecture
© Utrecht University of Applied Sciences
114
Apache Oozie Workflow Apache
(FOSS)
Workflow/coordination system to manage and
schedule Apache Hadoop jobs
Apache Whirr Provisioning Apache
(FOSS)
Set of libraries for running cloud services
Apache
Zookeeper
Coordination Apache
(FOSS)
Coordination service for distributed systems
Azkaban Workflow Apache
(FOSS)
Batch workflow job scheduler created at
LinkedIn to run their Hadoop Jobs
Chef Provisioning Apache
(FOSS)
Configuration management tool that uses a
Ruby domain-specific language (DSL) for
writing system configuration recipes or
cookbooks
Cloudera
Enterprise
Deployment
management
Propietary Tool for managing Hadoop deployments
Doozerd Coordination MIT
(FOSS)
Data store that can be used for storing and
acting on configuration data shared between
several machines.
Puppet Provisioning Apache
(FOSS)
Tool that manages the configuration of
servers declaratively
Table 29: Options for the Management Engine component
I.IX DISTRIBUTED FILE SYSTEM
Name License Description
Amazon S3 Proprietary Online file storage service, offered by Amazon Web
Services
Apache Hadoop
HDFS
Apache (FOSS) Distributed file system that provides high-throughput
access to application data
Ceph GNU Lesser
Public License
(FOSS)
Distributed object store and file system designed to provide
excellent performance, reliability and scalability
GlusterFS GNU General
Public License
(FOSS)
Distributed file system capable of scaling to several
petabytes and handling thousands of clients
Google GFS Proprietary Distributed file system, designed to provide efficient,
reliable access to data using large clusters of commodity
hardware

Big Data Reference Architecture
© Utrecht University of Applied Sciences
115
Lustre GNU General
Public License
(FOSS)
Parallel distributed file system, generally used for large-
scale cluster computing
Microsoft DFS Proprietary Set of client and server services that allow an organization
using Microsoft Windows servers to organize many
distributed file shares into a distributed file system
Table 30: Options for the Distributed File System component
I.X DISTRIBUTED DATABASE
Name Type License Description
10gen
MongoDB
NoSQL GNU
General
Public
License
(FOSS)
Document database
Amazon
DynamoDB
NoSQL Proprietary Cloud-based key-value store with integration
options to other Amazon services (Elastic
MapReduce, S3)
Amazon
SimpleDB
NoSQL Proprietary Cloud-based columnar database
Apache
Accumulo
NoSQL Apache
(FOSS)
Sorted, distributed key/value database that was
developed at the NSA, with cell-level security to
assign permissions to individual table cells
Apache
Cassandra
NoSQL Apache
(FOSS)
Scalable multi-master database with no single
points of failure
Apache
CouchDB
NoSQL Apache
(FOSS)
Document store
Apache HBase NoSQL Apache
(FOSS)
Scalable, distributed columnar database that
supports structured data storage for large tables
Basho Riak NoSQL Apache
(FOSS)
Key-value database
Couchbase
Server
NoSQL Apache
(FOSS)
Document store
Elasticsearch NoSQL Apache
(FOSS)
Document store build on top of Apache Lucene
EMC Pivotal
GreenPlum
Database
NoSQL Proprietary Shared-nothing database for massive parallel
processing

Big Data Reference Architecture
© Utrecht University of Applied Sciences
116
BigTable
NoSQL Proprietary Cloud-based key-value store
HP Vertica
Analytic
Database
NoSQL Proprietary Grid-bases, column-oriented database on shared
nothing architecture
IBM DB2 Relational Proprietary Traditional RDBMS
Intersystems
Caché
NoSQL Proprietary Object database
Microsoft SQL
Server
Relational Proprietary Traditional RDBMS
Microsoft
Windows
Azure Table
Storage
NoSQL Proprietary Cloud-bases key-value store
MySQL Relational GNU
General
Public
License
(FOSS)
Traditional RDBMS
Oracle
Database
Relational Proprietary Traditional RDBMS
Oracle NoSQL NoSQL Proprietary Distributed key-value database
PostgreSQL Relational PostgreSQL
License
(FOSS)
Traditional RDBMS
Redis NoSQL BSD License
(FOSS)
Key-value store
SAND Analytic
Platform
NoSQL Proprietary Columnar big data analytics database platform
SAP Sybase Relational Proprietary Traditional RDBMS
Teradata
Database
Relational Proprietary Traditional RDBMS
Voldemort NoSQL Apache
(FOSS)
Key-value store
Table 31: Options for the Distributed Database component

Big Data Reference Architecture
© Utrecht University of Applied Sciences
117
I.XI ANALYTICS DATABASE
Name Type License Description
Google Pregel Graph
Database
Proprietary Framework that supports large-scale graph
processing
IBM Netezza Data
Warehouse
Proprietary Integrated hardware and software solution for
high-performance data warehousing and advance
analytics applications
Kognitio WX2 In-memory
Database
Proprietary In-memory analytics database platform
Neo4j Graph
Database
Proprietary Embedded, disk-based, fully transactional Java
persistence engine that stores data structured in
graphs rather than in tables
SAP HANA In-memory
Database
Proprietary In-memory database for performing real-time
analytics
Objectivity
InfiniteGraph
Graph
Database
Proprietary Distributed, scalable graph database
HP Vertica
Analytic
Database
NoSQL Proprietary Grid-based, column-oriented analytic database
Table 32: Options for the Analytics Database component