
A real-time polymerase chain reaction assay for quantification of allele ratios and correction of...
7
A real-time polymerase chain reaction assay for quantification of allele ratios and correction of amplification bias Micha€ el Weber, a H el ene Hag ege, a Georges Lutfalla, b Luisa Dandolo, c Claude Brunel, a Guy Cathala, a and Thierry Forn e a, * a Institut de G en etique Mol eculaire, UMR 5535 CNRS-Universit e Montpellier 2, IFR 24, 1919 route de Mende, 34293 Montpellier Cedex 5, France b D efenses Antivirales et Antitumorales, UMR 5124, 1919 route de Mende, 34293 Montpellier Cedex 5, France c InsermU257 CHU Cochin, 24 rue du Faubourg Saint-Jacques, Paris 75014, France Received 25 March 2003 Abstract Allele-specific epigenetic modifications are crucial for several important biological functions, including genomic imprinting and X-inactivation in mammals. Consequently, an ever increasing number of investigations requires accurate quantification of the relative abundance of parental alleles of a specific sequence in a DNA sample. Here, combining the use of polymorphic restriction sites with real-time polymerase chain reaction (PCR) amplification, we describe a simple and quantitative assay to measure allele ratios. The efficiency of the assay was assessed on genomic DNA for several polymorphic restriction sites located in the mouse Igf2/H19 imprinted locus. The assay was also successfully applied to quantify allele ratio in cDNA samples. In addition, we provide an experimental procedure for detection and correction of potential PCR amplification bias which significantly extends the range of application of the assay. Ó 2003 Elsevier Inc. All rights reserved. Keywords: Allele ratio; Imprinting; Real-time PCR In mammals, imprinted genes harbor allele-specific epigenetic modifications leading to expression of only one of the parental alleles. These modifications include DNA methylation, histone methylation and acetylation, or timing of DNA replication [1]. A number of experi- mental assays used to study these modifications require quantification of the relative abundance of parental al- leles. Quantification of allele ratios on cDNA is also essential to study the modulation of allele-specific ex- pression of imprinted genes among tissues or under pathological conditions [2,3]. The most frequently used strategy to distinguish be- tween parental alleles in mice is to use interspecific hy- brids harboring nucleotide polymorphisms that create a restriction endonuclease site specific for one allele. Di- gestion at this polymorphic restriction site after PCR amplification then allows allele discrimination. As such, this strategy is not quantitative, as the presence of het- eroduplexes in the PCR products may interfere with the analysis because they are not cut by the restriction en- zyme. This latter problem can be overcome by the use of hot-stop PCR, which adds a labeled oligonucleotide before the last PCR step [4]. Moreover, one major problem with PCR-based assays is the fact that the amplification may not be equally efficient for both alleles because of the presence of polymorphisms, thus leading to a PCR bias. An alternative method is the single-nu- cleotide primer extension assay, which requires only one nucleotide polymorphism but no polymorphic restric- tion site [5,6]. While being fully quantitative, this method is less sensitive than PCR-based assays. Here, we describe a simple and sensitive assay for quantifying the relative abundance of parental alleles in a DNA sample. This assay is based on the use of a polymorphic restriction enzyme prior to real-time PCR Analytical Biochemistry 320 (2003) 252–258 www.elsevier.com/locate/yabio ANALYTICAL BIOCHEMISTRY * Corresponding author. Fax: +33-4-67-04-02-31. E-mail address: [email protected] (T. Forn e). 0003-2697/$ - see front matter Ó 2003 Elsevier Inc. All rights reserved. doi:10.1016/S0003-2697(03)00396-8
-
Upload
michael-weber -
Category
Documents
-
view
214 -
download
2
Transcript of A real-time polymerase chain reaction assay for quantification of allele ratios and correction of...

ANALYTICAL
Analytical Biochemistry 320 (2003) 252–258
www.elsevier.com/locate/yabio
BIOCHEMISTRY
A real-time polymerase chain reaction assay for quantificationof allele ratios and correction of amplification bias
Micha€eel Weber,a H�eel�eene Hag�eege,a Georges Lutfalla,b Luisa Dandolo,c Claude Brunel,a
Guy Cathala,a and Thierry Forn�eea,*
a Institut de G�een�eetique Mol�eeculaire, UMR 5535 CNRS-Universit�ee Montpellier 2, IFR 24, 1919 route de Mende,
34293 Montpellier Cedex 5, Franceb D�eefenses Antivirales et Antitumorales, UMR 5124, 1919 route de Mende, 34293 Montpellier Cedex 5, France
c InsermU257 CHU Cochin, 24 rue du Faubourg Saint-Jacques, Paris 75014, France
Received 25 March 2003
Abstract
Allele-specific epigenetic modifications are crucial for several important biological functions, including genomic imprinting and
X-inactivation in mammals. Consequently, an ever increasing number of investigations requires accurate quantification of the
relative abundance of parental alleles of a specific sequence in a DNA sample. Here, combining the use of polymorphic restriction
sites with real-time polymerase chain reaction (PCR) amplification, we describe a simple and quantitative assay to measure allele
ratios. The efficiency of the assay was assessed on genomic DNA for several polymorphic restriction sites located in the mouse
Igf2/H19 imprinted locus. The assay was also successfully applied to quantify allele ratio in cDNA samples. In addition, we provide
an experimental procedure for detection and correction of potential PCR amplification bias which significantly extends the range of
application of the assay.
� 2003 Elsevier Inc. All rights reserved.
Keywords: Allele ratio; Imprinting; Real-time PCR
In mammals, imprinted genes harbor allele-specific
epigenetic modifications leading to expression of only
one of the parental alleles. These modifications include
DNA methylation, histone methylation and acetylation,
or timing of DNA replication [1]. A number of experi-
mental assays used to study these modifications requirequantification of the relative abundance of parental al-
leles. Quantification of allele ratios on cDNA is also
essential to study the modulation of allele-specific ex-
pression of imprinted genes among tissues or under
pathological conditions [2,3].
The most frequently used strategy to distinguish be-
tween parental alleles in mice is to use interspecific hy-
brids harboring nucleotide polymorphisms that create arestriction endonuclease site specific for one allele. Di-
gestion at this polymorphic restriction site after PCR
* Corresponding author. Fax: +33-4-67-04-02-31.
E-mail address: [email protected] (T. Forn�ee).
0003-2697/$ - see front matter � 2003 Elsevier Inc. All rights reserved.
doi:10.1016/S0003-2697(03)00396-8
amplification then allows allele discrimination. As such,
this strategy is not quantitative, as the presence of het-
eroduplexes in the PCR products may interfere with the
analysis because they are not cut by the restriction en-
zyme. This latter problem can be overcome by the use of
hot-stop PCR, which adds a labeled oligonucleotidebefore the last PCR step [4]. Moreover, one major
problem with PCR-based assays is the fact that the
amplification may not be equally efficient for both alleles
because of the presence of polymorphisms, thus leading
to a PCR bias. An alternative method is the single-nu-
cleotide primer extension assay, which requires only one
nucleotide polymorphism but no polymorphic restric-
tion site [5,6]. While being fully quantitative, thismethod is less sensitive than PCR-based assays.
Here, we describe a simple and sensitive assay for
quantifying the relative abundance of parental alleles in
a DNA sample. This assay is based on the use of a
polymorphic restriction enzyme prior to real-time PCR

M. Weber et al. / Analytical Biochemistry 320 (2003) 252–258 253
amplification and, therefore, quantification of alleleratio is not affected by the formation of heteroduplexes.
The reliability of the quantification is demonstrated with
several polymorphic restriction sites in the mouse Igf2/
H19 locus on both genomic DNA and cDNA. More-
over, we provide an experimental procedure that allows
quantification of potential amplification bias and cor-
rection of experimental values. This latter procedure is
experimentally validated on two amplified sequences inthe Igf2 gene locus.
1 Abbreviations used: DMR, differentially methylated region; RT,
reverse transcriptase; MAR, matrix attachment region.
Materials and methods
DNA digestion and real-time PCR amplification
Five nanograms of genomic DNA is the recom-mended minimal amount of starting material. Here we
used 200 ng of genomic DNA in all assays except for
quantifications on matrix-associated DNA where 5 ng
was used (Fig. 5D). Each DNA sample was mixed with
the appropriate restriction buffer and carefully distrib-
uted into two tubes containing either 30U of the poly-
morphic enzyme or the equivalent volume of water.
Importantly, both tubes also contain 5U of additionalnonpolymorphic restriction enzymes that will eliminate
potential PCR bias due to the reduced accessibility of
primers on undigested genomic DNA. Of course, these
additional restriction enzymes do not cut within the
amplified target sequence. Furthermore, when quanti-
fying allele ratio on genomic DNA samples, all the re-
striction enzymes used should not be sensitive to DNA
methylation. Digestion was performed for 2 h at 37 �C ina final volume of 50 ll. After digestion, 2 ll of each re-action, digested and undigested with the polymorphic
enzyme, were used in parallel PCR reactions. Oligonu-
cleotides were used at a final concentration of 5 lM and
thermal cycling was initiated with a first denaturation
step of 3min at 95 �C. The subsequent PCR conditions
were 45 cycles as follows: 95 �C for 1 s, 70 �C for 5 s, and72 �C for 15 s. Real-time PCR amplifications were per-formed using a SYBR Green mix and a LightCycler
apparatus (Roche Molecular Biochemicals). PCRs were
done in triplicate and standard deviations representing
experimental errors were calculated. Data were analyzed
using the Roche Molecular Biochemicals software ver-
sion 3.5, using the ‘‘fit points’’ analysis method. All
standard curves were performed on serial dilutions (10–
0.01 ng/ll) of genomic mouse DNA (M. m. domesti-
cus�SD7 hybrids). When PCR bias was detected, we
checked that the slope of standard curves was identical
on DNA from homozygous and heterozygous mice.
Therefore, the PCR bias is independent of the number
of cycles of PCR.
Primers used were as follows: 50-TGGGTAGGTGGCTGGGGACTT-30 and 50-CAGCTGTGTA
CTCCTGCTGGGAAG-30 around the BamHI�SD7 sitein the DMR01 region [7]; 50-CCACCTGGCCTTGTCATTCC-30 and 50-CAGTGGGAGTGGCATAGCTAAC-30 around the XbaI�dom in the enhancers region [8];
50-GGAGCTTGTTGACACGCTTCAG-30 and 50-GGATGGCCAAGGTCCAGCTCT-30 around the Eco
NI�SD7 site in the DMR2 region [9]; 50-GAC ACCAAA
CCCAATCATGGTAGC-30 and 50-CCTG GAAGCT
GATGATCCTTGG-30 around the DraI�SD7 in theMAR3 region.
Allele-specific quantification of mouse cDNAs
Mouse heart cDNA was prepared as previously de-
scribed [9] from 18-day postco€ııtum embryos issued from
a cross between a wild-type or a mutant Mus musculus
domesticus female and a SD7 male. Briefly, reversetranscription was carried out on 5 lg of total RNA
(treated with RQ1 DNase, Promega) in presence of
500 ng of p(dN)6 random primers (Roche Diagnostics)
and 200U of M-MLV RT (Invitrogen) in a final volume
of 20 ll. The cDNA obtained from this reaction was then
purified on a CL6-B Sepharose column. To obtain
double-stranded cDNA, 1/20 of the purified cDNA was
mixed with 100 ng of the Igf2 ‘‘S3’’ primer and the Taqpolymerase (5U) into an appropriate PCR buffer (Invi-
trogen). This reaction was sequentially incubated as
follows: 5min at 95 �C, 1min at 60 �C, and 2min at
72 �C. The polymerase was then removed by phenol/
chloroform extraction and ethanol precipitation. Half of
the sample was treated with BsaAI (50U in a final vol-
ume of 50 ll) and additional nonpolymorphic restrictionenzymes (10U). The other half was treated identicallybut digestion by BsaAI was omitted. 1/25 of both reac-
tions was quantified by real-time PCR. Amplification
conditions were as described above for genomic DNA.
Primers used were ‘‘S3’’ 50-ATCGTCCCCTGATCGTGTTA-30 and ‘‘AS4’’ 50-GGAA CTGTCCCTGCTCA
AGA-30 around the BsaAI�SD7 site in Igf2 exon 6.
Mathematical modeling of PCR bias
This model was adapted from Warnecke et al. [10].
For a given pair of primers, we define the bias (b) as theratio between the experimental allele ratio and the actual
allele ratio in the DNA sample. As defined above, the
bias is a constant value independent of the relative
proportion of alleles in the sample. If we define X as the
actual percentage of one allele in the sample and Y asthe percentage of this allele measured experimentally,
the bias value (b) is given by Eq. (1):
b ¼ ½Y ð100� X Þ=½ð100� Y ÞX : ð1Þ

254 M. Weber et al. / Analytical Biochemistry 320 (2003) 252–258
To calculate the bias value (b), allele proportions aremeasured on samples containing domesticus and SD7
genomic DNA mixed in known proportions (1:3, 1:1,
and 3:1). The experimentally measured percentage of
domesticus allele (Y ) is plotted as a function of the inputpercentage of domesticus allele in the sample (X ), andthe bias value (b) is obtained from the curve that gives
the best-fit for Eq. (2):
Y ¼ ½100bX =½X ðb� 1Þ þ 100 ðfrom Eq: ð1ÞÞ: ð2ÞOnce the bias value (b) has been experimentally deter-mined, the actual allele proportion in a sample can bededucted by correcting the experimental value using Eq.
(3):
X ¼ ½100Y =½Y ð1� bÞ þ 100b ðfrom Eq: ð1ÞÞ: ð3Þ
Results and discussion
Our strategy depends on the presence of a polymor-
phic restriction endonuclease site located in the DNAsequence of interest that will allow distinguishing of the
parental alleles. Primers for real-time PCR are designed
on either side of this polymorphic site, so that, upon
cleavage, PCR amplification can be specifically elimi-
nated on one allele. Relative proportions of parental
alleles are simply deducted from the ratio of PCR am-
plification signal on DNA digested or not with the
polymorphic restriction enzyme (see Fig. 1). Notably,our assay is not biased by the formation of heterodu-
plexes, as the digestion with the polymorphic enzyme
occurs prior to PCR amplification. We assessed the re-
liability of the strategy on the mouse imprinted Igf2/H19
locus, located on the distal part of chromosome 7.
Polymorphic restriction sites are obtained in hybrid
mice by mating M. musculus domesticus (C57BL=6J�CBAF 1) females with SD7 males. SD7 is a congenicC57BL=6J � CBA strain harboring the distal part of
Fig. 1. Quantification of relative allele abundance by real-time PCR.
Primers for real-time PCR are designed on both sides of a polymorphic
restriction endonuclease site (RE*) specific for allele A. Prior to di-
gestion with the polymorphic restriction endonuclease (RE), PCR
amplification can occur on both alleles ½qðAþ BÞ, but after digestion,PCR amplification is restricted to allele B ½qðBÞ. Relative proportionsof both alleles can be deducted using the following formulae:
pðAÞ ¼ ½qðAþ BÞ� qðBÞ � 100=qðAþ BÞ; pðBÞ ¼ qðBÞ� 100=qðAþ BÞ.
Mus spretus chromosome 7. We first used a spretus-specific BamHI site located in the DMR0 between exons
U1 and U2 of the Igf2 gene [7]. Real-time PCR quan-
tifications on genomic DNA from domesticus and SD7
homozygous mice, digested or not with BamHI, con-
firmed that the restriction site is present only on the
spretus sequence (Fig. 2A). Moreover, digestion of SD7
genomic DNA demonstrates that the rate of partial di-
gestion in our assay is very low (<5%). With genomicDNA prepared from hybrid mice, we expected the
quantification to give a 1:1 ratio between domesticus and
spretus alleles. Indeed, we obtain a 47.7� 7% decrease in
real-time PCR quantification after digestion with Bam
HI (Fig. 2A), which corresponds to a domesticus:SD7
allele ratio value of 1.09� 0.17. The method was furtherassessed using a polymorphic XbaI site located in the
endodermic enhancers region [8] and specific for thedomesticus allele. Again here, the rate of partial diges-
tion measured on domesticus genomic DNA appears
very low (Fig. 2B). Digestion of hybrid genomic DNA
with the polymorphic XbaI enzyme leads to a 48.2� 1%decrease in PCR quantification (Fig. 2B), which gives a
domesticus: SD7 allele ratio value of 0.93� 0.03. A third
polymorphic restriction site located in the imprinting-
control region sequence upstream of the H19 gene [9]also gave similar results (data not shown). Fig. 3 shows
an application of the technique to allele-specific quan-
tification of cDNA using aM. spretus-specific BsaAI site
in Igf2 exon 6. cDNA was obtained by reverse tran-
scription of total RNA purified from mouse tissue. Igf2
cDNA was converted into a double-stranded form by a
single cycle of incubation with Taq DNA polymerase
and treated in the presence or in the absence of theBsaAI polymorphic enzyme (see Materials and meth-
ods). A control reaction, where RNA was incubated
without reverse transcriptase (RT), was also included
systematically to check for the absence of DNA con-
tamination (Fig. 3A). As expected, a sample from a
wild-type mouse displays exclusive paternal Igf2 ex-
pression, whereas mice with maternal transmission of
H19 deletions show loss of Igf2 imprinting (Fig. 3B). Inagreement with the known phenotypes of such mutant
mice [11,12], our experiment shows that partial reacti-
vation of the maternal Igf2 allele is less pronounced in
H19 D3 mutants (10%) than for the H19 D13 deletion(40%). Thus, we conclude that this methodology is ac-
curate and reliable to quantify parental allele contribu-
tion to a DNA sample.
However, due to polymorphisms, some target se-quences may show a preferential amplification of one
parental allele, leading to PCR bias and to inaccurate
estimation of allele ratios. When using a spretus-specific
Eco NI site in the DMR2 region of the Igf2 gene [9], we
systematically found a preferential amplification of the
spretus allele. For example, the relative allele pro-
portions quantified on hybrid genomic DNA are

Fig. 2. Examples of quantifications of allele abundance in the Igf2/H19 locus. We used a spretus-specific BamHI site located between Igf2 exons U1
and U2 (filled boxes) in the DMR0 region (A) or a domesticus-specific XbaI site located between the endodermic enhancers (filled ovals) (B). Graphs
on the left show real-time PCR quantifications on samples treated (+) or not ()) with the polymorphic enzyme (qðBÞ and qðAþ BÞ, respectively). qðBÞvalues are relative to qðAþ BÞ values that were fixed to 100. On hybrid dom� SD7 genomic DNA, we obtain the expected 50% decrease in PCR
quantification after digestion with the polymorphic enzyme. Graphs on the right show allele proportions in dom� SD7 genomic DNA deducted from
the PCR quantifications using the formulae described in legend of Fig. 1; spre, spretus; dom, domesticus.
Fig. 3. Quantification of allele ratios in cDNA samples. Total RNA was prepared from heart of wild-type hybrid embryos (dom� SD7) and embryoshaving a maternal deletion of the H19 gene (D3) [11] or the H19 region (D13) [12] and converted to double-stranded cDNA (see Materials and
methods). (A) For allele-specific quantification, we used a spretus-specific BsaAI site located in Igf2 exon 6. The graph shows real-time PCR
quantifications on cDNA samples treated (+) or not ()) with the polymorphic enzyme. The absence of genomic DNA contamination was checked by
including a control reaction with no reverse-transcriptase (RT). (B) Allelic expression in wild-type or mutant embryos. Allele proportions were
deduced from PCR quantifications by using the formulae described in legend of Fig. 1; spre, spretus; dom, domesticus.
M. Weber et al. / Analytical Biochemistry 320 (2003) 252–258 255

Fig. 4. Measurement of PCR bias in the DMR2 region. (A) We used a spretus-specific EcoNI site located between Igf2 exons 4 and 5 (filled boxes) in
the DMR2 region. The graph shows real-time PCR quantifications on samples containing equal (dom� SD7) or various proportions of domesticus
and SD7 genomic DNA treated (+) or not ()) with EcoNI. (B) Bias plot showing the experimental percentage of the domesticus allele (Y ) as afunction of the theoretical percentage in the DNA sample (X ). The solid line represents the best-fit curve for Eq. (2) (see Materials and methods). Thetheoretical unbiased curve (b ¼ 1) is shown as a dashed line for comparison. (C) Bias plot showing the experimental dom:SD7 allele ratio as a
function of the theoretical ratio in the sample. The unbiased straight line (y ¼ x) is shown as a dashed line, and the biased straight line correspondingto b ¼ 0:47 (y ¼ 0:47x, see Eq. (1)) is drawn as a solid line. (D) Alignment between the domesticus and the spretus amplified sequences. The poly-
morphic EcoNI site is indicated at nucleotides 162–172, and arrows represent the forward and reverse primers.
256 M. Weber et al. / Analytical Biochemistry 320 (2003) 252–258
33.7� 1.3% of domesticus allele and 66.3� 1.3% of spr-
etus allele instead of 50% of each (Fig. 4A). Sequencing
of the spretusDMR2 region revealed that this bias is due
to an internal deletion of a six-cytosine track upstream
of the Eco NI restriction site in the spretus genome
(Fig. 4D). This deletion results in a 1 �C decrease of themelting temperature of the PCR product (not shown).
However, because the deletion is located only 5 bp up-
stream from the polymorphic restriction site of interest,
it is not possible to design primers that would allow
unbiased PCR amplification. To address this problem,
we designed a procedure based on a mathematical model
that enables quantifying of the PCR bias (see Materials
and methods). As defined in this model, the bias repre-sents the number of domesticus alleles amplified for one
spretus allele in the PCR reaction. As a consequence, it is
a constant value independent of the actual allele ratio in
the sample. To measure the PCR bias, PCR quantifi-
cations are performed on samples containing domesticus
and SD7 genomic DNA mixed in various proportions
(Fig. 4A). The best-fit regression gives a bias value of
b ¼ 0:47 (Fig. 4B), which represents an actual 2.1-foldpreference in amplification of the spretus allele versus
the domesticus allele. Plotting the experimental allele
ratio as a function of the input allele ratio also confirms
that the bias is indeed constant and validates the
mathematical model (Fig. 4C).
Apart from internal sequence divergence, PCR bias
can simply result from single-nucleotide polymorphisms
that would disadvantage the hybridization of PCR
primers on one allele. To illustrate this, we present re-sults obtained with primers designed around a spretus-
specific DraI site in a nuclear matrix attachment region
(MAR3) located 8 kb downstream of the Igf2 gene.
Using these primers, we systematically overestimate the
proportion of domesticus allele in the DNA sample
(Fig. 5A). The best-fit regression shows that there is an
actual 2.2-fold preference in amplification of the do-
mesticus allele versus the spretus allele (b ¼ 2:18;Fig. 5B). This bias is due to the presence of two single-
nucleotide polymorphisms on the spretus allele in the
sequence recognized by the reverse primer (Fig. 5C).
This region is highly polymorphic and AT rich, and
again it was not possible to design primers that would be
both devoid of polymorphisms and efficient for real-time
PCR.
Therefore, as for any PCR-based method, amplifica-tion can be biased by polymorphisms in the body of the
amplified sequence or in the primer sequences. It is al-
ways important to keep in mind that, when using such
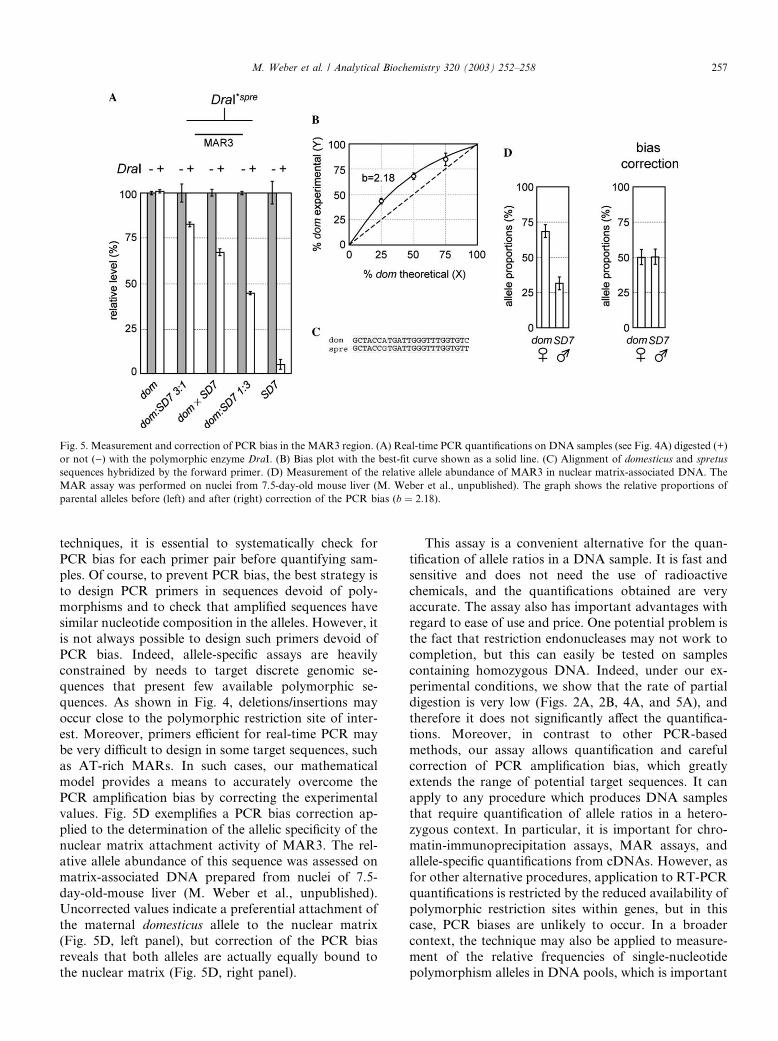
Fig. 5. Measurement and correction of PCR bias in the MAR3 region. (A) Real-time PCR quantifications on DNA samples (see Fig. 4A) digested (+)
or not ()) with the polymorphic enzyme DraI. (B) Bias plot with the best-fit curve shown as a solid line. (C) Alignment of domesticus and spretus
sequences hybridized by the forward primer. (D) Measurement of the relative allele abundance of MAR3 in nuclear matrix-associated DNA. The
MAR assay was performed on nuclei from 7.5-day-old mouse liver (M. Weber et al., unpublished). The graph shows the relative proportions of
parental alleles before (left) and after (right) correction of the PCR bias (b ¼ 2:18).
M. Weber et al. / Analytical Biochemistry 320 (2003) 252–258 257
techniques, it is essential to systematically check for
PCR bias for each primer pair before quantifying sam-
ples. Of course, to prevent PCR bias, the best strategy is
to design PCR primers in sequences devoid of poly-morphisms and to check that amplified sequences have
similar nucleotide composition in the alleles. However, it
is not always possible to design such primers devoid of
PCR bias. Indeed, allele-specific assays are heavily
constrained by needs to target discrete genomic se-
quences that present few available polymorphic se-
quences. As shown in Fig. 4, deletions/insertions may
occur close to the polymorphic restriction site of inter-est. Moreover, primers efficient for real-time PCR may
be very difficult to design in some target sequences, such
as AT-rich MARs. In such cases, our mathematical
model provides a means to accurately overcome the
PCR amplification bias by correcting the experimental
values. Fig. 5D exemplifies a PCR bias correction ap-
plied to the determination of the allelic specificity of the
nuclear matrix attachment activity of MAR3. The rel-ative allele abundance of this sequence was assessed on
matrix-associated DNA prepared from nuclei of 7.5-
day-old-mouse liver (M. Weber et al., unpublished).
Uncorrected values indicate a preferential attachment of
the maternal domesticus allele to the nuclear matrix
(Fig. 5D, left panel), but correction of the PCR bias
reveals that both alleles are actually equally bound to
the nuclear matrix (Fig. 5D, right panel).
This assay is a convenient alternative for the quan-
tification of allele ratios in a DNA sample. It is fast and
sensitive and does not need the use of radioactive
chemicals, and the quantifications obtained are veryaccurate. The assay also has important advantages with
regard to ease of use and price. One potential problem is
the fact that restriction endonucleases may not work to
completion, but this can easily be tested on samples
containing homozygous DNA. Indeed, under our ex-
perimental conditions, we show that the rate of partial
digestion is very low (Figs. 2A, 2B, 4A, and 5A), and
therefore it does not significantly affect the quantifica-tions. Moreover, in contrast to other PCR-based
methods, our assay allows quantification and careful
correction of PCR amplification bias, which greatly
extends the range of potential target sequences. It can
apply to any procedure which produces DNA samples
that require quantification of allele ratios in a hetero-
zygous context. In particular, it is important for chro-
matin-immunoprecipitation assays, MAR assays, andallele-specific quantifications from cDNAs. However, as
for other alternative procedures, application to RT-PCR
quantifications is restricted by the reduced availability of
polymorphic restriction sites within genes, but in this
case, PCR biases are unlikely to occur. In a broader
context, the technique may also be applied to measure-
ment of the relative frequencies of single-nucleotide
polymorphism alleles in DNA pools, which is important
258 M. Weber et al. / Analytical Biochemistry 320 (2003) 252–258
for a wide range of human genetics applications in-cluding pharmacogenomics and identification of sus-
ceptibility genes involved in complex diseases [13].
Finally, it may be adapted to detect and quantify loss of
imprinting and loss of heterozygocity in human cancers,
although some applications of the method to humans
may be restricted by the availability of samples from
informative patients presenting polymorphic restriction
sites. As such, the method should be of general interestfor a wide range of academic researchers interested in
measuring the relative proportion of two polymorphic
alleles.
Acknowledgments
We thank R. Feil for critical reading of the manu-
script and W. Reik and S. Tilghman for providing the
SD7 and D13 mouse strains. This work was supportedby grants from the Association pour la Recherche con-
tre le Cancer (ARC No. 4274) and from the ‘‘Fond
National de la Science’’ (ACI jeune chercheur) given to
T. Forn�ee.
References
[1] W. Reik, J. Walter, Genomic imprinting: parental influence on the
genome, Nat. Rev. Genet. 2 (2001) 21–32.
[2] M.P. Lee, R.J. Hu, L.A. Johnson, A.P. Feinberg, Human
KVLQT1 gene shows tissue-specific imprinting and encompasses
Beckwith-Wiedemann syndrome chromosomal rearrangements,
Nat. Genet. 15 (1997) 181–185.
[3] H. Cui, I.L. Horon, R. Ohlsson, S.R. Hamilton, A.P. Feinberg,
Loss of imprinting in normal tissue of colorectal cancer patients
with microsatellite instability, Nat. Med. 4 (1998) 1276–1280.
[4] H. Uejima, M.P. Lee, H. Cui, A.P. Feinberg, Hot-stop PCR: a
simple and general assay for linear quantitation of allele ratios,
Nat. Genet. 25 (2000) 375–376.
[5] M.N. Kuppuswamy, J.W. Hoffmann, C.K. Kasper, S.G. Spitzer,
S.L. Groce, S.P. Bajaj, Single nucleotide primer extension to
detect genetic diseases: experimental application to hemophilia B
(factor IX) and cystic fibrosis genes, Proc. Natl. Acad. Sci. USA
88 (1991) 1143–1147.
[6] A.J. Lombardo, G.B. Brown, A quantitative and specific method
for measuring transcript levels of highly homologous genes,
Nucleic Acids Res. 24 (1996) 4812–4816.
[7] T. Moore, M. Constaancia, M. Zubair, B. Bailleul, R. Feil, H.
Sasaki, W. Reik, Multiple imprinted sense and antisense tran-
scripts, differential methylation and tandem repeats in a putative
imprinting control region upstream of mouse Igf2, Proc. Natl.
Acad. Sci. USA 94 (1997) 12509–12514.
[8] P.A. Leighton, J.R. Saam, R.S. Ingram, C.L. Stewart, S.M.
Tilghman, An enhancer deletion affects both H19 and Igf2
expression, Genes Dev. 9 (1995) 2079–2089.
[9] M. Weber, L. Milligan, A. Delalbre, E. Antoine, C. Brunel,
G. Cathala, T. Forn�ee, Extensive tissue-specific variation of allelicmethylation in the Igf2 gene during mouse fetal development:
relation to expression and imprinting, Mech. Dev. 101 (2001)
133–141.
[10] P.M. Warnecke, C. Stirzaker, J.R. Melki, D.S. Millar, C.L. Paul,
S.J. Clark, Detection and measurement of PCR bias in quanti-
tative methylation analysis of bisulphite-treated DNA, Nucleic
Acids Res. 25 (1997) 4422–4426.
[11] M.A. Ripoche, C. Kress, F. Poirier, L. Dandolo, Deletion of the
H19 transcription unit reveals the existence of a putative
imprinting control element, Genes Dev. 11 (1997) 1596–1604.
[12] P.A. Leighton, R.S. Ingram, J. Eggenschwiler, A. Efstratiadis,
S.M. Tilghman, Disruption of imprinting caused by deletion of
the H19 gene region in mice, Nature 375 (1995) 34–39.
[13] P.Y. Kwok, Approaches to allele frequency determination,
Pharmacogenomics 1 (2000) 231–235.


![Recombinase Polymerase Amplification-Based Assay to ... · Giardia assay (recombinase polymerase amplification-based Giardia [RPAG] assay) that is capable of detecting the pres ence](https://static.fdocuments.in/doc/165x107/60328fc63d35af025c01a9a2/recombinase-polymerase-amplification-based-assay-to-giardia-assay-recombinase.jpg)