A rapid assessment methodology for bridges damaged by ... › sites.coecis.cornell...224 C.J. Stull...
15
Steel and Composite Structures, Vol. 9, No. 3 (2009) 223-237 223 A rapid assessment methodology for bridges damaged by truck strikes C.J. Stull* Cornell University, School of Civil and Environmental Engineering, 352 Hollister Hall, Ithaca, New York 14853, U.S.A. C.J. Earls Cornell University, School of Civil and Environmental Engineering, 365 Hollister Hall, Ithaca, New York 14853, U.S.A. (Received June 12, 2008, Accepted February 2, 2009) Abstract. The present research aims to develop a methodology to rapidly assess bridges with damage to the superstructure, caused by overheight trucks or lower-than-average overhead clearance. Terrestrial laser scanning and image processing techniques are combined with the finite element method to arrive at an analytical model which is more accurate, with respect to the complex geometrical aspects of the bridge in its damaged configuration. “Virtual load testing” may subsequently be carried out on this analytical model to determine the reserve capacity of the structure in an objective manner. Keywords : truck strikes; bridge damage; laser scanning. 1. Introduction The Federal Highway Administration (FHWA) reports that approximately forty-two percent of the bridges in the United States are of the type “Stringer / Multi-Beam or Girder,” (FHWA 2006) with many of these being highway under- or overpasses. Unfortunately, it is not uncommon for these structures to undergo damage due to vehicular impacts arising from scenarios such as: (1) an over-height vehicle encountering a bridge with a particularly low overhead clearance; (2) a vehicle encountering a bridge for which the overhead clearance is non-conservatively mislabeled, as a result of re-surfacing of the underlying roadway; or (3) an out-of-control vehicle impacting a bridge pier / abutment (El-Tawil, et al. 2005). Indeed, it was found in the State of Maryland alone that there was an 81% increase in collisions arising from scenarios (1) or (2) from the period of 1995-2000 (Fu, et al. 2004); this study also shows that 62% of states consider this to be a significant concern. With respect to scenarios (1) and (2) above, the ensuing damage to the underside of the bridge may be catastrophic in nature (Fig. 1). However, it is more common that the bridge will sustain minor to moderate damage, while remaining intact. While such damage varies dramatically, depending upon the * Corresponding Author, Email: [email protected]
Transcript of A rapid assessment methodology for bridges damaged by ... › sites.coecis.cornell...224 C.J. Stull...

Steel and Composite Structures, Vol. 9, No. 3 (2009) 223-237 223
A rapid assessment methodology for bridges damaged by truck strikes
C.J. Stull*
Cornell University, School of Civil and Environmental Engineering, 352 Hollister Hall,
Ithaca, New York 14853, U.S.A.
C.J. Earls
Cornell University, School of Civil and Environmental Engineering, 365 Hollister Hall,
Ithaca, New York 14853, U.S.A.
(Received June 12, 2008, Accepted February 2, 2009)
Abstract. The present research aims to develop a methodology to rapidly assess bridges with damage tothe superstructure, caused by overheight trucks or lower-than-average overhead clearance. Terrestrial laserscanning and image processing techniques are combined with the finite element method to arrive at ananalytical model which is more accurate, with respect to the complex geometrical aspects of the bridge in itsdamaged configuration. “Virtual load testing” may subsequently be carried out on this analytical model todetermine the reserve capacity of the structure in an objective manner.
Keywords : truck strikes; bridge damage; laser scanning.
1. Introduction
The Federal Highway Administration (FHWA) reports that approximately forty-two percent of the
bridges in the United States are of the type “Stringer / Multi-Beam or Girder,” (FHWA 2006) with many
of these being highway under- or overpasses. Unfortunately, it is not uncommon for these structures to
undergo damage due to vehicular impacts arising from scenarios such as: (1) an over-height vehicle
encountering a bridge with a particularly low overhead clearance; (2) a vehicle encountering a bridge
for which the overhead clearance is non-conservatively mislabeled, as a result of re-surfacing of the
underlying roadway; or (3) an out-of-control vehicle impacting a bridge pier / abutment (El-Tawil, et al.
2005). Indeed, it was found in the State of Maryland alone that there was an 81% increase in collisions
arising from scenarios (1) or (2) from the period of 1995-2000 (Fu, et al. 2004); this study also shows that
62% of states consider this to be a significant concern.
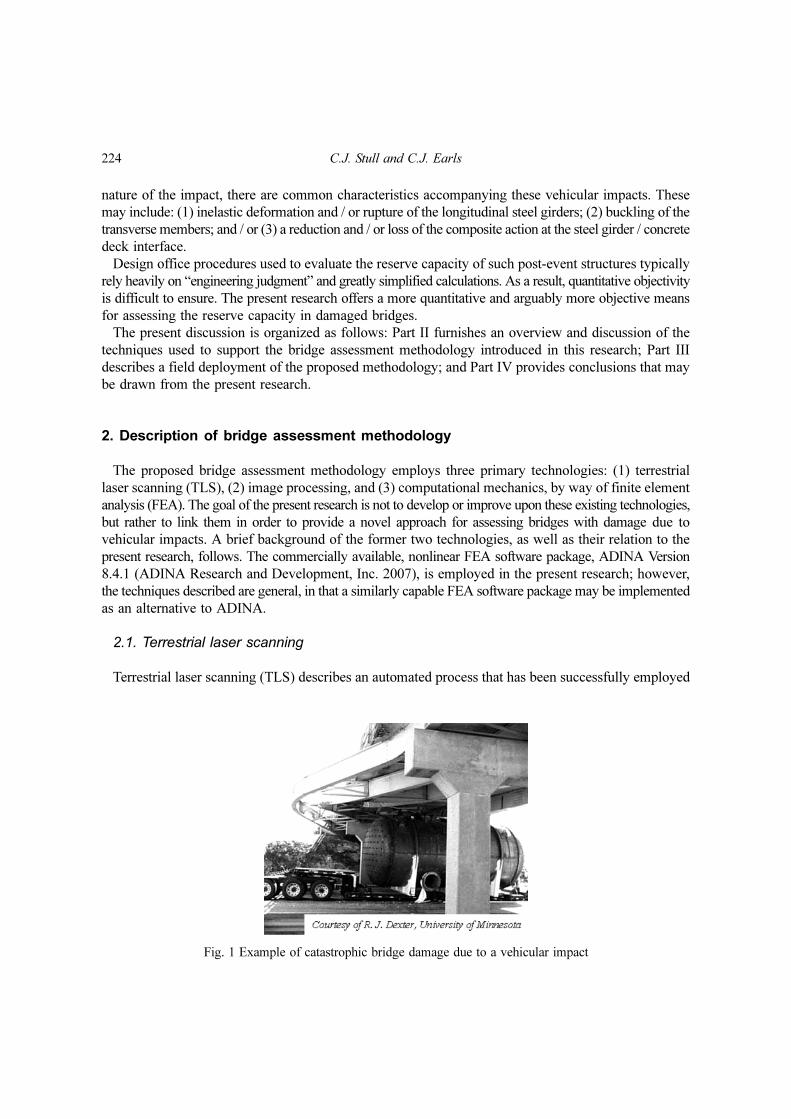
With respect to scenarios (1) and (2) above, the ensuing damage to the underside of the bridge may be
catastrophic in nature (Fig. 1). However, it is more common that the bridge will sustain minor to
moderate damage, while remaining intact. While such damage varies dramatically, depending upon the
* Corresponding Author, Email: [email protected]
224 C.J. Stull and C.J. Earls
nature of the impact, there are common characteristics accompanying these vehicular impacts. These
may include: (1) inelastic deformation and / or rupture of the longitudinal steel girders; (2) buckling of the
transverse members; and / or (3) a reduction and / or loss of the composite action at the steel girder / concrete
deck interface.
Design office procedures used to evaluate the reserve capacity of such post-event structures typically
rely heavily on “engineering judgment” and greatly simplified calculations. As a result, quantitative objectivity
is difficult to ensure. The present research offers a more quantitative and arguably more objective means
for assessing the reserve capacity in damaged bridges.
The present discussion is organized as follows: Part II furnishes an overview and discussion of the
techniques used to support the bridge assessment methodology introduced in this research; Part III
describes a field deployment of the proposed methodology; and Part IV provides conclusions that may
be drawn from the present research.
2. Description of bridge assessment methodology
The proposed bridge assessment methodology employs three primary technologies: (1) terrestrial
laser scanning (TLS), (2) image processing, and (3) computational mechanics, by way of finite element
analysis (FEA). The goal of the present research is not to develop or improve upon these existing technologies,
but rather to link them in order to provide a novel approach for assessing bridges with damage due to
vehicular impacts. A brief background of the former two technologies, as well as their relation to the
present research, follows. The commercially available, nonlinear FEA software package, ADINA Version
8.4.1 (ADINA Research and Development, Inc. 2007), is employed in the present research; however,
the techniques described are general, in that a similarly capable FEA software package may be implemented
as an alternative to ADINA.
2.1. Terrestrial laser scanning
Terrestrial laser scanning (TLS) describes an automated process that has been successfully employed
Fig. 1 Example of catastrophic bridge damage due to a vehicular impact
A rapid assessment methodology for bridges damaged by truck strikes 225
within the context of historical preservation and architectural study. TLS systems have also been
employed in the civil engineering community for a number of years, primarily playing a supporting role
in various surveying tasks typical to construction sites. Improved computational technologies and data
management strategies, however, have expanded the applicability of TLS systems to additional fields.
Goedert, et al. (2005) proposed a technique that employed a TLS system and rapid prototyping technologies
to significantly increase the efficiency of developing construction models for architectural firms. Fuchs,
et al. (2004a,b) employed a TLS system as a tool for the nondestructive evaluation of various highway
bridge components. Su, et al. (2005) implemented a TLS system as a tool to monitor excavation progress
on construction sites, as well as ground movements associated with these excavations for use in geotechnical
analyses.
2.1.1. Role in bridge assessment methodology
Within the context of the present research, TLS is the process of obtaining point cloud data containing
the precise location of points on an object as follows: (1) a TLS system emits laser radiation, in the form
of a beam, directed toward an object (or a portion of an object) of interest; (2) the laser radiation is
scattered and some returns to the TLS system; and (3) an onboard computer calculates the object’s
standoff distance based upon data related to this reflected laser radiation. The standoff distance,
together with an angular position, is then mapped onto a three-dimensional coordinate system. The
process is repeated throughout the field-of-view of the TLS system at a particular instrument location,
resulting in a three-dimensional point cloud data set of the object (or a portion of the object). If only a
portion of the object is captured, multiple TLS system set-ups are required; for each instrument location, a
local, instrument-centered coordinate system is inherited by each resulting point cloud data set.
Several different TLS system technologies are commercially available for applications such as those
mentioned above. For the present research, the authors considered two of these: time-of-flight and continuous
wave, or phase-based systems. The primary differences between these two TLS systems lie in how the
beam is emitted from the laser diode, and the method of treating the return signal. In a time-of-flight
system, the laser diode emits a pulsed beam, that is subsequently scattered by the target surface, and
partially reflected back to the TLS system. The difference in time between emission and reception of
this pulse is then used to compute the standoff distance between the instrument location and the target
surface (Fig. 2). The continuous wave system, as the name implies, operates with a continuously emitted
beam. Determination of the standoff distance is subsequently obtained by measuring the phase-shift
between the emitted and received waves (Fig. 3). It is noted that the TLS systems employed for the present
research are the CYRAX 2500 time-of-flight system, manufactured by Cyra Technologies Inc., and the
Zoller + Fröhlich (Z + F) Imager 5003 continuous wave system.
A comparison of these two TLS systems revealed that the data acquisition time required by the Z+F system is
approximately one-half that of CYRAX system. To put this into context, the time required by the latter
system to obtain raw point cloud data of the subject bridge chosen for the present research (described in
the sequel) is between 8 and 12 hours. However, despite the savings in data acquisition time exhibited
by the Z+F system, the point cloud data was observed to be of insufficient accuracy to develop the parasolid
model required for the bridge assessment methodology subsequently described. Thus, all work presented
herein is based upon point cloud data obtained via the CYRAX 2500 time-of-flight system. The previously
mentioned time requirement of 8 to 12 hours is significantly reduced when point cloud data of only a
portion of the bridge is required; justification for this reduced requirement will be provided in the
sequel.

226 C.J. Stull and C.J. Earls
2.1.2. Practical considerations
Lichti, et al. (2005) provides a thorough discussion of the various intrinsic errors associated with TLS
systems; for the purposes of this paper, such intrinsic errors are characterized as “noise,” and will be addressed
subsequently. However, two operational characteristics of TLS systems are of particular importance
with respect to the research reported upon herein, both of which stem from the occlusion of certain data.
First, it is important to note the nature of the acquired data as it relates to the adopted finite element
modeling strategy. In the present research, shell finite elements are employed to represent the longitudinal
steel girders; these shells are defined along the mid-plane of the constituent cross-sectional plate components.
Therefore, data obtained about the shape of an object, as a volume, must then be reinterpreted to represent
the shape of the object’s middle surface. While this does not pose a problem for planar surfaces, in which a
simple offset of the scanned surface is required, a non-planar surface, such as that encountered when
dealing with significantly damaged super-structural elements, can provide some difficulty when making the
transition between raw point cloud data and a parasolid model suitable for use with finite element software.
A second problematic characteristic emanates from obstructions that prevent the laser beam from
Fig. 2 Schematic of time-of-flight TLS system metrology
Fig. 3 Schematic of continuous wave TLS system metrology
A rapid assessment methodology for bridges damaged by truck strikes 227
reaching a structural member of interest, thus resulting in an incomplete point cloud data set, with respect
to the entire bridge. The compact spacing of girders characteristic to highway under- and overpasses often
results in such a situation in which one or more girders, located in the background, with respect to the
orientation of the TLS system, are occluded from view by those in the foreground. Additionally, lateral
bracing as well as any non-structural components (e.g. storm drainage pipes) will also result in an occlusion
of data.
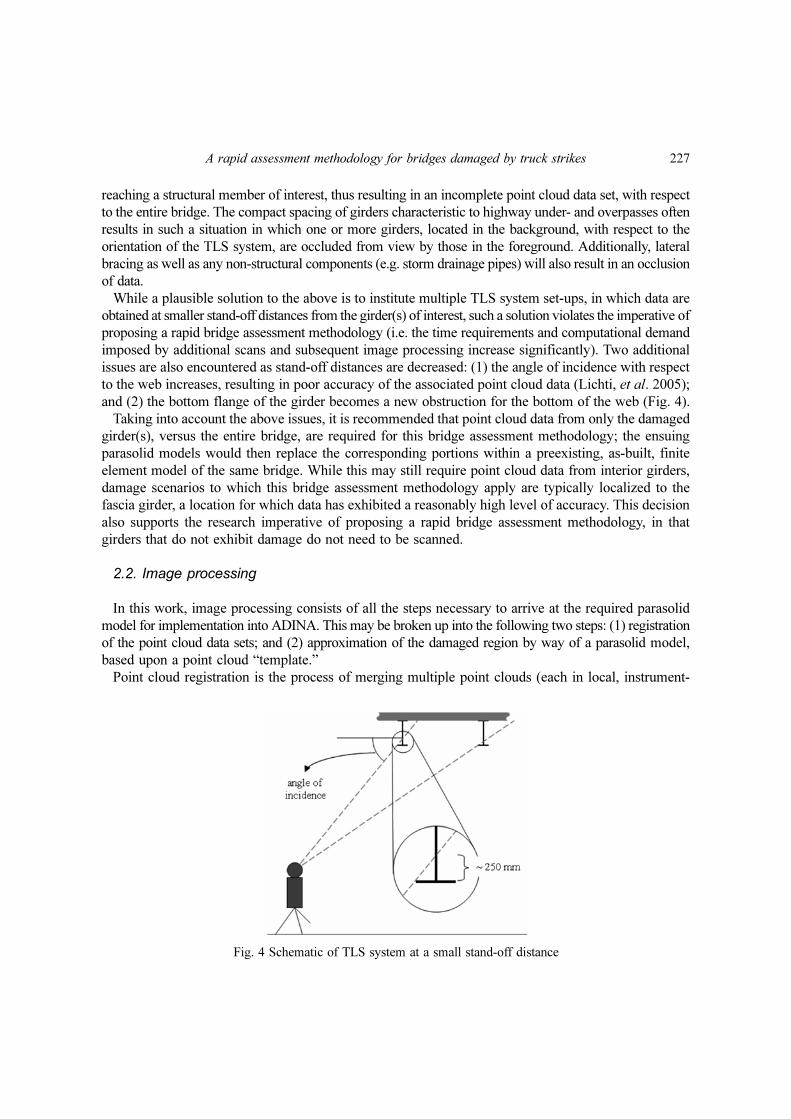
While a plausible solution to the above is to institute multiple TLS system set-ups, in which data are
obtained at smaller stand-off distances from the girder(s) of interest, such a solution violates the imperative of
proposing a rapid bridge assessment methodology (i.e. the time requirements and computational demand
imposed by additional scans and subsequent image processing increase significantly). Two additional
issues are also encountered as stand-off distances are decreased: (1) the angle of incidence with respect
to the web increases, resulting in poor accuracy of the associated point cloud data (Lichti, et al. 2005);
and (2) the bottom flange of the girder becomes a new obstruction for the bottom of the web (Fig. 4).
Taking into account the above issues, it is recommended that point cloud data from only the damaged
girder(s), versus the entire bridge, are required for this bridge assessment methodology; the ensuing
parasolid models would then replace the corresponding portions within a preexisting, as-built, finite
element model of the same bridge. While this may still require point cloud data from interior girders,
damage scenarios to which this bridge assessment methodology apply are typically localized to the
fascia girder, a location for which data has exhibited a reasonably high level of accuracy. This decision
also supports the research imperative of proposing a rapid bridge assessment methodology, in that
girders that do not exhibit damage do not need to be scanned.
2.2. Image processing
In this work, image processing consists of all the steps necessary to arrive at the required parasolid
model for implementation into ADINA. This may be broken up into the following two steps: (1) registration
of the point cloud data sets; and (2) approximation of the damaged region by way of a parasolid model,
based upon a point cloud “template.”
Point cloud registration is the process of merging multiple point clouds (each in local, instrument-
Fig. 4 Schematic of TLS system at a small stand-off distance

228 C.J. Stull and C.J. Earls
centered coordinate systems), emanating from the requisite TLS system set-ups, into a point cloud data
set that represents the entire assembly (within a single, global reference frame). While all point cloud
registration for the present research is achieved by way of the registration tools in Geomagic Studio 9
(Geomagic, Inc. 2006), the basic steps present in most registration algorithms are as follows: (1) choose a
reference point cloud, to which an unregistered point cloud(s) will be registered; (2) detect / match coincident
features of the reference / unregistered point clouds (e.g. bolts); and (3) rotate / translate the unregistered point
cloud(s) to align with the reference point cloud. These steps may be manual and / or automatic (e.g.
Geomagic allows the choice of reference / unregistered point clouds and targets), but fine-tuning of the
resulting point cloud is performed automatically. As an example, consider Fig. 5, in which three point
cloud data sets of a region of a subject bridge are registered; to result in a single point cloud data set of
this region.
Additional functions in Geomagic allow this newly registered point cloud to be “wrapped” by a
surface consisting of triangular polygons. This wrapping function is essentially a best-fit tessellation of
the point cloud representing the surface, and also accounts for the inherent “noise” mentioned previously.
The labeling of this surface as a point cloud “template,” comes from the following: as seen in the upper
left corner of Fig. 6, the cross-section of point cloud data only represents the exterior face of the girder,
and the resulting wrapped surface approximates this exterior face. Furthermore, incomplete point cloud
data results in gaps in the wrapped surface (Fig. 6), and such gaps in surface data may not exist in the
completed parasolid model; these gaps cause failure within the automated routines typically employed
Fig. 5 Example of point cloud data registration of a region of the subject bridge
Fig. 6 Example of “wrapped” surface created in Geomagic

A rapid assessment methodology for bridges damaged by truck strikes 229
by finite element software systems. Therefore, while the wrapped surface may not serve as the
parasolid model, it may serve as a template for construction of this parasolid model.
The parasolid model is then derived from this template using a two-part process: borders of the
constituent cross-sectional plate components are drawn in AutoCAD 2006 (Autodesk, Inc. 2005) and the
shapes that represent these plate components are then filled-in in SolidWorks Office 2007 (SolidWorks
Corporation 2006); an example of the bordering is given in Fig. 7. It is pointed out that this process can
likely be performed entirely within SolidWorks; however, in the interest of expediency AutoCAD is
also employed. It is also pointed out that ADINA permits the importation of solid geometry within the
parasolid format; neither Geomagic nor AutoCAD currently have the capability to output to this file
format, but SolidWorks does.
2.3. Computational mechanics
The purpose of the computational mechanics portion of the bridge assessment methodology is to provide
insight in to the extent to which the complex damaged geometry affects the behavioral characteristics of the
structure, as compared with the undamaged structure. Therefore, only practical considerations for the
modeling of such damaged regions are discussed herein. One obvious concern is with regard to maintaining
geometric continuity at locations where the damaged parasolid model is inserted. As previously discussed,
only a small portion of the structure is being modeled by way of point cloud data; thus, it is crucial that
this damaged section fit within the undamaged finite element model, seamlessly. For the present research,
this continuity is achieved by including a portion of the undamaged section of the fascia girder on each
end of the inserted parasolid model. If the dimensions employed in generating the parasolid model in
SolidWorks are identical to those considered in generating the finite element model in ADINA, there is no
difference in the resulting finite element mesh.
The strength of the described methodology is the ability to relatively quickly map the complex post-event
structural geometry and subsequently construct a nonlinear finite element model for use in “virtual load testing.”
The method outlined in the foregoing does not explicitly account for changes in material response, fracture,
changes in composite action, or the presence of residual stresses. These effects can be considered in the
subsequent finite element models, but such inclusion will necessarily be less objective than the model geometry.
Compared with current techniques, these shortcomings of the present methodology may not be critical.
Fig. 7 Example of boundaries around tessellated surface created in Geomagic

230 C.J. Stull and C.J. Earls
3. Field test results
As a means for demonstrating the application of the previously described techniques, a damaged slab-
on-steel I-girder bridge is considered.
3.1. Description of Subject Bridge
3.1.1. Structural configuration
The subject bridge consists of a three-span continuous steel I-girder super-structure with a 30o longitudinally
configured skew angle oriented from northwest to southeast (Fig. 8); it is noted that interior piers are
parallel to this skew angle as well. The primary components of the super-structure are W610 × 113 steel
I-girders, with top flanges imbedded in a 190 mm concrete deck. As a result of this embedment, it is
assumed that the steel girders and deck enjoy full composite action. The lengths of the three spans are
8230 mm, 15240 mm, and 8230 mm, respectively (these are designated as Span 1, Span 2, and Span 3,
respectively).
Transverse diaphragms consist of two typical sections: W410 × 53 and C380 × 50.4. The locations of these
members are depicted in Fig. 8. Other important structural features include the presence of three sets of
top and bottom flange cover plates, located on each longitudinal steel girder; the thicknesses of all cover
plates are 17 mm. One set, indicated by the bold lines in Fig. 8, consists of 7925 mm cover plates, positioned
over the longitudinal centerline of the bridge. Each of the other two sets, indicated by the dashed lines
in Fig. 8, consist of 6095 mm cover plates, located at a 1525 mm outward offset from each pier (away
from the center of the bridge). Finally, each of the six girders also has two splice locations that are offset
Fig. 8 Structural steel framing plan for subject bridge

A rapid assessment methodology for bridges damaged by truck strikes 231
2285 mm inward from each pier (toward the center of the bridge); these are indicated by black circles in
Fig. 8.
Bearing conditions consist of genuine pinned connections at the west end of the bridge, (Abutment 1)
and rocker-type bearings at each of the two piers and the east end abutment (Pier 1, Pier 2, and Abutment
2, respectively). Typical concrete abutment details, as well as hammerhead-style concrete piers, describe
the exposed components of the sub-structure. As it is the steel super-structure that constitutes the primary
focus of the research discussed herein, these components from the sub-structure are of little significance,
and thus will not be discussed further. The design drawings provided for the subject bridge are dated in
the late 1950’s, which subsequently motivates the following material specifications. ASTM A7 steel (minimum
yield strength of 206.9 MPa) is specified for all structural steel, and the deck concrete is specified by the
drawings to have a minimum design compressive strength of 20.7 MPa.
3.1.2. Damage
The most extreme damage to the subject bridge is located approximately 6 m east of Pier 1 (Fig. 8),
on the fascia girder, referred to from this point forward as Girder 1. Due to the nature of the impact(s)
from over-height vehicles traveling southbound, the bottom flange of the Girder 1 is deformed toward
the interior of the structure; a sample of point cloud data from the damage section is provided in Fig. 9.
Furthermore, the westernmost lateral bracing within Span 2 of Girder 1 provided some resistance at the
time of the impact(s), thus resulting in the formation of a bulge (Fig. 6).
While point cloud data of the damaged region of the bridge are accurate, with respect to the shape of
the actual damage, the authors shifted this damaged region to coincide more closely with the midspan
of Span 2 of Girder 1. This is done in order to facilitate model construction, in that this shift eliminated
interference with transverse diaphragm connections thereby reducing the associated time requirements; such
a shift would not typically be employed in the actual application of this bridge assessment methodology.
3.2. Description of finite element model
The longitudinal steel girders are composed of MITC4 shell finite elements defined along the mid-
Fig. 9 Example of point cloud from damaged region of subject bridge

232 C.J. Stull and C.J. Earls
plane of each of the constituent cross-sectional plate components. The MITC (“mixed interpolation of
tensorial components”) formulation employs a mixed interpolation to account for transverse shear strains
in such a way as to eliminate the shear-locking phenomenon present in thin, displacement-based shell
element formulations (Bathe 1996). Transverse members are composed of 2-node Hermitian beam elements
(Przemienieck 1968). These members are rigidly attached to MITC4 shell finite element connector
plates, which are subsequently connected to the webs of the longitudinal members. The rigid attachment is
achieved by way of rigid links, which impose a constraint on the applicable degrees of freedom of a “slave”
node, such that this node behaves in a kinematically appropriate manner in relation to the displacements of
a “master” node. The material models employed for steel cross-sections within this finite element model
are as follows: (1) multi-linear inelastic, with properties coinciding with ASTM A7 steel, for all MITC4
shell finite elements; and (2) linear-elastic for all transverse members.
The concrete deck model also employs MITC4 shell finite elements that are offset from the longitudinal
steel girders 95 mm (one-half of the concrete deck depth) and connected by way of the node-to-node
rigid links. This offset, as imposed by the rigid links, sets these elements in the correct vertical position
(i.e. section properties of the composite section are preserved). A multi-linear inelastic material model
with an ultimate stress of 20.7 MPa and ultimate strain of 0.003, is employed for the concrete deck,
with the addition of a “crack” at the interior pier lines (i.e. element connectivity is eliminated along the
line coincident with interior piers). The material model is intended to limit the concrete compressive
capacity while the “crack” is intended to account for cracking of the concrete deck in negative moment regions.
3.3. Results and discussion
In order to assess the effect of damage on the post-event structure, its response is compared with the
baseline case of the undamaged structure. For this portion of the present research, two load configurations
are chosen: a uniform deck pressure over the end span, and a uniform deck pressure over each of the
three spans (depicted in Figs. 10a and 10b, respectively). The end span load configuration is employed
to develop compression in the bottom flange of the fascia girder. This, in turn, may contribute to a state
of lateral instability, which is then exacerbated by the damage (acting as an initial imperfection). The
three-span load configuration is employed to develop tension in the bottom flange of the fascia girder,
while also engaging the entire structure. While it is expected that this tension will “stretch out” the
damaged region, the impact of the damage in the earlier stages of loading is also of interest.
The parameter, λ, depicted in Figs. 10a and 10b is termed the “load-proportionality factor” and acts as
a scalar multiplier of a reference pressure, p. This parameter, together with various displacement measures, is
used as a means for comparison of the response of the damaged subject bridge to its undamaged
Fig. 10 (a) End span; and (b) Three span uniform deck pressure load configurations
A rapid assessment methodology for bridges damaged by truck strikes 233
counterpart. Justification for this follows from the verification study of the finite element modeling
technique employed for the bridge in its undamaged configuration, as conducted by Stull (2006).
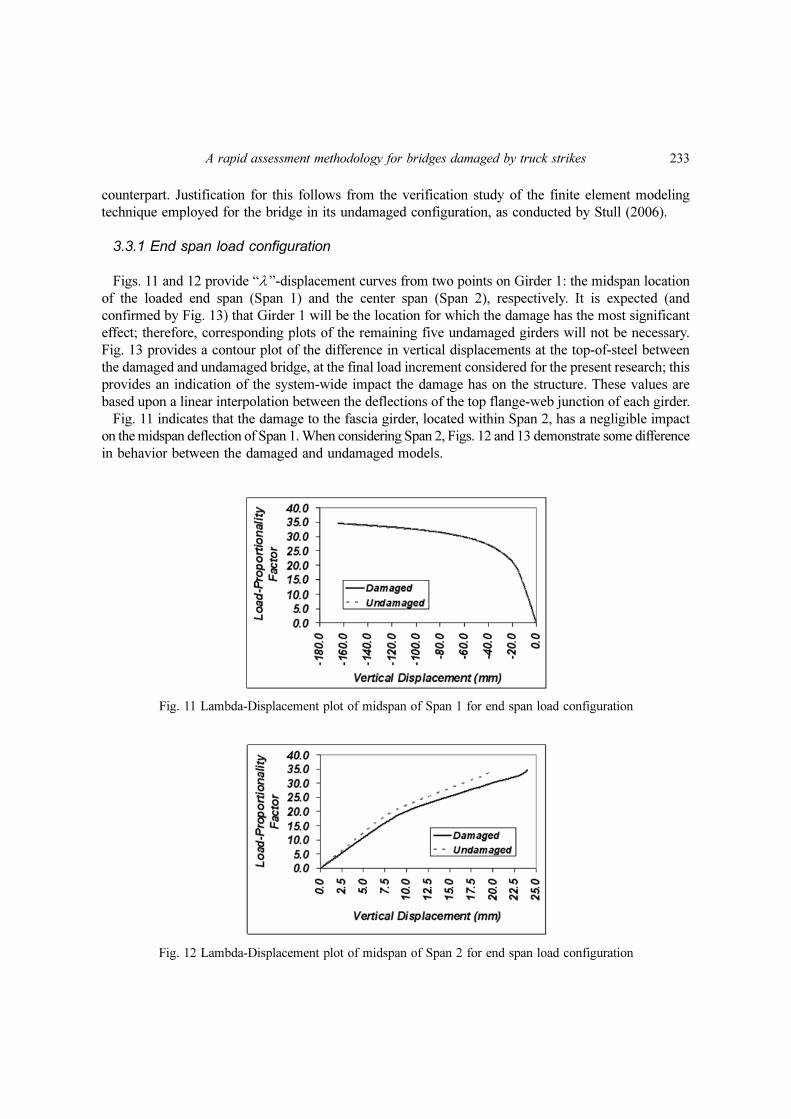
3.3.1 End span load configuration
Figs. 11 and 12 provide “λ ”-displacement curves from two points on Girder 1: the midspan location
of the loaded end span (Span 1) and the center span (Span 2), respectively. It is expected (and
confirmed by Fig. 13) that Girder 1 will be the location for which the damage has the most significant
effect; therefore, corresponding plots of the remaining five undamaged girders will not be necessary.
Fig. 13 provides a contour plot of the difference in vertical displacements at the top-of-steel between
the damaged and undamaged bridge, at the final load increment considered for the present research; this
provides an indication of the system-wide impact the damage has on the structure. These values are
based upon a linear interpolation between the deflections of the top flange-web junction of each girder.
Fig. 11 indicates that the damage to the fascia girder, located within Span 2, has a negligible impact
on the midspan deflection of Span 1. When considering Span 2, Figs. 12 and 13 demonstrate some difference
in behavior between the damaged and undamaged models.
Fig. 11 Lambda-Displacement plot of midspan of Span 1 for end span load configuration
Fig. 12 Lambda-Displacement plot of midspan of Span 2 for end span load configuration

234 C.J. Stull and C.J. Earls
3.3.2. Three span load configuration
Plots corresponding to those provided for the end span load configuration are also provided for the
three-span load configuration (see Fig. 10b). At the initial stages of loading, there is a significant
difference between the behaviors exhibited by the damaged and undamaged models, which becomes
most extreme at the transition between the two “linear” portions of the plots. As loading progresses, the
differences between the two models diminish to the point where the behaviors coincide. This results
from the fact that the load configuration places the damaged region in tension, which in turn “stretches
out” the damage to a point where its effect is negligible (Fig. 17).
Fig. 13 Percent difference in top-of-steel deformation between damaged and undamaged models for end spanload configuration
Fig. 14 Lambda-Displacement plot of midspan of Span 1 for three span load configuration

A rapid assessment methodology for bridges damaged by truck strikes 235
Fig. 15 Lambda-Displacement plot of midspan of Span 2 for three span load configuration
Fig. 16 Percent difference in top-of-steel deformation between damaged and undamaged models for three spanload configuration
Fig. 17 Initial and final deformed configurations of the web for three-span load configuration (not to scale)

236 C.J. Stull and C.J. Earls
4. Conclusions
The results from a research program, aimed at the development of a rapid assessment methodology
for bridge structures damaged by truck strikes, have been presented. This research was motivated by the
fact that the analysis procedures used in current practice often provide results that may be somewhat
subjective. As a result, analyses regarding reserve capacity in damaged bridges may vary significantly
between engineering offices.
The approach discussed herein provides a robust and useful technique for assessing both the response
characteristics of a damaged structure, as well as its associated reserve capacity. Currently, this technique
is not able to be implemented in a truly automated fashion; significant expertise on the part of the analyst
is required. While the challenges imposed by the issues discussed in Part II are significantly lessened by
parsing out the damaged region of the bridge, many of these challenges will still present themselves
within application contexts. This research program seems to show promise as means for rapidly assessing
damaged bridge structures. However, it has been shown herein that a considerable effort on the part of
knowledgeable engineers, possessing background in surveying, laser scanning, image processing, and
computational mechanics, is required.
5. Acknowledgement
The Commonwealth of Pennsylvania Department of Transportation is acknowledged for partial support
of this work. The views and opinions expressed here are solely those of the authors.
References
ADINA Research and Development, Inc. (2007), ADINA Version 8.4.1, 71 Elton Avenue, Watertown, Massachusetts02472, <http://www.adina.com/>.
American Institute of Steel Construction (AISC) (2001), Manual of Steel Construction: Load and Resistance FactorDesign, AISC, Chicago, Illinois.
Autodesk, Inc. (2005), AutoCAD 2006, 111 McInnis Parkway, San Rafael, California 94903, <http://www.autodesk.com/>.
Bathe, K.J. (1996), “Formulation and Calculation of Isoparametric Finite Element Matrices”, Finite ElementProcedures, Prentice Hall, Englewood Cliffs, New Jersey, 420-49.
El-Tawil, S., Severino, E. and Fonseca, P. (2005), “Vehicle Collision with Bridge Piers”, J. Bridge Eng., 10(3),345-53.
Federal Highway Administration (FHWA) (2006), “Count of Bridges by Structure Type”, <http://www.fhwa.dot.gov/bridge/strtyp06.htm> (Nov. 27, 2007).
Fu, C.C., Burhouse, J.R. and Chang, G.L. (2004), “Overheight Vehicle Collisions with Highway Bridges”, J. Trans.Research Board, No. 1865, 80-8.
Fuchs, P.A., Washer, G.A., Chase, S.B. and Moore, M. (2004a), “Applications of Laser-Based Instrumentation forHighway Bridges”, J. Bridge Eng., 9(6), 541-49.
Fuchs, P.A., Washer, G.A., Chase, S.B. and Moore, M. (2004b), “Laser-Based Instrumentation for Bridge LoadTesting”, J. Perform. Constr. Fac., 18(4), 213-19.
Geomagic, Inc. (2006), Geomagic Studio 9 (SR 2), 3200 East Highway 54, Cape Fear Building, Suite 300, ResearchTriangle Park, North Carolina 27709, <http://www.geomagic.com/>.
Goedert, J., Bonsell, J. and Samura, F. (2005), “Integrating Laser Scanning and Rapid Prototyping to EnhanceConstruction Modeling”, J. Arch. Eng., 11(2), 71-4.

A rapid assessment methodology for bridges damaged by truck strikes 237
Lichti, D.D., Gordon, S.J. and Tipdecho, T. (2005), “Error Models and Propagation in Directly GeoreferencedTerrestrial Laser Scanner Networks”, J. Surv. Eng., 131(4), 135-42.
Przemieniecki, J.S. (1968), “Stiffness Properties of Structural Elements”, Theory of Matrix Structural Analysis,McGraw-Hill Book Company, New York, 70-82.
SolidWorks Corporation (2006), SolidWorks Office 2007 (SP1.1), 300 Baker Avenue, Concord, Massachusetts 01742,<http://www.solidworks.com>.
Stull, C.J. (2006), “On the Comparison of Computational Methods for Analyzing Longitudinally Skewed Steel I-Girder Bridges”, M.S. thesis, University of Pittsburgh, Pittsburgh, Pennsylvania.
Su, Y.Y., Oliverira Filho, J.N., Liu, L.Y. and Hashash, Y.M.A. (2005), “Integration of Construction Field Dataand Geotechnical Analyses”, Proc. of the 2005 Construction Research Congress, Reston, Virginia, April.
Zitova, B. and Flusser, J. (2003), “Image Registration Methods: A Survey”, Image Vision Comput., 21(11), 977-1000.
CC