
A Randomized Controlled Trial of Emergency Department Dental … Randomized... · A Randomized...
33
A Randomized Controlled Trial of Emergency Department Dental Care Vouchers to Improve Care and Reduce Return Visits Bjorn C. Westgard, Kory L. Kaye, Jeff P. Anderson, Abigail Zagar, Sandi Wewerka
Transcript of A Randomized Controlled Trial of Emergency Department Dental … Randomized... · A Randomized...

A Randomized Controlled Trial of Emergency Department Dental Care Vouchers
to Improve Care and Reduce Return Visits Bjorn C. Westgard, Kory L. Kaye, Jeff P. Anderson, Abigail Zagar, Sandi Wewerka

Emergency Department Visits for Non-Traumatic Dental Conditions (NTDC)
Common and increasing
Costly and poorly reimbursed
Palliative and not definitive
Driven by modifiable factors
Can be systematically reduced

Trends in Dental Emergency Department Visits per 1,000 Population, by Patient Age, 2006 to 2012

Percentage of Emergency Department Visits by Primary Payer, 2012

Prior Research
2011, 1697 NTDC visits, 970 (57%) Medicaid2-week pilot of vouchers
Patients with NTDC and Medicaid or no coverage18 patients received, 10 redeemed, 2 returned
Avg voucher care cost = $318, avg ED care = $1010
2-week query of NTDC returns60 patients, 9 returned in 60 days for NTDC

Aim 1
To determine if distributing a voucher for free, prompt dental care decreases return rates to the emergency department after 30 and 90 days for patients without dental insurance or those covered by Medicaid dental insurance that have a visit for a non-traumatic dental condition.
EMERGENCY
Dental ClinicDental Clinic

Aim 2
To determine if there is any reasonable ability for the treating MD to predict which patients will follow up with a dentist by utilizing their vouchers.

Aim 3
To compare treatment costs for visits for non-traumatic dental conditions between Regions Hospital’s Emergency Department and HealthPartners Dental Clinics.
$
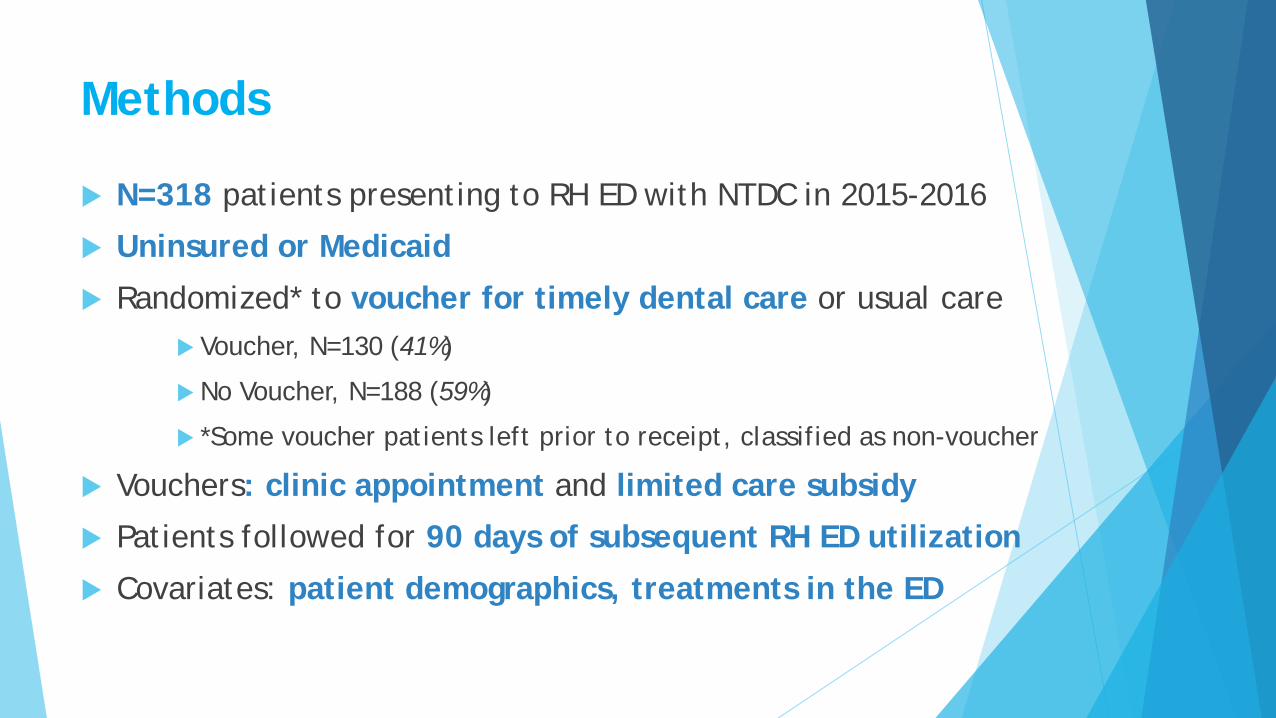
Methods
N=318 patients presenting to RH ED with NTDC in 2015-2016
Uninsured or Medicaid
Randomized* to voucher for timely dental care or usual care Voucher, N=130 (41%)
No Voucher, N=188 (59%)
*Some voucher patients left prior to receipt, classified as non-voucher
Vouchers: clinic appointment and limited care subsidy
Patients followed for 90 days of subsequent RH ED utilization
Covariates: patient demographics, treatments in the ED

TABLE 1. Patient Characteristics at Baseline, Overall & by Voucher AssignmentALL (N=318) NO VOUCHER (N=188) VOUCHER ISSUED (N=130)
VARIABLE N PCT2 N PCT3 N PCT3 P-VALUEAgeMean ± SD 32.0 ± 9.6 32.1 ± 9.9 31.9 ± 9.3 0.957Min | Med | Max 18 | 30 | 67 18 | 30 | 67 18 | 30 | 60
18-29 149 46.9% 88 59.1% 61 40.9% 0.83030-44 129 40.6% 78 60.5% 51 39.5%45-67 40 12.6% 22 55.0% 18 45.0%
GenderFemale 132 41.5% 82 62.1% 50 37.9% 0.418Male 186 58.5% 106 57.0% 80 43.0%
RaceAfrican-American 164 51.6% 94 57.3% 70 42.7% 0.450Asian 4 1.3% 3 75.0% 1 25.0%Caucasian 118 37.1% 71 60.2% 47 39.8%Native American 17 5.4% 13 76.5% 4 23.5%Other/Unknown 15 4.7% 7 46.7% 8 53.3%
EthnicityNon-Hispanic 295 92.8% 177 60.0% 118 40.0% 0.276Hispanic 23 7.2% 11 47.8% 12 52.2%
Insurance StatusMedicaid 88 27.7% 51 58.0% 37 42.1% 0.800Uninsured 230 72.3% 137 59.6% 93 40.4%

Voucher Redemption and Returns
Voucher Redemption Not used = 64, Used = 64, Missing = 2
ED Returns (range 0-7) No return = 269 (85%), ≥1 return = 49
No associations between voucher assignment/redemption or ED returns and:
Age, Gender, Race, Ethnicity, Insurance
Administration of Antibiotics, Dental Block, Narcotics (In Dept or Prescription)
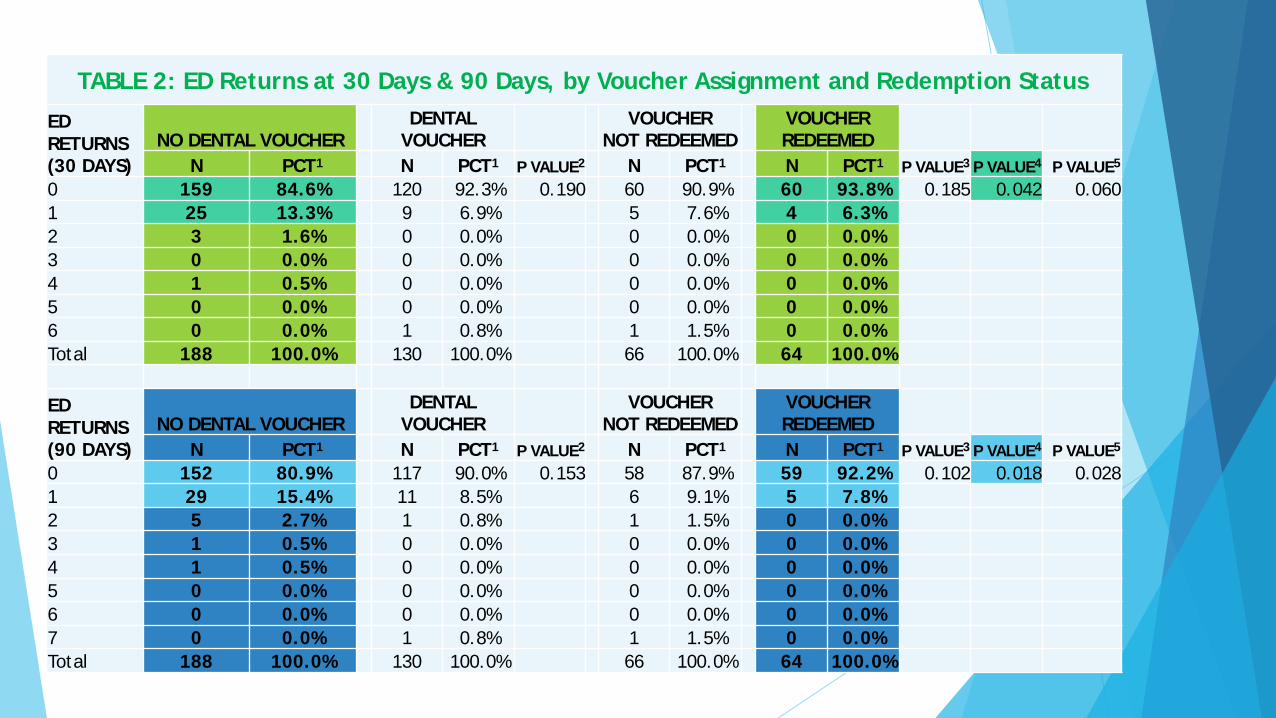
TABLE 2: ED Returns at 30 Days & 90 Days, by Voucher Assignment and Redemption Status
ED RETURNS (30 DAYS)
NO DENTAL VOUCHERDENTAL
VOUCHERVOUCHER
NOT REDEEMEDVOUCHER REDEEMED
N PCT1 N PCT1 P VALUE2 N PCT1 N PCT1 P VALUE3 P VALUE4 P VALUE5
0 159 84.6% 120 92.3% 0.190 60 90.9% 60 93.8% 0.185 0.042 0.0601 25 13.3% 9 6.9% 5 7.6% 4 6.3%2 3 1.6% 0 0.0% 0 0.0% 0 0.0%3 0 0.0% 0 0.0% 0 0.0% 0 0.0%4 1 0.5% 0 0.0% 0 0.0% 0 0.0%5 0 0.0% 0 0.0% 0 0.0% 0 0.0%6 0 0.0% 1 0.8% 1 1.5% 0 0.0%Total 188 100.0% 130 100.0% 66 100.0% 64 100.0%
ED RETURNS (90 DAYS)
NO DENTAL VOUCHERDENTAL
VOUCHERVOUCHER
NOT REDEEMEDVOUCHER REDEEMED
N PCT1 N PCT1 P VALUE2 N PCT1 N PCT1 P VALUE3 P VALUE4 P VALUE5
0 152 80.9% 117 90.0% 0.153 58 87.9% 59 92.2% 0.102 0.018 0.0281 29 15.4% 11 8.5% 6 9.1% 5 7.8%2 5 2.7% 1 0.8% 1 1.5% 0 0.0%3 1 0.5% 0 0.0% 0 0.0% 0 0.0%4 1 0.5% 0 0.0% 0 0.0% 0 0.0%5 0 0.0% 0 0.0% 0 0.0% 0 0.0%6 0 0.0% 0 0.0% 0 0.0% 0 0.0%7 0 0.0% 1 0.8% 1 1.5% 0 0.0%Total 188 100.0% 130 100.0% 66 100.0% 64 100.0%

TABLE 2. ED Returns at 30 Days & 90 Days, by Voucher Assignment and Redemption Status
ED RETURNS (30 DAYS)
NO DENTAL VOUCHERDENTAL
VOUCHERVOUCHER
NOT REDEEMEDVOUCHER REDEEMED
N PCT1 N PCT1 P VALUE2 N PCT1 N PCT1 P VALUE3 P VALUE4 P VALUE5
0 159 84.6% 120 92.3% 0.190 60 90.9% 60 93.8% 0.185 0.042 0.0601 25 13.3% 9 6.9% 5 7.6% 4 6.3%2 3 1.6% 0 0.0% 0 0.0% 0 0.0%3 0 0.0% 0 0.0% 0 0.0% 0 0.0%4 1 0.5% 0 0.0% 0 0.0% 0 0.0%5 0 0.0% 0 0.0% 0 0.0% 0 0.0%6 0 0.0% 1 0.8% 1 1.5% 0 0.0%Total 188 100.0% 130 100.0% 66 100.0% 64 100.0%
ED RETURNS (90 DAYS)
NO DENTAL VOUCHERDENTAL
VOUCHERVOUCHER
NOT REDEEMEDVOUCHER REDEEMED
N PCT1 N PCT1 P VALUE2 N PCT1 N PCT1 P VALUE3 P VALUE4 P VALUE5
0 152 80.9% 117 90.0% 0.153 58 87.9% 59 92.2% 0.102 0.018 0.0281 29 15.4% 11 8.5% 6 9.1% 5 7.8%2 5 2.7% 1 0.8% 1 1.5% 0 0.0%3 1 0.5% 0 0.0% 0 0.0% 0 0.0%4 1 0.5% 0 0.0% 0 0.0% 0 0.0%5 0 0.0% 0 0.0% 0 0.0% 0 0.0%6 0 0.0% 0 0.0% 0 0.0% 0 0.0%7 0 0.0% 1 0.8% 1 1.5% 0 0.0%Total 188 100.0% 130 100.0% 66 100.0% 64 100.0%
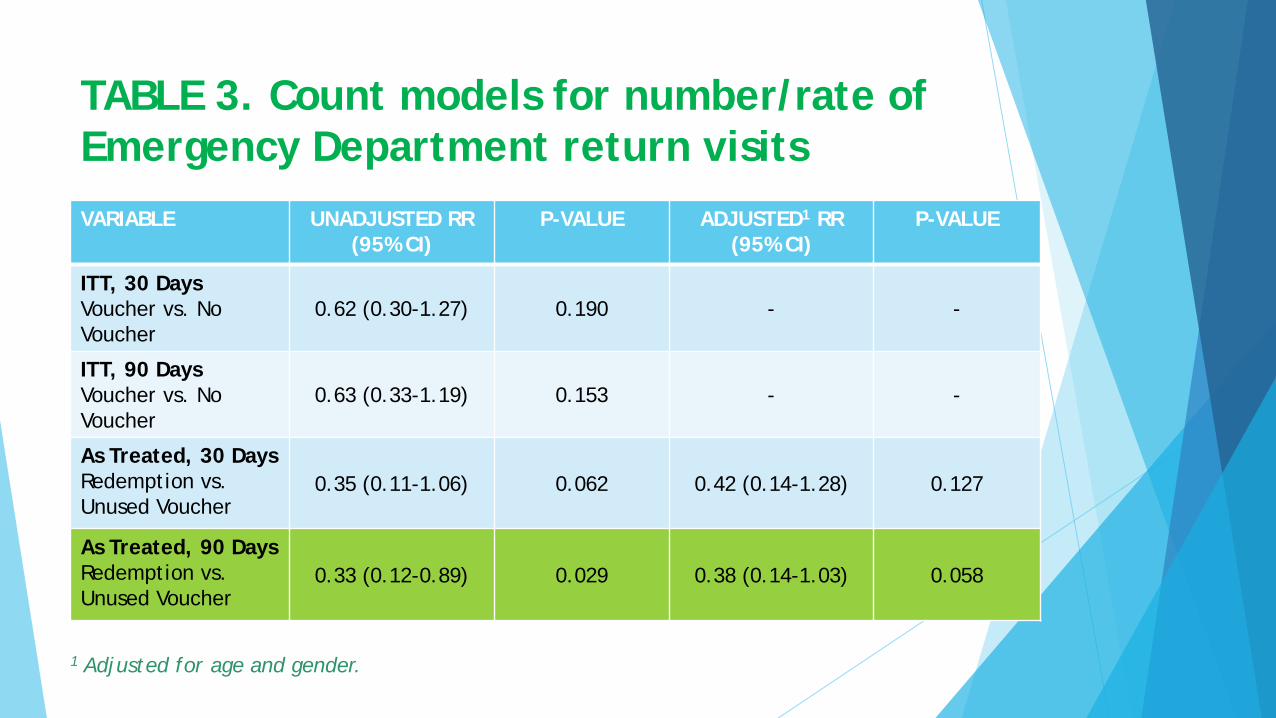
TABLE 3. Count models for number/rate of Emergency Department return visitsVARIABLE UNADJUSTED RR
(95% CI)P-VALUE ADJUSTED1 RR
(95% CI)P-VALUE
ITT, 30 DaysVoucher vs. No Voucher
0.62 (0.30-1.27) 0.190 - -
ITT, 90 DaysVoucher vs. No Voucher
0.63 (0.33-1.19) 0.153 - -
As Treated, 30 DaysRedemption vs. Unused Voucher
0.35 (0.11-1.06) 0.062 0.42 (0.14-1.28) 0.127
As Treated, 90 DaysRedemption vs.Unused Voucher
0.33 (0.12-0.89) 0.029 0.38 (0.14-1.03) 0.058
1 Adjusted for age and gender.

TABLE 4. Logistic Regression Models for Likelihood of ED Return at 30/90 Days by Voucher Assignment/Redemption Status
≥1 ED RETURN UNADJUSTED ADJUSTED1
VARIABLE N N % OR 95% CI P-VALUE OR 95% CI P-VALUETotal 318 49 15.4% - - - - - -
Intent to Treat, 30 DaysNo Voucher 188 29 15.4%
Voucher 130 10 7.7% 0.46 0.21-0.97 0.043 - - -
Intent to Treat, 90 DaysNo Voucher 188 36 19.1%
Voucher 130 13 10.0% 0.47 0.24-0.92 0.029 - - -
As Treated, 30 DaysNo Dental Clinic 254 35 13.8%Dental Voucher Redemption 64 4 6.3% 0.42 0.14-1.22 0.110 0.45 0.15-1.32 0.145
As Treated, 90 DaysNo Dental Clinic 254 44 17.3%Dental Voucher Redemption 64 5 7.8% 0.40 0.15-1.07 0.067 0.43 0.16-1.13 0.086

Time to ED Return Visit by Dental Voucher Status

Time to ED Return Visit by Dental Voucher Assignment
Time to ED Return Visit by Dental Voucher Redemption

TABLE 5. Cox models for Time to First Emergency Department return visitVARIABLE UNADJUSTED RR
(95% CI)P-VALUE ADJUSTED1 RR
(95% CI)P-VALUE
ITT, 30 DaysVoucher vs. No Voucher 0.48 (0.23, 0.98) 0.044 - -
ITT, 90 DaysVoucher vs. No Voucher 0.50 (0.26, 0.93) 0.030 - -
As Treated, 30 DaysRedemption vs. No (Used) Voucher
0.43 (0.15, 1.22) 0.114 0.46 (0.16, 1.29) 0.138
As Treated, 90 DaysRedemption vs.No (Used) Voucher
0.43 (0.17, 1.08) 0.071 0.44 (0.17, 1.11) 0.082
1 Adjusted for age and gender.
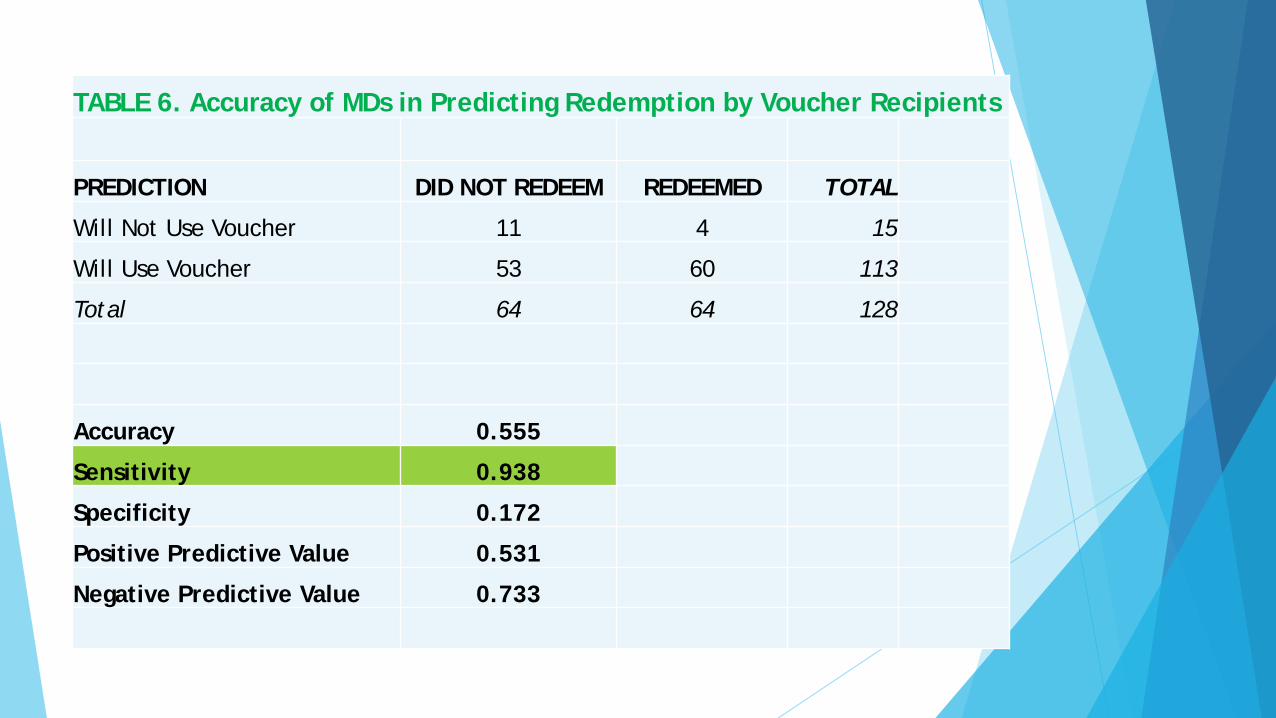
TABLE 6. Accuracy of MDs in Predicting Redemption by Voucher Recipients
PREDICTION DID NOT REDEEM REDEEMED TOTAL
Will Not Use Voucher 11 4 15
Will Use Voucher 53 60 113
Total 64 64 128
Accuracy 0.555
Sensitivity 0.938
Specificity 0.172
Positive Predictive Value 0.531
Negative Predictive Value 0.733

TABLE 6. Accuracy of MDs in Predicting Redemption by Voucher Recipients
PREDICTION DID NOT REDEEM REDEEMED TOTAL
Will Not Use Voucher 11 4 15
Will Use Voucher 53 60 113
Total 64 64 128
Accuracy 0.555
Sensitivity 0.938
Specificity 0.172
Positive Predictive Value 0.531
Negative Predictive Value 0.733

Costs by voucher assignment:Total Charges

Costs by voucher assignment:Net Margin
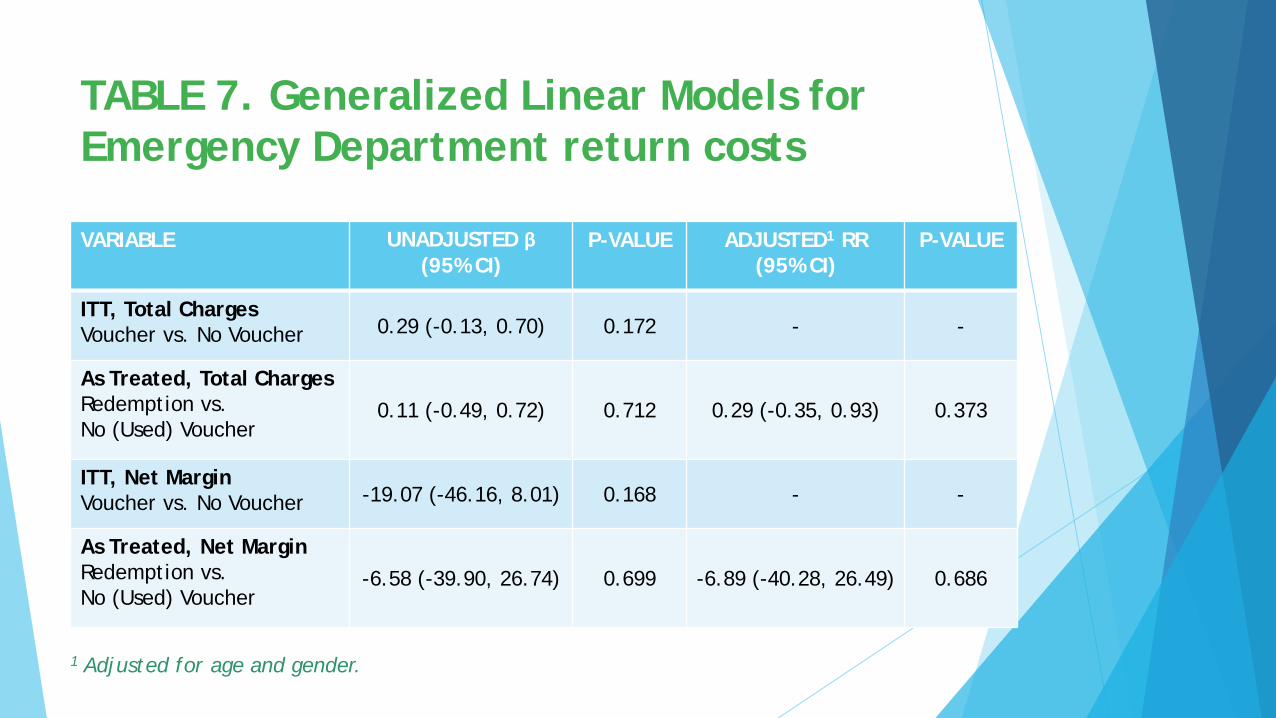
TABLE 7. Generalized Linear Models for Emergency Department return costs
VARIABLE UNADJUSTED β(95% CI)
P-VALUE ADJUSTED1 RR(95% CI)
P-VALUE
ITT, Total ChargesVoucher vs. No Voucher 0.29 (-0.13, 0.70) 0.172 - -
As Treated, Total ChargesRedemption vs.No (Used) Voucher
0.11 (-0.49, 0.72) 0.712 0.29 (-0.35, 0.93) 0.373
ITT, Net MarginVoucher vs. No Voucher -19.07 (-46.16, 8.01) 0.168 - -
As Treated, Net MarginRedemption vs.No (Used) Voucher
-6.58 (-39.90, 26.74) 0.699 -6.89 (-40.28, 26.49) 0.686
1 Adjusted for age and gender.

Aim 1: Evaluating Impact of Dental Vouchers on Return Visits
Voucher Receipt (ITT)
Significantly lower proportion of patients returning to the ED and longer time to first ED return.
Voucher Use (As Treated)
Significantly lower number of ED returns, relative to patients who did not receive or did not use a voucher.

Aim 2: Accuracy and Predictive Value of MD Predictions
Sensitivity was very good
Negative Predictive Value was fair
Accuracy, Specificity, and Positive Predictive Value were poor

Aim 3: Costs Incurred by Voucher Assignment and Redemption
No significant differences in total charge or net margin by voucher assignment (ITT) or voucher redemption (as treated)
Dental clinic costs (voucher redemption) slightly higher average and much lower max than ED total costs

Limitations
Limited by extent of voucher funds to assist dental payment
Vouchers completed payment for dental visitsCost and margin data require more analysis

Conclusions
Vouchers for prompt dental care can provide access to definitive care for NTDC and reduce ED return visits without changing ED margins
Similar programs have been instituted elsewhereSuch efforts show promise for improving care
and cost as part of multifaceted interventionsCost-effectiveness needs further explorationProviders are poor predictors of voucher
patient follow-up with dentistry

References Wall T, Nasseh K, Vujicic M. Financial barriers to dental care
declining after a decade of steady increase. Health Policy Institute Research Brief. American Dental Association. October 2013.
Healthcare Cost and Utilization Project. 2012 Nationwide Emergency Department Sample. Agency for Healthcare Research and Quality, Rockville, MD.
Lewis C, Lynch H, Johnston B. Dental Complaints in emergency departments: a national perspective. Ann Emerg Med. 2003;42(1):93-99.
McCormick at al. Reducing the burden of dental patients on the busy hospital emergency department. J Oral Maxillofac Surg. 2013; 71:475-78.
Lee HH, Lewis CW, Saltzman B, Starks H. Visiting the emergency department for dental problems: trends in utilization, 2001 to 2008. Am J Public Health. 2012;102(11):e77-83.
McCormick AP, Abubaker AO, Laskin DM, Gonzales MS, Garland S. Reducing the burden of dental patients on the busy hospital emergency department. J Oral Maxillofac Surg. 2013;71(3):475-78.
Washington State Health Care Authority. Emergency Department Utilization: Update on Assumed Savings from Best Practices Implementation. 2014.
Singhal A, Caplan DJ, Jones MP, Momany ET, Kuthy RA, BureshCT, Isman R, Damiano PC. Eliminating Medicaid adult dental coverage in California led to increased dental emergency visits and associated costs. Health Affairs. 2015 May 1;34(5):749-756.
Skinner H (Truven Health Analytics), Blanchard J (RAND), Elixhauser A (AHRQ). Trends in Emergency Department Visits, 2006-2011. HCUP Statistical Brief #179. September 2014. Agency for Healthcare Research and Quality, Rockville, MD.
Tang, N., Stein, J., Hsia, R., Maselli, J., & Gonzales, R. (2010, August 11). Trends and Characteristics of US Emergency Department Visits, 1997-2007.
Davis EE, Deinard AS, Maiga EWH. Doctor, my tooth hurts: the costs of incomplete dental care in the emergency room. Journal of Public Health Dentistry 2010; 70: 205-210.
Okunseri C, Pajewski NM, Jackson S, Szabo A. Wisconsin Medicaid enrollees’ recurrent use of emergency departments and physicians’ offices for treatment of nontraumatic dental conditions. The Journal of the American Dental Association 2011; 142(5): 540-550.
Quinonez C. Self-reported emergency room visits for dental problems. International Journal of Dental Hygiene 2011; 9: 17-20.
Okunseri C, Okunseri E, Thorpe JM, Xiang Q, Szabo A. Patient characteristics and trends in nontraumatic dental condition visits to emergency departments in the United States. Clinical, Cosmetic and Investigational Dentistry 2012; 4: 1-7.
Ramraj CC, Quiononez CR. Emergency room visits for dental problems among working poor Canadians. Journal of Public Health Dentistry 2013; 73: 210-216.
Cohen LA, Manski RJ, Hooper FJ. Does the elimination of Medicaid reimbursement affect the frequency of emergency department dental visits? 1996; 127: 605-609.

THANKS

90-Day Emergency Department Returns by Voucher Assignment and Redemption

30-Day Emergency Department Returns by Voucher Assignment and Redemption

DENTAL CLINIC COSTS AMONG VOUCHER REDEEMERS
VARIABLE N NMISS MEAN SD MIN MEDIAN QRANGE MAX
Dental Clinic Cost 63 0 396.08 238.37 102 298 345 988
ED Return Charges3
Overall 312 4 239.37 839.42 0.00 0.00 0.00 7983.35
No Voucher 183 4 251.94 741.61 0.00 0.00 0.00 6346.30
Voucher 129 0 221.54 964.09 0.00 0.00 0.00 7983.35
Voucher Not Received/Used 249 4 259.55 847.98 0.00 0.00 0.00 7983.35
Voucher Redeemed 63 0 159.60 806.30 0.00 0.00 0.00 6121.60


![ars.els-cdn.com€¦ · Web view# 8 randomized controlled trial[Publication Type] OR controlled clinical trial[Publication Type] OR clinical trial[Publication Type] OR randomized](https://static.fdocuments.in/doc/165x107/5f801e6decc6443b005dfd1c/arsels-cdncom-web-view-8-randomized-controlled-trialpublication-type-or-controlled.jpg)


